
Sample Category Title
GBP/USD Rises as UK Inflation Higher than Expected
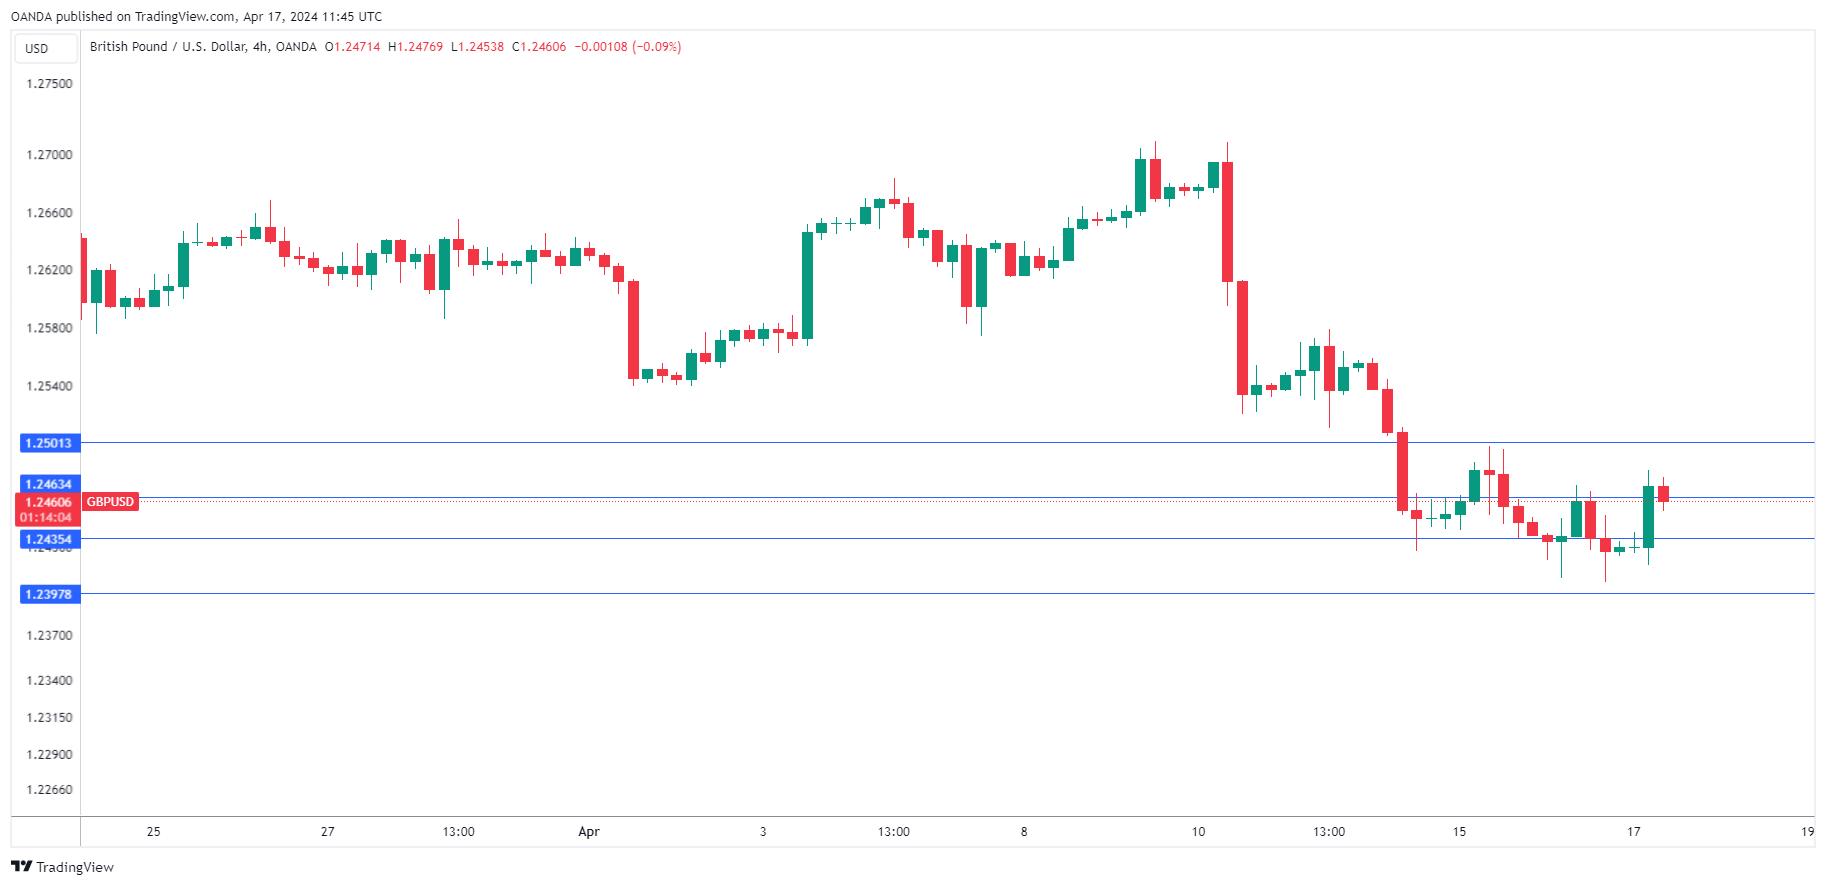
The British pound has rebounded after sliding 2.1% over the past week. In the European session, GBP/USD is trading at 1.2461, up 0.28%.
UK inflation drops to 3.2%
Inflation in the UK continues to decline but the March release was not as strong as expected. Inflation eased to 3.2% y/y, down from 3.4% in February but higher than the market estimate of 3.1%. The inflation rate fell to its lowest since September 2021 as inflation eased for food, restaurant and hotels. Monthly, inflation was unchanged at 0.6%, above the forecast of 0.5%.
It was a similar story for the core rate, which dropped from 4.5% to 4.2%, above the market estimate of 4.1%. Monthly, core CPI was unchanged at 0.6%, above the forecast of 0.3%.
The British pound has bounced higher as the stronger-than-expected CPI report could delay plans to lower interest rates. The markets responded by paring the chances of a rate cut in June and have fully priced only 25 basis points in cuts before the end of the year.
The Bank of England’s steep rate tightening has pushed inflation down from double digits, but the final stretch of bringing inflation down to the 2% target could be the hardest part of the battle. Core inflation has proven to be sticky and is more than double the 2% target.
In the US, the Federal Reserve is grappling with a hot US economy and inflation has accelerated in each of the past two months. This has complicated plans to lower rates and provide relief to homeowners and businesses.
Fed Chair Powell delivered a blunt message on Tuesday, stating that “the recent data have clearly not given us greater confidence and instead indicate that it’s likely to take longer than expected to achieve that confidence”. The US economy’s strong performance is putting into question whether the Fed will cut at all this year. The markets have slashed the odds of a September cut, which was a given just a month ago at 93%, have to just 32% at present.
GBP/USD Technical
- GBP/USD tested resistance at 1.2463 earlier. Above, there is resistance at 1.2501
- There is support at 1.2435 and 1.2397
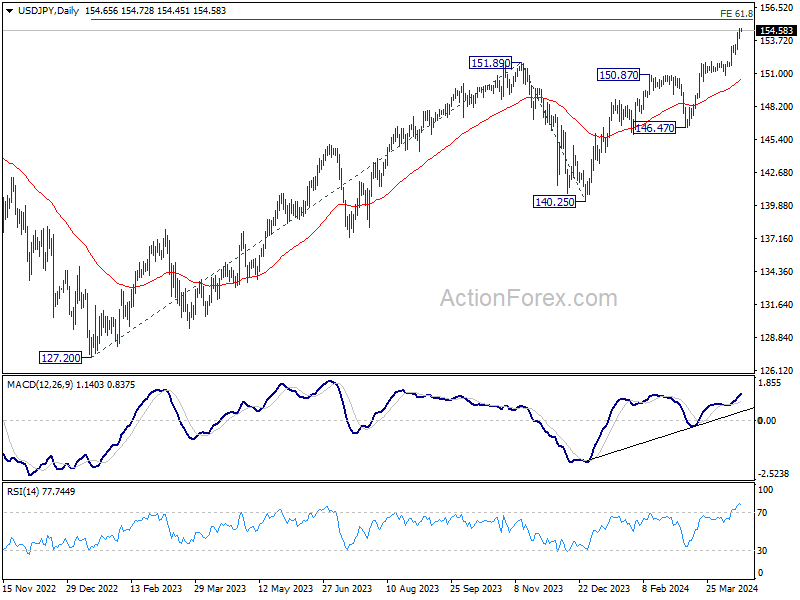
USD/JPY Mid-Day Outlook
Daily Pivots: (S1) 154.18; (P) 154.48; (R1) 155.04; More...
Intraday bias stays mildly on the upside with 153.89 minor support intact. USD/JPY is still in favor to rise towards 155.20 fibonacci projection level. But upside could be limited there, at least on first attempt, to bring pull back. On the downside, below 153.89 will turn bias back to the downside for 55 4H EMA (now at 153.20).
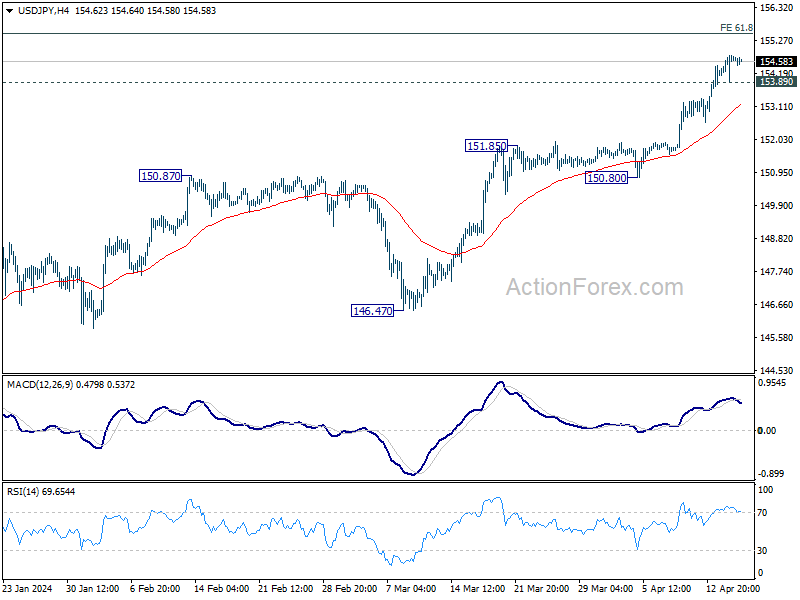
In the bigger picture, current rise from 140.25 is seen as the third leg of the up trend from 127.20 (2023 low). Next target is 61.8% projection of 127.20 to 151.89 from 140.25 at 155.20. Outlook will now remain bullish as long as 146.47 support holds, even in case of deep pullback.
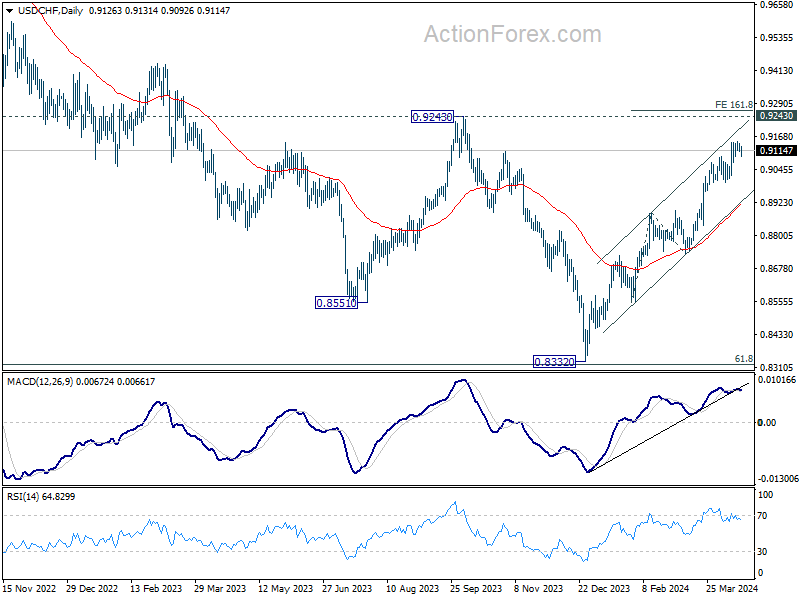
USD/CHF Mid-Day Outlook
Daily Pivots: (S1) 0.9111; (P) 0.9132; (R1) 0.9152; More....
Intraday bias in USD/CHF remains neutral as consolidation from 0.9151 is extending. Further rally is expected as long as 0.8996 support holds. Firm break of 0.9151 will target 161.8% projection of 0.8550 to 0.8884 from 0.8728 at 0.9268.
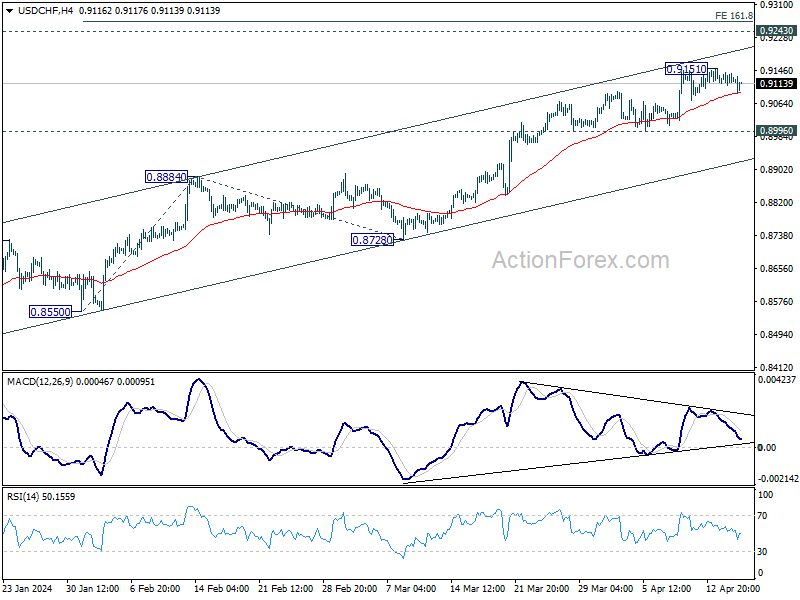
In the bigger picture, price actions from 0.8332 medium term bottom as tentatively seen as developing into a corrective pattern to the down trend from 1.0146 (2022 high). Further rise would be seen as long as 0.8728 support holds. But upside should be limited by 0.9243 resistance, at least on first attempt. However, decisive break of 0.9243 will argue that the trend has already reversed and turn medium term outlook bullish.
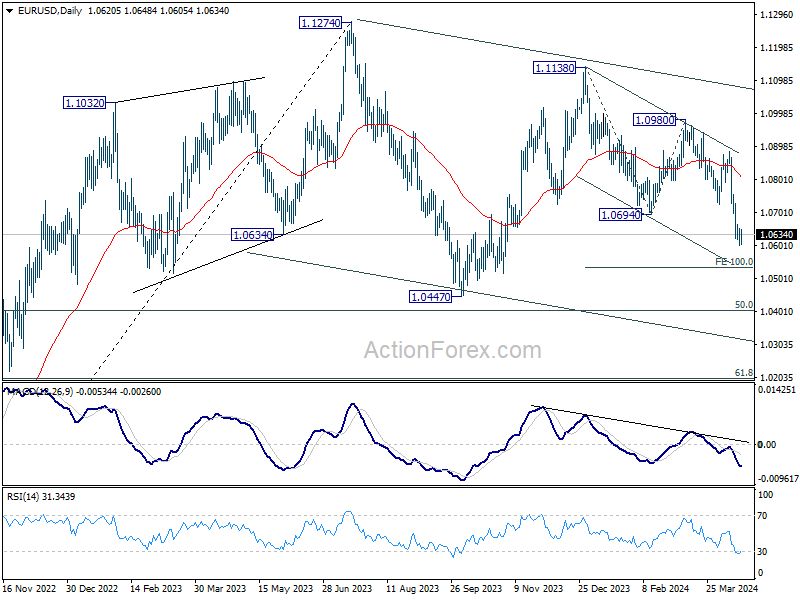
EUR/USD Mid-Day Outlook
Daily Pivots: (S1) 1.0595; (P) 1.0625; (R1) 1.0648; More...
Intraday bias in EUR/USD remains neutral and outlook is unchanged. Consolidation from 1.0601 could extend further. While stronger recovery cannot be ruled out, upside should be limited by 1.0723 support turned resistance. On the downside, break of 1.0601 will resume the decline from 1.1138 to 100% projection of 1.1138 to 1.0694 from 1.0980 at 1.0536 next.
In the bigger picture, price actions from 1.1274 are viewed as a corrective pattern to rise from 0.9534 (2022 low). Current fall from 1.1138 is seen as the third leg. While deeper decline is would be seen to 1.0447 and possibly below. Strong support should emerge from 61.8% retracement of 0.9534 to 1.1274 at 1.0199 to complete the correction.
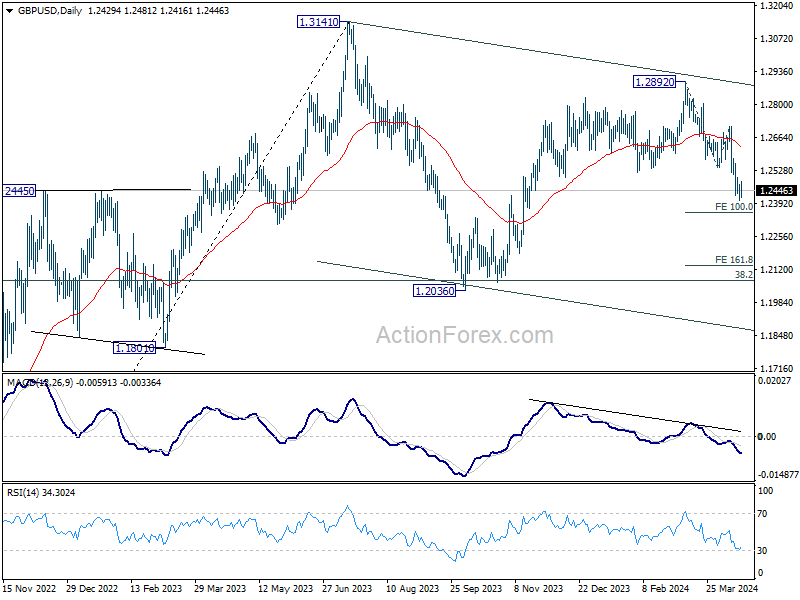
GBP/USD Mid-Day Outlook
Daily Pivots: (S1) 1.2397; (P) 1.2435; (R1) 1.2463; More...
Intraday bias in GBP/USD remains neutral and outlook is unchanged. Consolidation from 1.2402 is extending, but upside of recovery should be limited by 1.2538 support turned resistance to bring another fall. On the downside, firm break of 1.2404 will resume the decline from 1.2892 to 100% projection of 1.2892 to 1.2538 from 1.2708 at 1.2354. Firm break there will target 161.8% projection at 1.2207 next.
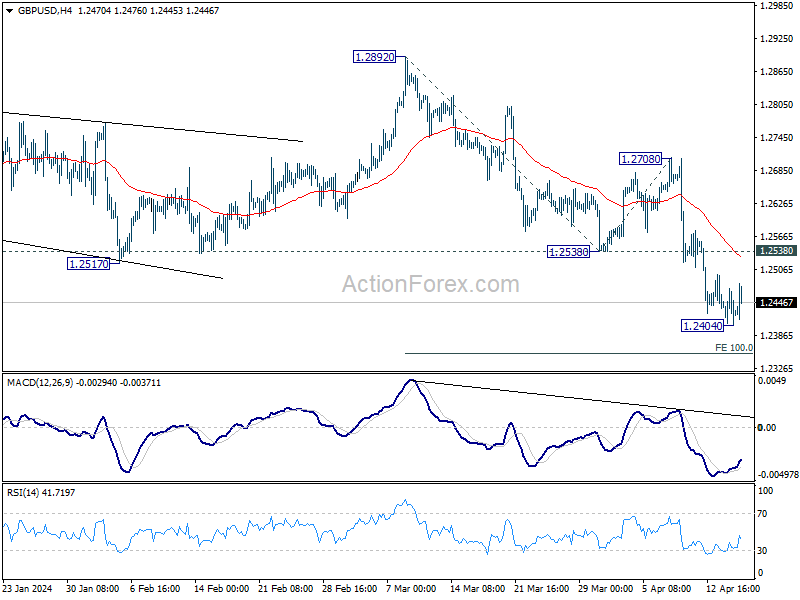
In the bigger picture, price actions from 1.3141 medium term top are seen as a corrective pattern to up trend from 1.0351 (2022 low). Fall from 1.2892 is seen as the third leg. Deeper decline would be seen to 1.2036 support and possibly below. But strong support should emerge from 61.8% retracement of 1.0351 to 1.2452 at 1.1417 to complete the correction.
Sterling Wavers after UK CPI, Kiwi Leads
Sterling is having a volatile trading day, initially gaining ground after UK CPI data which indicated slower pace of disinflation than anticipated. Despite this, the currency struggled to maintain its momentum as the data did not substantially alter the broader expectation that BoE) will delay interest rate cuts until at least late summer. The lack of significant decline in services inflation particularly underscored ongoing price pressure challenges, reinforcing the view that it is premature for a more optimistic stance on monetary easing.
In the broader currency market, New Zealand Dollar is currently the strongest performer of the day, buoyed by supportive Q1 CPI readings that suggest sustained inflationary pressures, which may delay any rate cuts by RBNZ. Following closely behind, Australian Dollar ranked as the second strongest, with traders positioning ahead of the upcoming employment data expected to influence further movements. Dollar is the weakest one, as it began to retract some of its recent gains. Japanese Yen and Canadian Dollar also underperformed, while Euro and Swiss Franc held middle positions in the trading spectrum.
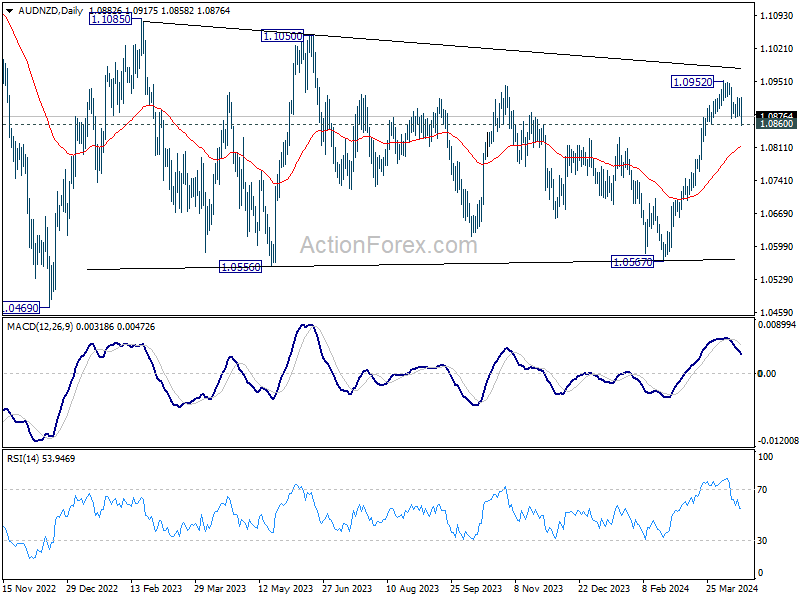
Technically, AUD/NZD hits 1.0860 support today but recovered briefly. The preferred case is still that rise from 1.0567 has completed at 1.0952, just ahead of medium term falling trend line. Break of 1.0860 support will strengthen this bearish view, and bring deeper fall through 55 D EMA, as another falling leg of the sideway pattern from 1.1085. Upcoming Australian employment data could be a catalyst for this anticipated movement.
In Europe, at the time of writing, FTSE is up 0.66%. DAX is up 0.47%. CAC is up 1.30%. UK 10-year yield is up 0.0015 at 4.306. Germany 10-year yield is up 0.0004 at 2.492. Earlier in Asia, Nikkei fell sharply by -1.32%. Hong Kong HSI rose 0.02%. China Shanghai SSE rose 2.14%. Singapore Strait Times rose 0.32%. Japan 10-year JGB yield closed flat at 0.887.
Eurozone CPI finalized at 2.4% yoy, core CPI at 2.9% yoy
Eurozone CPI was finalized at 2.4% yoy in March, down from February's 2.6% yoy. CPI core (energy, food, alcohol & tobacco) was finalized at 2.9% yoy, down from prior month's 3.1% yoy.
The highest contribution to annual Eurozone inflation rate came from services (+1.76 percentage points, pp), followed by food, alcohol & tobacco (+0.53 pp), non-energy industrial goods (+0.30 pp) and energy (-0.16 pp).
EU CPI was finalized at 2.6% yoy, down from prior month's 2.8% yoy. The lowest annual rates were registered in Lithuania (0.4%), Finland (0.6%) and Denmark (0.8%). The highest annual rates were recorded in Romania (6.7%), Croatia (4.9%), Estonia and Austria (both 4.1%). Compared with February, annual inflation fell in thirteen Member States, remained stable in four and rose in ten.
UK CPI slows less than expected to 3.2% yoy in Mar
UK CPI slowed from 3.4% yoy to 3.2% yoy in March, above expectation of 3.1% yoy. CPI core (excluding energy, food, alcohol and tobacco) decelerated from 4.5% yoy to 4.2% yoy, above expectation of 4.1% yoy. CPI goods slowed from 1.1% yoy to 0.8% yoy. CPI serviced eased marginally from 6.1% yoy to 6.0% yoy. For the month, CPI rose 0.6% mom.
New Zealand's CPI eases to 4.0% yet exceeds target, driven by housing costs
New Zealand CPI rose 0.6% qoq in Q1, while annual inflation rate decelerated from 4.7% yoy to 4.0% yoy. This marks the lowest annual inflation rate since Q2 2021 but still remains above RBNZ's target band of 1-3%.
The most significant pressure on the annual inflation rate came from the housing and household utilities sector. Record increases in rent, which rose by 4.7% yoy, along with 3.3% yoy rise in the construction costs of new houses and 9.8% yoy hike in rates, were the primary drivers behind the sustained inflationary pressures.
In terms of inflation categories, there was a notable divergence between non-tradeable and tradeable inflation. Non-tradeable inflation, which includes goods and services that do not face foreign competition and thus reflect domestic supply and demand conditions, slightly decreased from 5.9% yoy to 5.8% yoy.
In contrast, tradeable inflation, which is influenced by foreign markets and includes goods and services that compete with foreign imports, experienced a more significant slowdown from 3.0% yoy to 1.6% yoy.
Australia's Westpac leading index indicates sub-trend growth to continue
Australia's economic outlook appears subdued for the remainder of 2024, according to the latest data from Westpac's leading index, which fell from -0.03% to -0.23% in March. This decline signals continuation of "sub-trend" growth, as characterized by Westpac, suggesting that the economic performance may not reach the usual growth standards expected within the country.
Westpac projected that Australia's GDP growth will remain modest at of 1.6% for 2024. This follows a similarly soft performance in 2023, where GDP grew only by 1.5%. Such figures are notably below the typical "trend" growth rate of around 2.5%.
Looking ahead, the focus shifts to the upcoming Q1 CPI data, set to be released on April 24. Westpac anticipates that this report will show deceleration in inflation to 3.5%, a development that could reinforce RBA confidence that inflation is on path back to target range of 2-3%.
However, the decision for RBA to shift to a more definitively "on hold" stance regarding interest rates will hinge on the specifics of the price updates and a broader assessment of risks.
Japan's export rises 7.3% yoy in Mar, fourth month of growth
Japan's exports marked the fourth consecutive month of growth with a 7.3% yoy increase to JPY 9470B in March, slightly surpassing expected 7.0%. This growth was largely fueled by robust performances in automotive and semiconductor & electronic parts, which reported gains of 7.1% yoy and 11.3% yoy respectively. T
Regionally, exports to China accelerated to 12.6% yoy, from just 2.5% yoy in the previous month. However, exports to the US and Europe saw a slowdown, growing at 8.5% and 3.0% respectively.
Import contracted -4.9% yoy to JPY 9103B, which was slightly better anticipated -5.1% yoy. Overall trade balance for March showed a surplus of JPY 366.5B.
In seasonally adjusted term, exports rose 2.6% mom to JPY 8768B. Imports rose 3.9% mom to JPY 9470B. Trade balance came in at JPY -701B.
GBP/USD Mid-Day Outlook
Daily Pivots: (S1) 1.2397; (P) 1.2435; (R1) 1.2463; More...
Intraday bias in GBP/USD remains neutral and outlook is unchanged. Consolidation from 1.2402 is extending, but upside of recovery should be limited by 1.2538 support turned resistance to bring another fall. On the downside, firm break of 1.2404 will resume the decline from 1.2892 to 100% projection of 1.2892 to 1.2538 from 1.2708 at 1.2354. Firm break there will target 161.8% projection at 1.2207 next.
In the bigger picture, price actions from 1.3141 medium term top are seen as a corrective pattern to up trend from 1.0351 (2022 low). Fall from 1.2892 is seen as the third leg. Deeper decline would be seen to 1.2036 support and possibly below. But strong support should emerge from 61.8% retracement of 1.0351 to 1.2452 at 1.1417 to complete the correction.
Economic Indicators Update
| GMT | Ccy | Events | Actual | Forecast | Previous | Revised |
|---|---|---|---|---|---|---|
| 22:45 | NZD | CPI Q/Q Q1 | 0.60% | 0.60% | 0.50% | |
| 22:45 | NZD | CPI Y/Y Q1 | 4.00% | 4.70% | ||
| 23:50 | JPY | Trade Balance (JPY) Mar | -0.70T | -0.28T | -0.45T | -0.57T |
| 01:00 | AUD | Westpac Leading Index M/M Mar | -0.10% | 0.10% | ||
| 06:00 | GBP | CPI M/M Mar | 0.60% | 0.60% | ||
| 06:00 | GBP | CPI Y/Y Mar | 3.20% | 3.10% | 3.40% | |
| 06:00 | GBP | CPI Core Y/Y Mar | 4.20% | 4.10% | 4.50% | |
| 06:00 | GBP | RPI M/M Mar | 0.50% | 0.80% | ||
| 06:00 | GBP | RPI Y/Y Mar | 4.30% | 4.20% | 4.50% | |
| 06:00 | GBP | PPI Input M/M Mar | -0.10% | 0.00% | -0.40% | 0.30% |
| 06:00 | GBP | PPI Input Y/Y Mar | -2.50% | -2.70% | -2.20% | |
| 06:00 | GBP | PPI Output M/M Mar | 0.20% | 0.20% | 0.30% | |
| 06:00 | GBP | PPI Output Y/Y Mar | 0.60% | 0.40% | ||
| 06:00 | GBP | PPI Core Output M/M Mar | 0.30% | 0.20% | 0.10% | |
| 06:00 | GBP | PPI Core Output Y/Y Mar | 0.10% | 0.20% | 0.30% | 0.20% |
| 09:00 | EUR | Eurozone CPI Y/Y Mar F | 2.40% | 2.40% | 2.40% | |
| 09:00 | EUR | Eurozone CPI Core Y/Y Mar F | 2.90% | 2.90% | 2.90% | |
| 14:30 | USD | Crude Oil Inventories | 1.6M | 5.8M | ||
| 18:00 | USD | Fed's Beige Book |
EUR/CHF Technical: Bullish Exhaustion Condition Detected After 2-Month of Rallies
- A bolder dovish ECB increases the likelihood of a yield premium shrinkage of Eurozone sovereign bonds over Switzerland sovereign bonds.
- The recent 2-month of rallies seen in the EUR/CHF have been overstretched with bearish momentum conditions flashed out.
- EUR/CHF is at risk of shaping a short-term mean reversion decline within a medium-term uptrend phase.
- Watch the 0.9755 key short-term pivotal resistance on the EUR/CHF.
The recent two months of Euro strength against the CHF has led to a stellar gain of +540 pips (+5.8%) in the EUR/CHF cross pair from a low of 0.9306 on 31 January 2024 to a recent high of 0.9849 printed on 4 April 2024.
The current bout of outperformance of the EUR against the CHF has been reinforced by the CHF side of the equation as the Swiss National Bank (SNB) surprised market participants on 21 March with a rate cut of 25 basis points (bps) to bring its key policy rate down to 1.5%, its first cut in nine years, and ahead of the US Federal Reserve, Bank of England (BoE), and European Central Bank (ECB).
A bolder dovish ECB sucks out some of the bullish pressure in the EUR/CHF cross rate
Relativity is a key mechanic in the foreign exchange market as we need to look at its movements from a relative rather than an absolute basis. In the recently concluded ECB monetary policy meeting last Thursday, 11 April, ECB President Lagarde expressed a high degree of confidence that the ECB might enact its first interest rate cut this coming June due to the continuation of the inflationary deceleration trend seen in the Eurozone.
Hence, the shorter-term yield premium of Eurozone sovereign bonds over Switzerland sovereign bonds is likely to shrink which in turn increases the odds of a mean reversion decline scenario to occur in the EUR/CHF at least on a short-term basis.
Bearish momentum condition supports a mean reversion decline scenario
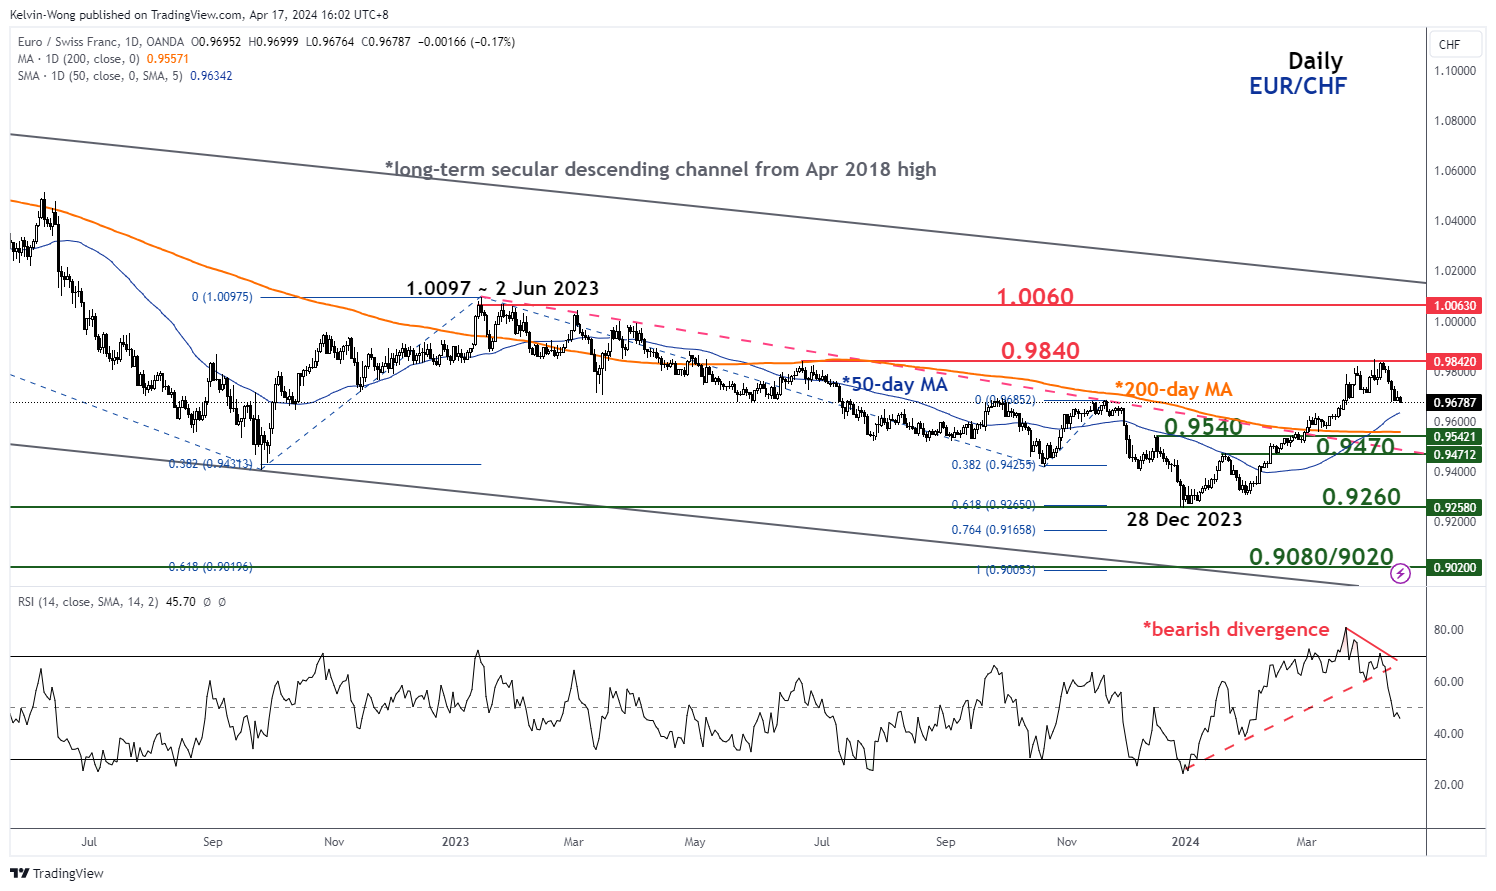
Fig 1: EUR/CHF medium-term trend as of 17 Apr 2024 (Source: TradingView, click to enlarge chart)
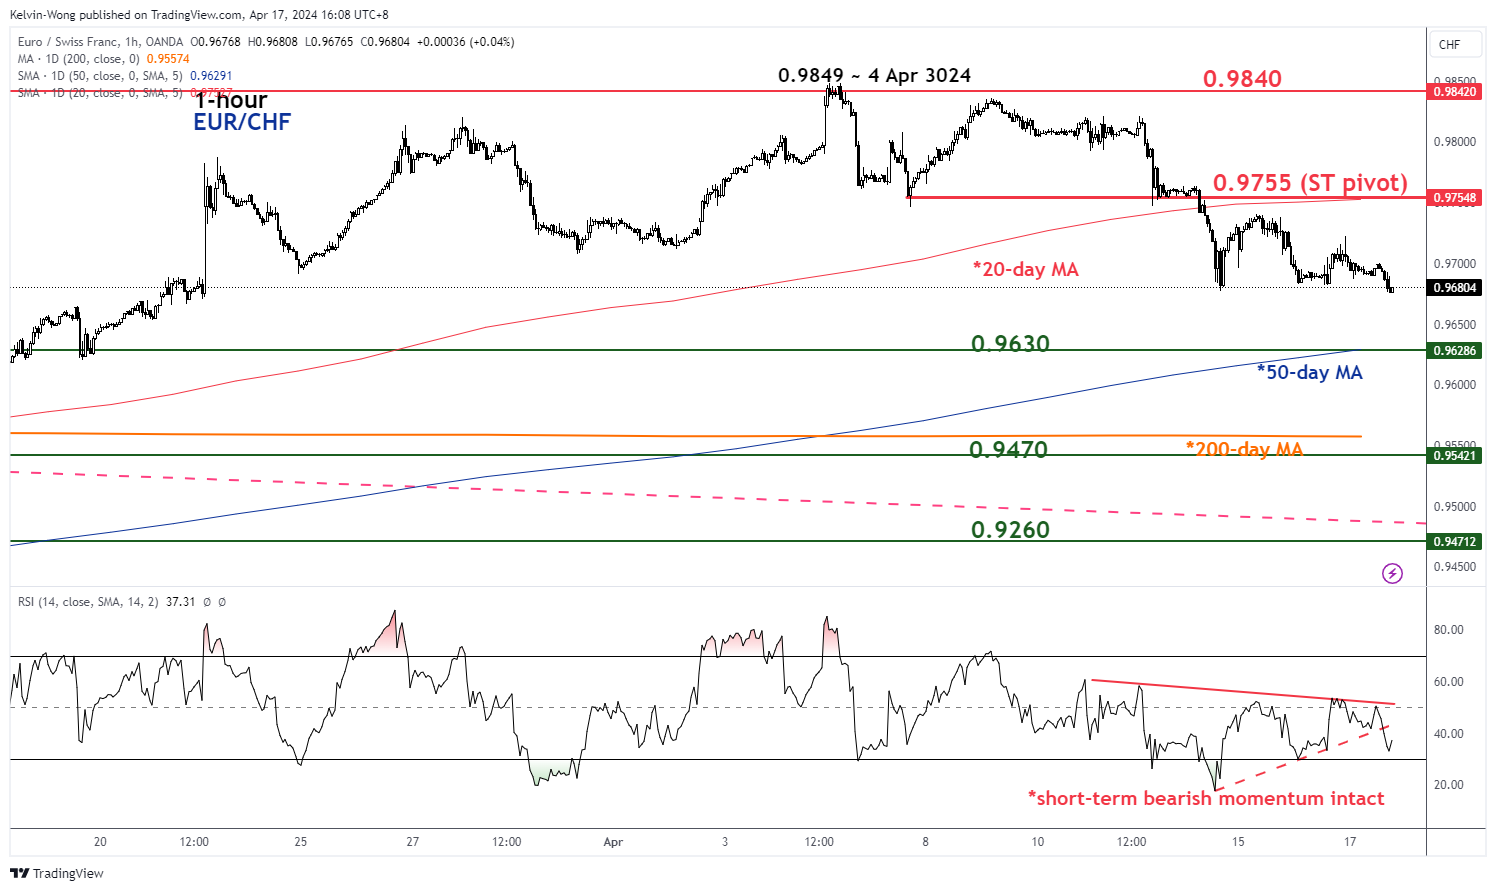
Fig 2: EUR/CHF short-term trend as of 17 Apr 2024 (Source: TradingView, click to enlarge chart)
In the lens of technical analysis, price actions of highly liquid tradable financial instruments do not move in a vertical direction but oscillate around a higher time frame trending phase.
The medium-term (multi-week) trend phase of the EUR/CHF is now likely in a bullish uptrending phase as price actions have staged a bullish breakout from its former medium-term descending trendline resistance from the 2 June 2023 swing high and the 50-day moving average as well as the 200-day moving average (see Fig 1).
However, the daily RSI momentum indicator flashed out a recent bearish divergence condition on 9 April and broke below a key parallel ascending support on 12 April. So far it has not reached its oversold condition which suggests that bearish momentum is still intact and might add further downside pressure on the EUR/CHF cross pair.
In addition, the EUR/CHF has also traded below the 20-day moving average since last Friday, 12 April which reinforces the potential short-term mean reversion decline scenario that might seek a retest on its 50-day and 200-day moving averages (see Fig 2).
Watch the 0.9755 key short-term pivotal resistance with the next intermediate supports coming in at 0.9630 and 0.9540/9470.
On the flip side, a clearance above 0.9755 invalidates the bearish tone for a squeeze-up to expose the next intermediate resistance at 0.9840 in the first step.
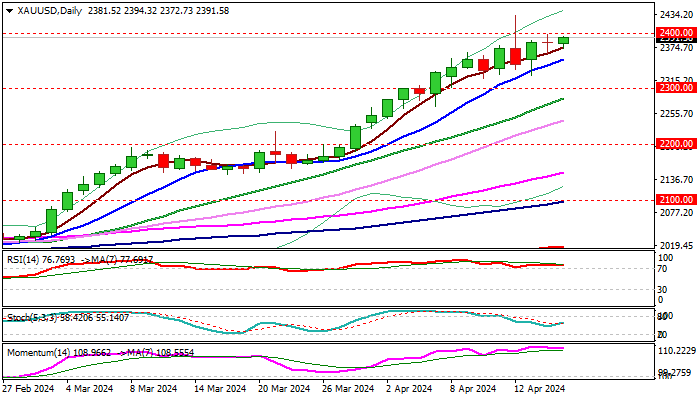
XAU/USD: Gold Steadies Near $2,400 Barrier
Gold regained traction after a $100 per ounce pullback from new record high last week and pressuring again psychological $2400 barrier.
Overall sentiment remains positive as geopolitical tensions and fears that the conflict in the Middle East can escalate, continue to fuel safe-haven demand and offset pressure on metal’s price from higher dollar.
Recent pullback, despite being sharp, was limited and contained by rising 10DMA (currently at $2351), keeping larger bulls intact.
On the other hand, overbought daily studies and RSI bearish divergence, continue to send warning signals, which should not be completely ignored and keep in play risk of deeper correction.
In such scenario, solid supports at $2300/$2283 (psychological / rising 20DMA) should keep the downside protected and mark a healthy correction before fresh push higher.
Break of the latest record high ($2431) to unmask next strong barrier at $2500.
Res: 2400; 2431; 2453; 2500.
Sup: 2374; 2351; 2320; 2300.
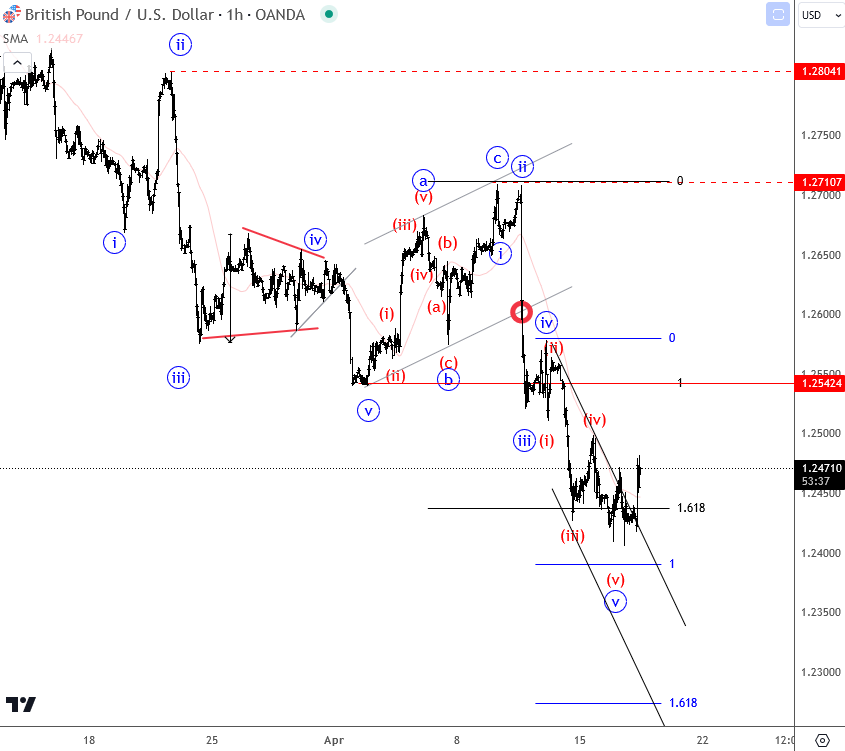
Cable Finds Some Support after UK CPI – Elliott Wave Analysis
Cable found some footing and appears to be seeking stability after the latest inflation report. The CPI on a y/y basis was reported at 3.2%, a decrease from 3.4%. However, Cable is still ticking slightly upward because the forecast was 3.1%, and this miss has impacted sentiment. From an Elliott wave perspective, we see the price emerging from this hourly downtrend channel, suggesting there could be more gains. But for a confirmed change in trend, you'd want to see an impulsive movement, meaning five waves up from the lows and a push up to 1.2540. If Cable does gain strength, we might even turn bullish here, with potential long opportunities once a bottom is established.
Deeper projection, for further weakness would be near 1.235, then 1.23.
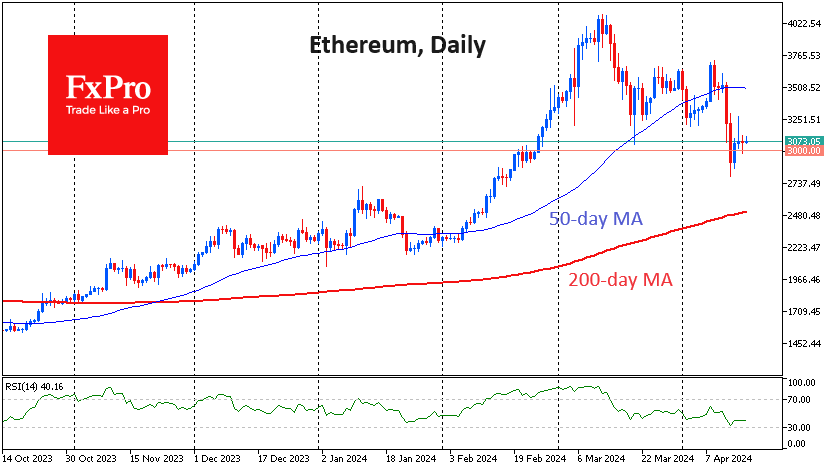
Bitcoin and Ethereum in Eye of Storm?
Market picture
The crypto market avoided sharp moves on Tuesday, showing low volatility over the 24 hours and remaining near $2.3 trillion. The Crypto Fear and Greed Index added 2 points to 67 (greed) by Wednesday.
Bitcoin’s share of the entire crypto market capitalisation exceeded 54%, maintaining its upward trend since December 2022. This is the clear impact of the Bitcoin-ETF, but we also note the diminishing enthusiasm for altcoins.
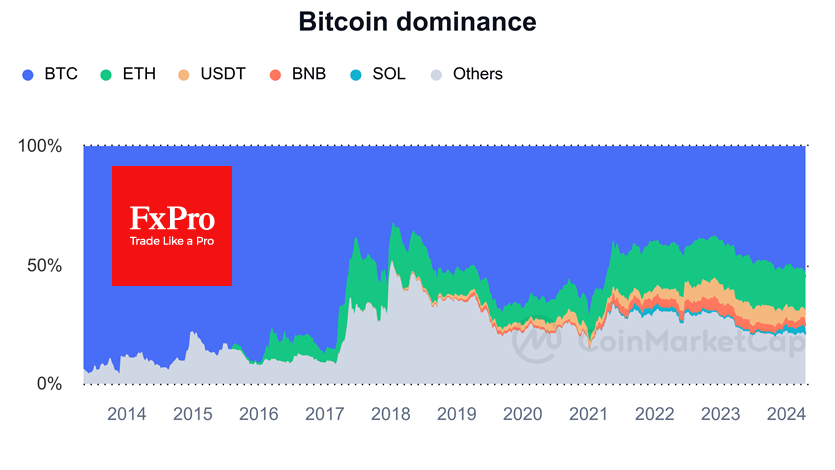
The technical picture for Bitcoin is rather worrying, as we saw no rebound after the price drop on Friday and Saturday. On the contrary, the market seems to be getting used to current prices in anticipation of a halving.
Similarly, Ethereum sold off powerfully at the end of last week from the 50-day MA. Now, the second largest cryptocurrency holds near the psychologically significant $3000 level.
The pattern of cryptocurrency behaviour this week indicates that we are more likely to be in the eye of the storm, i.e. a temporary lull between violent gusts of wind. If this prediction is correct, Bitcoin could fall towards $52-55K, and Ethereum – to $2500.
News background
The crypto market is “halfway to bitcoin euphoria,” according to CryptoQuant. New bitcoin miners, who have held their assets for less than 155 days, hold up to 9% of the circulating BTC volume and continue to build up inventories in anticipation of rising prices. The imbalance between BTC supply and demand will increase over the next six months, potentially driving prices higher.
Hong Kong-listed cryptocurrency ETFs will be “lucky” if they manage to raise $500 million in aggregate, Bloomberg said. The agency called Matrixport’s projected $25bn “insane”.
According to CoinGecko, there are more than 2.52 million crypto assets in existence today, which is 5.7 times the number at the end of 2021. The pace of new coins accelerated in 2024 when 0.54 million tokens have already been created, which means an average of 5,300 pieces launched per day.
Blockchain team The Open Network (TON) has announced the launch of the Memelandia hub for meme coin developers. The project is part of The Open League’s programme, which was created to support new meme coins and raise awareness of them.