Sample Category Title
BTCUSD Drops to 6-Week Low as Halving Looms
- BTCUSD falls temporarily below 60,000 ahead of halving
- Momentum indicators point to intensifying downside pressures
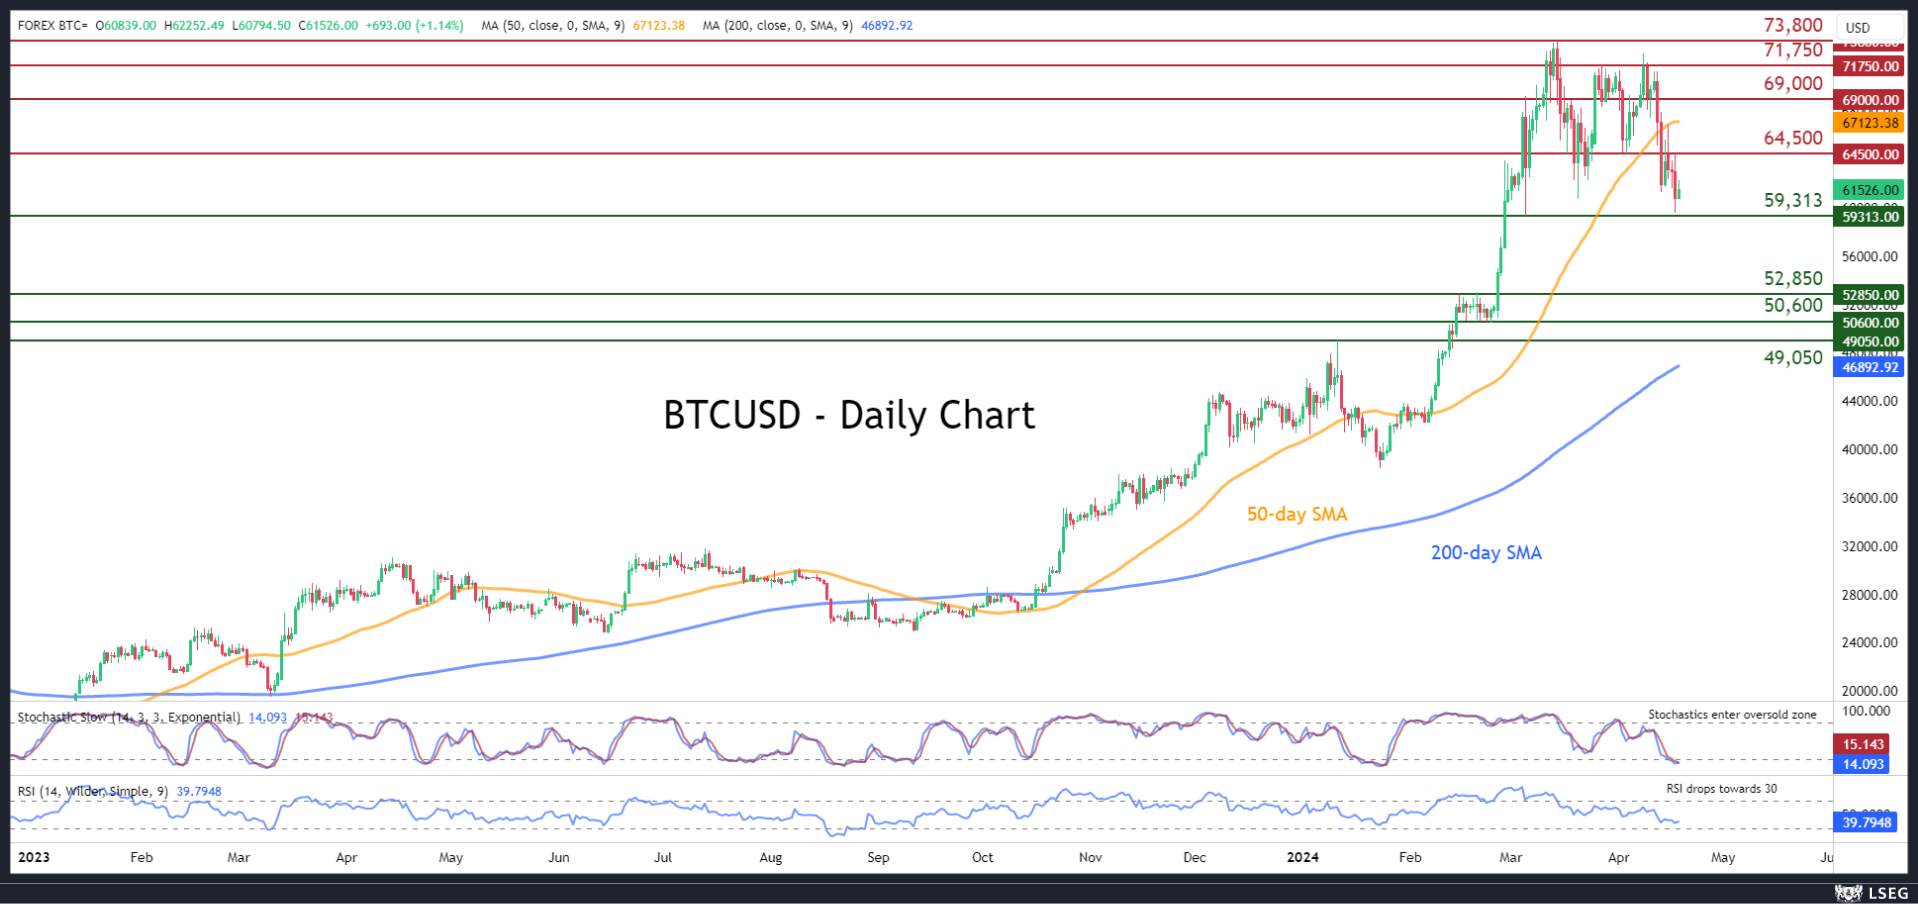
BTCUSD (Bitcoin) experienced a strong pullback following the formation of a triple top pattern, sliding below its 50-day simple moving average (SMA). Meanwhile, the price dropped to a fresh six-week low a tad beneath the 60,000 psychological mark, just a couple of days ahead of the crucial halving event.
Given that the momentum indicators are heavily tilted to the downside, Bitcoin could revisit its March bottom of 59,313. In case of a downside violation, there is no prominent support until the February resistance zone of 52,850. Even lower, the February support of 50,600 could prevent further declines.
On the flipside, bullish actions could propel the price towards the April support of 64,500, which could serve as resistance in the future. Conquering that region, the bulls might attack 69,000, a level that acted both as support and resistance in recent months. A break above that region could pave the way for the March resistance of 71,750.
In brief, BTCUSD has fallen towards the lower boundary of its range in place since March after a formation of a triple top pattern. The impending halving event decide the price’s next move.
AUDJPY Pulls Back But Stays in Uptrend
- AUDJPY prints higher highs and higher lows above uptrend line
- MACD and RSI detect positive momentum
- A break above 100.80 will confirm a higher high
- For the outlook to change, a break below 95.80 may be needed
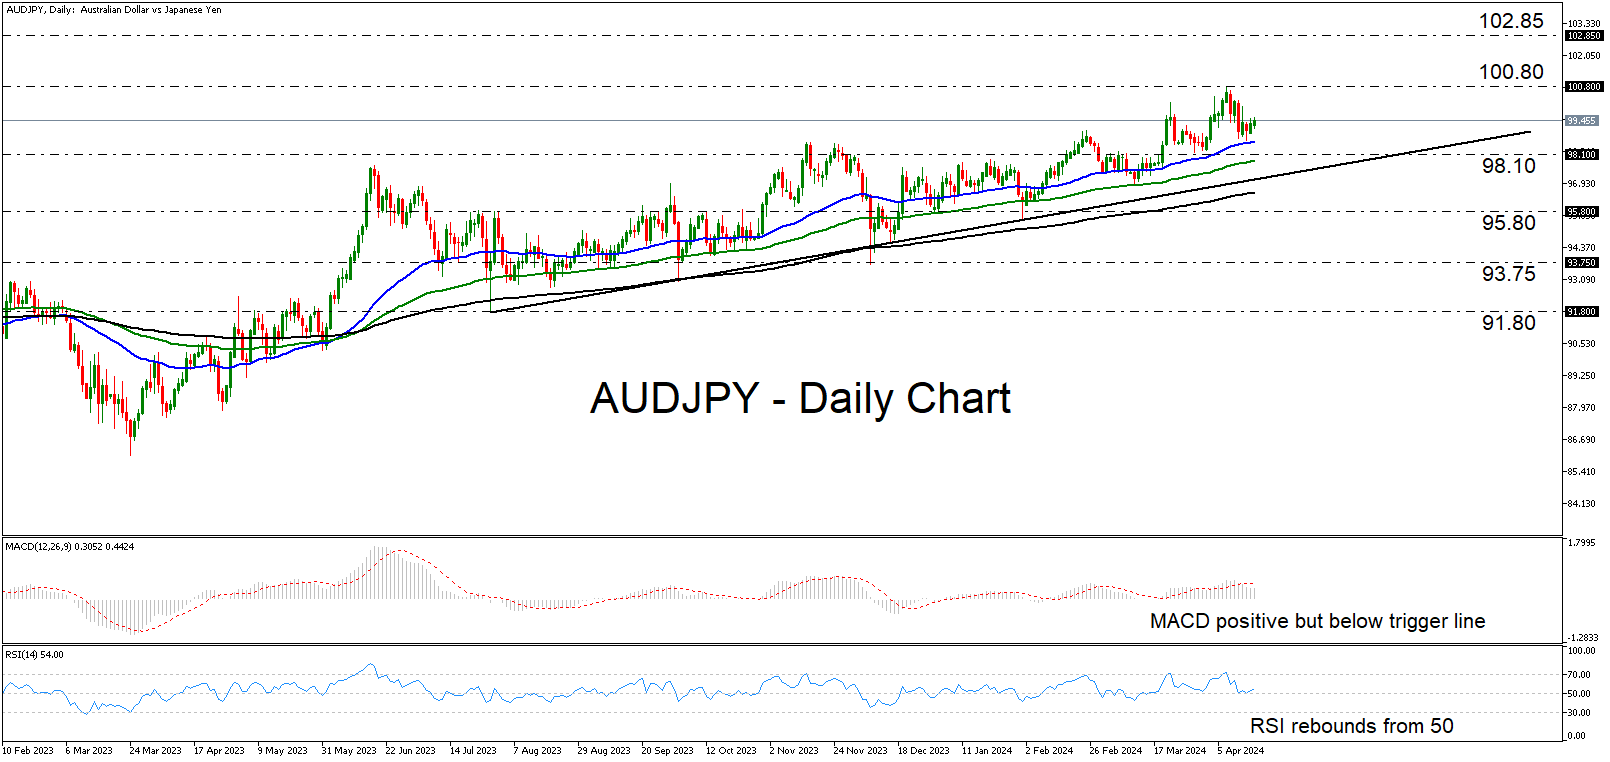
AUDJPY pulled back lately, after it hit resistance at around 100.80 on April 9. However, the pair remains above all three of the plotted exponential moving averages (EMAs) and above an uptrend line drawn from the low of July 28, which means that the chances of the bulls recharging again soon are very high.
The MACD and the RSI support this notion. Although the former is still below its trigger line, it is running above zero and shows signs of bottoming, while the latter has already bottomed after finding support at its 50 equilibrium level.
If the bulls take the reins again soon, then they may decide to aim for another test at 100.80. A break above that zone will confirm a higher high and could see scope for extensions towards the 102.85 barrier, defined as resistance by the high of November 21, 2014.
For the near-term outlook to turn negative, the bears may need to take the upper hand and drive the action below the 95.80 zone. Such a move will take AUDJPY below all the EMAs and below the aforementioned uptrend line. The next zone to consider as support may be at around 93.75, near the low of December 7.
To sum everything up, AUDJPY retreated during the last week or so, but the price structure on the daily chart continues to suggest a healthy uptrend. If the bulls recharge soon, we may see the price breaking above 100.80 and confirming a higher high.
EUR/GBP: Looks for Fresh Direction Signal
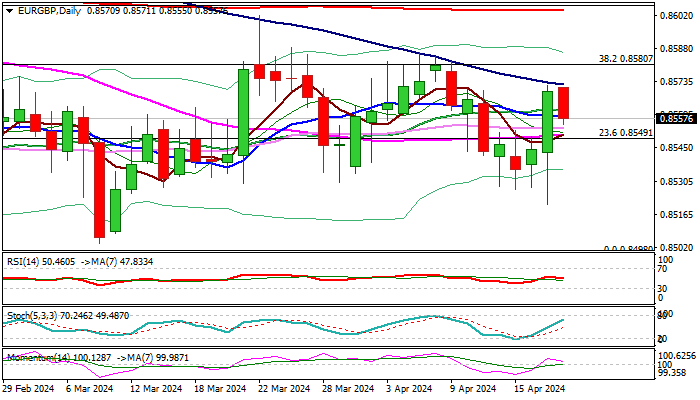
EURGBP dips in early Thursday’s trading, after a double upside failure at falling 100DMA (0.8572), the lower boundary of strong resistances at 0.8580 zone (including Fibo 38.2% of 0.8714/0.8498 downtrend and a multiple spike highs).
Sterling regained ground after being deflated by UK CPI data and dovish steer from BoE chief Bailey on Wednesday, though more evidence about near-term direction is still needed, as daily studies are mixed.
Solid support lays at 0.8550 (converged 5/55DMA’s, on track to form a bull-cross) with ability to hold above here to keep near-term bias with bulls for fresh attempt through 0.8580 pivots, which would open way for extension towards next key barriers at 0.8600 zone (50% retracement / 200DMA).
Conversely, loss of 0.8550 handle would weaken near-term structure and risk renewed attacks at key 0.8520/00 support zone.
Res: 0.8572; 0.8604; 0.8620.
Sup: 0.8550; 0.8520; 0.8499.
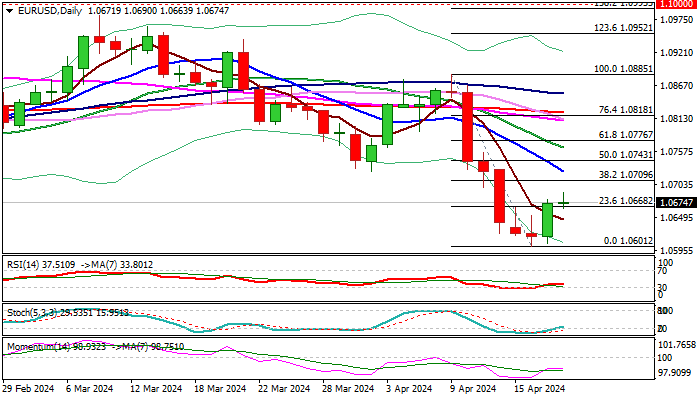
EUR/USD: Holds Grip But Recovery Still Requires Confirmation
The Euro remains constructive and ticks higher in early Thursday after Wednesday’s 0.5% bounce from new multi-month low, but initial reversal signal still needs more evidence to be validated, as daily studies are predominantly bearish.
Another strong bullish daily close is needed to keep in play hopes of stronger recovery, with close above pivots at 1.0710/25 (Fibo 38.2% of 1.0885/1.0601 / falling 10DMA) to confirm signal.
Conversely, failure to register a clear break higher would generate initial signal of recovery stall and keep the downside vulnerable of fresh drop towards key 1.0600 support zone.
Res: 1.0690; 1.0710; 1.0725; 1.0743.
Sup: 1.0663; 1.0645; 1.0602; 1.0516.
British Pound Shows Signs of Recovery Amid Favourable Inflation Data
The British pound sterling is showing signs of recovery, bouncing back from a five-month low, with GBP/USD stabilising around the 1.2470 mark on Thursday. This rebound is attributed to the release of UK inflation data, suggesting a possible monetary policy easing by the Bank of England (BoE).
The UK's consumer price index (CPI) slowed to 3.2% year-on-year in March, down from 3.4% in February, marking the lowest inflation rate in two and a half years. This slowdown has raised investor optimism regarding potential policy easing by the BoE, particularly since core inflation has also dropped to its lowest since mid-2021. However, persistent inflation in the services sector may lead to cautious deliberation among certain members of the monetary committee.
Meanwhile, representatives from the US Federal Reserve have reiterated that US interest rates are likely to remain high for an extended period. In contrast, the BoE is perceived as relatively stable, potentially initiating monetary policy easing by summer.
The first quarter saw significant pressures from the tight employment market and shocks from rising energy prices, which initially suggested that the BoE might follow the European Central Bank (ECB) and the Fed in lowering interest rates. However, market conditions have shifted considerably. Exchange analysts now anticipate that the ECB might cut interest rates by June, the BoE by September, and the Fed only in Q4.
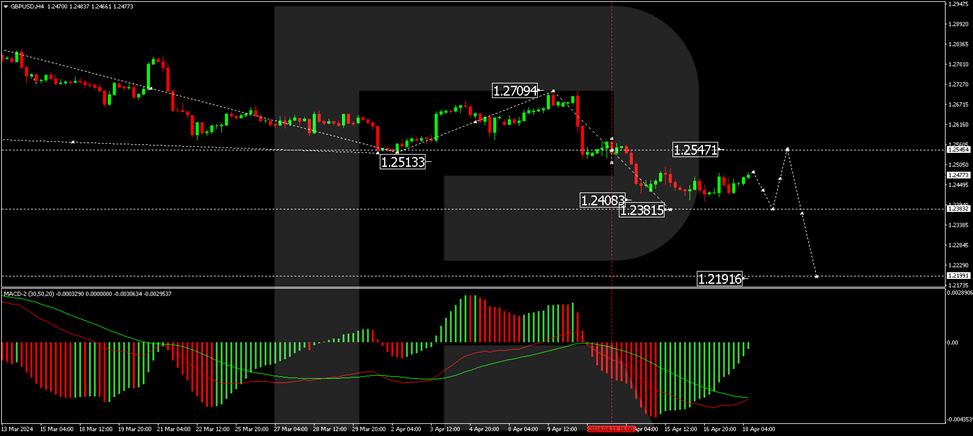
Technical analysis of GBP/USD
The H4 chart for GBP/USD indicates that after forming a consolidation range of around 1.2547, the pair has reached the target of 1.2450 with a downward exit. A new consolidation range is currently forming above this level. A break below this range may drive prices lower to 1.2380, with a subsequent correction to retest 1.2547 (testing from below) before a possible continuation to 1.2200. This bearish scenario is supported by the MACD oscillator, whose signal line is below zero and is trending downwards.
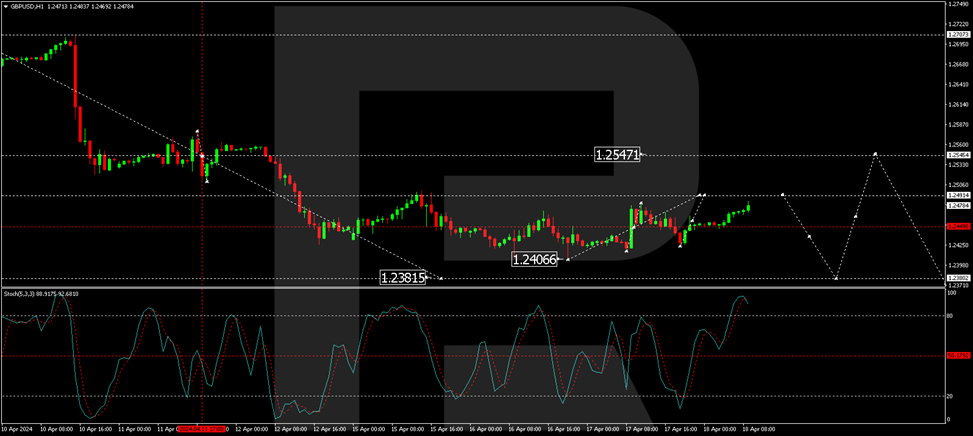
On the H1 chart, the GBP/USD has completed a decline to 1.2406 and is currently undergoing a correction to 1.2491. Following this correction, a new decline to 1.2381 is anticipated. The Stochastic oscillator, currently above 80, is poised for a sharp decline to the 20 mark, reinforcing the likelihood of further downward movement in the short term.
Australian Dollar Shrugs Off Soft Job Numbers
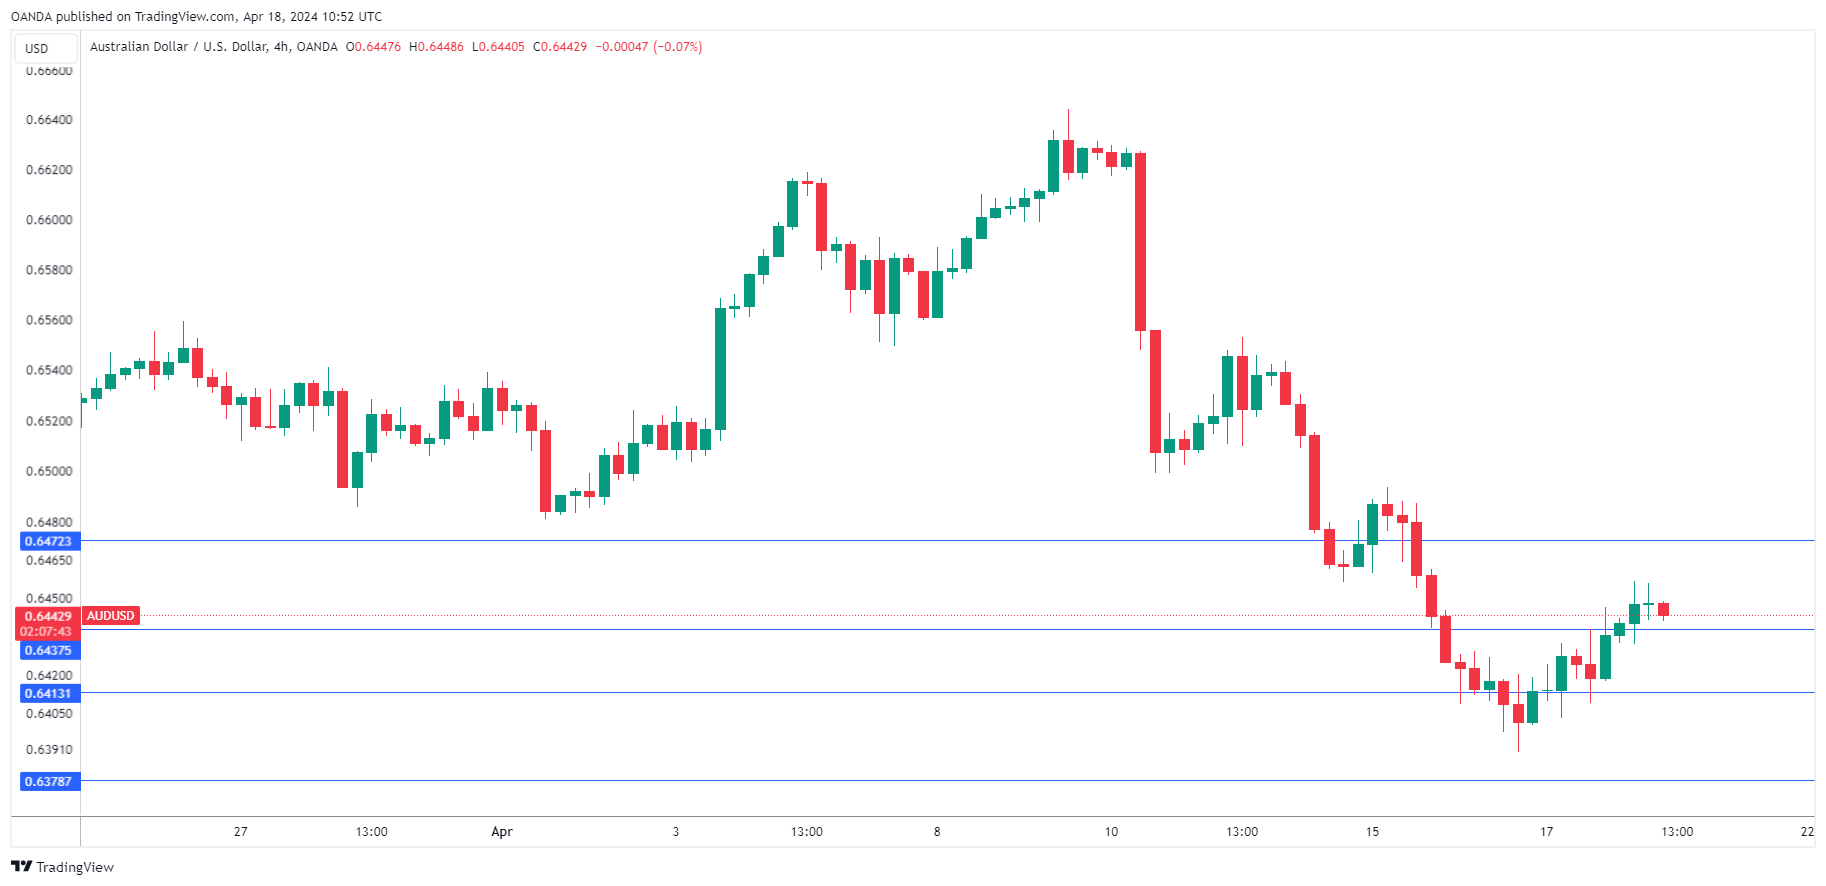
The Australian dollar is steady on Thursday. In the European session, AUD/USD is trading at 0.6442, up 0.12%.
Australia’s employment declines
Australia’s job growth hit the breaks in March and fell by 6,600. This missed the market estimate of a gain of 7,700 and follows a blowout gain of 116,500 in February. Still, the drop was not all that concerning as full time employment increased by 27,900 (part-time roles fell by 34,500). The unemployment rate ticked higher to 3.8%, up from 3.7% in March.
Although the job numbers were not flattering, the labor market remains tight. An unemployment level below 4% is close to capacity and the participation rate of 66.6% is indicative of a healthy labor market. The labour market is, however, expected to cool down as elevated interest rates continue to filter through the economy.
The Reserve Bank of Australia meets next month and will provide quarterly updates of its economic forecasts. The central bank will base its rate decision on the strength of the data and today’s employment report will support the RBA continuing to remain patient before cutting rates. Next week brings CPI for the first quarter, which is expected to fall to 3.4%, down from 4.1% in Q4 2023. If inflation does drop significantly, the RBA will be under increased pressure to lower rates.
In the US, the Federal Reserve is watching inflation move the wrong way, and that has alarm bells ringing. Fed Chair Powell said this week that higher-than-expected inflation readings meant that rate cuts would have to wait until the inflation picture improved.
The robust US economy and high inflation has put under question whether the Fed will be able to lower rates this year. The markets have slashed expectations for rate cuts but a September cut remains a strong possibility, with a 69% probability, according to the CME FedWatch tool.
AUD/USD Technical
- AUD/USD continues to test resistance at 0.6437. Above, there is resistance at 0.6472
- 0.6413 and 0.6378 are the next support levels
ECB’s de Guindos: We have been crystal clear on June rate cut
During a European Parliament hearing today, ECB Vice President Luis de Guindos stated that ECB has been "crystal clear" on its conditional guidance regarding interest rate cut.
"If things continue as they have been evolving lately, in June we'll be ready to reduce the restriction of our monetary policy stance," he said.
While financial markets anticipate a total of 75bps in rate cuts for the year, de Guindos remained non-committal about specific future rate levels.
He pointed out several risks to inflation outlook, including wage dynamics, productivity, unit labor costs, profit margins, and geopolitical tensions.
WTI Oil Futures Exit Sideways Move to the Downside
- WTI oil futures complete bearish triangle pattern after Wednesday’s drop
- Bullish pressures could still resurface as long as the price holds above 81.50
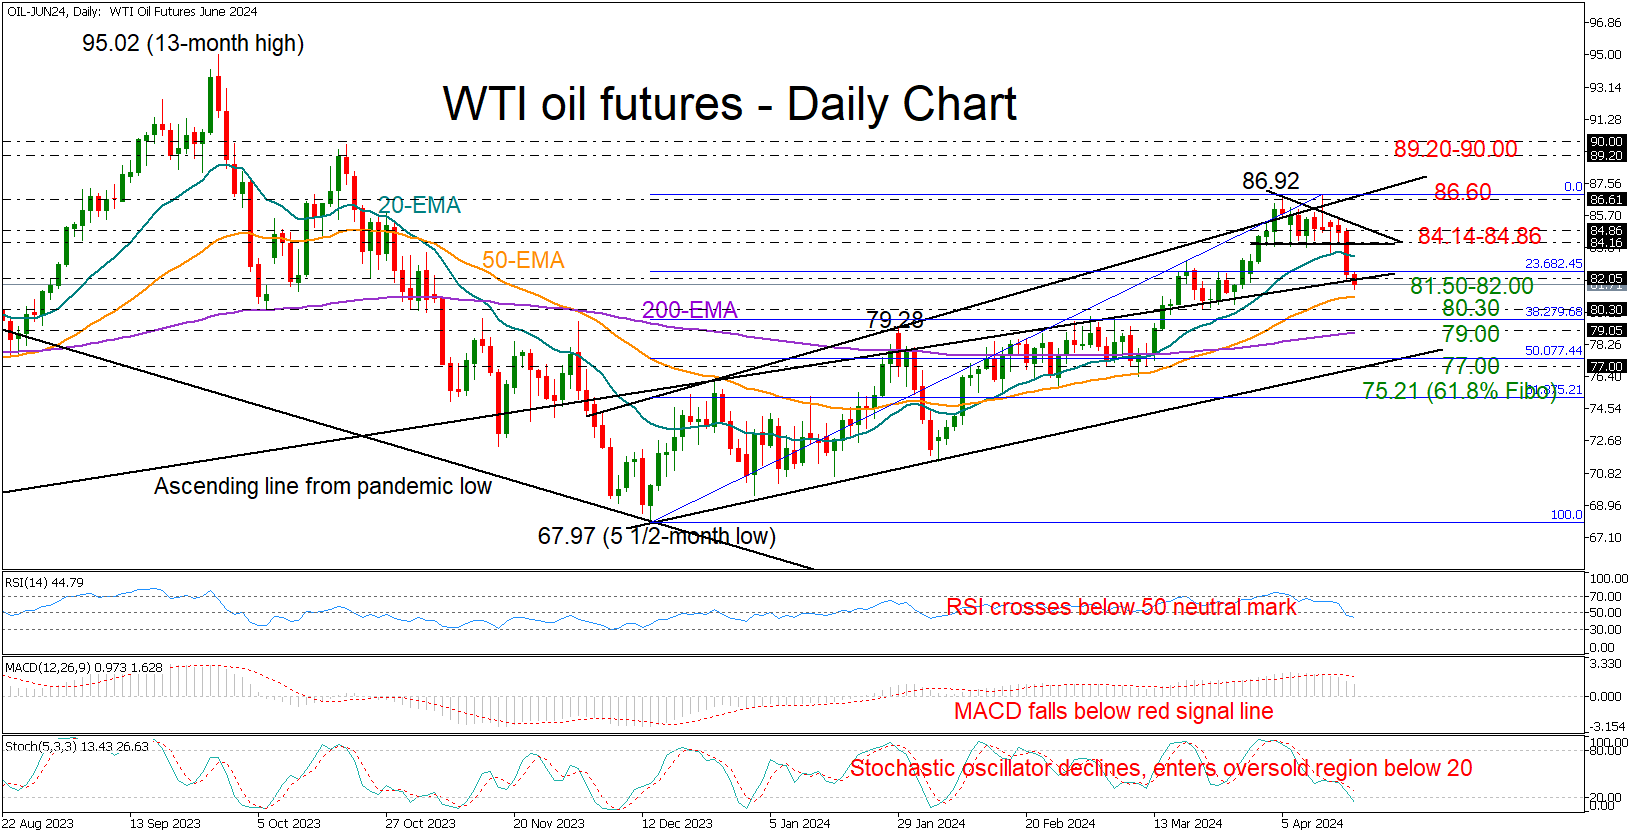
WTI oil futures tumbled by 2.8% to 82.84 on Wednesday, experiencing one of their biggest daily losses so far this year after a short-period of consolidation.
The price slid below the key support of 84.14 and the 20-day exponential moving average (EMA), dissolving a descending triangle to the downside. This is usually a bearish chart pattern, indicating a potential trend reversal. In other discouraging signals, the negative slope in the RSI and the falling MACD are backing the ongoing selling appetite in the market.
Yet, with the stochastic oscillator entering the oversold territory below 20, selling pressures could prove short-lived, particularly if the nearby constraining line from the pandemic lows and the 50-day EMA halt the decline within the 81.50-82.00 area.
In the event the bears dominate below 81.50, they could head for the previous low of 80.30. Falling lower, the price might initially take a breather around the 200-day EMA at 79.00 before stretching towards the critical support trendline seen at 77.00. A decisive close below the latter might attract greater attention, as such a correction would violate the 2024 upward pattern, bringing the 61.8% Fibonacci of 75.21 next into view.
In the bullish scenario, the price bounces back above the 23.6% Fibonacci of 82.45, it could initially retest triangle's boundaries within the 84.14-84.86 area. The resistance line drawn from December could be the next target near 86.60. If the bulls claim that bar this time, the rally could pick up steam towards the 89.20-90.00 zone.
In short, it appears that there is a resurgence of selling interest in WTI oil futures. Nevertheless, traders would like a confirmation below 81.50 to target lower levels.
WTI: Oil Prices Fall Further on Rising Demand Concerns
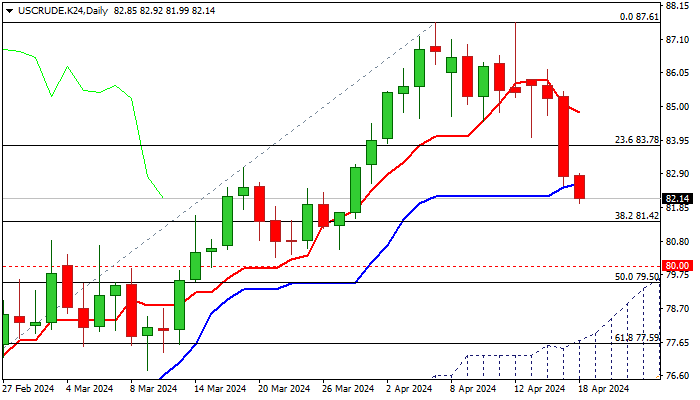
WTI oil price dips further in early Thursday, in extension of previous day’s 3% drop (the second biggest daily loss in 2024) and hit new three-week low.
Stronger than expected rise in US crude inventories (EIA report) further raised concerns about oil demand, while fears about escalation of the conflict in the Middle East faded, pushing the price sharply lower.
Initial reversal signal is developing on daily chart, as price broke below daily Tenkan-sen and Kijun-sen lines, pressuring pivotal Fibo support at $81.42 (38.2% of $71.40/$87.61 upleg), violation of which to risk extension towards key supports at $80 zone (psychological / converged 55/200 DMA’s).
Weakening daily studies (10/20DMA’s turned to bearish setup and 14-d momentum broke into negative territory) support the action however, bears may face headwinds en-route to $81.42 target on oversold conditions.
Upticks should be capped under $84.00 resistance zone (broken Fibo 23.6% / 20DMA) to keep fresh bears in play for possible deeper correction.
Fundamentals are likely to remain oil’s key driver and markets will continue to focus on demand and the situation in the Middle East.
Res: 82.77; 83.10; 83.78; 84.15.
Sup: 81.42; 80.80; 80.80; 79.50.
GBP/JPY Daily Outlook
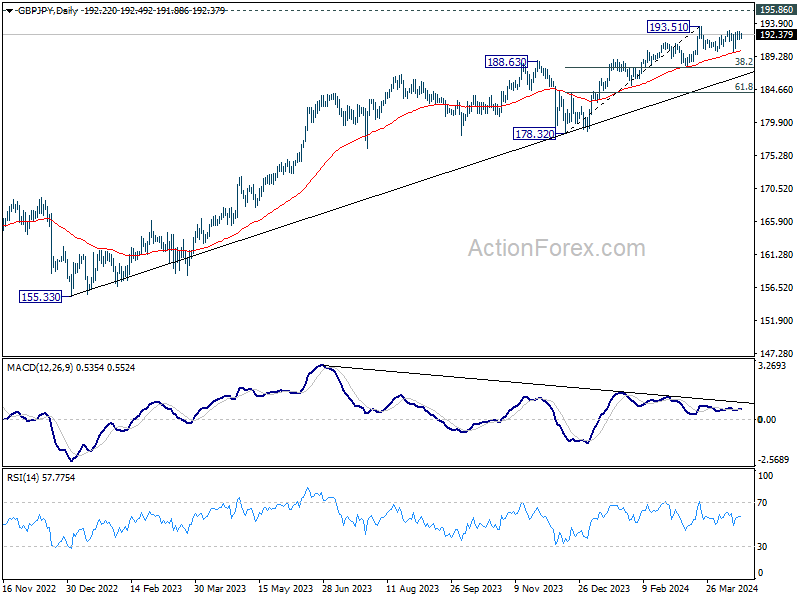
Daily Pivots: (S1) 191.70; (P) 192.27; (R1) 192.86; More..
Range trading continues in GBP/JPY and intraday bias stays neutral. On the upside, break of 193.51 will resume larger up trend to 195.86 long term resistance. Nevertheless, decisive break of 189.97 support will indicate that it's at least correcting the rise from 178.32, and target 38.2% retracement of 178.32 to 193.51 at 187.70.
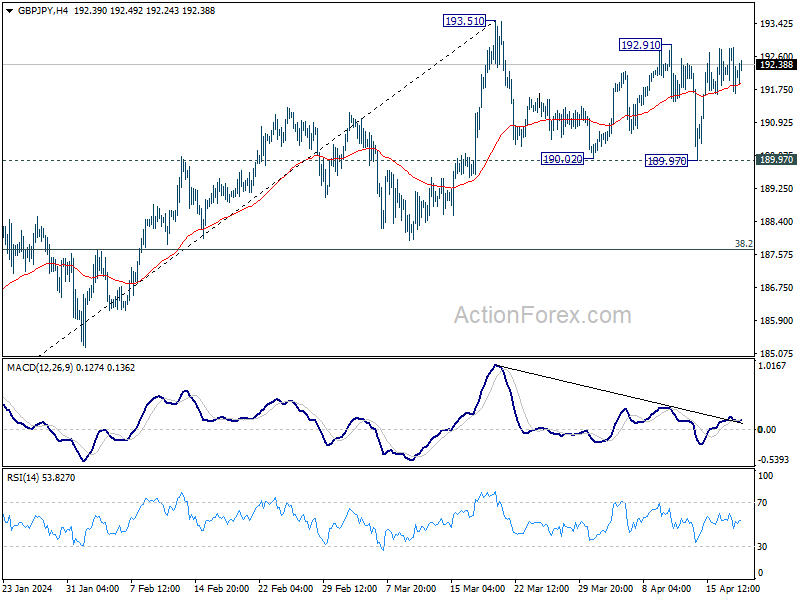
In the bigger picture, current rally is part of the up trend from 123.94 (2020 low), and is in progress for 195.86 long term resistance (2015 high). Break of 187.94 support is needed to be the first sign of medium term topping. Otherwise, outlook will remain bullish in case of retreat.