Sample Category Title
Optimism from Stock Markets Has Driven Crypto Prices Higher
Market Overview
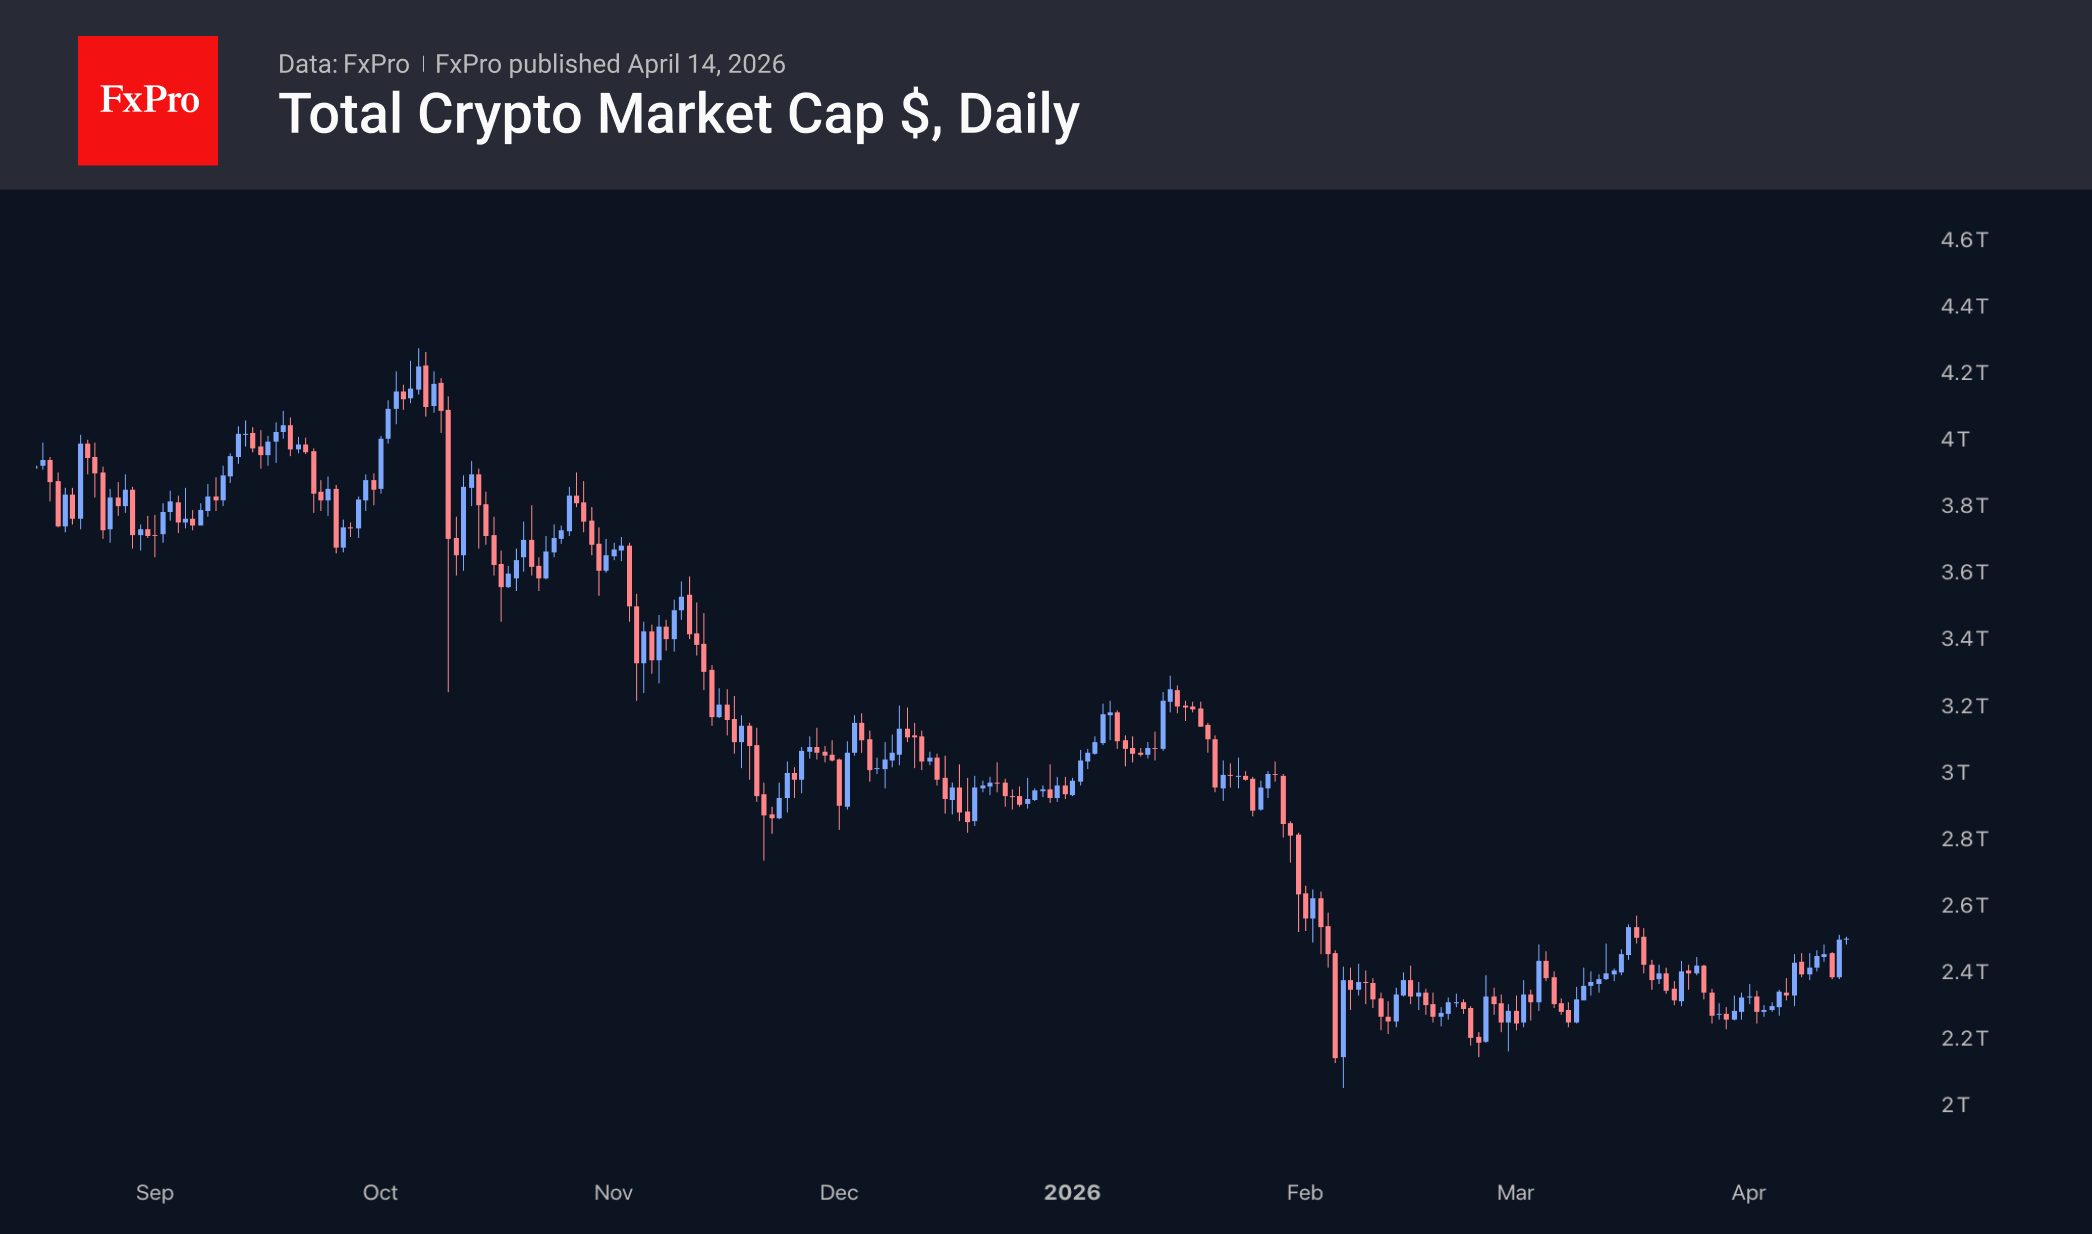
The crypto market capitalisation rose by 4.53% over the past 24 hours to $2.52 trillion. The rise in cryptocurrencies was driven by an impressive recovery in risk appetite in traditional financial markets, with the Nasdaq 100 up 2.5% from its opening levels. The day’s top performers were Algorand (+9.4%), Ethereum (+7.6%) and Aptos (+6.2%). Underperforming the market were Dash (−6.3%), Zcash (−3%) and Tron (+0.2%).
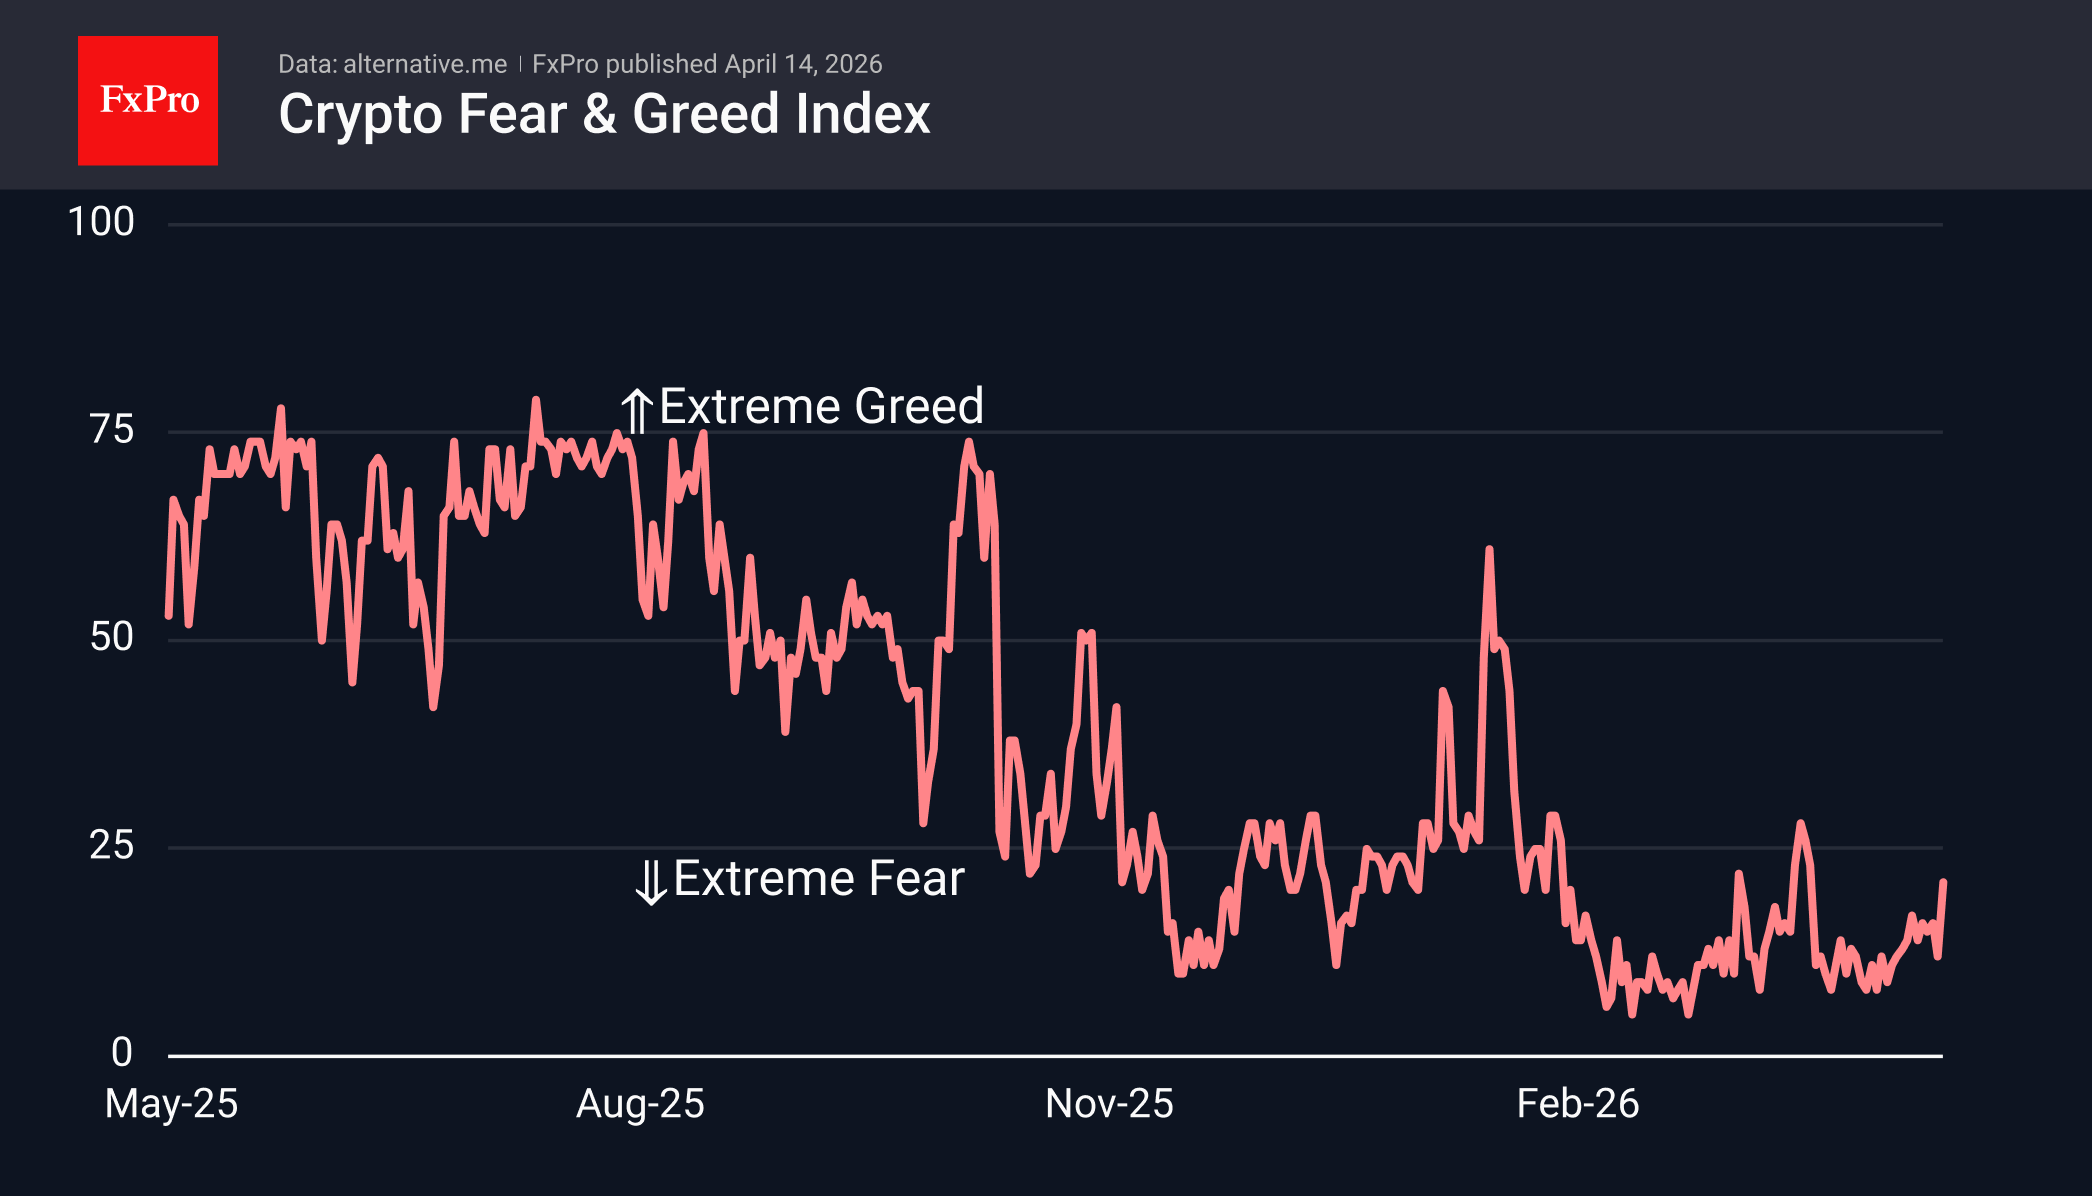
The Fear and Greed Index surged to 21 (Extreme Fear) from 12 yesterday — the largest single-day jump in recent weeks. The indicator remains in the extreme fear zone, though the trend is clearly improving in line with the market’s rise.
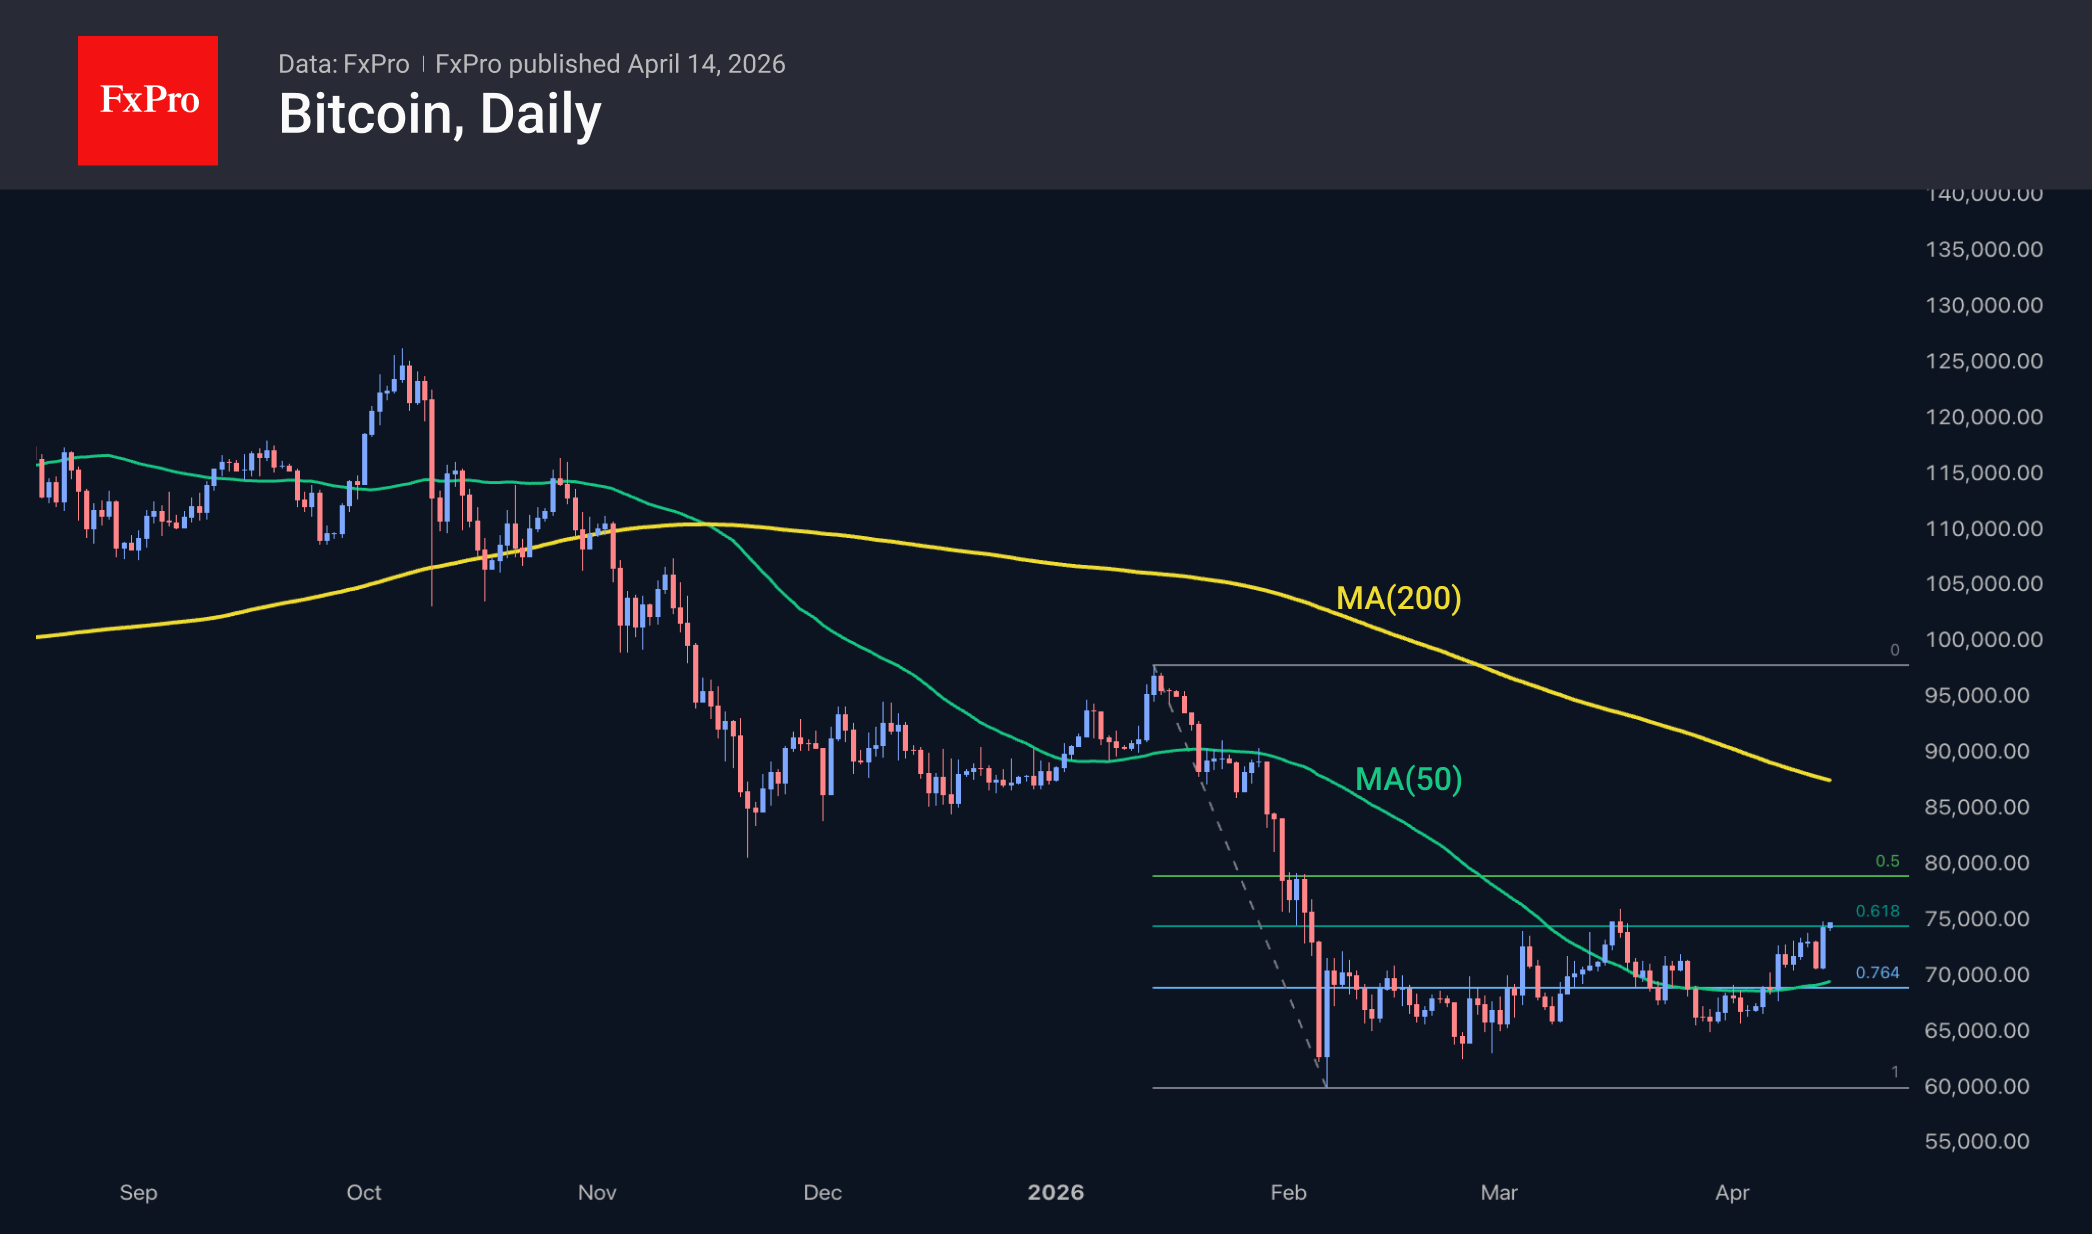
Bitcoin’s price has surpassed $74K, returning to last month’s highs and beginning an assault on the 61.8% Fibonacci retracement level from the January–February slump. A victory for the bulls in this battle will pave an easier path to the $87K–$90K range, where the 200-day MA and the November–January support are located. Optimism in global markets increases the chances of reaching these heights in the coming days, but before rising above $90K, Bitcoin may require a lengthy period of consolidation and cooling off.
News Background
According to CoinShares, global investment in crypto funds rose by $1.118 billion last week, the highest since mid-January. Investments in Bitcoin increased by $872 million, in Ethereum by $197 million, and in XRP by $19 million. Investments in Solana fell by $3 million, and in Sui by $2 million.
CoinShares suggests that the significant inflow of funds was driven by easing geopolitical tensions and weaker-than-expected US consumer price index data. The Bitcoin short position segment recorded its largest inflow since November 2024, indicating continued hedging activity.
Institutional investors have strengthened their presence in the crypto market this year, whilst retail investors have been exiting it, notes Exodus. According to MN Fund founder Michael van de Poppe, retail investors are no longer interested in cryptocurrencies; the current cycle is institutional, and it will last longer.
Bitcoin mining is becoming increasingly centralised, with computing power concentrated in the hands of a few major players. Meanwhile, the artificial intelligence sector is moving in the opposite direction, notes Galaxy Research.
Strategy has increased its BTC purchases by almost threefold over the past week. The company bought an additional 13,927 BTC last week for $1 billion — at an average price of $71,900 per coin. Strategy now holds 780,897 BTC, purchased for $59 billion at an average price of $75,600 per Bitcoin.
BitMine acquired a further 71,524 ETH for $156.4 million over the past week. The company’s reserves have exceeded 4.8 million ETH — representing 4.04% of the Ethereum supply.
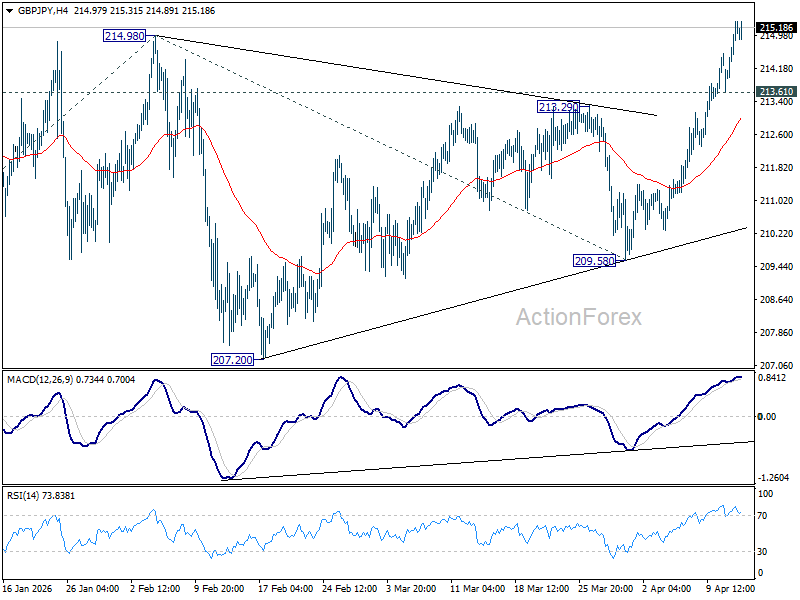
GBP/JPY Daily Outlook
Daily Pivots: (S1) 214.23; (P) 214.80; (R1) 215.93; More...
GBP/JPY's break of 214.98 confirms up trend resumption. Intraday bias stays on the upside for 61.8% projection of 199.04 to 214.98 from 209.58 at 219.43. On the downside, below 213.61 minor support will turn intraday bias neutral again first.
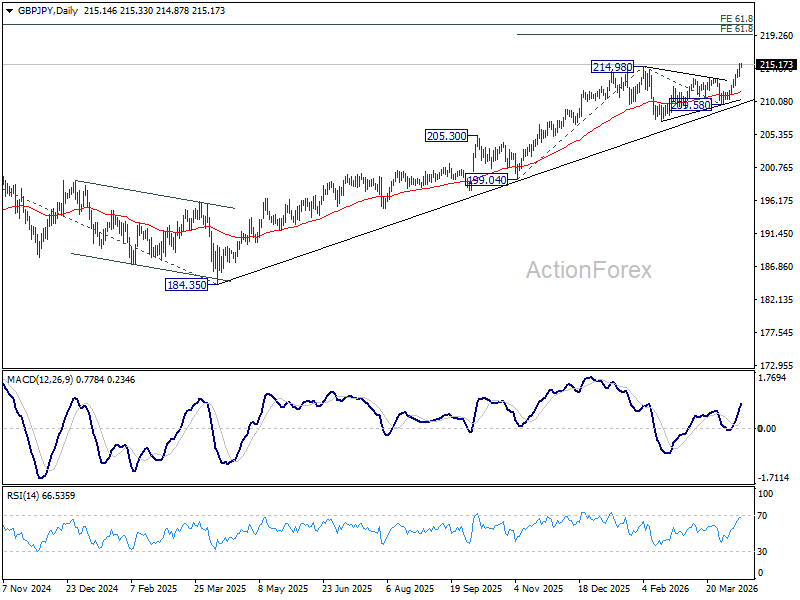
In the bigger picture, up trend from 123.94 (2020 low) is still in progress. Firm break of 214.98 will target 61.8% projection of 148.93 (2022 low) to 208.09 (2024 high) from 184.35 at 220.90. This will remain the favored case as long as 55 W EMA (now at 204.47) holds, even in case of another deep pullback.
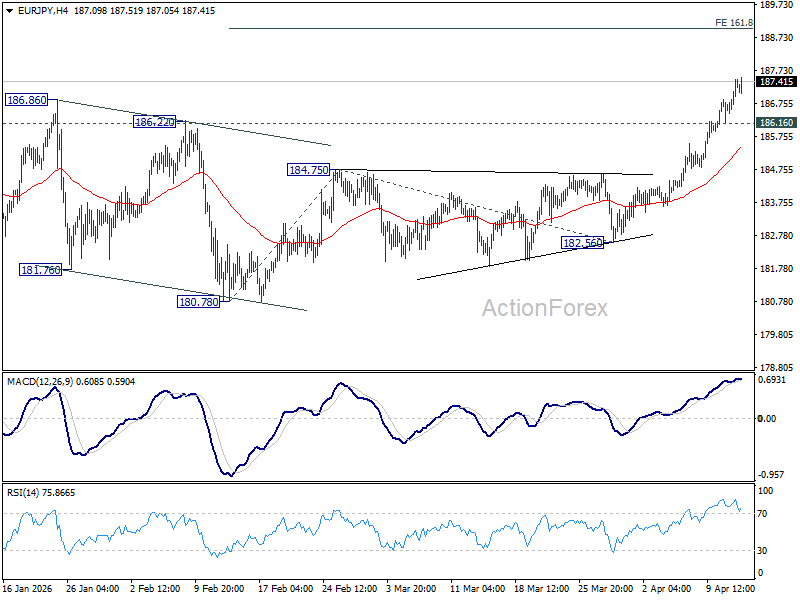
EUR/JPY Daily Outlook
Daily Pivots: (S1) 186.62; (P) 187.08; (R1) 187.96; More...
EUR/JPY's up trend continues today and intraday bias remains on the upside for 161.8% projection of 180.78 to 184.75 from 182.56 at 188.98 next. On the downside, below 186.16 minor support will turn intraday bias neutral first. But near term outlook will stay bullish as long as 184.75 resistance turned support holds, in case of retreat.
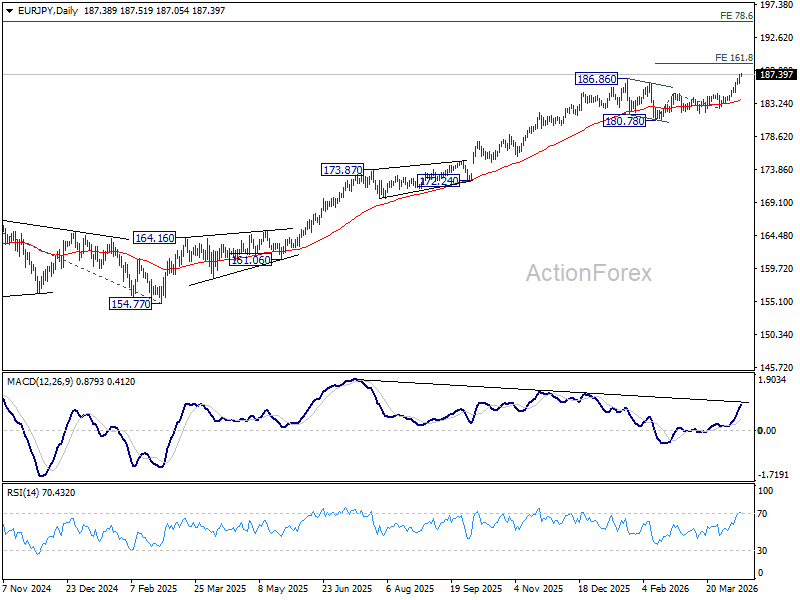
In the bigger picture, up trend from 114.42 (2020 low) in in progress and should be ready to resume. Next target is 78.6% projection of 124.37 (2022 low) to 175.41 (2025 high) from 154.77 at 194.88 next. For now, medium term outlook will stay bullish as long as 175.41 resistance turned support holds, even in case of deeper pullback.
EUR/GBP Daily Outlook
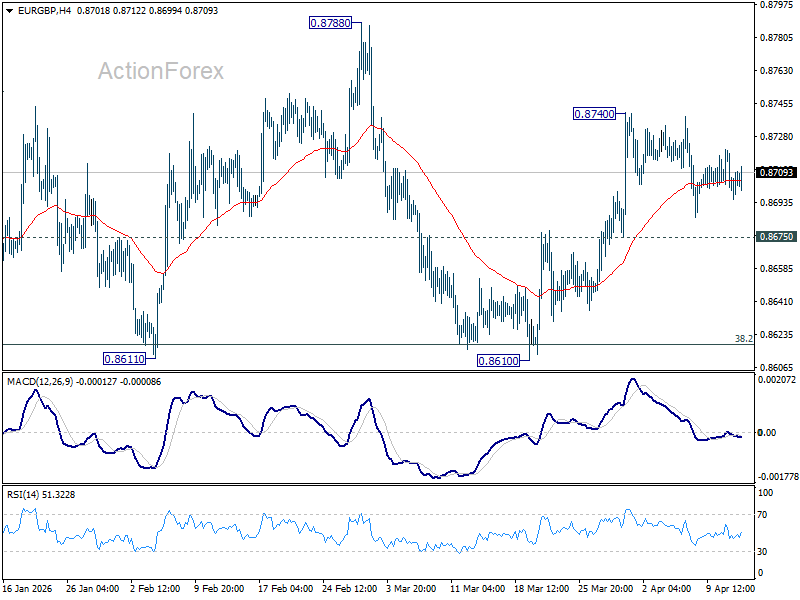
Daily Pivots: (S1) 0.8691; (P) 0.8711; (R1) 0.8725; More…
EUR/GBP is extending consolidation pattern from 0.8740 and intraday bias stays neutral. Further rise is mildly in favor as long as 0.8675 support holds. Break of 0.8740 will resume the rebound from 0.8610 to 0.8788 resistance. However, firm break of 0.8675 will turn bias back to the downside for retesting 0.8610 low instead.
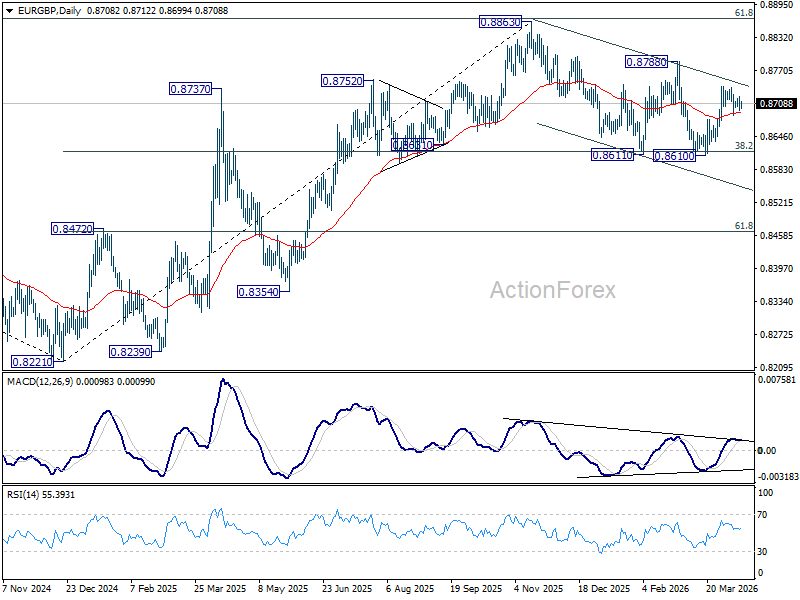
In the bigger picture, strong support was seen again from 38.2% retracement of 0.8821 to 0.8863 at 0.8618. Break of 0.8788 resistance will argue that larger rise from 0.8221 might be ready to resume through 0.8863 (2025 high). Nevertheless, sustained trading below 0.8618 should confirm bearish reversal, and bring deeper fall to 61.8% retracement at 0.8466 at least.
EUR/AUD Daily Outlook
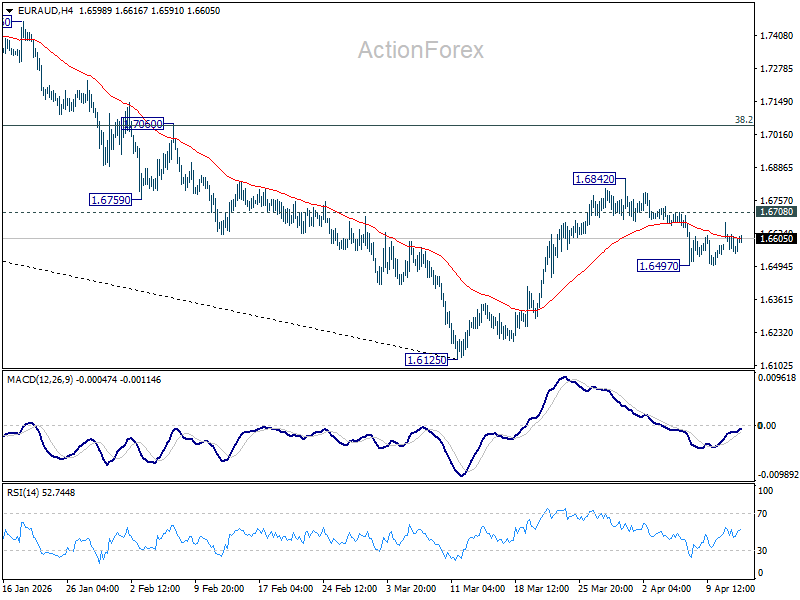
Daily Pivots: (S1) 1.6514; (P) 1.6607; (R1) 1.6666; More...
Intraday bias in EUR/AUD remains neutral. Outlook is unchanged that rebound from 1.6125 could have completed at 1.6842, after rejection by 55 D EMA (now at 1.6720). Below 1.6497 will bring retest of 1.6125 low first. Nevertheless, firm break of 1.6708 will should resume the rebound from 1.6125 through 1.6842 to 38.2% retracement of 1.8554 to 1.6125 at 1.7053.
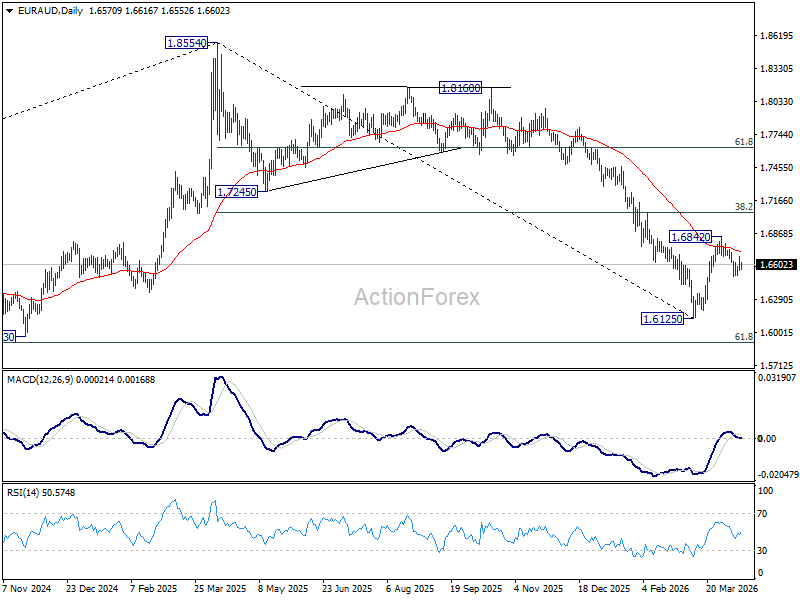
In the bigger picture, fall from 1.8554 (2025 high) is in progress and deeper decline should be seen to 61.8% retracement of 1.4281 to 1.8554 at 1.5913, which is slightly below 1.5963 structural support. Decisive break there will pave the way back to 1.4281 (2022 low). For now, risk will stay on the downside as long as 55 W EMA (now at 1.7163) holds, even in case of strong rebound.
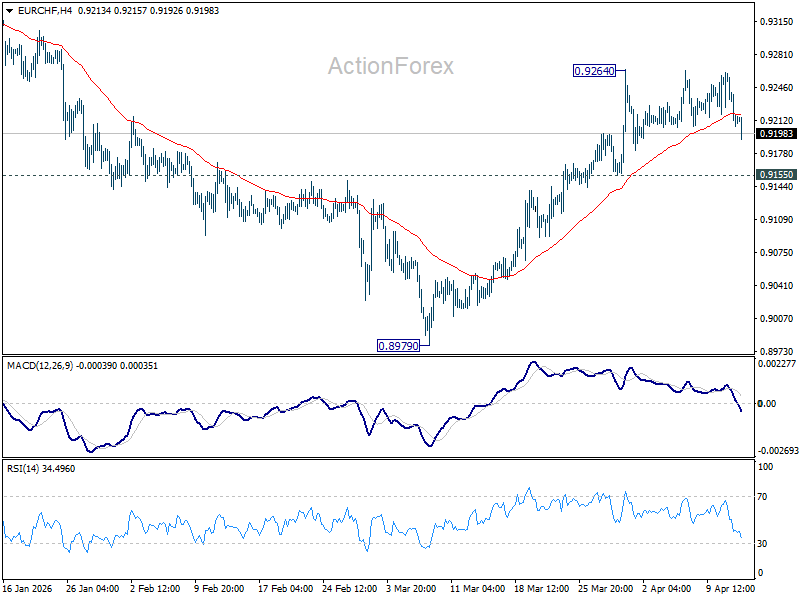
EUR/CHF Daily Outlook
Daily Pivots: (S1) 0.9194; (P) 0.9231; (R1) 0.9254; More....
EUR/CHF is extending consolidation from 0.9264 with another fall, and intraday bias stays neutral. Further rise is expected with 0.9155 support intact. Firm break of 0.9264 will resume the rebound from 0.8979 to 0.9394 resistance next. However, break of 0.9155 will turn bias back to the downside for deeper pullback.
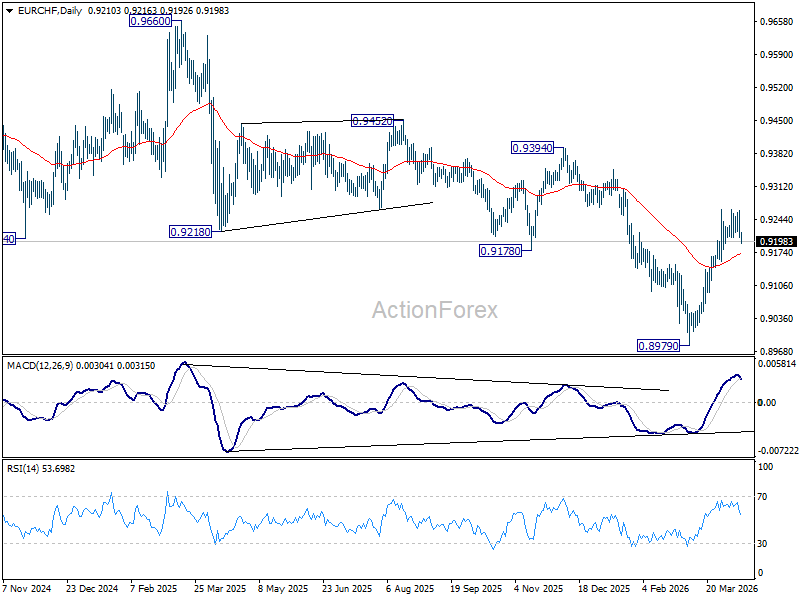
In the bigger picture, considering bullish convergence condition in W MACD, a medium term bottom should be in place at 0.8979. Sustained trading above 55 W EMA (now at 0.9281) will add more credence to this case. Further break of 0.9394 resistance will pave the way to 0.9660 resistance next. However rejection by the 55 W EMA will set up another fall through 0.8979 low at a later stage.
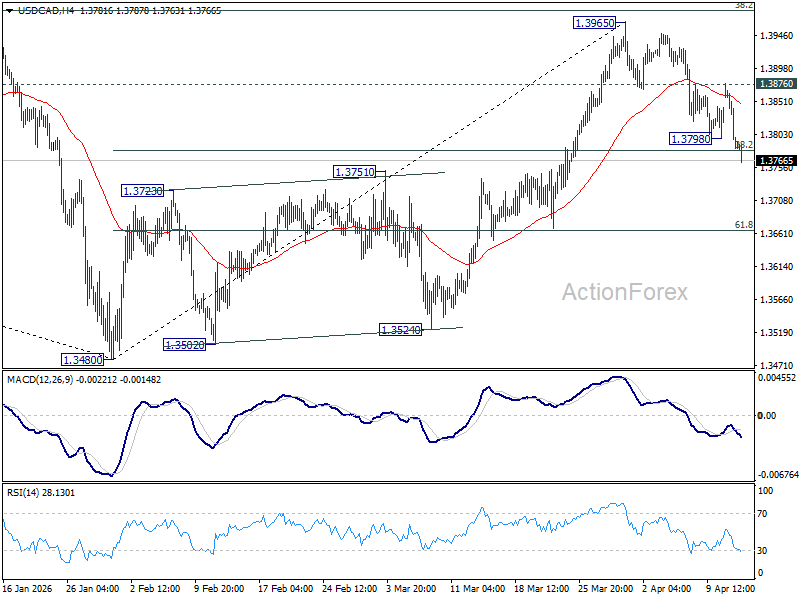
USD/CAD Daily Outlook
Daily Pivots: (S1) 1.3759; (P) 1.3819; (R1) 1.3851; More...
USD/CAD's fall from 1.3965 resumed by breaking through 1.3798 temporary low. Intraday bias is back on the downside. Sustained trading below 38.2% retracement of 1.3840 to 1.3965 at 1.3780 will argue that the rebound from 1.3840 has completed, and bring deeper decline to 61.8% retracement at 1.3665 and below. On the upside, above 1.3876 resistance will turn bias neutral again first.
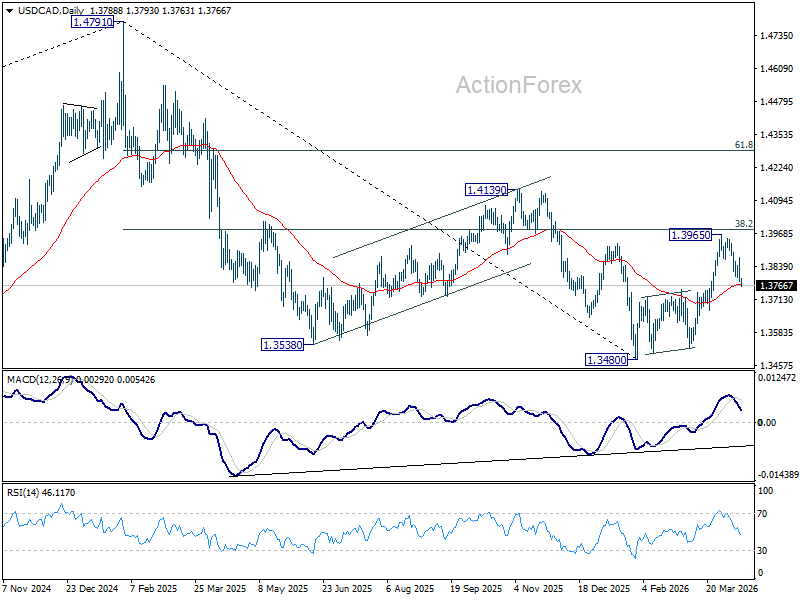
In the bigger picture, price actions from 1.4791 are seen as a corrective pattern to the whole up trend from 1.2005 (2021 low). Deeper fall could be seen, as the pattern extends, to 61.8% retracement of 1.2005 to 1.4791 at 1.3069. However, decisive break of 38.2% retracement of 1.4791 to 1.3480 at 1.3981 will argue that the correction has completed with three waves down to 1.3480 already. Further break of 1.4139 will confirm and bring retest of 1.4791 high.
AUD/USD Daily Report
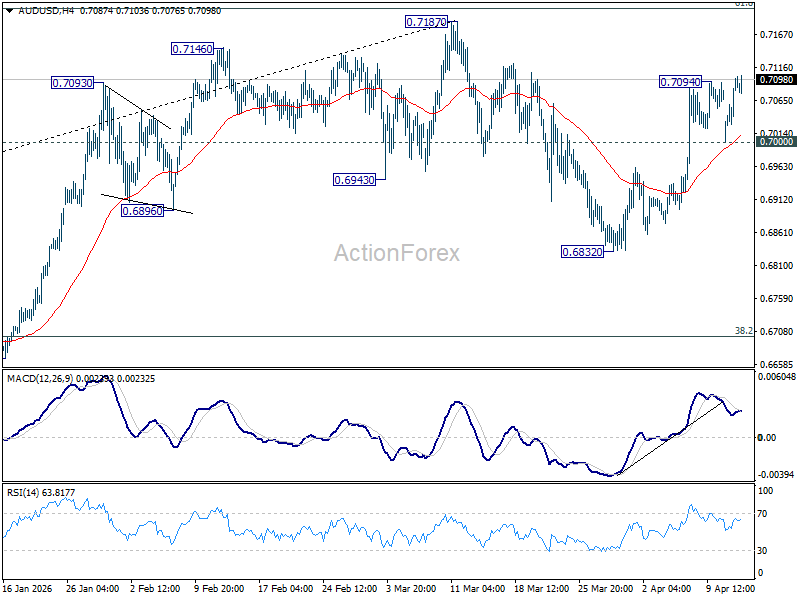
Daily Pivots: (S1) 0.7023; (P) 0.7062; (R1) 0.7136; More...
Intraday bias in AUD/USD is back on the upside with break of 0.7094 temporary top. Rebound from 0.6832 is resuming for 0.7187 high. Strong resistance could be seen there on first attempt. On the downside, below 0.7000 support will turn intraday bias neutral again first.
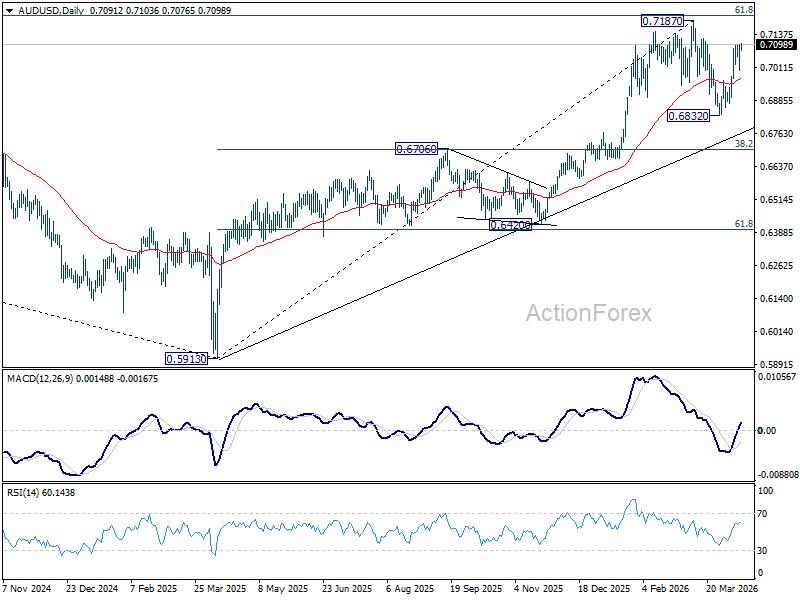
In the bigger picture, as long as 0.6706 cluster support holds, rise from 0.5913 (2024 low) should still be in progress. Decisive break of 61.8% retracement of 0.8006 to 0.5913 at 0.7206 will solidify the case that it's already reversing the down trend from 0.8006 (2021 high). However, firm break of 0.6706 will dampen this bullish case, and bring deeper fall back to 0.6420 support, and possibly below.
USD/JPY Daily Outlook
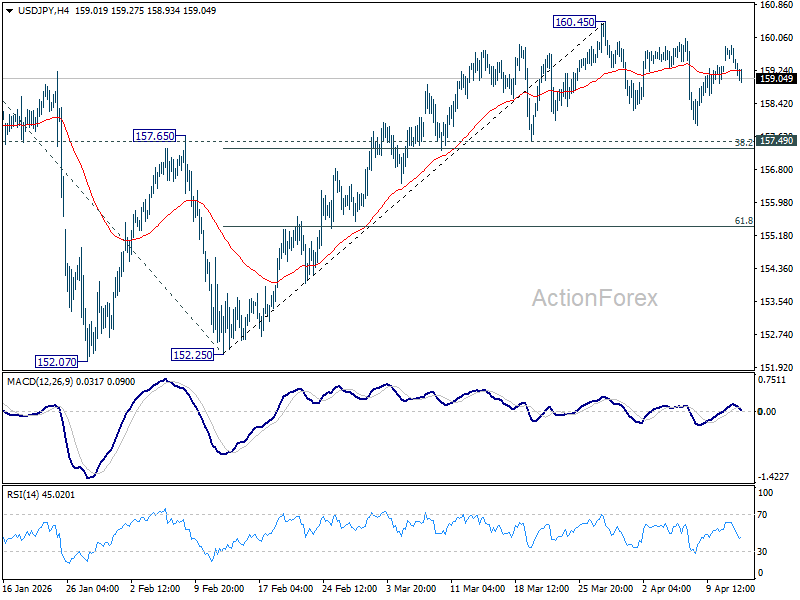
Daily Pivots: (S1) 159.21; (P) 159.53; (R1) 159.78; More...
USD/JPY is still extending consolidations from 160.45 and intraday bias remains neutral. Outlook will stay bullish as long as 157.49 cluster support (38.2% retracement of 152.25 to 160.45 at 157.31) holds. On the upside break of 160.45 will target a retest on 161.94 high. However, firm break of 157.31/49 will bring deeper fall back to 61.8% retracement at 155.38 next.
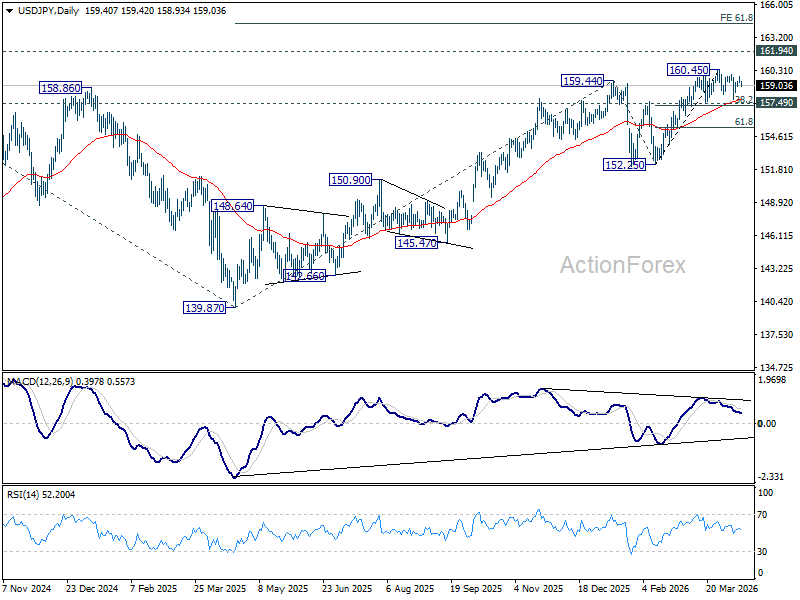
In the bigger picture, outlook is unchanged that corrective pattern from 161.94 (2024 high) should have completed with three waves at 139.87. Larger up trend from 102.58 (2021 low) could be ready to resume through 161.94. This will remain the favored case as long as 55 W EMA (now at 155.24) holds. Firm break of 161.94 will pave the way to 61.8% projection of 102.58 to 161.94 from 139.87 at 176.75.
USD/CHF Daily Outlook
Daily Pivots: (S1) 0.7801; (P) 0.7867; (R1) 0.7906; More….
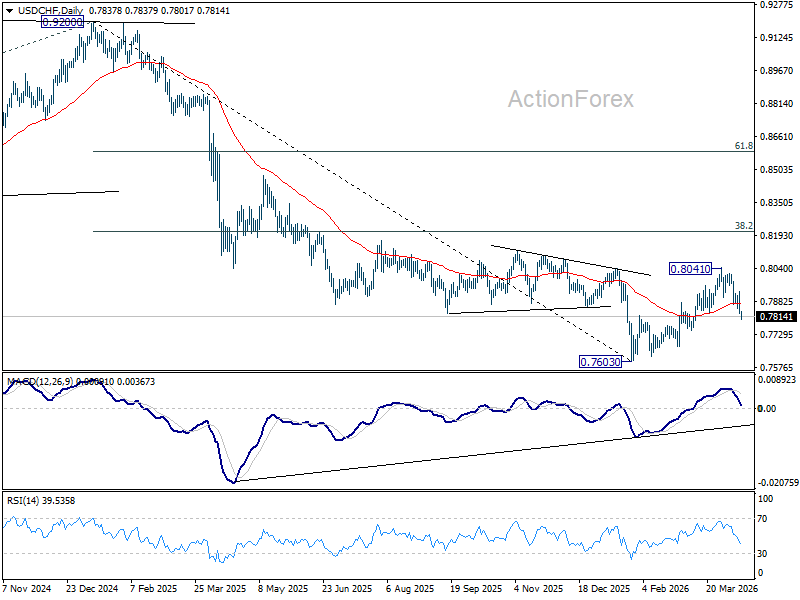
USD/CHF's fall from 0.8041 resumed by breaking through 0.7853 temporary low and intraday bias is back on the downside. Rebound from 0.7603 should have completed. Deeper decline should be seen to 61.8% retracement of 0.7603 to 0.8041 at 0.7770 . Firm break there will bring retest of 0.7603 low. For now, risk will stay on the downside as long as 0.7933 resistance holds, in case of recovery.
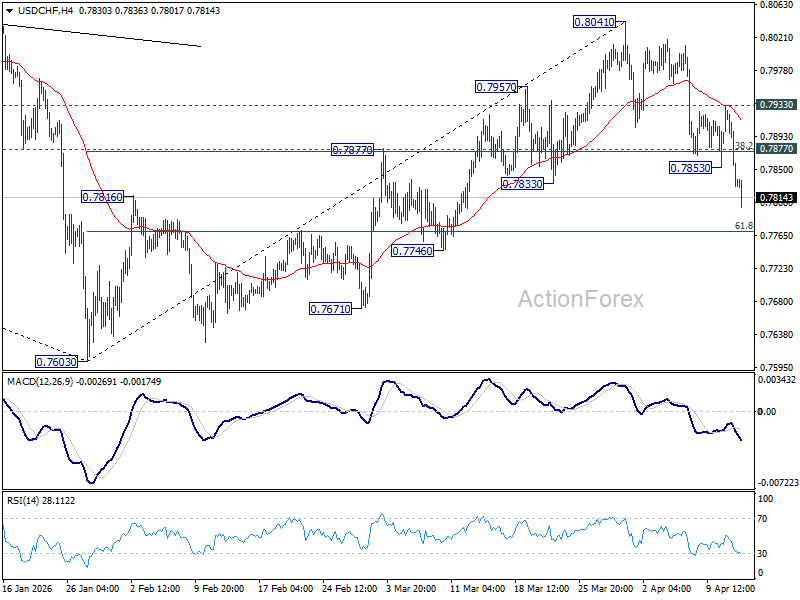
In the bigger picture, rebound from 0.7603 medium term bottom is seen as correcting the fall from 0.9200 only. Rejection by 55 W EMA (now at 0.8071) will affirm this bearish case, and setup down trend resumption to 100% projection of 1.0146 (2022 high) to 0.8332 from 0.9200 at 0.7382 at a later stage. Though, sustained break of 55 W EMA will suggest that it's probably correcting the larger scale down trend from 1.0146 (2022 high).