Sample Category Title
EUR/USD Weekly Outlook
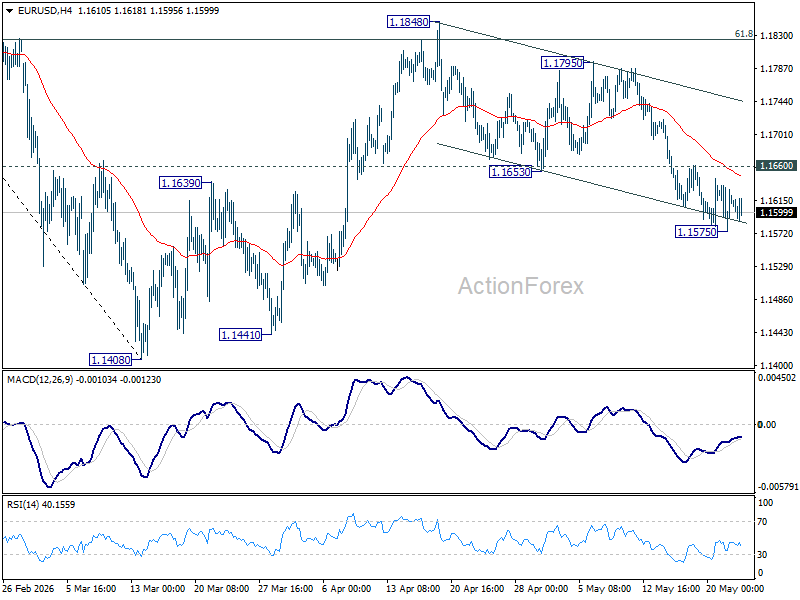
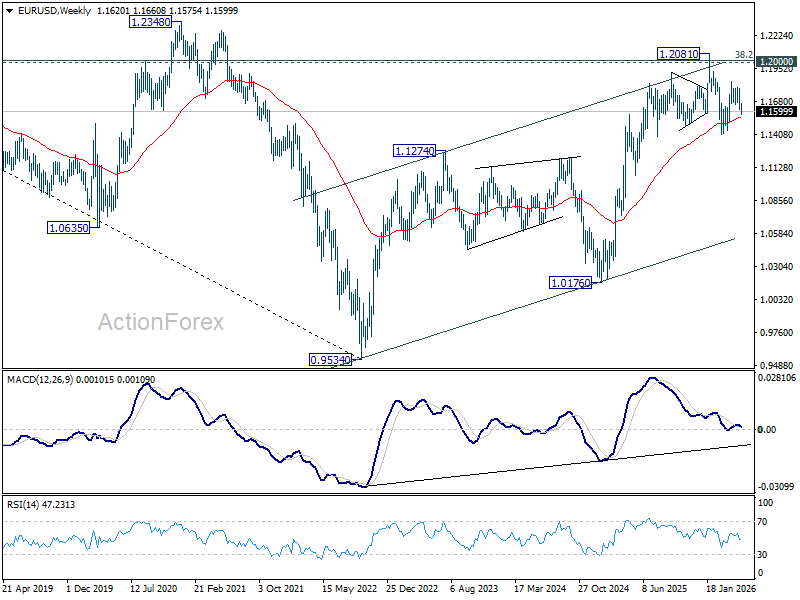
EUR/USD's extended decline suggests that corrective rebound from 1.1408 has completed at 1.1848. But as a temporary low was formed at 1.1575, initial bias remains neutral this week first. On the downside, below 1.1575 will bring deeper fall back to retest 1.1408 low. However, firm break of 1.1660 resistance will dampen this bearish view, and bring stronger rise back to 1.1795 resistance first.
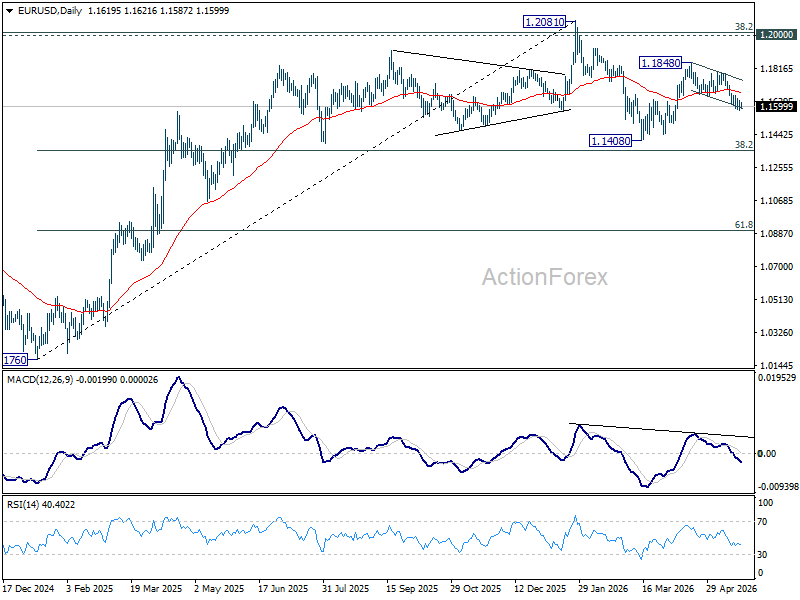
In the bigger picture, the strong support from 38.2% retracement of 1.0176 to 1.2081 at 1.1353 suggests that the pullback from 1.2081 is more likely a corrective move. Strong support was also found in 55 W EMA (now at 1.1542). Focus is back on 1.2 key cluster resistance level. Decisive break there will carry long term bullish implications. Nevertheless, break of 1.1408 support will revive the case of medium term bearish trend reversal.
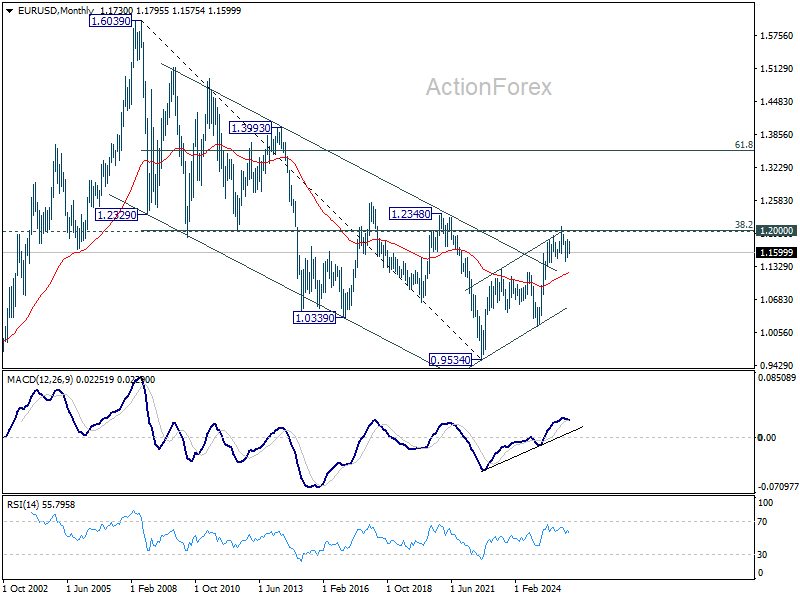
In the long term picture, 38.2% retracement of 1.6039 to 0.9534 at 1.2019, which is close to 1.2000 psychological level is the key for the outlook. Rejection by this level will keep the multi decade down trend from 1.6039 (2008 high) intact, and keep outlook neutral at best. However, decisive break of 1.2000/19, will suggest long term bullish trend reversal, and target 61.8% retracement at 1.3554.
USD/JPY Weekly Outlook
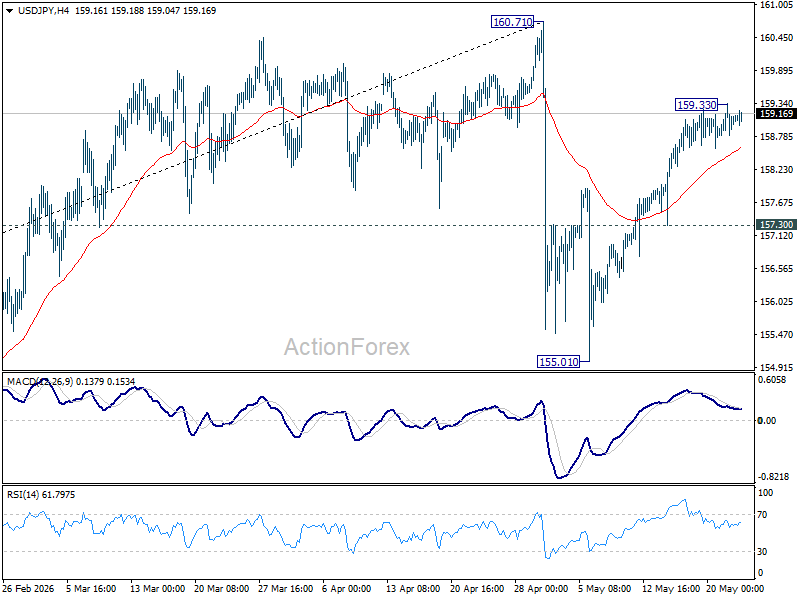
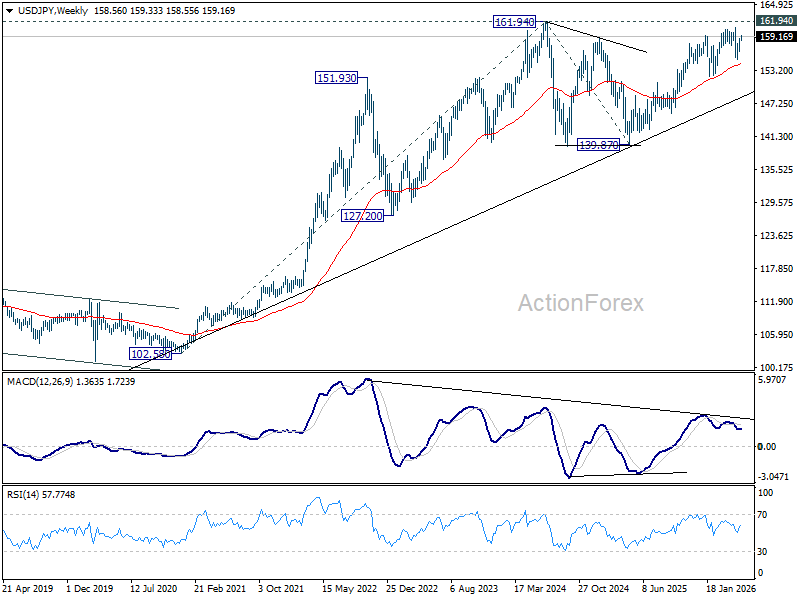
USD/JPY's rebound from 155.01 continued last week but lost momentum after hitting 159.33. Initial bias remains neutral this week first. Above 159.24 will target 160.71 high. Strong resistance is expected from there to start the third leg of the near term corrective pattern. On the downside, break of 157.30 support will turn bias to the downside for retesting 155.01.
In the bigger picture, for now, corrective pattern from 161.94 (2024 high) is still seen as completed at 139.87. Rise from there is seen as resuming the long term up trend. So, break of 161.94 is expected at a later stage to resume the long term up trend. However, sustained break of 55 W EMA (now at 154.36) will dampen this view and bring deeper fall back towards 139.87 to extend the pattern from 161.94.
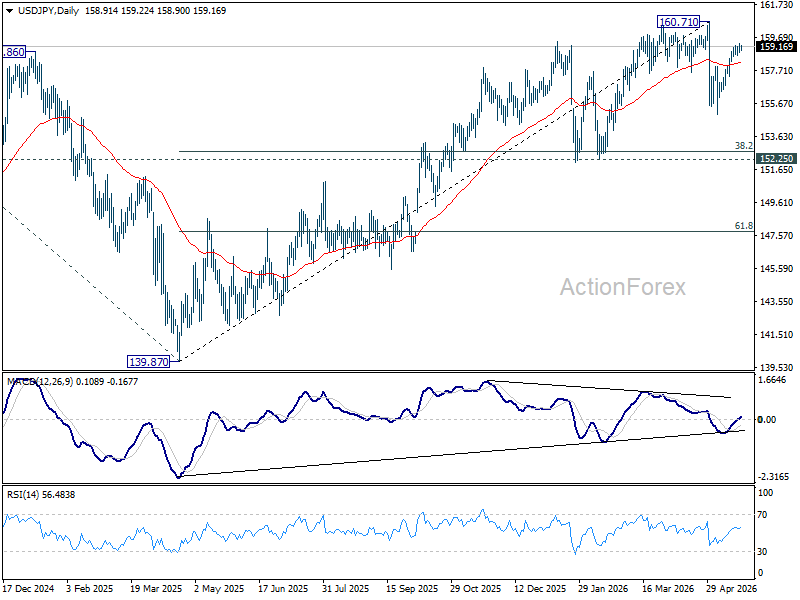
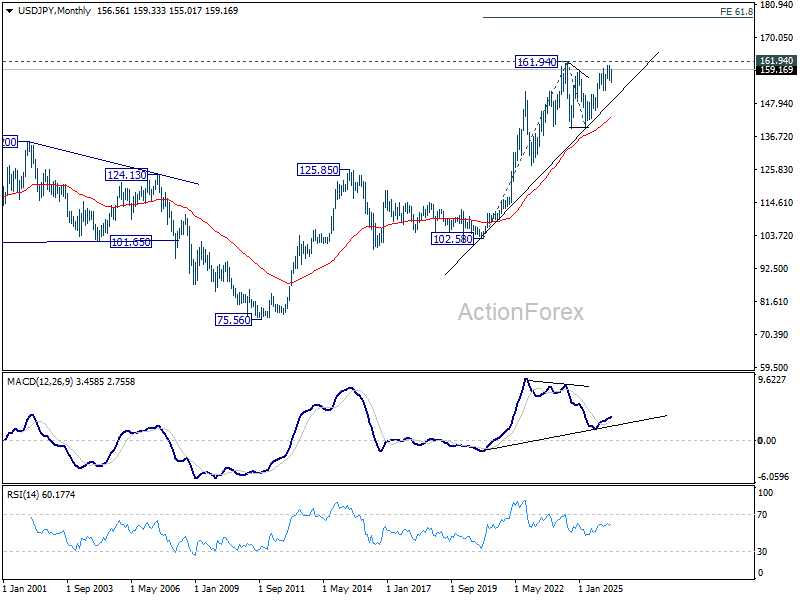
In the long term picture, up trend from 75.56 (2011 low) is still in progress and might be ready to resume. Firm break of 161.94 will target 61.8% projection of 102.58 (2020 low) to 161.94 (2024 high) from 139.87 at 176.55 in the medium term. Long term outlook will stay bullish as long as 139.87 support holds, even in case of deep pullback.
GBP/USD Weekly Outlook
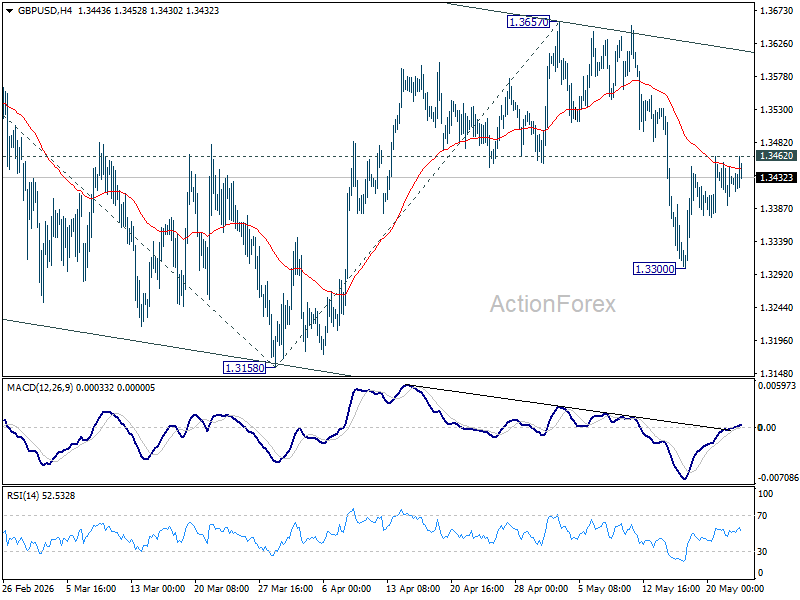
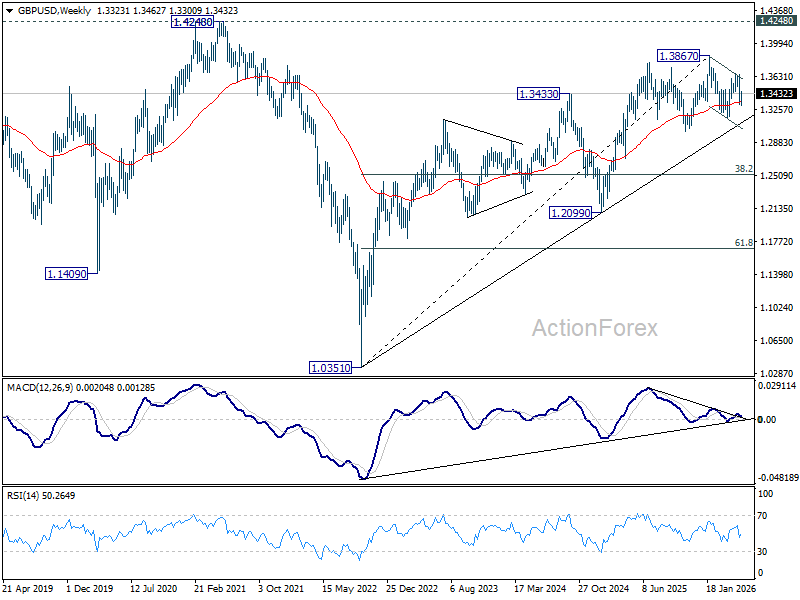
GBP/USD's recovery was capped at 1.3462 last week. Initial bias remains neutral this week first. On the downside, below 1.3300 will target a retest on 1.3158 support first. However, firm break of 1.3462 will bring stronger rebound back to 1.3657 resistance instead.
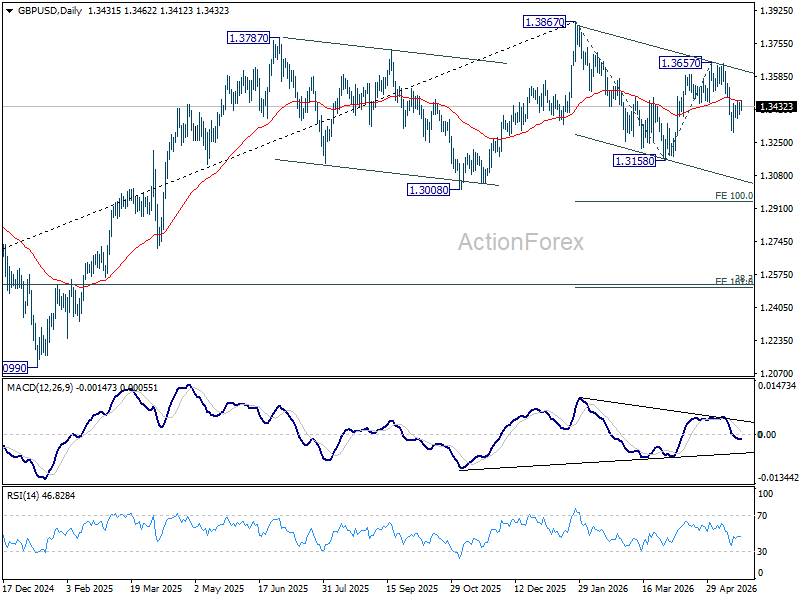
In the bigger picture, current development suggests that price actions from 1.3867 are merely a corrective pattern within the broader up trend from 1.0351 (2022 low). With 1.3008 support intact, medium term bullishness is maintained and break of 1.3867 is in favor for a later stage, towards 1.4248 key resistance (2021 high). However, firm break of 1.3008 will at least bring deeper fall to 38.2% retracement of 1.0351 to 1.3867 at 1.2524, with increased risk of bearish reversal.
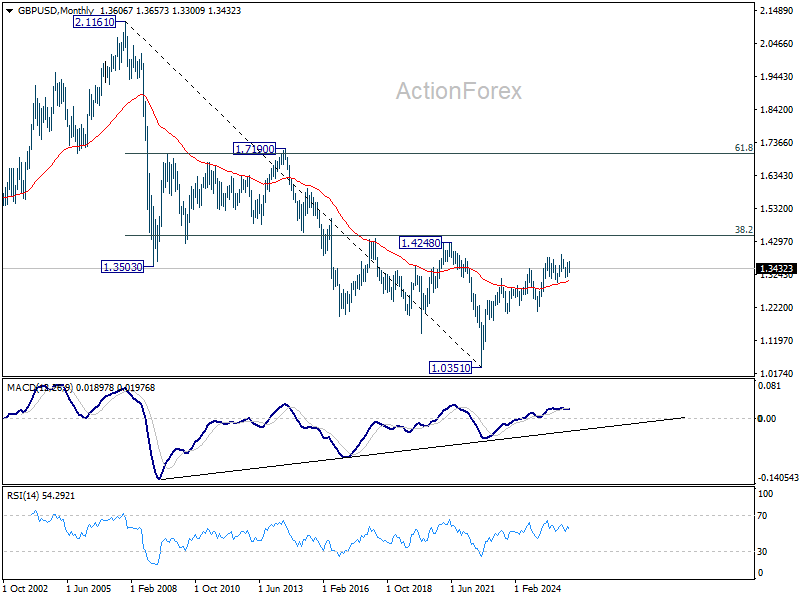
In the long term picture, as long as 1.4248/4480 resistance zone holds (38.2% retracement of 2.1161 to 1.0351 at 1.4480), the long term outlook will remain bearish. That is, price actions from 1.0351 are seen as a corrective pattern to down trend from 2.1161 (2007 high) only. Nevertheless, decisive break of 1.4248/4480 will be a strong sign of long term bullish reversal.
USD/CHF Weekly Outlook
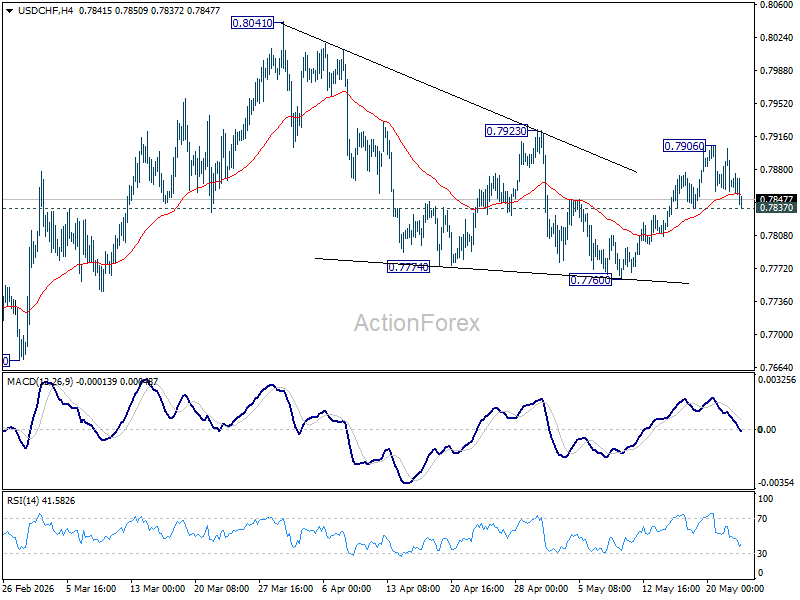
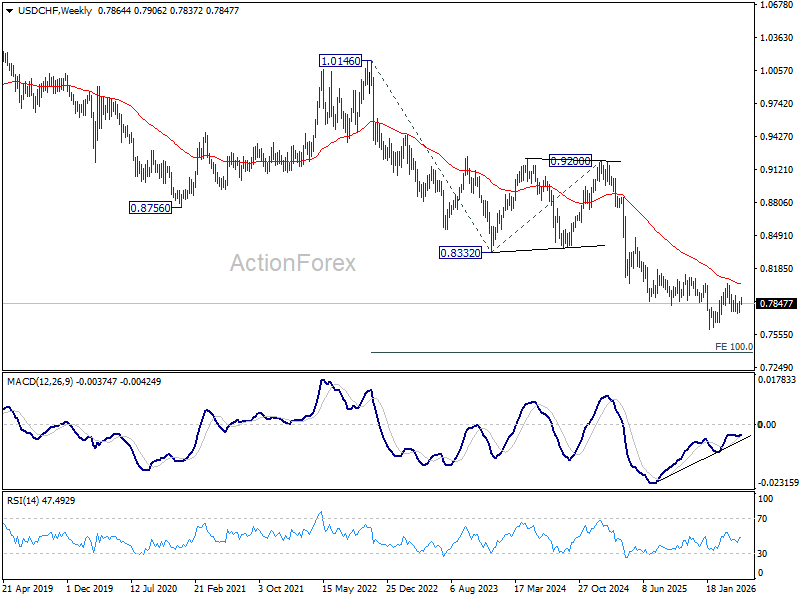
USD/CHF rebounded to 0.7906 last week but failed to break through 0.7923 resistance and retreated. Initial bias remains neutral this week first. On the downside, firm break of 0.7837 will suggest that the rebound has completed, and bring deeper fall back to 0.7760. Nevertheless, decisive break of 0.7923 will argue that that correction from 0.8741 has completed and bring stronger rally back to this resistance.
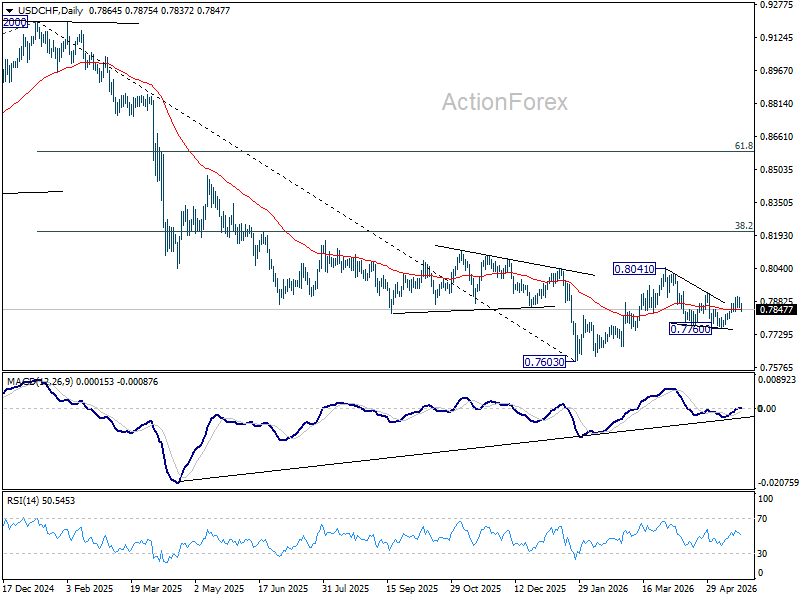
In the bigger picture, as long as 55 W EMA (now at 0.8035) holds, fall from 0.9200 is expected to continue, as part of the larger down trend. Firm break of 0.7603 will target 100% projection of 1.0146 (2022 high) to 0.8332 from 0.9200 at 0.7382.
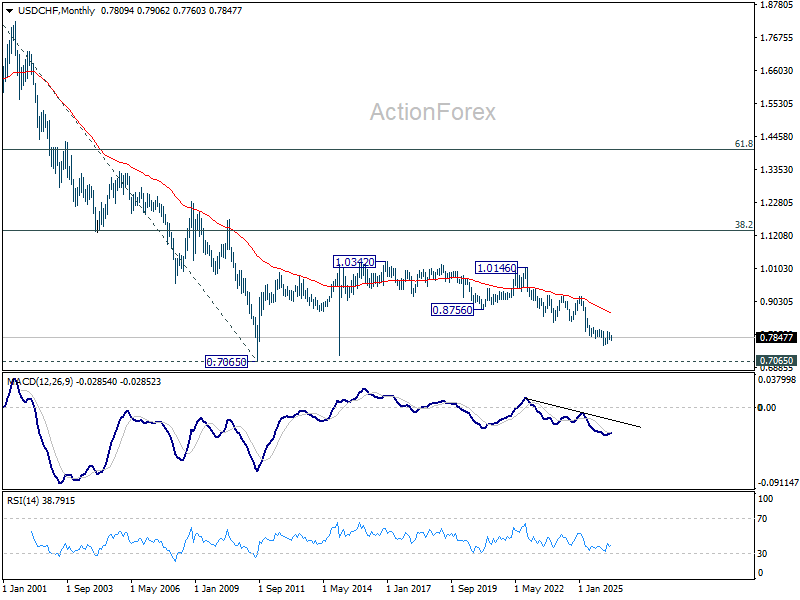
In the long term picture, price action from 0.7065 (2011 low) are seen as a corrective pattern to the multi-decade down trend from 1.8305 (2000 high). It's uncertain if the fall from 1.0342 is the second leg of the pattern, or resumption of the downtrend. But in either case, outlook will stay bearish as long as 0.8756 support turned resistance holds (2021 low). Retest of 0.7065 should be seen next.
AUD/USD Weekly Report
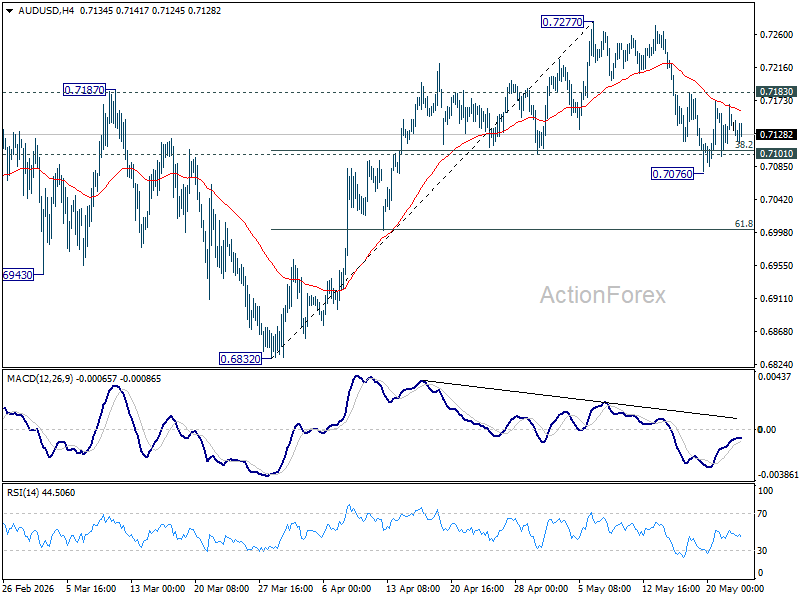
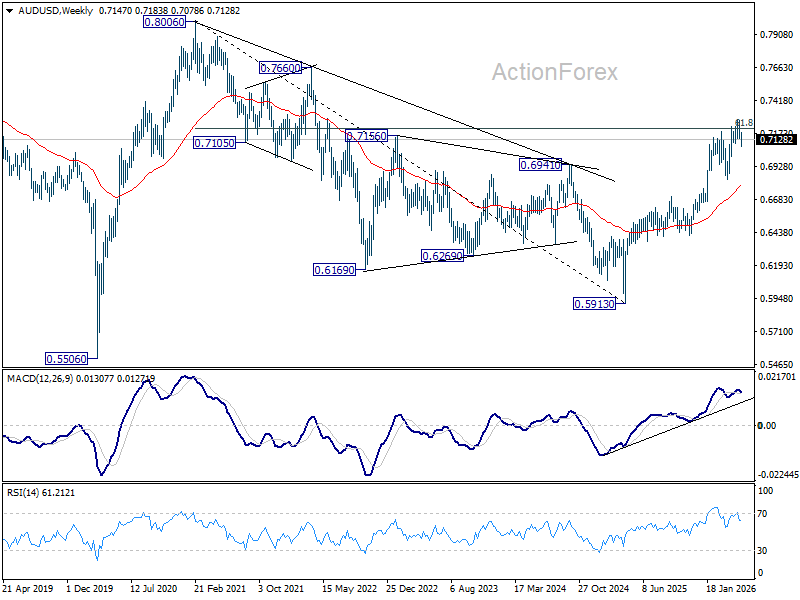
AUD/USD fell to 0.7076 last week but quickly recovered after drawing support from 0.7101. Initial bias stays neutral this week first. On the upside, firm break of 0.7183 resistance will bring stronger rebound to retest 0.7277 high. However, decisive break of 0.7076 will indicate that larger scale correction is underway and target 0.6832 support instead.
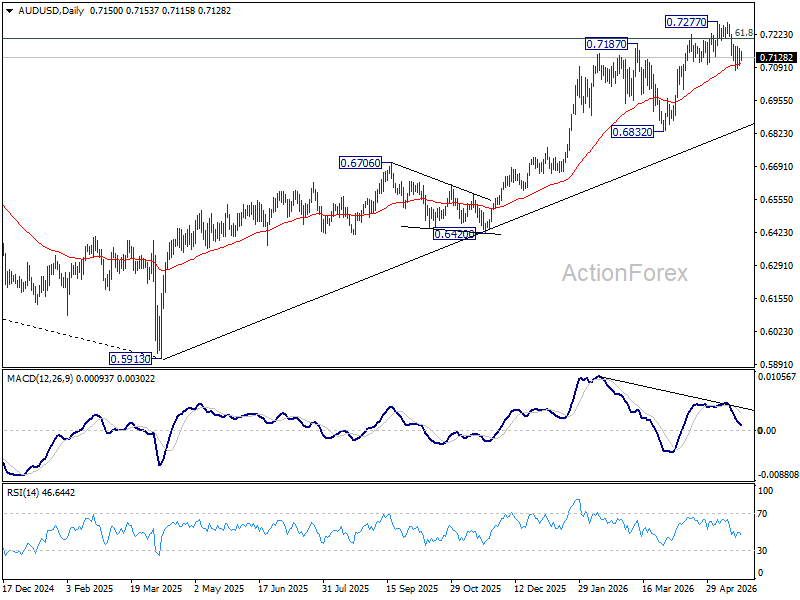
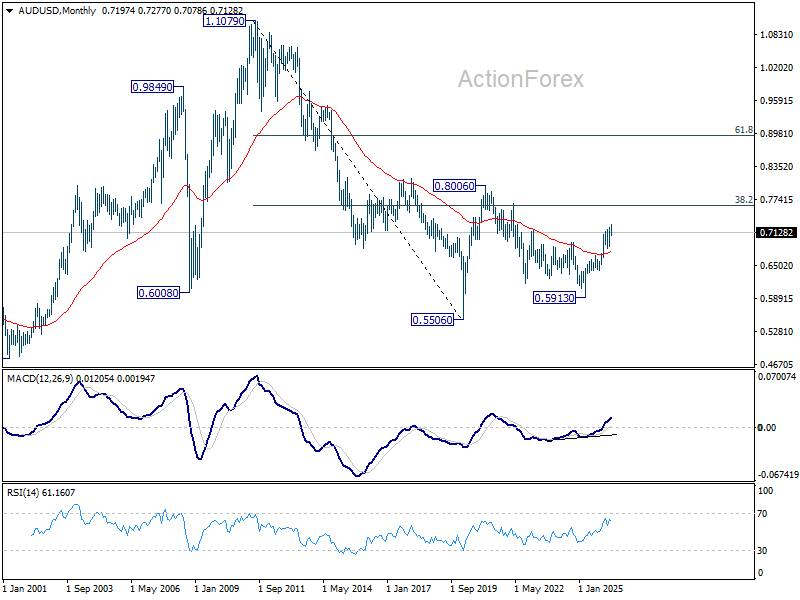
In the bigger picture, rise from 0.5913 (2024 low) is still in progress. Decisive break of 61.8% retracement of 0.8006 to 0.5913 at 0.7206 will solidify the case that it's already reversing the down trend from 0.8006 (2021 high). Further rally should then be seen to retest 0.8006. For now, outlook will remain bullish as long as 0.6832 support holds, in case of pullback.
In the long term picture, rise from 0.5913 is seen as the third leg of the whole pattern from 0.5506 (2020 low). It's still early to judge if this is an impulsive or corrective pattern. But in either case, further rise should be seen back to 0.8006 and possibly above. This will remain the favored case as long as 55 W EMA (now at 0.6790) holds.
USD/CAD Weekly Outlook
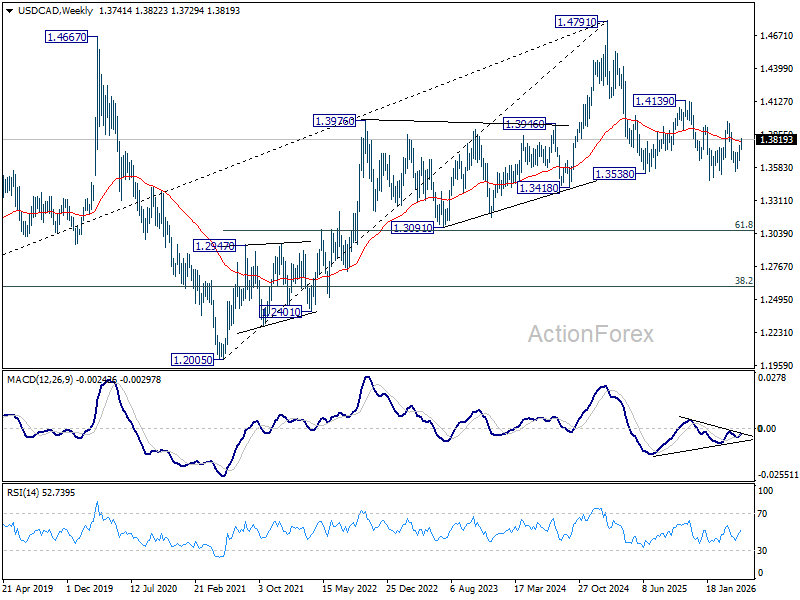
USD/CAD's rebound from 1.3549 extended higher last week. The rise is seen as the third leg of the pattern from 1.3480. Initial bias stays on the upside for 1.3965 resistance next. On the downside, below 1.3729 support will turn intraday bias neutral first.
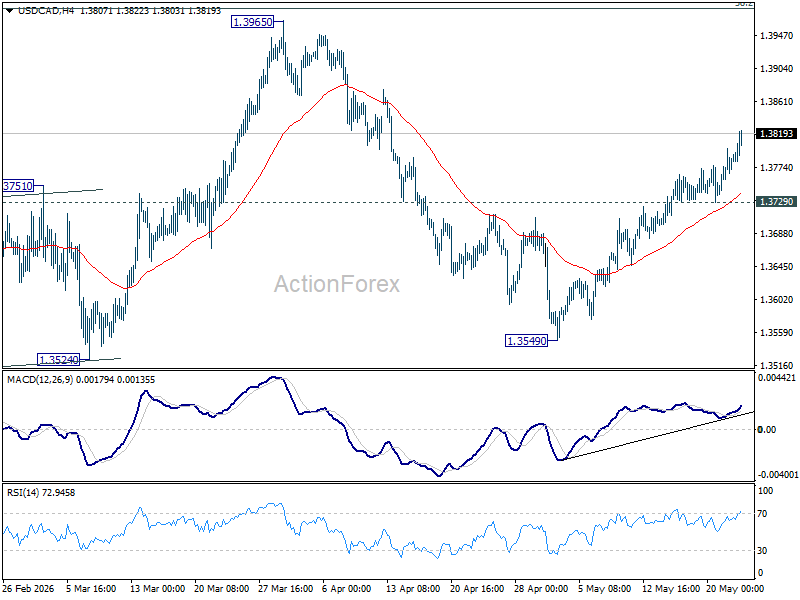
In the bigger picture, price actions from 1.4791 are seen as a corrective pattern to the whole up trend from 1.2005 (2021 low). Deeper fall could be seen, as the pattern extends, to 61.8% retracement of 1.2005 to 1.4791 at 1.3069. However, decisive break of 38.2% retracement of 1.4791 to 1.3480 at 1.3981 will argue that the correction has completed with three waves down to 1.3480 already.
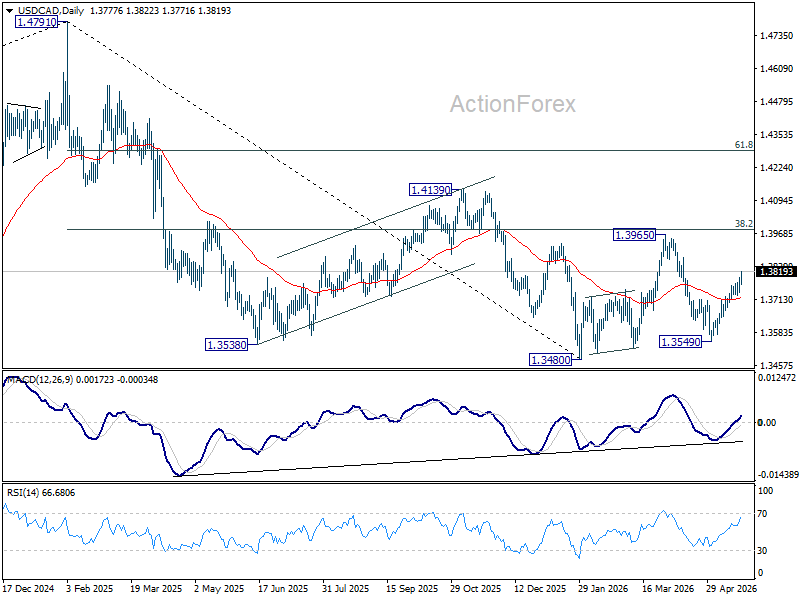
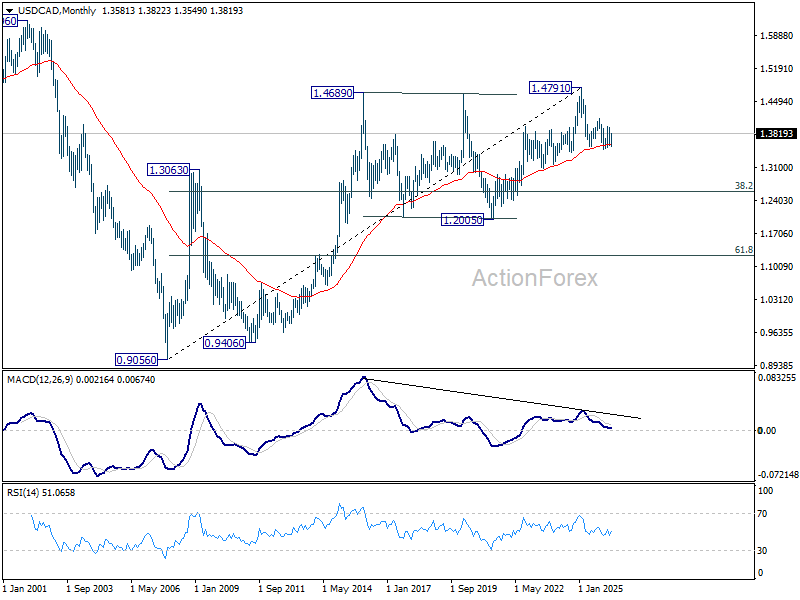
In the long term picture, rising 55 M EMA (now at 1.3581) remains intact. Thus, up trend from 0.9056 (2007 low) could still be in progress. However, considering bearish divergence condition M MACD, sustained trading below 55 M EMA will argue that the up trend has completed with five waves up to 1.4791, and turn medium term outlook bearish for correction to 38.2% retracement of 0.9056 to 1.4791 at 1.2600.
GBP/JPY Weekly Outlook
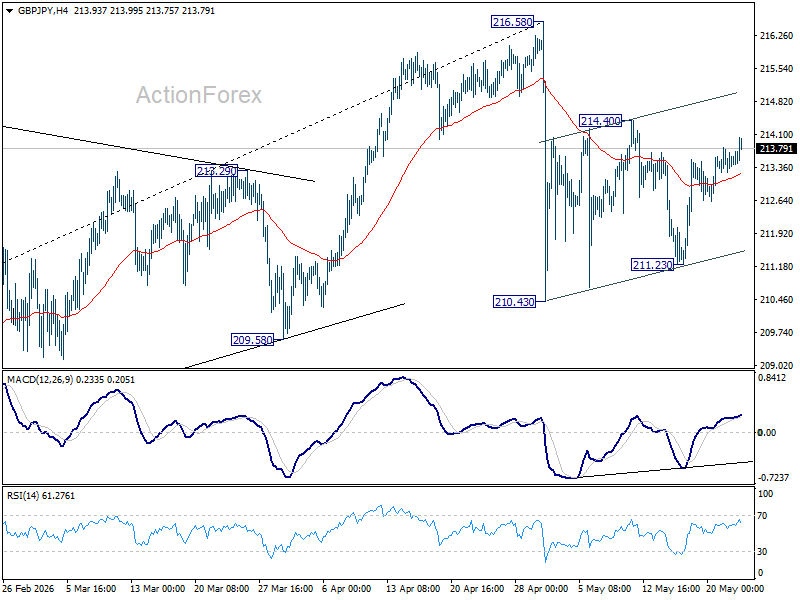
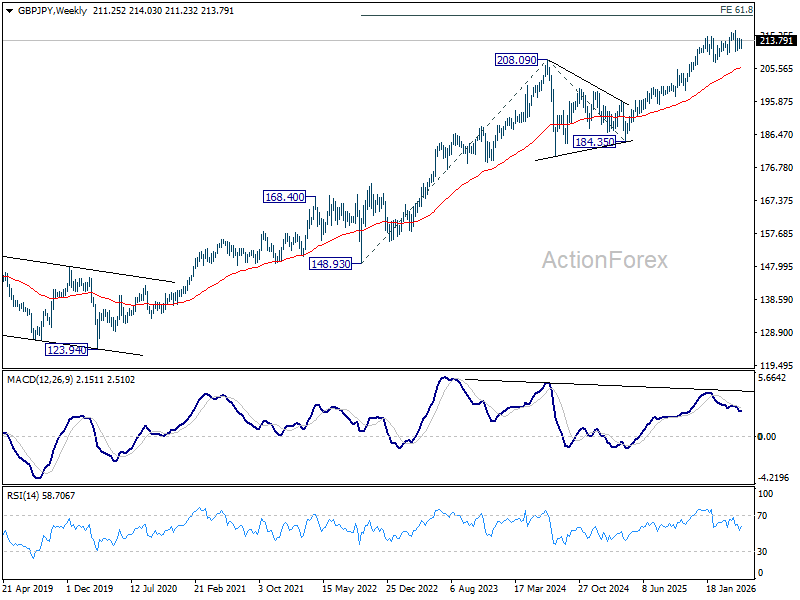
Range trading continued in GBP/JPY last week and outlook is unchanged. Corrective pattern from 216.58 is still extending. Above 214.40 will extend the rebound from 210.43 to retest 216.58. On the downside, break of 211.23 will bring deeper fall through 210.43 instead.
In the bigger picture, while the fall from 216.58 is steep, there is no clear sign of trend reversal yet. The long term up trend could still extend to 61.8% projection of 148.93 (2022 low) to 208.09 (2024 high) from 184.35 at 220.90 on resumption. However, sustained break of 55 W EMA (now at 205.91) will argue that it's already in medium term down trend for 184.35 support.
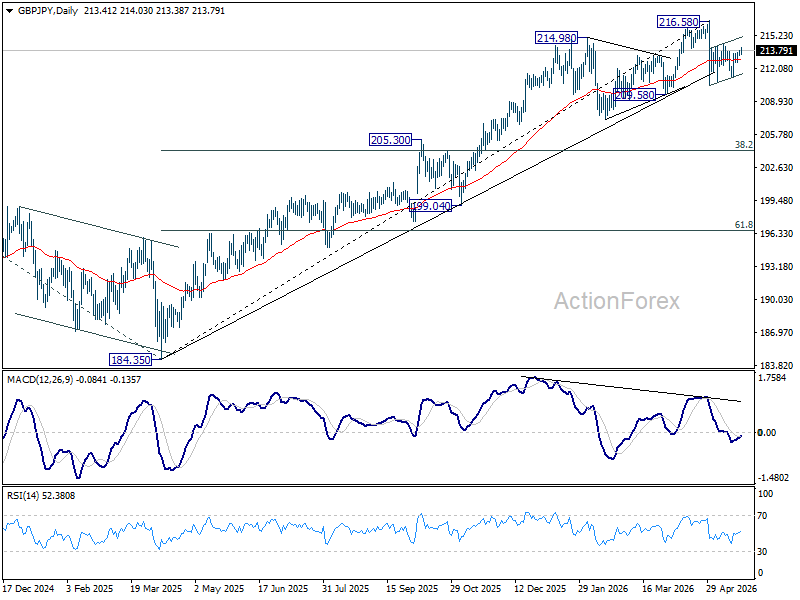
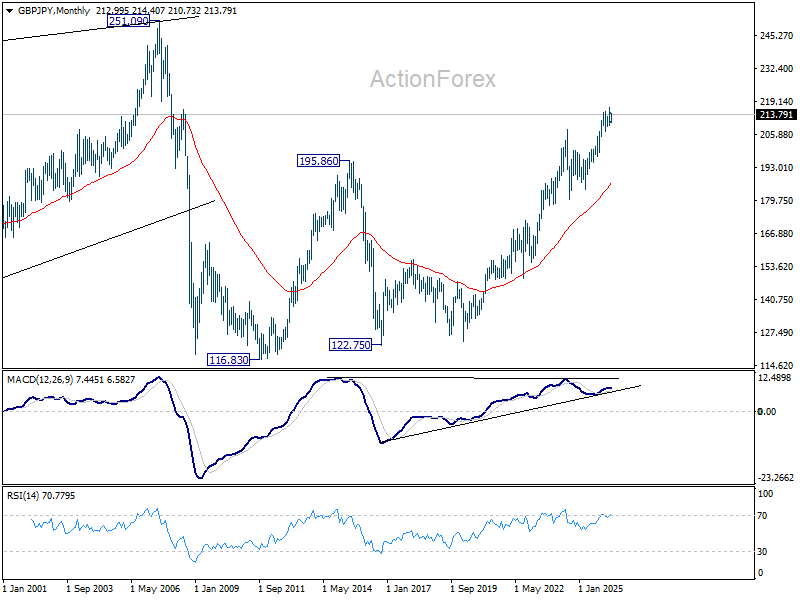
In the long term picture, up trend from 116.83 (2011 low) is in progress. Next target is 251.09 (2007 high). This will remain the favored case as long as 55 M EMA (now at 186.82) holds.
EUR/JPY Weekly Outlook
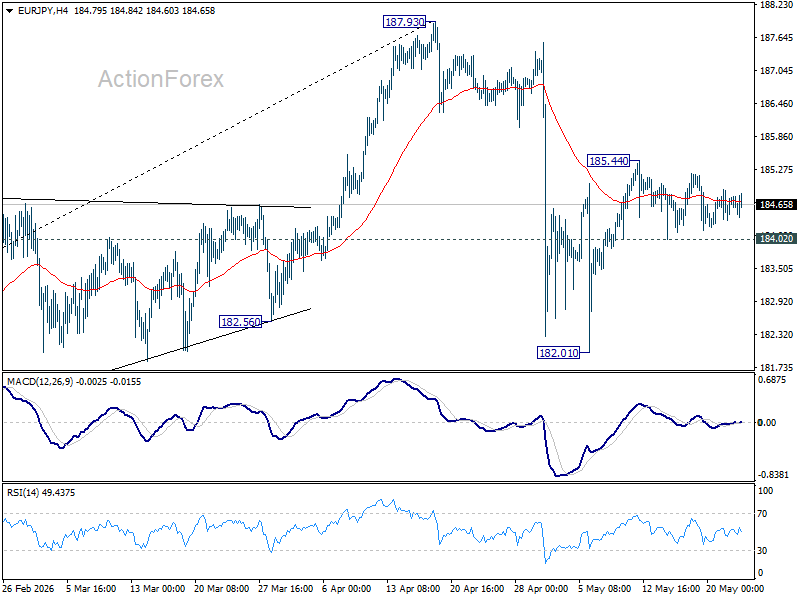
EUR/JPY was bounded in range below 185.44 last week and outlook is unchanged. Initial bias remains neutral this week first. Fall from 187.93 should have completed at 182.01. Above 185.44 will extend the rebound from there to retest 187.93. However, firm break of 184.02 support will bring deeper decline back to 182.01.
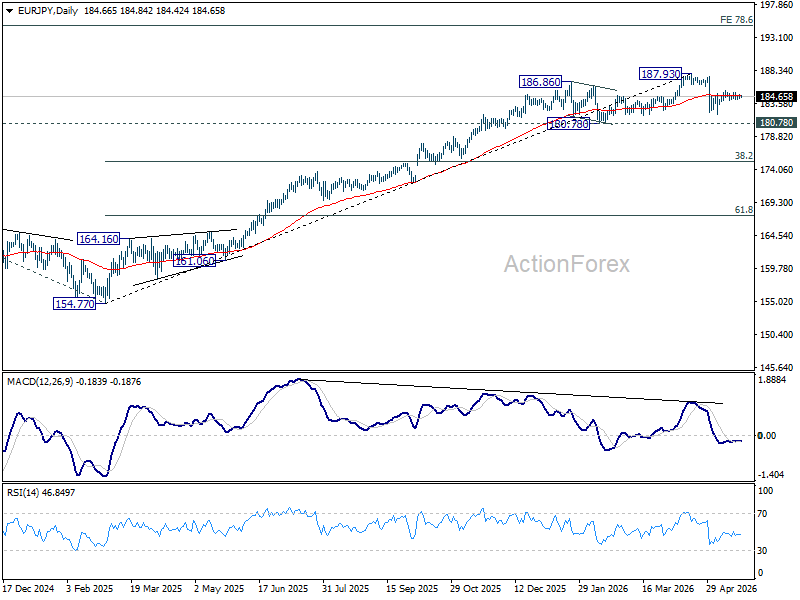
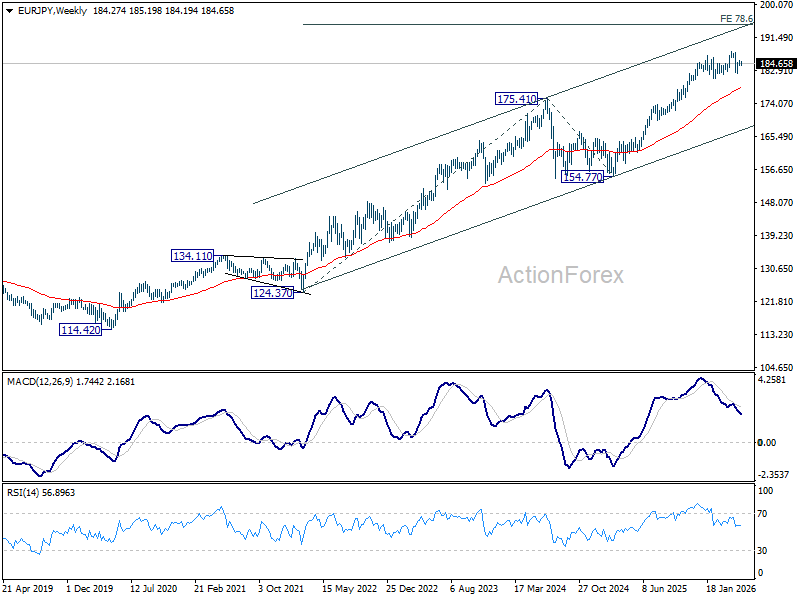
In the bigger picture, the pullback from 187.93 is steep, there is no sign of reversal yet. Uptrend from 114.42 (2020 low) is still expected to resume at a later stage to 78.6% projection of 124.37 (2022 low) to 175.41 (2025 high) from 154.77 at 194.88. However, sustained break of 55 W EMA (now at 178.27) will argue that it's already in a medium term down trend to 175.41 resistance turned support and below.
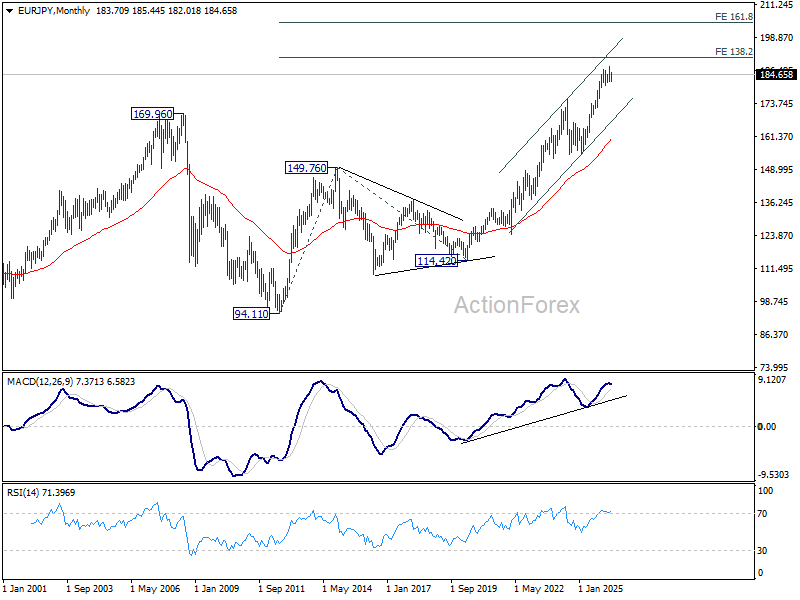
In the long term picture, up trend from 94.11 (2021 low) is in progress. Next target is 138.2% projection of 94.11 to 149.76 (2014 high) from 114.42 (2020 low) at 191.32. This will remain the favored case as long 55 W EMA (now at 178.27) holds.
EUR/GBP Weekly Outlook
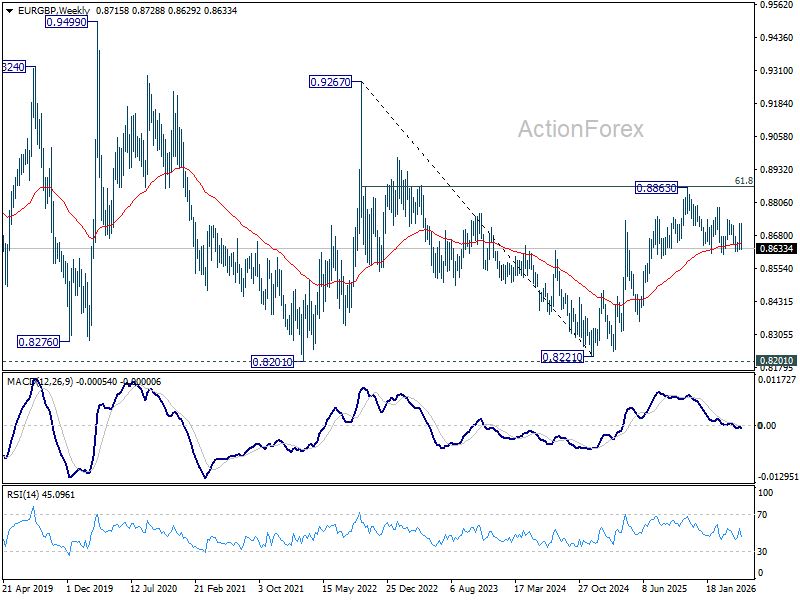
EUR/GBP stayed in range trading last week. Initial bias remains neutral first. On the downside, decisive break of 0.8610 support will revive the case of bearish trend reversal. On the upside, break of 0.8728 resistance will bring stronger rally back towards 0.8740 resistance.
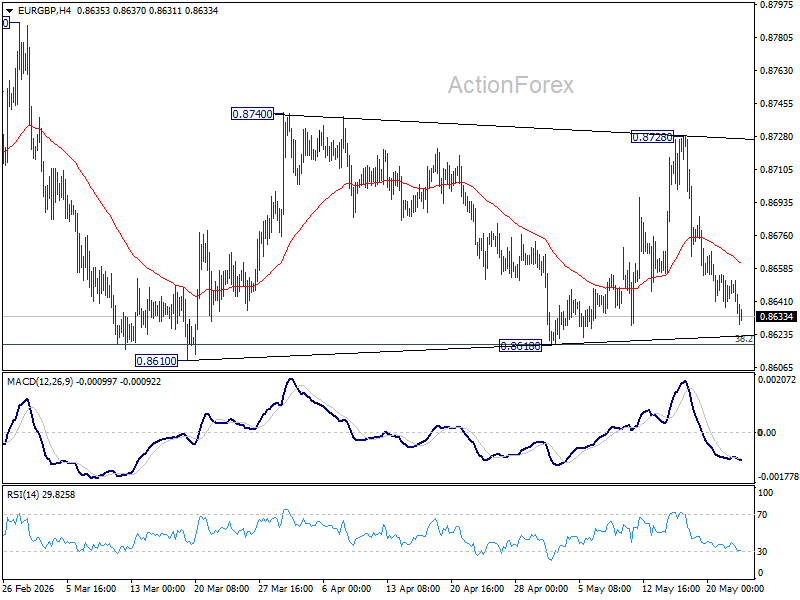
In the bigger picture, focus is staying on 38.2% retracement of 0.8821 to 0.8863 at 0.8618. Strong rebound from there will retain medium term bullishness. Rise from 0.8221 should resume through 0.8863 at a later stage. Nevertheless, sustained break of 0.8618 will confirm that whole rise from 0.8221 has completed at 0.8863. Deeper decline should then be seen to 61.8% retracement at 0.8466 at least.
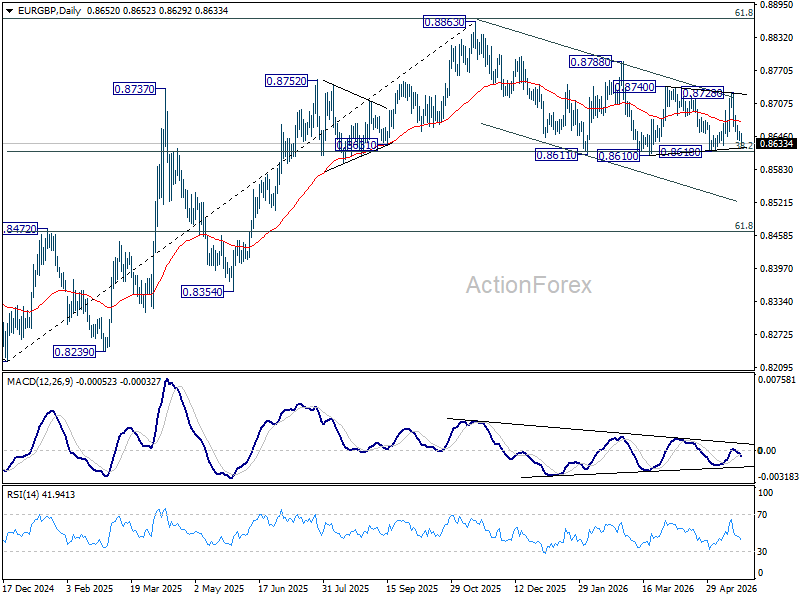
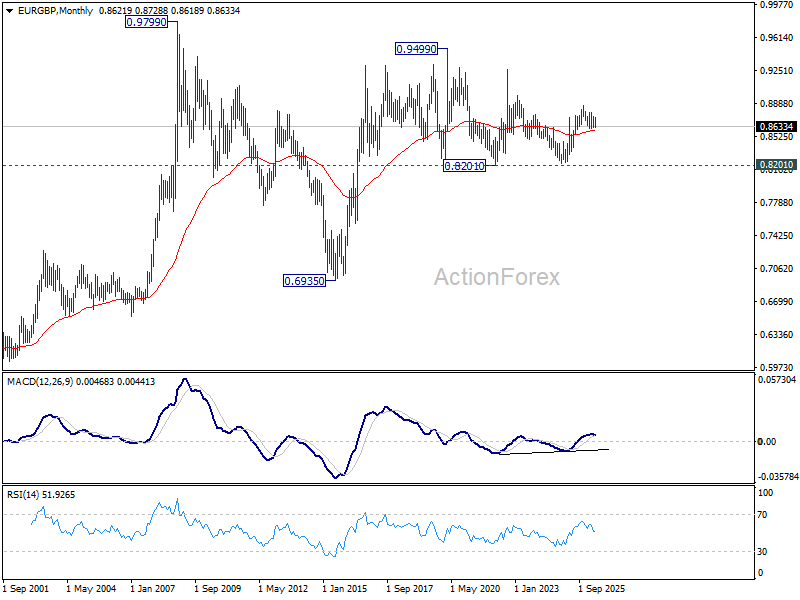
In the long term picture, price action from 0.9499 (2020 high) is seen as part of the long term range pattern from 0.9799 (2008 high). Range trading should continue between 0.8201 and 0.9499, until there is clear signal of imminent breakout.
EUR/AUD Weekly Outlook
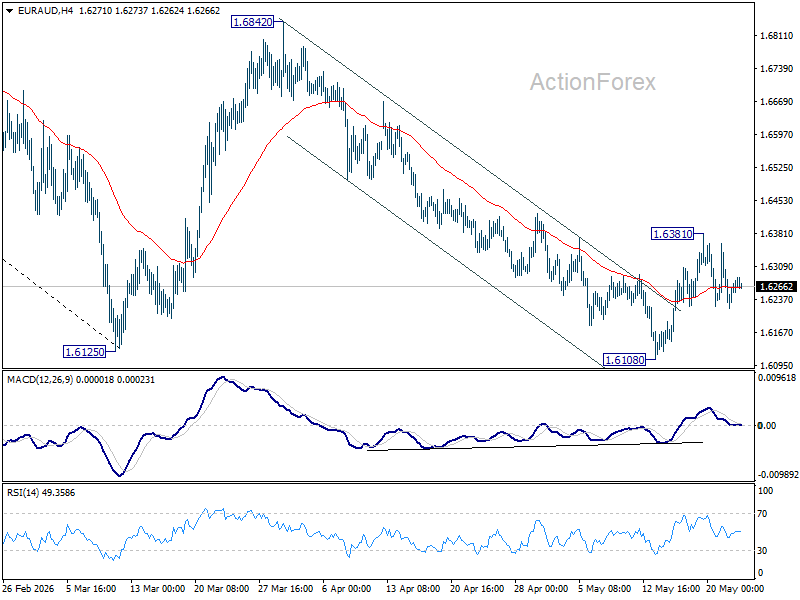
EUR/AUD recovered to 1.6381 last week but retreated since then. Initial bias remains neutral this week first. A short term bottom should be in place, and rise from 1.6108 is seen as the third leg of the corrective pattern from 1.6125. Above 1.6381 will bring stronger rebound to 55 D EMA (now at 1.6451) and above. Nevertheless, firm break of 1.6108 will resume the larger down trend from 1.8554.
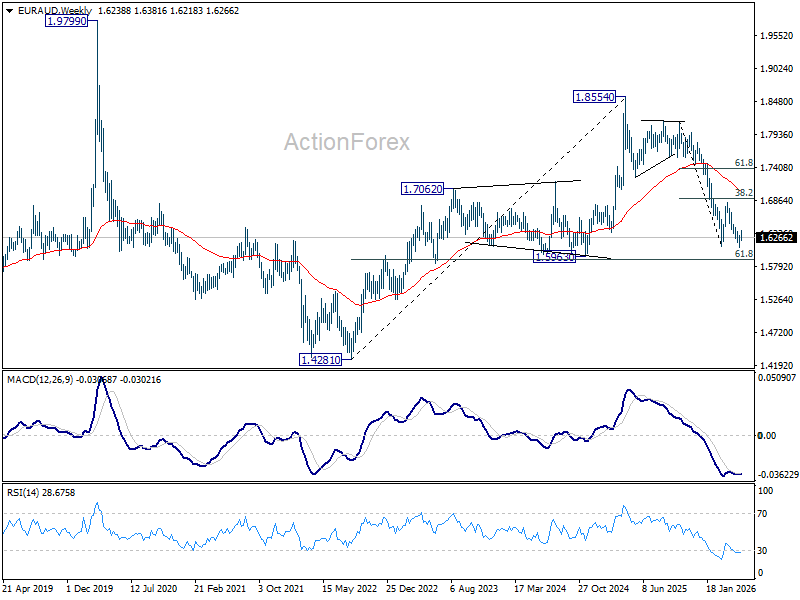
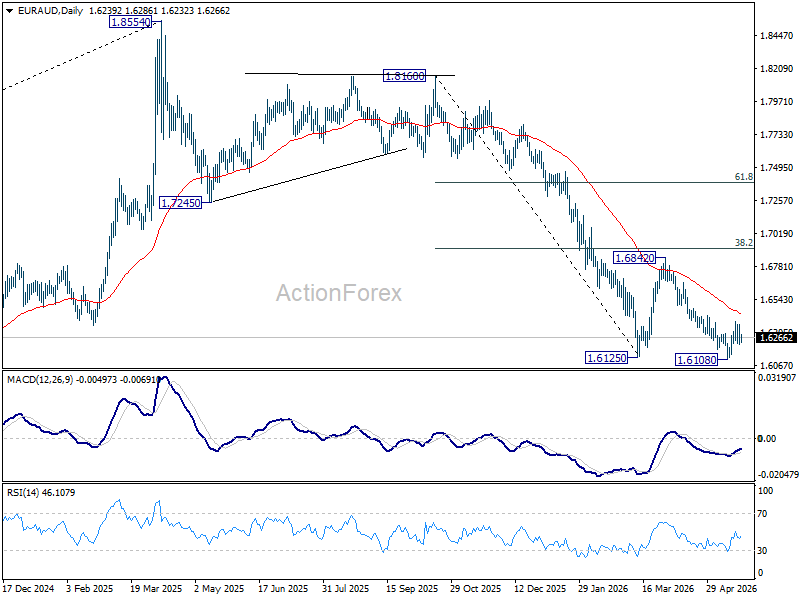
In the bigger picture, fall from 1.8554 (2025 high) is in progress and deeper decline should be seen to 61.8% retracement of 1.4281 to 1.8554 at 1.5913, which is slightly below 1.5963 structural support. Decisive break there will pave the way back to 1.4281 (2022 low). For now, risk will stay on the downside as long as 55 W EMA (now at 1.7012) holds, even in case of strong rebound.
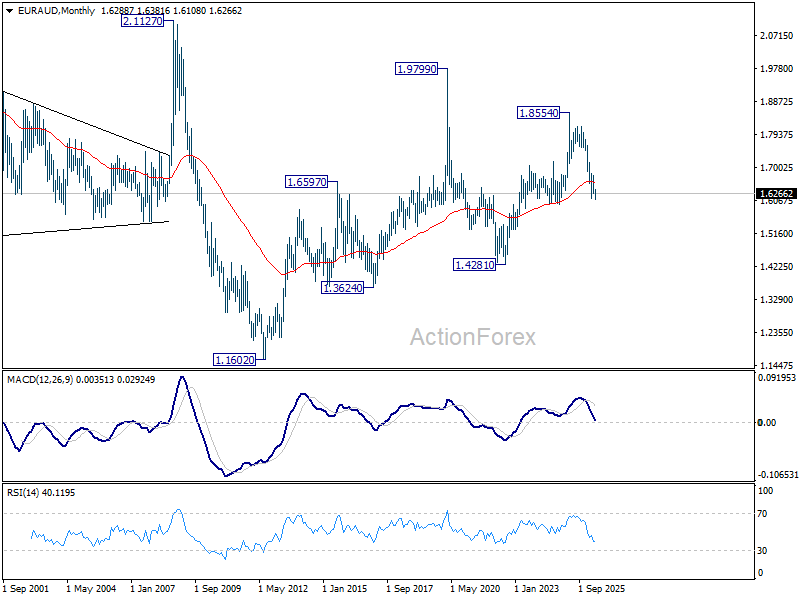
In the longer term picture, fall from 1.8554 is seen as the third leg of the pattern from 1.9799 (2020 high), which is part of the pattern from 2.1127 (2008 high). Sustained trading below 55 M EMA (now at 1.6578) will confirm this bearish case, and pave the way back towards 1.4281.