Sample Category Title
Ceasefire Sends Oil Below $100 While Stocks Recover
Markets started last week a bit cautious but slightly positive. There was hope that tensions in Iran might ease, which helped stocks move a little higher. At the same time, the U.S. dollar weakened slightly as risk sentiment improved.
Midweek, sentiment improved more after news of a two-week ceasefire and further talks. Oil prices dropped back below $100, global equities moved higher, and the dollar weakened further. While the situation is not fully resolved, this progress reduced short-term risk.
Economic data showed some impact from earlier higher oil prices. U.S. inflation stayed around 3%, and consumer sentiment fell on concerns about rising costs. Gold remained supported, and USD/JPY again failed to break above 160, but is still holding at high levels.
Markets This Week
U.S. Stocks
The Dow Jones saw strong gains last week as markets reacted positively to the two-week ceasefire in Iran, raising hopes that the conflict may be nearing an end. While there are already signs that higher oil prices are starting to impact the economy, investors are hoping this will be short-term. However, there is still a risk that oil prices remain elevated for longer, which could limit further upside in stocks. As a result, the market may struggle to continue higher this week and could trade sideways in a wide range, with traders closely watching developments in negotiations and movements in oil prices. Resistance levels are at 48,500, 49,000, 49,600, and 50,000. Support is seen at 47,000, 46,000, and 45,000.
Japanese Stocks
Following the ceasefire news, Japanese stocks moved higher and closed near weekly highs, supported by a weaker yen and stronger U.S. equities. However, in the short term, the Nikkei looks slightly overbought, so a pullback early in the week is likely. Further upside will depend on oil prices falling more, as high energy costs remain a concern for the Japanese economy. Overall, the market may move sideways to slightly lower this week as traders continue to watch oil prices and global developments closely. Resistance is seen at 58,000, 58,500 and 60,000, while support is at 55,000, 54,000, 52,500, and 52,000.
USD/JPY
Resistance at 160 remained strong throughout last week, with the pair unable to break higher. Following the ceasefire news, USD/JPY dropped quickly to around 158 midweek as the yen strengthened on improved risk sentiment. However, toward the end of the week, the yen weakened again. U.S. inflation staying above 3% and higher oil prices make it difficult for the Bank of Japan to raise rates, keeping the interest rate gap between the U.S. and Japan wide. This helped USD/JPY move higher again into the close. The 10-day moving average has started to turn slightly lower, and with 160 still acting as strong resistance, trading the 158–160 range remains the preferred short-term strategy. Resistance is at 160.00, 160.50, 162, and 165, while support is seen at 158.50, 158.00, and 156.50.
Gold
Gold continued to move higher last week, supported by a weaker U.S. dollar as WTI prices fell. The move higher came in relatively quiet market conditions, but the trend remained steady throughout the week. The 10-day moving average is pointing higher, showing that short-term momentum is positive. For now, the preferred approach is to look to buy dips, with gold likely to continue testing higher levels. Resistance is at $4,800, $4,850, $5,000, and $5,100, while support is at $4,600, $4,500, and $4,400.
Crude Oil
WTI fell back below the $100 level by the end of last week after the ceasefire news in Iran. Prices dropped quickly midweek as traders sold on expectations that Trump is pushing to end the war before high oil prices significantly damage the U.S. economy. Negotiations are likely to continue, which should keep volatility high, but further large gains look less likely in the short term. Overall, expect WTI to trade sideways to lower this week in volatile conditions, creating trading opportunities. Resistance is at $100, $110, $120, $125, and $130, while support is at $90, $80, $75, $70, and $67.5.
Bitcoin
Bitcoin benefited from improved risk sentiment following the Iran ceasefire, closing the week near the highs of its recent range. It has been trading sideways for a long time, but this may not continue. If tensions in Iran keep easing, there is increasing potential for a breakout above $75,000. Resistance is at $75,000, $80,000, and $85,000, while support is at $65,000, $60,000, and $55,000.
This Week’s Focus
- Monday: U.S. Existing Home Sales
- Tuesday: Australia NAB Business Confidence, Japan Industrial Production, U.S. PPI
- Wednesday: China Trade Balance, E.U. Industrial Production, U.S. NY Empire State Manufacturing Index and Beige Book
- Thursday: Australia Unemployment Rate, China GDP and Chinese Unemployment Rate, U.K. GDP and Industrial Production, E.U. CPI, U.S Industrial Production
- Friday: E.U. Trade Balance
Headlines around the ongoing negotiations in Iran are likely to be the main focus this week, as the situation remains volatile and concerns continue about oil transport through the Strait of Hormuz. There are few major economic data releases, with U.S. PPI being the main highlight. Overall, market direction will be driven more by sentiment around Middle East oil supply than by economic data.
Eco Data 4/13/26
| GMT | Ccy | Events | Act | Cons | Prev | Rev |
|---|---|---|---|---|---|---|
| 22:30 | NZD | Business NZ PSI Mar | 46 | 48 | 47.6 | |
| 23:50 | JPY | Money Supply M2+CD Y/Y Mar | 2.00% | 1.60% | 1.70% | |
| 12:30 | CAD | Building Permits M/M Feb | -8.40% | -0.40% | 4.80% | 3.50% |
| 14:00 | USD | Existing Home Sales Mar | 3.98M | 4.01M | 4.09M | 4.13M |
| 22:30 | NZD |
| Business NZ PSI Mar | |
| Actual | 46 |
| Consensus | |
| Previous | 48 |
| Revised | 47.6 |
| 23:50 | JPY |
| Money Supply M2+CD Y/Y Mar | |
| Actual | 2.00% |
| Consensus | 1.60% |
| Previous | 1.70% |
| 12:30 | CAD |
| Building Permits M/M Feb | |
| Actual | -8.40% |
| Consensus | -0.40% |
| Previous | 4.80% |
| Revised | 3.50% |
| 14:00 | USD |
| Existing Home Sales Mar | |
| Actual | 3.98M |
| Consensus | 4.01M |
| Previous | 4.09M |
| Revised | 4.13M |
Dollar at Risk of Sharp Selloff if Markets Front-Run Islamabad Accord on Progress in US-Iran Talks
Attention is firmly on Islamabad as the United States and Iran begin their first high-level talks since the onset of war, with markets looking for signs of a breakthrough that could evolve into a broader Islamabad Accord. The outcome would be as a defining moment for energy markets, inflation, and global risk sentiment, with delegations led by US Vice President JD Vance already on the ground for what could shape the trajectory of the ceasefire and beyond.
At its core, the Islamabad meeting is not just another diplomatic event—it is the single most important macro catalyst in the current environment. The talks aim to transform a fragile two-week ceasefire into a more durable framework, with implications stretching from the reopening of the Strait of Hormuz to the normalization of global energy flows.
From here, three broad scenarios emerge. A breakdown in talks would see markets revert quickly to pre-ceasefire positioning, with oil surging back toward crisis levels and risk sentiment deteriorating. A “freeze” scenario—where dialogue continues without concrete progress—would likely leave markets range-bound, as optimism fades but no new escalation is priced in. The third and most market-moving outcome is the emergence of a framework for an eventual accord, even without a finalized deal.
Crucially, markets will not wait for signed agreements—they front-run credible trajectories. If investors see even a partial framework emerging from Islamabad, pricing could shift rapidly toward a de-escalation scenario. In that case, Dollar would be at risk of a sharp selloff, driven by improving risk appetite, falling oil prices, and a renewed focus on policy divergence against the Fed.
Three Scenarios: Breakdown, Freeze or Framework
The baseline framework for the Islamabad talks revolves around three possible paths: breakdown, freeze, or framework. Each scenario represents a different stage of geopolitical risk pricing and carries clear implications for global markets.
1. Breakdown: The "Operation Epic Fury" Reset
A breakdown would mark the most disruptive outcome. Failure to reach common ground would likely send markets back to pre-ceasefire positioning, with oil prices rebounding sharply toward $120 and equities reversing last week's gains. Investors would quickly reposition for renewed escalation, reintroducing inflation risks and tightening financial conditions.
2. The "Freeze": Range-Bound Purgatory
A “freeze” scenario, by contrast, would extend the current uncertainty. Continued dialogue without concrete commitments—particularly on the Strait of Hormuz or sanctions—would likely stall the recent rally. Markets could drift sideways, as the absence of progress caps optimism while the absence of escalation limits downside.
3. The Framework: Front-Running the Accord
The most constructive scenario is the emergence of a framework for an eventual Islamabad Accord. Importantly, markets do not require a finalized agreement to react. Even incremental progress—such as agreement on key issues or timelines—can be enough to trigger forward-looking positioning. With risk assets already supported by strong momentum since the ceasefire announcement, traders may move early, driving equities toward new highs and pulling oil back toward $90 or even lower as expectations shift toward de-escalation.
Risk-On Momentum Could Drive Dollar Lower
If markets begin to front-run a credible path toward an Islamabad Accord, the first and most immediate driver of Dollar weakness would be a powerful extension of risk-on sentiment. Equity markets have already built strong upward momentum, with S&P 500 posting its best weekly performance since November and now sitting within striking distance of record highs. In such an environment, investors are likely to lean aggressively into risk assets.
At the same time, Fed expectations provide a crucial tailwind to this move. Recent inflation data supports the view that the oil shock has not yet translated into broader inflation pressures. Core CPI edged up only modestly from 2.5% yoy to 2.6% yoy in March, offering little evidence of second-round effects. This keeps the Fed’s “transitory” narrative intact, allowing policymakers to look through the energy-driven spike in headline inflation.
There are, however, concerns around inflation expectations. The University of Michigan survey showed a sharp jump in one-year expectations from 3.8% to 4.8%, alongside a rise in long-run expectations to 3.4%. On the surface, this could challenge the Fed’s confidence. But these readings are backward-looking, with most responses collected before the April 7 ceasefire and the subsequent pullback in oil prices.
Besides, expectations are likely to be highly sensitive to developments in energy markets. If oil declines on progress toward an Islamabad Accord, inflation expectations could reverse just as quickly as they rose. This would reinforce the view that current inflation fears are not yet entrenched.
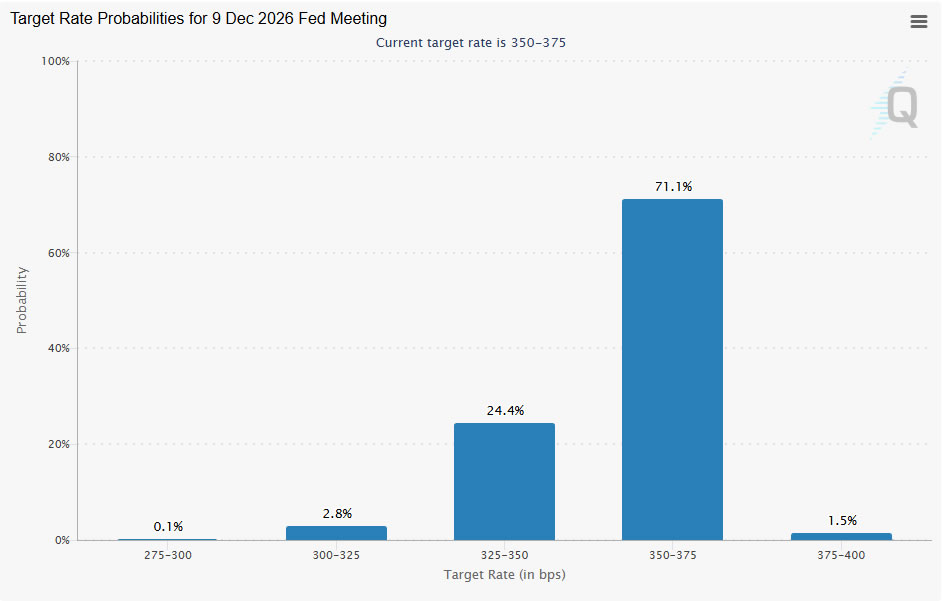
Market pricing reflects this balance. Futures indicate minimal probability of rate hikes by the end of the year, with odds near 1.5%. The majority expectation remains for the Fed to hold at 3.50–3.75% before eventually easing. In other words, rate cuts are seen as delayed rather than cancelled.
Hike vs Hold: The Split That Could Sink Dollar
The second key driver of Dollar weakness, if markets front-run an Islamabad Accord, lies in widening central bank policy divergence. In a de-escalation scenario, the Fed is likely to remain on hold in the near term and then pivot back toward rate cuts once the oil shock fades. This places it firmly in the “hold-to-ease” camp, in contrast to several major central banks that are either tightening or preparing to tighten further.
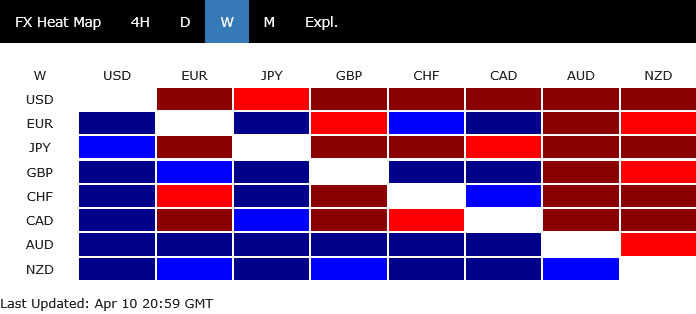
This emerging “hike versus hold” split is becoming increasingly pronounced. The European Central Bank, the Reserve Bank of Australia, the Bank of Japan, and likely the Bank of England form the tightening camp, while the Fed, Bank of Canada, Reserve Bank of New Zealand, and Swiss National Bank remain more cautious. Such divergence creates a structural headwind for the Dollar by compressing its yield advantage.
The ECB, in particular, stands out. With its policy rate at 2.00%, close to neutral, it has more room to raise rates compared to the Fed’s 3.50–3.75% range. Europe’s greater sensitivity to energy shocks also increases the urgency for tightening, as policymakers seek to prevent second-round inflation effects from taking hold.
By contrast, the Fed is already operating near the upper bound of its neutral range, as highlighted in recent FOMC minutes. With the labor market stable rather than overheating, policymakers can afford to pause and assess incoming data. If inflation pressures ease alongside falling oil prices, the next move is more likely to be a cut than a hike.
The RBA further reinforces this divergence. Already in an active tightening cycle this year, it faces inflation pressures from both strong domestic demand and supply-side disruptions linked to the closure of the Strait of Hormuz. Markets are pricing additional hikes in the coming months, widening the policy gap with the Fed.
In this context, policy divergence acts as a powerful secondary force amplifying Dollar downside. If risk-on sentiment initiates the move, shifting yield dynamics can sustain it, making any selloff in the Dollar both sharper and more persistent.
AUD/USD Eyes 0.72 Break, EUR/USD to Follow if Accord Scenario Plays Out
In the event that markets front-run a credible Islamabad Accord, FX markets are likely to move decisively. The combination of risk-on sentiment and widening policy divergence would favor currencies like Australian Dollar and Euro, while putting sustained pressure on Dollar.
AUD/USD stands out as the clearest beneficiary. Improved global risk appetite and widening the rate differential could propel it through 0.72 key resistance. That would set up resumption of the medium term up trend. In such a scenario, AUD/USD’s move toward 0.80 would become more than a tactical trade, and evolve into a base case for carry-focused investors
EUR/USD is also positioned for upside, with a retest of the 1.20 key psychological level likely under a de-escalation scenario. Importantly, the ECB’s tolerance for Euro strength could have subtlety shifted. While policymakers previously expressed concern about excessive Euro strength due to its deflationary impact, the current environment is different. With energy-driven inflation pressures elevated, a stronger Euro could help contain import costs, reducing the urgency to resist currency appreciation. A sustained break above 1.20 would therefore carry different implications than in previous cycles. Rather than being seen as a policy problem, it could be tolerated—or even welcomed—as part of the broader effort to stabilize inflation.
S&P 500 Uptrend Holds, Dollar Index Risks Renewed Downtrend
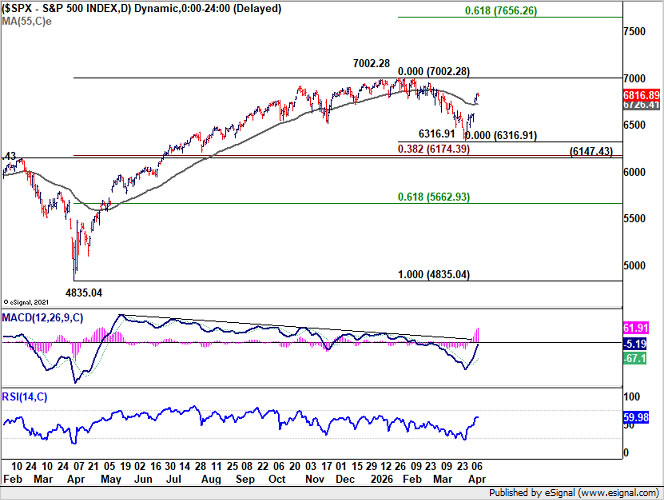
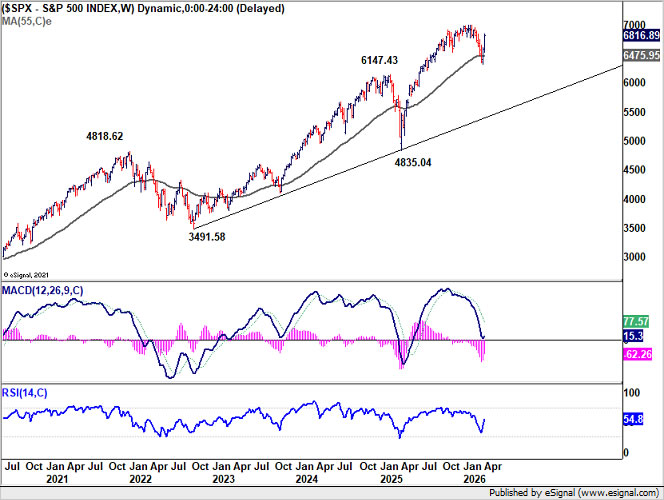
S&P 500’s strong rebound last week suggests that the corrective decline from 7,002.28 has likely completed at 6,316.91. Notably, firm support emerged from a key cluster zone, including 6,147.43 resistance-turned-support, 38.2% retracement of 4,835.04 to 7,002.28 at 6,174.39, and the 55 W EMA (now at 6,457.95). This confluence reinforces the view that the longer-term uptrend remains intact.
Retest of the 7002.28 high should be seen next. While initial upside may be capped there, potentially extending the current consolidation pattern with another pullback, decisive break would signal resumption of the broader uptrend. In that case, the next target lies at the 61.8% projection of 4,835.04 to 7,002.28 from 6,316.91 at 7,656.26.
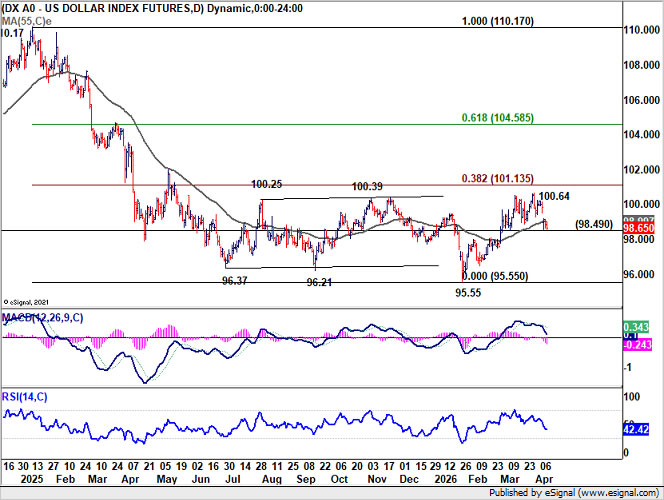
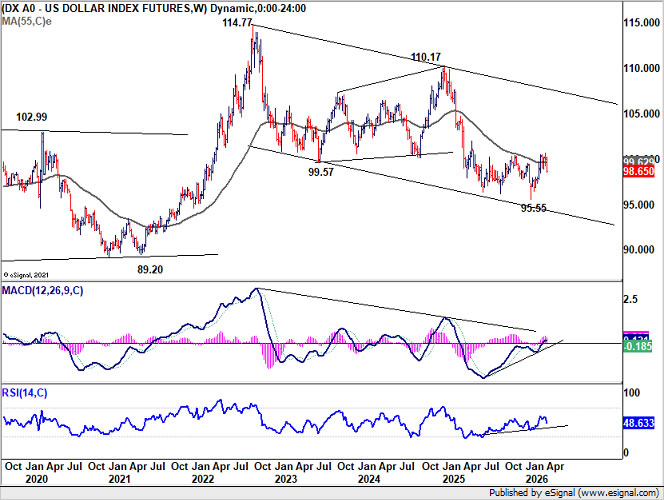
For Dollar Index, 98.65 support is now in focus following last week’s decline. Firm break below this level would suggest that the rebound from 95.55 has already topped at 100.64. The rejection near 38.2% retracement of 100.17 to 95.55 at 101.13, alongside the 55 W EMA (now at 99.62), keeps the medium-term outlook Bearish.
Should 98.65 give way, retest of the 95.55 low should be seen next. Decisive break below that level would confirm the resumption of the broader downtrend from the 114.77 (2022 high).
AUD/USD Weekly Report
AUD/USD's strong rebound last week suggests that pullback from 0.7187 has completed at 0.6832 already. Initial bias stays mildly on upside this week for retesting 0.7187. Strong resistance could be seen there to bring another fall to extend the near term corrective pattern. On the downside, below 0.7021 minor support will turn intraday bias neutral again first.
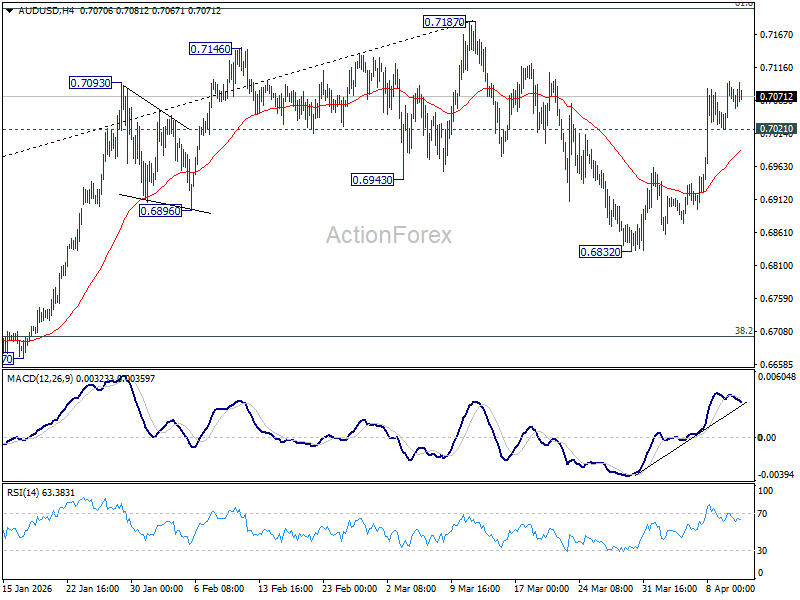
In the bigger picture, as long as 0.6706 cluster support holds, rise from 0.5913 (2024 low) should still be in progress. Decisive break of 61.8% retracement of 0.8006 to 0.5913 at 0.7206 will solidify the case that it's already reversing the down trend from 0.8006 (2021 high). However, firm break of 0.6706 will dampen this bullish case, and bring deeper fall back to 0.6420 support, and possibly below.
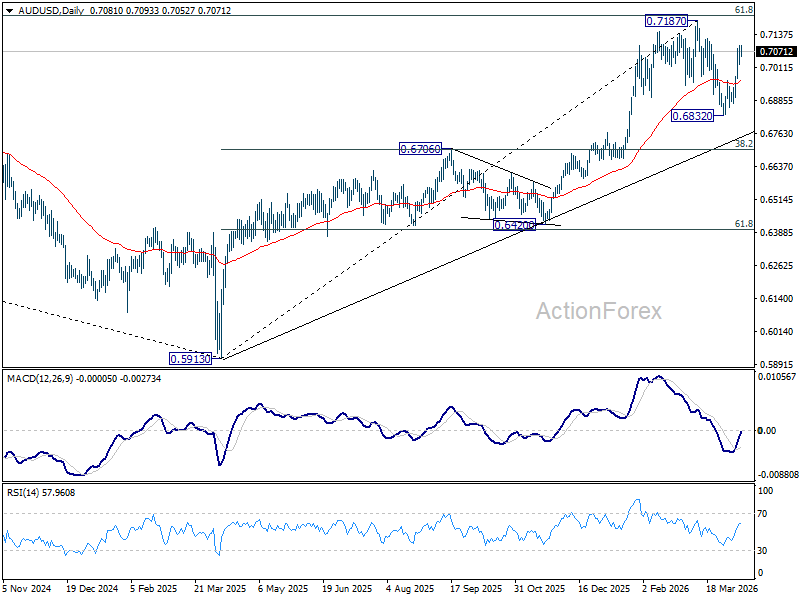
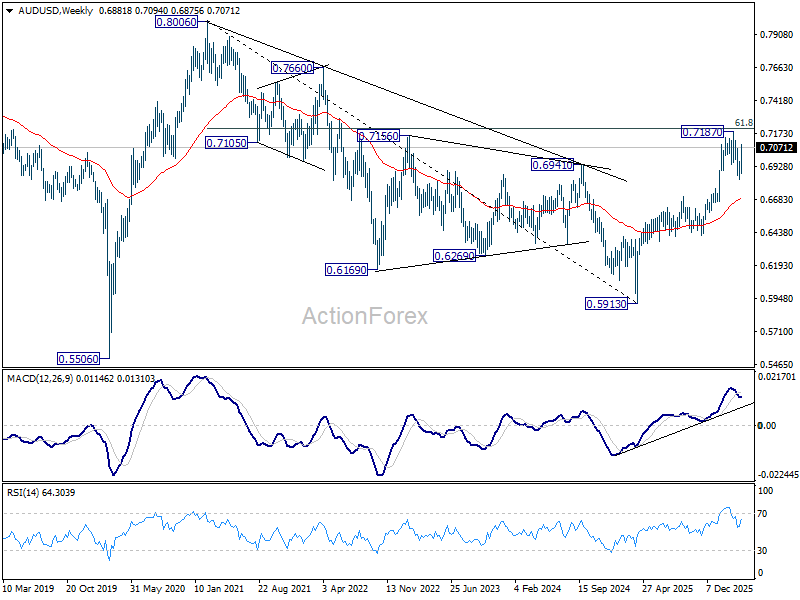
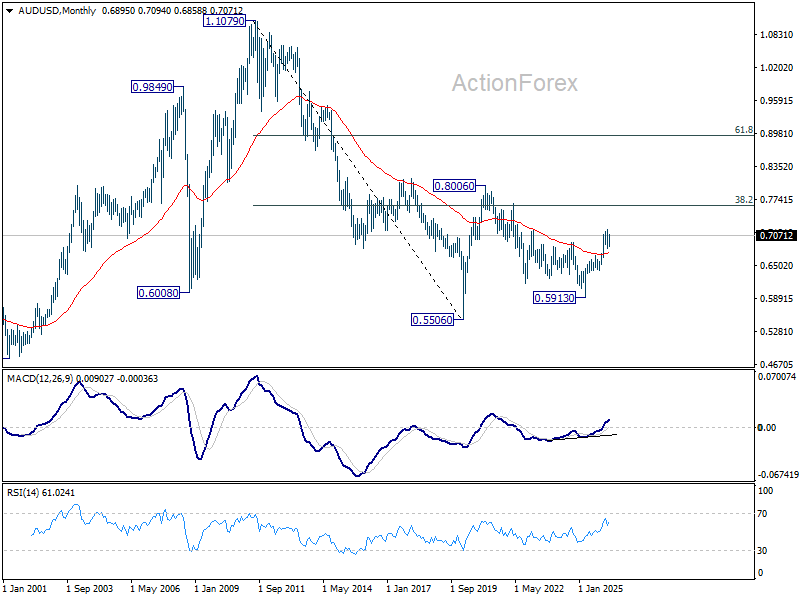
In the long term picture, rise from 0.5913 is seen as the third leg of the whole pattern from 0.5506 (2020 low). It's still early to judge if this is an impulsive or corrective pattern. But in either case, further rise should be seen back to 0.8006 and possibly above. This will remain the favored case as long as 55 W EMA (now at 0.6683) holds.
EUR/USD Weekly Outlook
EUR/USD's extended rebound last week suggests that correction from 1.2081 has already completed at 1.1408. Initial bias stays on the upside this week for 61.8% retracement of 1.2081 to 1.1408 at 1.1824. Decisive break there will pave the way to retest 1.2081 high. On the downside, below 1.1642 minor support will turn intraday bias neutral again first.
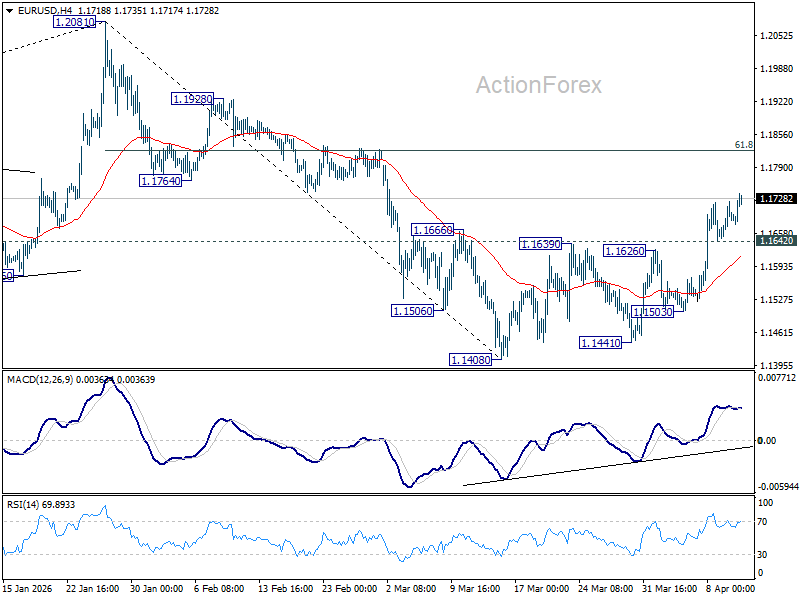
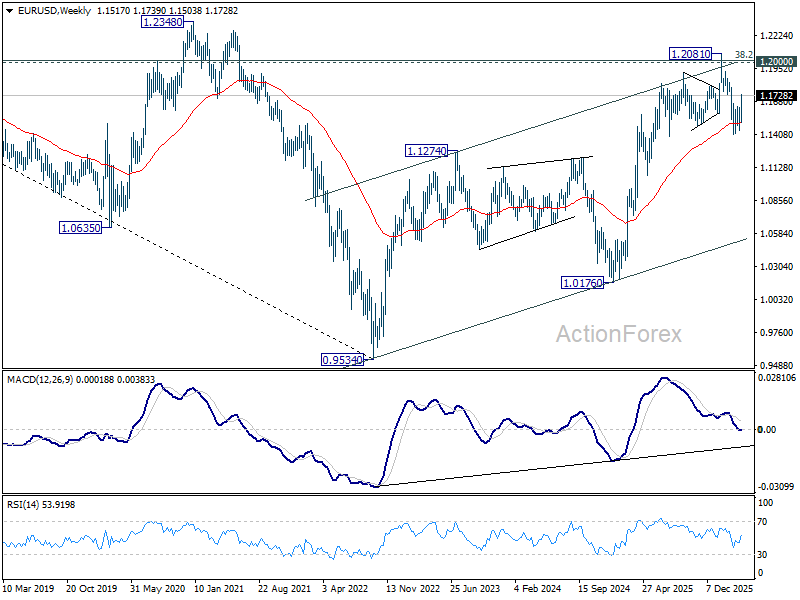
In the bigger picture, the strong support from 38.2% retracement of 1.0176 to 1.2081 at 1.1353 suggests that the pullback from 1.2081 is more likely a corrective move. Strong support was also found in 55 W EMA (now at 1.1505). Focus is back on 1.2 key cluster resistance level. Decisive break there will carry long term bullish implications. Nevertheless, break of 1.1408 support will revive the case of medium term bearish trend reversal.
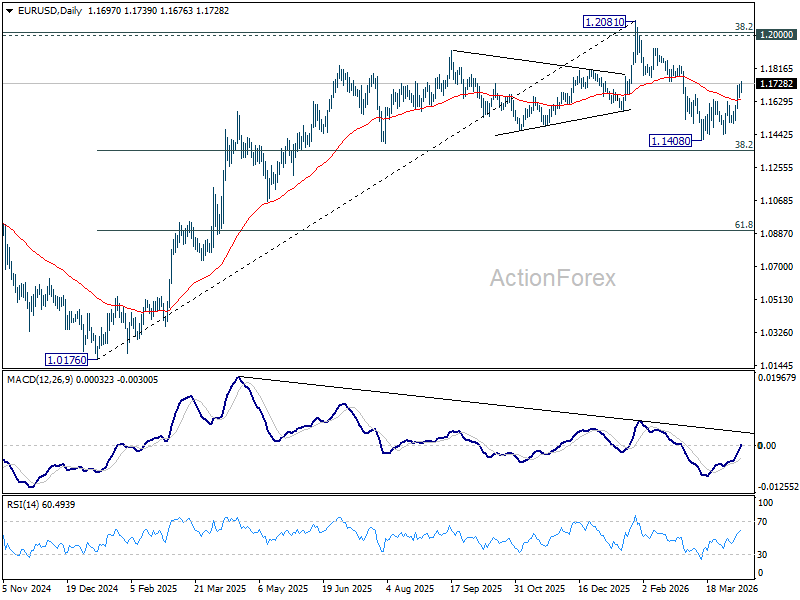
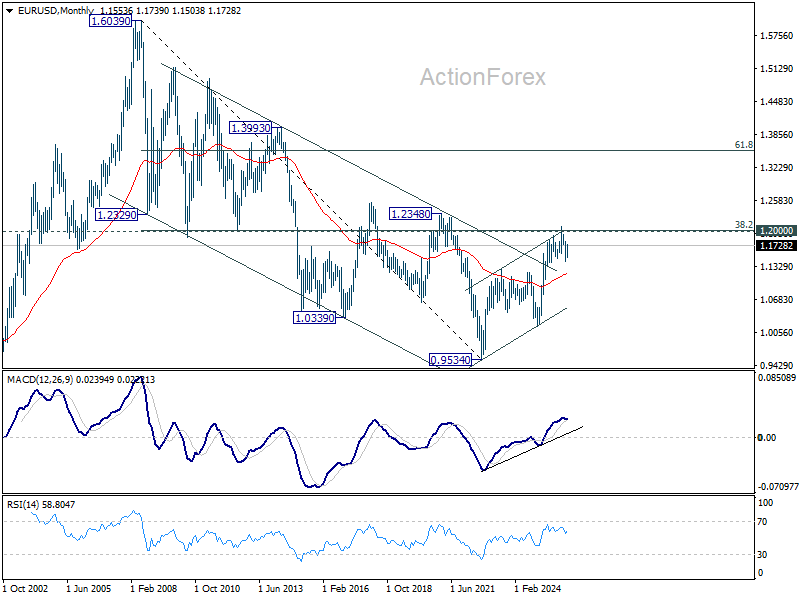
In the long term picture, 38.2% retracement of 1.6039 to 0.9534 at 1.2019, which is close to 1.2000 psychological level is the key for the outlook. Rejection by this level will keep the multi decade down trend from 1.6039 (2008 high) intact, and keep outlook neutral at best. However, decisive break of 1.2000/19, will suggest long term bullish trend reversal, and target 61.8% retracement at 1.3554.
USD/JPY Weekly Outlook
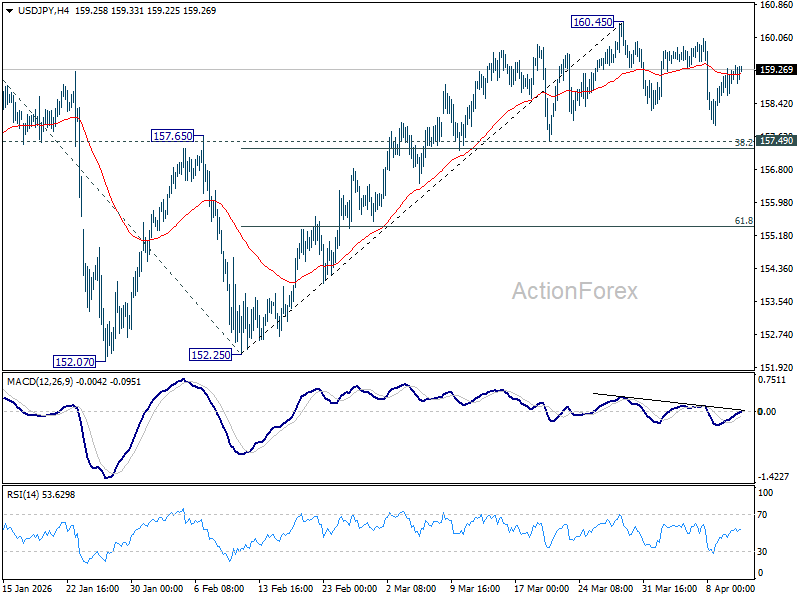
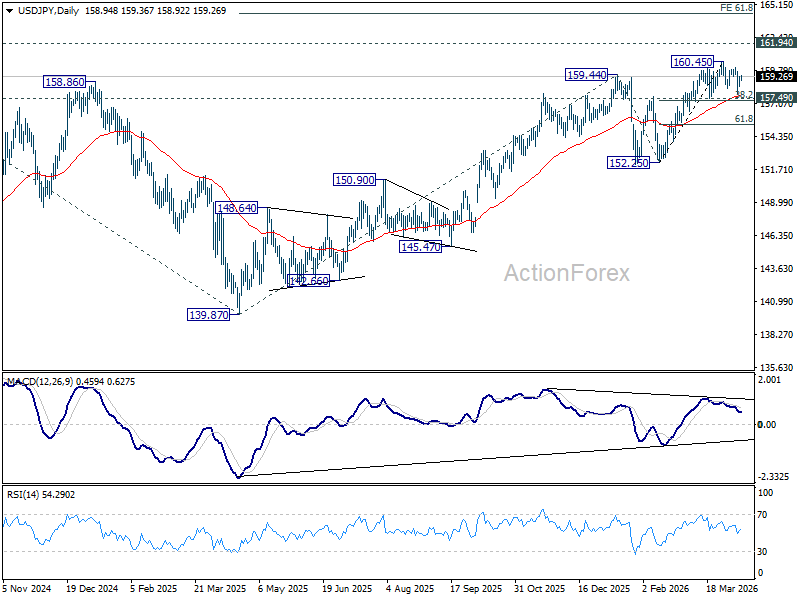
USD/JPY stayed in consolidations below 160.45 short term top last week and outlook is unchanged. Initial bias remains neutral first and further rise is expected with 157.49 cluster support (38.2% retracement of 152.25 to 160.45 at 157.31) intact. On the upside break of 160.45 will target a retest on 161.94 high. However, firm break of 157.31/49 will bring deeper fall back to 61.8% retracement at 155.38 next.
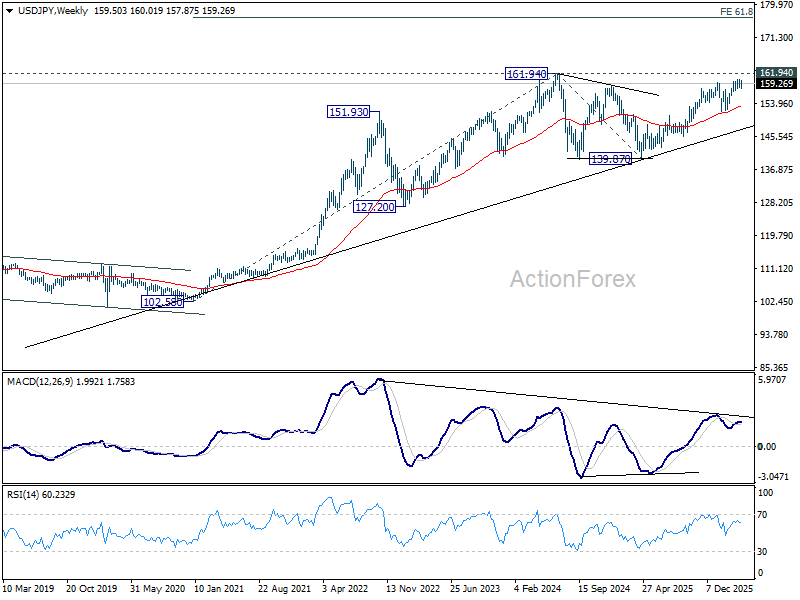
In the bigger picture, outlook is unchanged that corrective pattern from 161.94 (2024 high) should have completed with three waves at 139.87. Larger up trend from 102.58 (2021 low) could be ready to resume through 161.94. This will remain the favored case as long as 55 W EMA (now at 155.24) holds. Firm break of 161.94 will pave the way to 61.8% projection of 102.58 to 161.94 from 139.87 at 176.75.
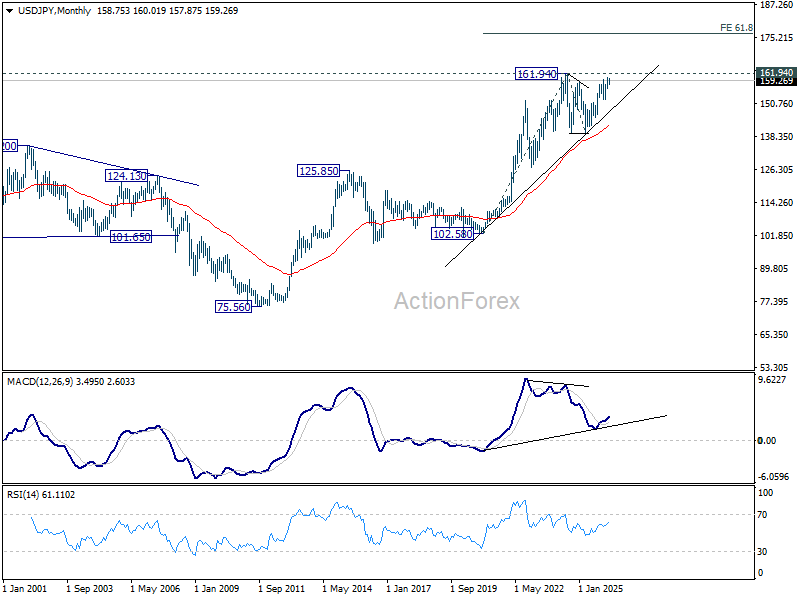
In the long term picture, up trend from 75.56 (2011 low) is still in progress and might be ready to resume. Firm break of 161.94 will target 61.8% projection of 102.58 (2020 low) to 161.94 (2024 high) from 139.87 at 176.55 in the medium term. Long term outlook will stay bullish as long as 139.87 support holds, even in case of deep pullback.
GBP/USD Weekly Outlook
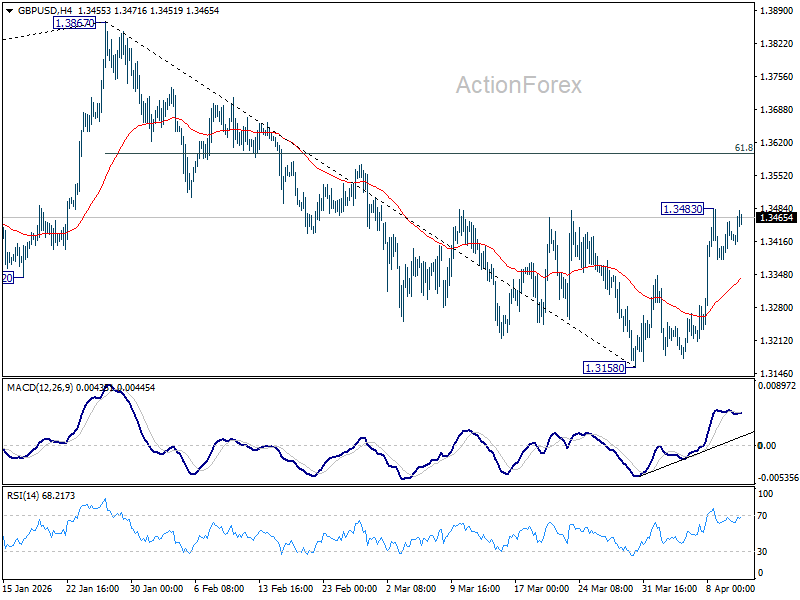
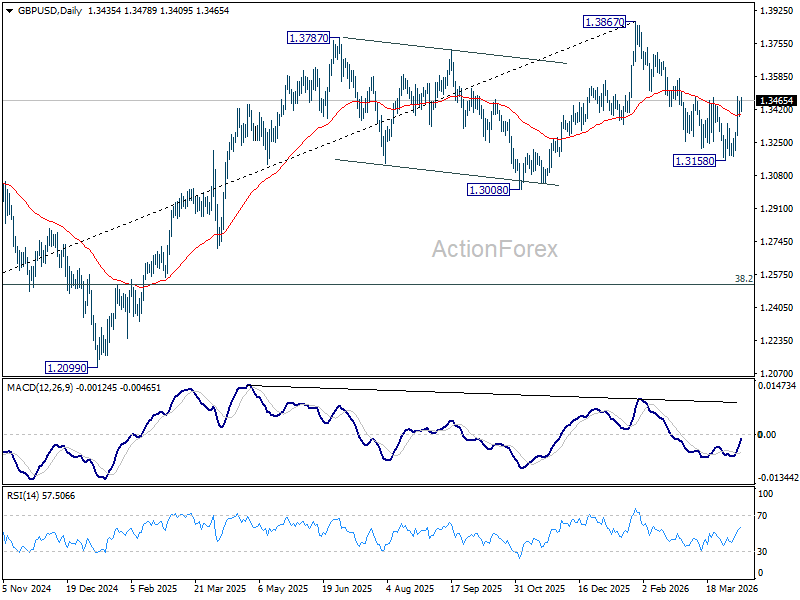
GBP/USD's strong rebound last week argues that correction from 1.3867 might have completed at 1.3158 already. But as a temporary top was formed at 1.3483, initial bias is neutral this week first. On the upside, above 1.3483 will target 61.8% retracement of 1.3867 to 1.3158 at 1.3596. Firm break there will bring retest of 1.3867 high. Nevertheless, sustained break of 55 4H EMA (now at 1.3342) will dampen this bullish view and bring retest of 1.3158 instead.
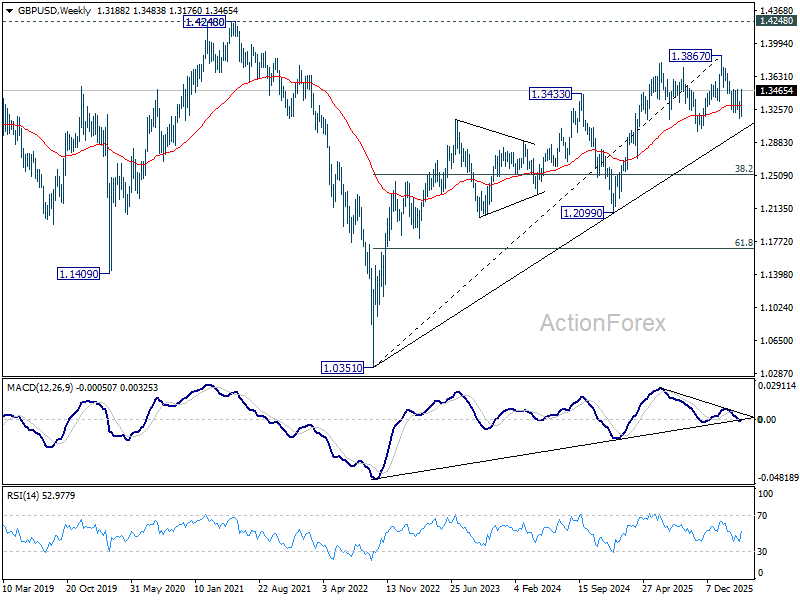
In the bigger picture, current development suggests that price actions from 1.3867 are merely a corrective pattern within the broader up trend from 1.0351 (2022 low). With 1.3008 support intact, medium term bullishness is maintained and break of 1.3867 is back in favor for a later stage, towards 1.4248 key resistance (2021 high).
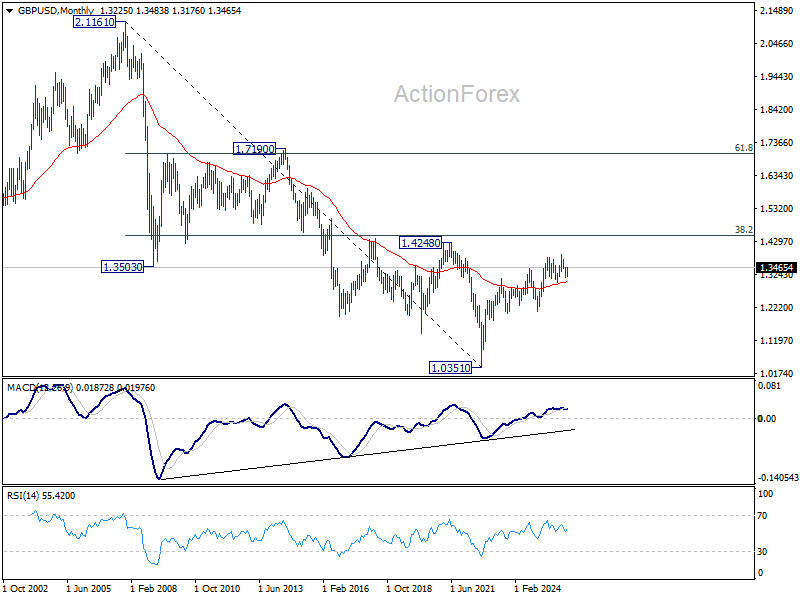
In the long term picture, as long as 1.4248/4480 resistance zone holds (38.2% retracement of 2.1161 to 1.0351 at 1.4480), the long term outlook will remain bearish. That is, price actions from 1.0351 are seen as a corrective pattern to down trend from 2.1161 (2007 high) only. Nevertheless, decisive break of 1.4248/4480 will be a strong sign of long term bullish reversal.
USD/CHF Weekly Outlook
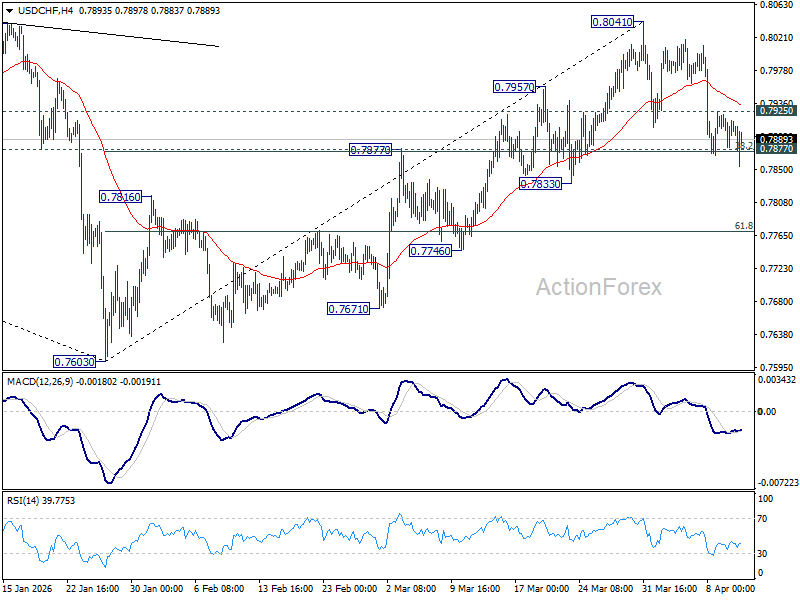
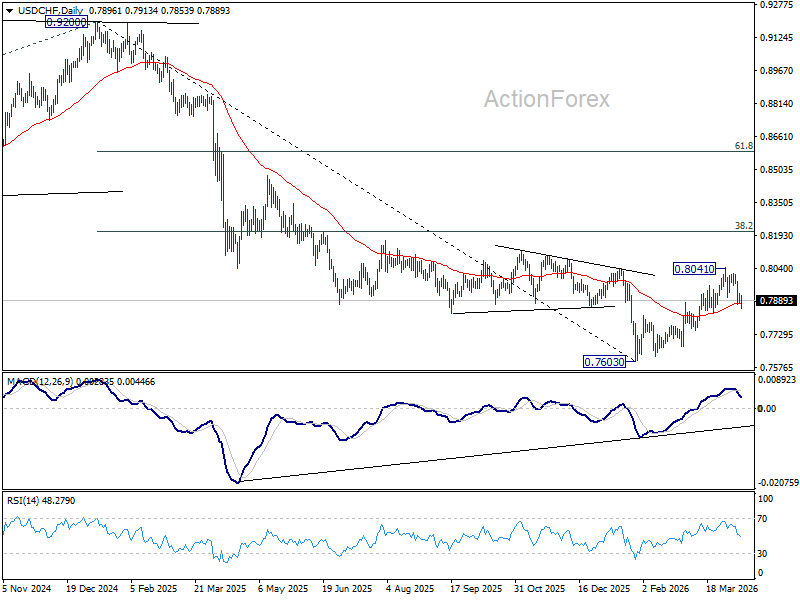
USD/CHF extended the pullback from 0.8041 short term top, but failed to sustain below 0.7877 cluster support (38.2% retracement of 0.7603 to 0.8041 at 0.7874). With 4H MACD crossed above signal line, initial bias is turned neutral first. On the downside, sustained trading below 0.7874/7 will argue that the rise from 0.7603 has completed, and bring deeper fall to 61.8% retracement at 0.7770 and below. Nevertheless, above 0.7925 minor resistance will turn turn bias back to the upside for retesting 0.8041.
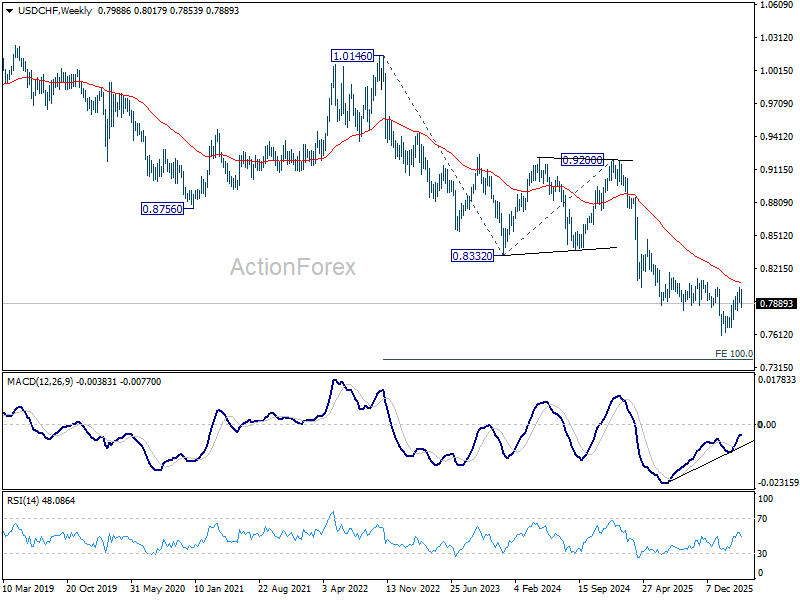
In the bigger picture, rebound from 0.7603 medium term bottom is seen as correcting the fall from 0.9200 only. Rejection by 55 W EMA (now at 0.8081) will affirm this bearish case, and setup down trend resumption to 100% projection of 1.0146 (2022 high) to 0.8332 from 0.9200 at 0.7382 at a later stage. Though, sustained break of 55 W EMA will suggest that it's probably correcting the larger scale down trend from 1.0146 (2022 high).
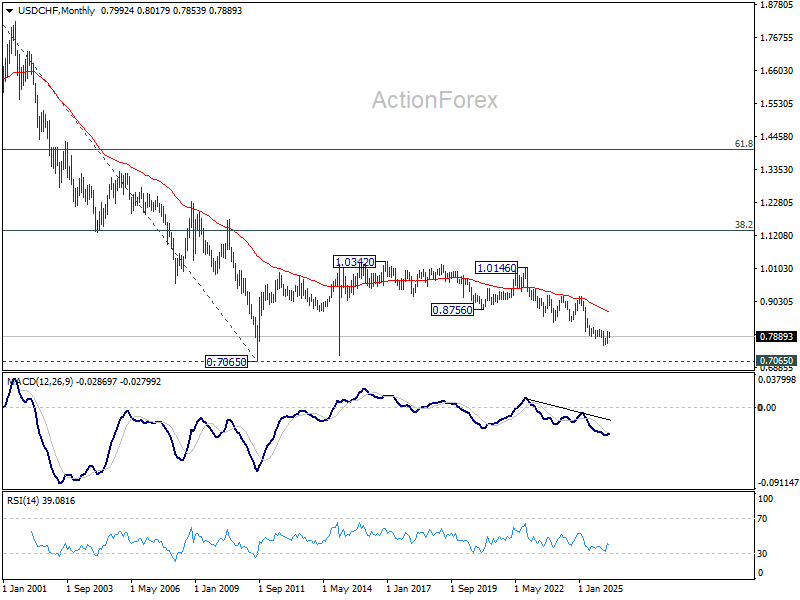
In the long term picture, price action from 0.7065 (2011 low) are seen as a corrective pattern to the multi-decade down trend from 1.8305 (2000 high). It's uncertain if the fall from 1.0342 is the second leg of the pattern, or resumption of the downtrend. But in either case, outlook will stay bearish as long as 0.8756 support turned resistance holds (2021 low). Retest of 0.7065 should be seen next.
AUD/USD Weekly Report
AUD/USD's strong rebound last week suggests that pullback from 0.7187 has completed at 0.6832 already. Initial bias stays mildly on upside this week for retesting 0.7187. Strong resistance could be seen there to bring another fall to extend the near term corrective pattern. On the downside, below 0.7021 minor support will turn intraday bias neutral again first.
In the bigger picture, as long as 0.6706 cluster support holds, rise from 0.5913 (2024 low) should still be in progress. Decisive break of 61.8% retracement of 0.8006 to 0.5913 at 0.7206 will solidify the case that it's already reversing the down trend from 0.8006 (2021 high). However, firm break of 0.6706 will dampen this bullish case, and bring deeper fall back to 0.6420 support, and possibly below.
In the long term picture, rise from 0.5913 is seen as the third leg of the whole pattern from 0.5506 (2020 low). It's still early to judge if this is an impulsive or corrective pattern. But in either case, further rise should be seen back to 0.8006 and possibly above. This will remain the favored case as long as 55 W EMA (now at 0.6683) holds.
USD/CAD Weekly Outlook
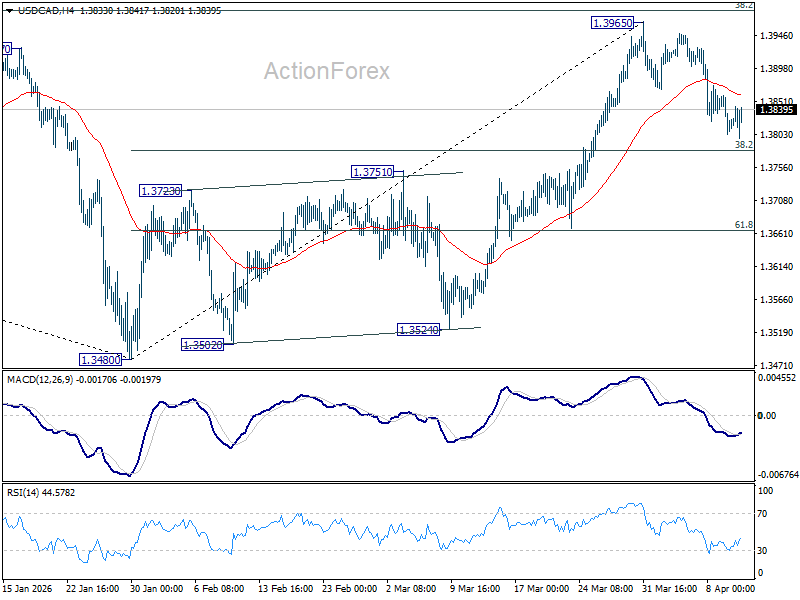
USD/CAD's pullback from 1.3965 extended lower last week but downside is contained above 38.2% retracement of 1.3840 to 1.3965 at 1.3780. Initial bias stays neutral and further rise remains in favor. On the upside, firm break of 1.3965 will resume the rise from 1.3480. However, sustained break of 1.3780 will argue that the rebound from 1.3840 has completed, and bring deeper decline to 61.8% retracement at 1.3665 and below.
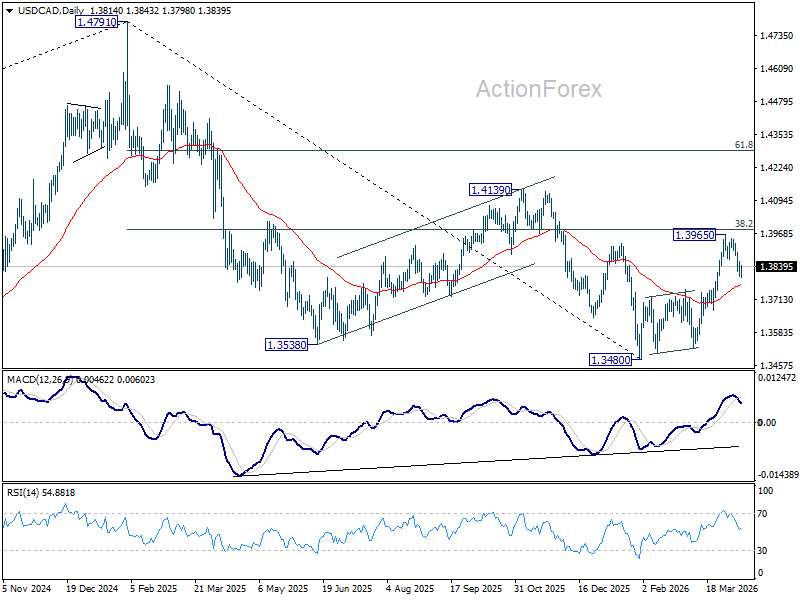
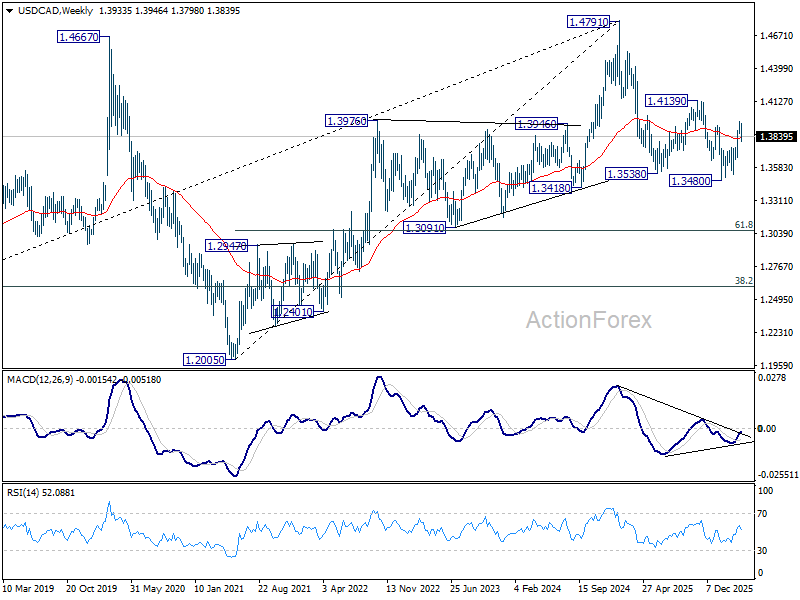
In the bigger picture, price actions from 1.4791 are seen as a corrective pattern to the whole up trend from 1.2005 (2021 low). Deeper fall could be seen, as the pattern extends, to 61.8% retracement of 1.2005 to 1.4791 at 1.3069. However, decisive break of 38.2% retracement of 1.4791 to 1.3480 at 1.3981 will argue that the correction has completed with three waves down to 1.3480 already. Further break of 1.4139 will confirm and bring retest of 1.4791 high.
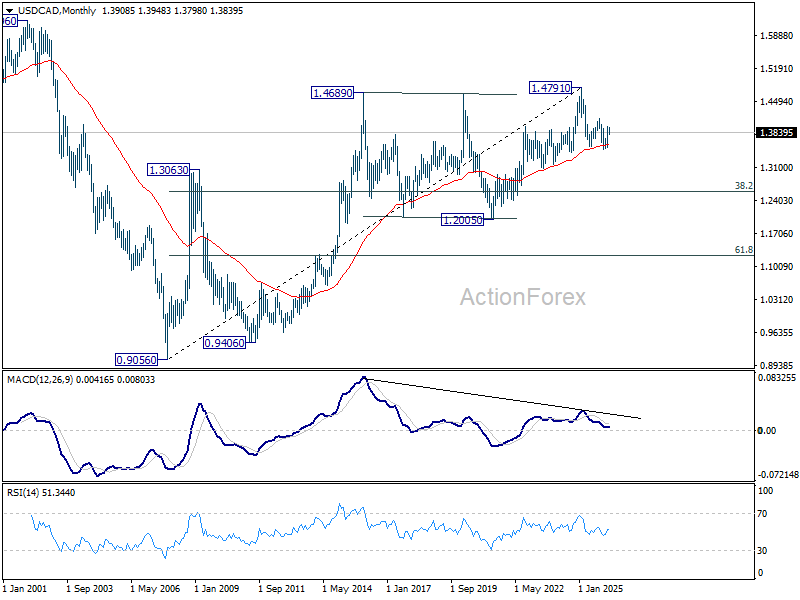
In the long term picture, rising 55 M EMA (now at 1.3590) remains intact. Thus, up trend from 0.9056 (2007 low) could still be in progress. However, considering bearish divergence condition M MACD, sustained trading below 55 M EMA will argue that the up trend has completed with five waves up to 1.4791, and turn medium term outlook bearish for correction to 38.2% retracement of 0.9056 to 1.4791 at 1.2600.
GBP/JPY Weekly Outlook
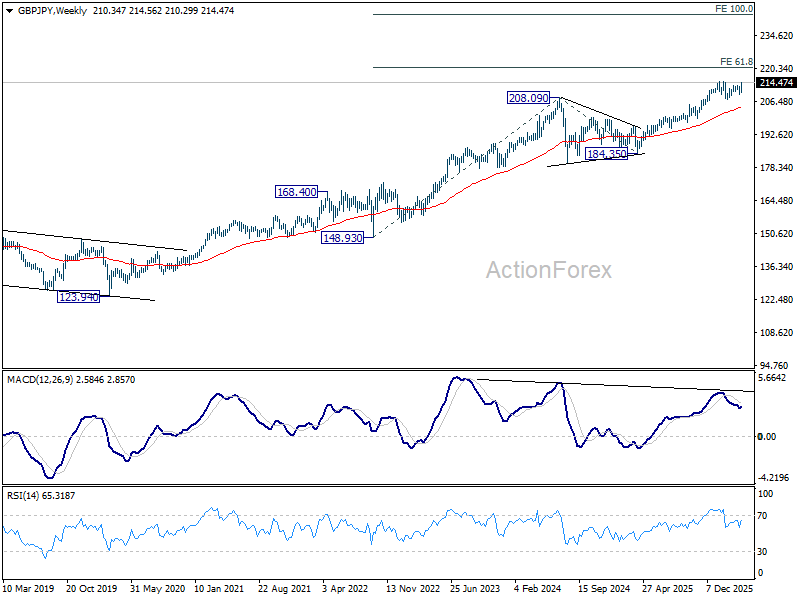
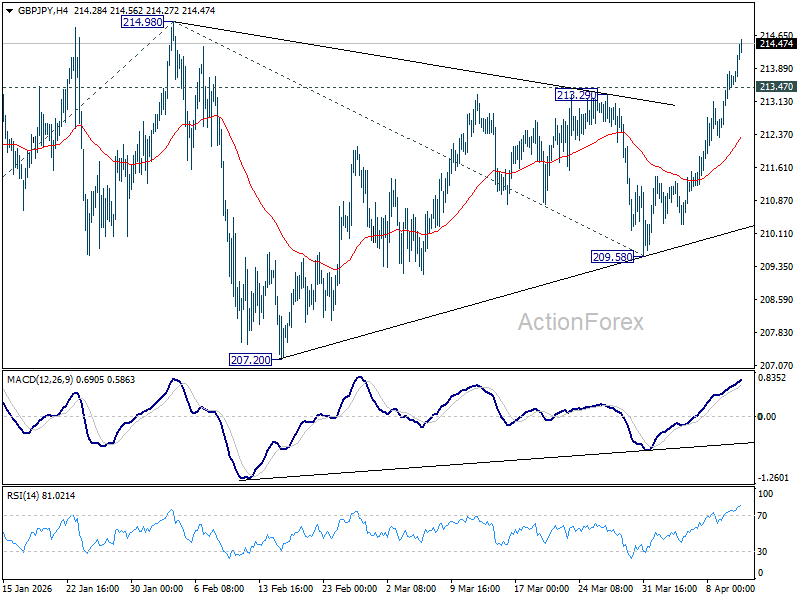
GBP/JPY's strong rally last week suggests that consolidation from 214.98 might have completed at 209.58, and larger up trend is resuming. Initial bias stays on the upside for retesting 214.98 first. Firm break there will confirm and target 61.8% projection of 199.04 to 214.98 from 209.58 at 219.43. On the downside, below 213.47 minor support will delay the bullish case, and turn intraday bias neutral again first.
In the bigger picture, up trend from 123.94 (2020 low) is still in progress. Firm break of 214.98 will target 61.8% projection of 148.93 (2022 low) to 208.09 (2024 high) from 184.35 at 220.90. This will remain the favored case as long as 55 W EMA (now at 204.10) holds, even in case of another deep pullback.
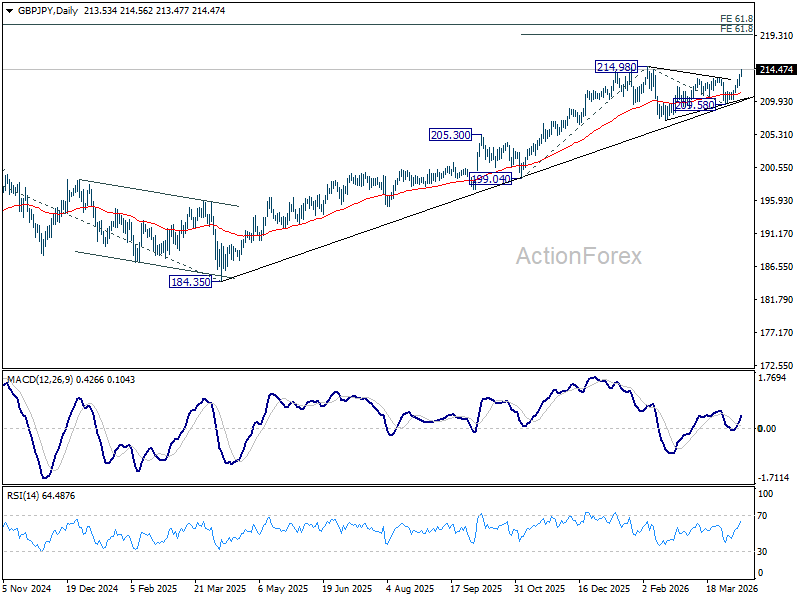
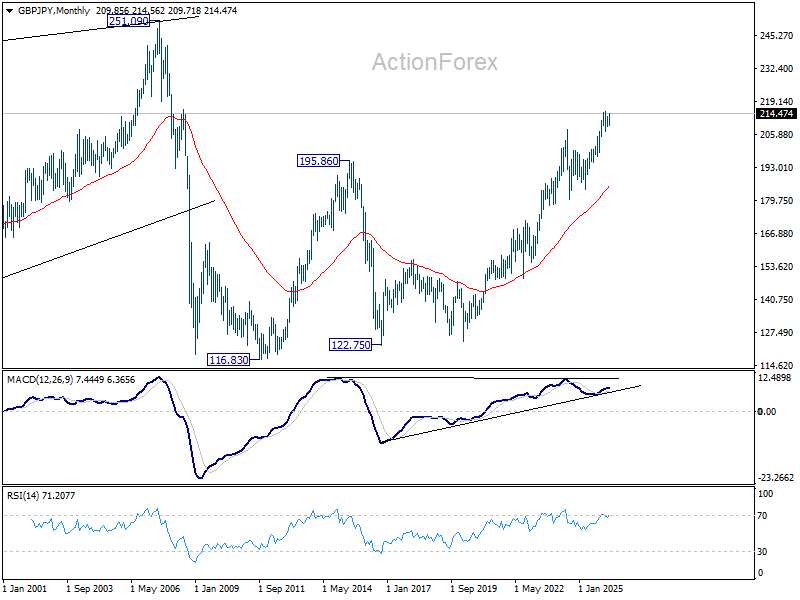
In the long term picture, up trend from 116.83 (2011 low) is in progress. Next target is 251.09 (2007 high). This will remain the favored case as long as 55 M EMA (now at 184.92) holds.