Sample Category Title
Could Tokyo CPI Open the Door to BoJ Policy Normalization?
- Tokyo CPI report kicks off a very interesting period for the BoJ
- Earnings data under the microscope until outcome of wage talks
- Yen remains under pressure against the US dollar
- Tokyo CPI released on Tuesday; average earnings data on Thursday
The BoJ is looking for an opening to hike rates
The market has already started the countdown to the March central bank meetings. The ECB gathering is scheduled for this Thursday while the Fed will meet on March 20. With the market speculating on the likely start date of the rate cutting cycle by the two heavyweights, the Bank of Japan is still trying to make its first step towards monetary policy normalization.
Under Governor Ueda, the BoJ has become more determined and less tentative about its rates outlook. However, a big piece of the puzzle appears to still be missing for the much-discussed rate hike: the economic evidence. In addition, the first step is usually the hardest one and hence the BoJ wants to have sufficient justification in order to avoid a rate move that could be deemed as a policy mistake down the line.
Having said that, most often central banks have to take the risk and act based on incomplete information. The Shunto (wage negotiations) has started and preliminary results expected around the middle of March. Initial information is mixed as, for example, the Toyota car manufacturer is still in discussions with the trade union despite the fact that in the past two years it accepted the union's demands in full on their first meeting.
Since the wage negotiations continue across Japan, the BoJ will have to be content with the incoming economic data. This week, the February inflation report from Tokyo will be published on Tuesday followed by average earnings data on Thursday. These releases will most likely be overshadowed by both the ECB meeting and the US labour market statistics, but the US dollar/yen pair is expected to pay attention to the Japanese data calendar as well.
BoJ craves for stronger CPI prints
The national CPI print for January, published last week, showed waning inflationary pressures. The headline indicator dropped to a 22-month low and the core component, which excludes fresh food prices, confirmed the recently aggressive downward trend. On the flip side, inflation excluding fresh food and energy remains elevated at a respectable 3.5% year-on-year change.
Tuesday’s Tokyo CPI report could open the door to a hawkish BoJ meeting on March 19 if the two published core indicators manage to surprise on the upside. Interestingly, the core component excluding fresh food is seen rising by 2.5% in February, higher than the 1.6% yearly change recorded in January. In any case, the BoJ will probably hope that the full Shunto results dazzle and hence allow it to, at least, abandon the current negative rates regime.
Moving to Thursday’s calendar and the earnings figures will be closely scrutinized. Despite expectations for stronger prints, the yearly pace of the labour cash earnings remains subdued, with overall household spending stuck in negative yearly territory. An improvement in both indicators would be welcomed by the BoJ as an indication of the public potentially changing its consumer spending approach.
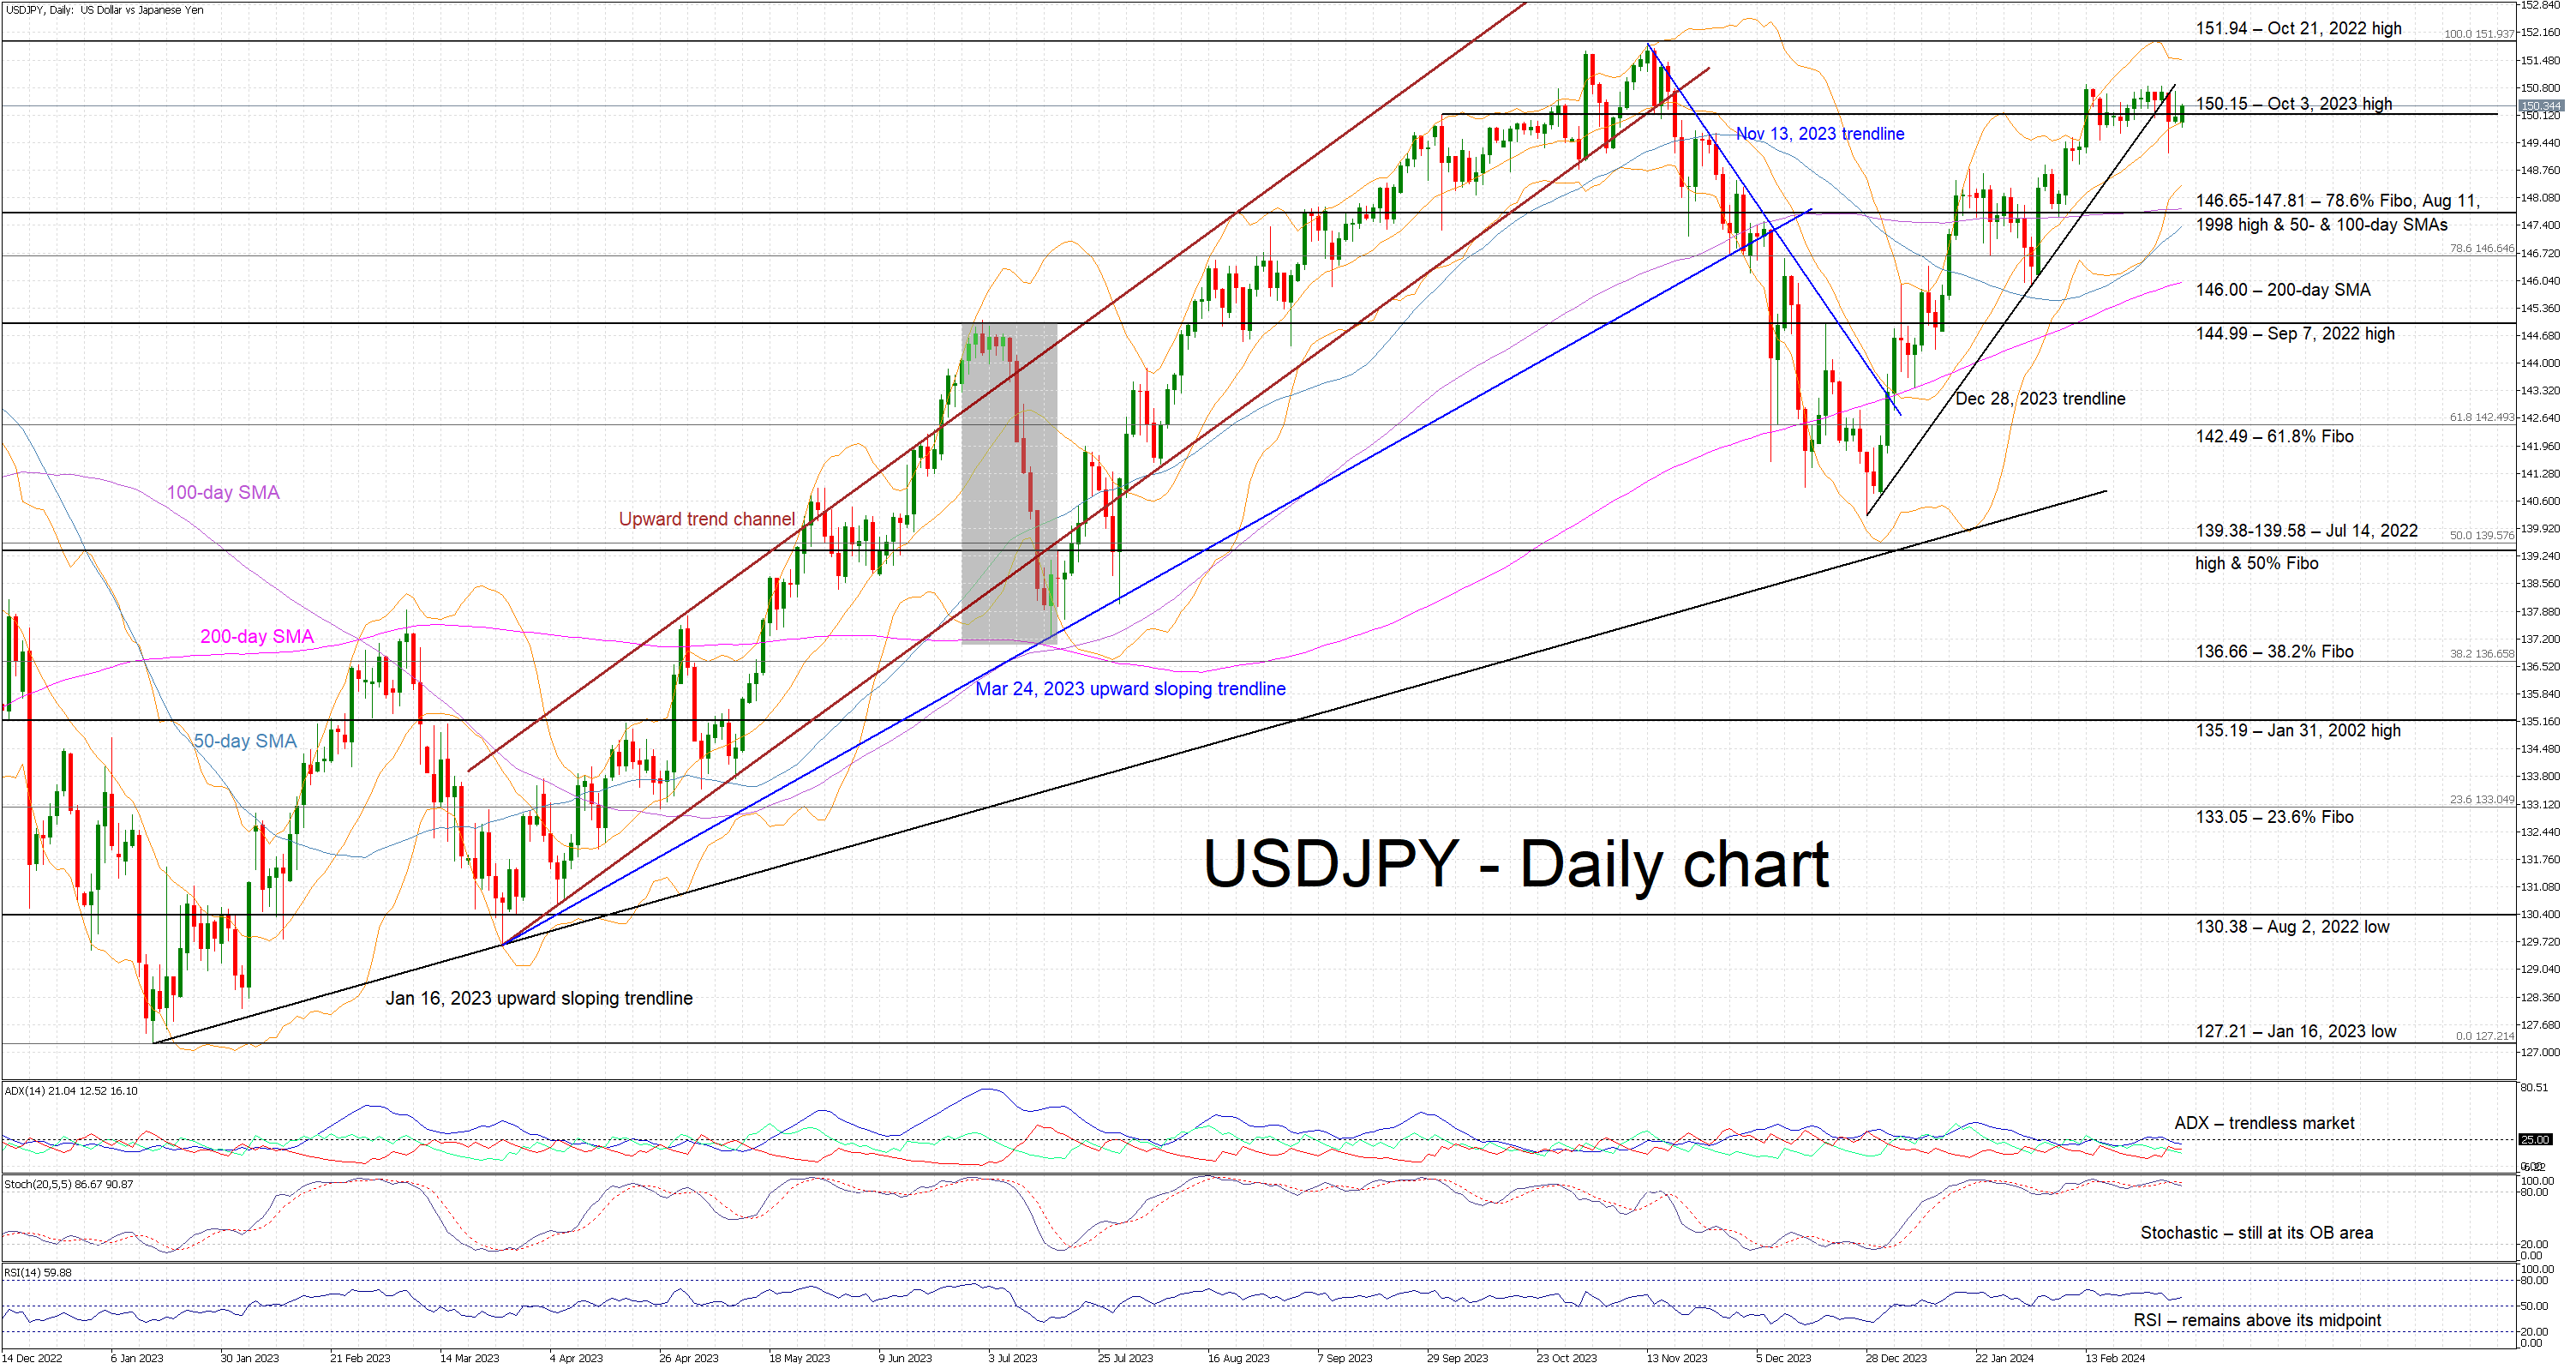
US dollar/yen continues to hover around 150
With the dollar/yen pair trading around the 150 level, the verbal interventions from Japanese officials are expected to continue, potentially limiting the upside. However, at the end of the day, strong economic data from Japan are a prerequisite for a sustainable correction in this pair.
A strong set of data releases this week could push dollar/yen towards the key 146.65-147.81 support area. On the flip side, the combination of weaker Japanese prints and stronger US labour data could open the door to another upleg towards the October 21, 2022 high at 151.94, resulting in more forceful commentary from Japanese officials.
Japanese Yen Steady ahead of Tokyo Core CPI
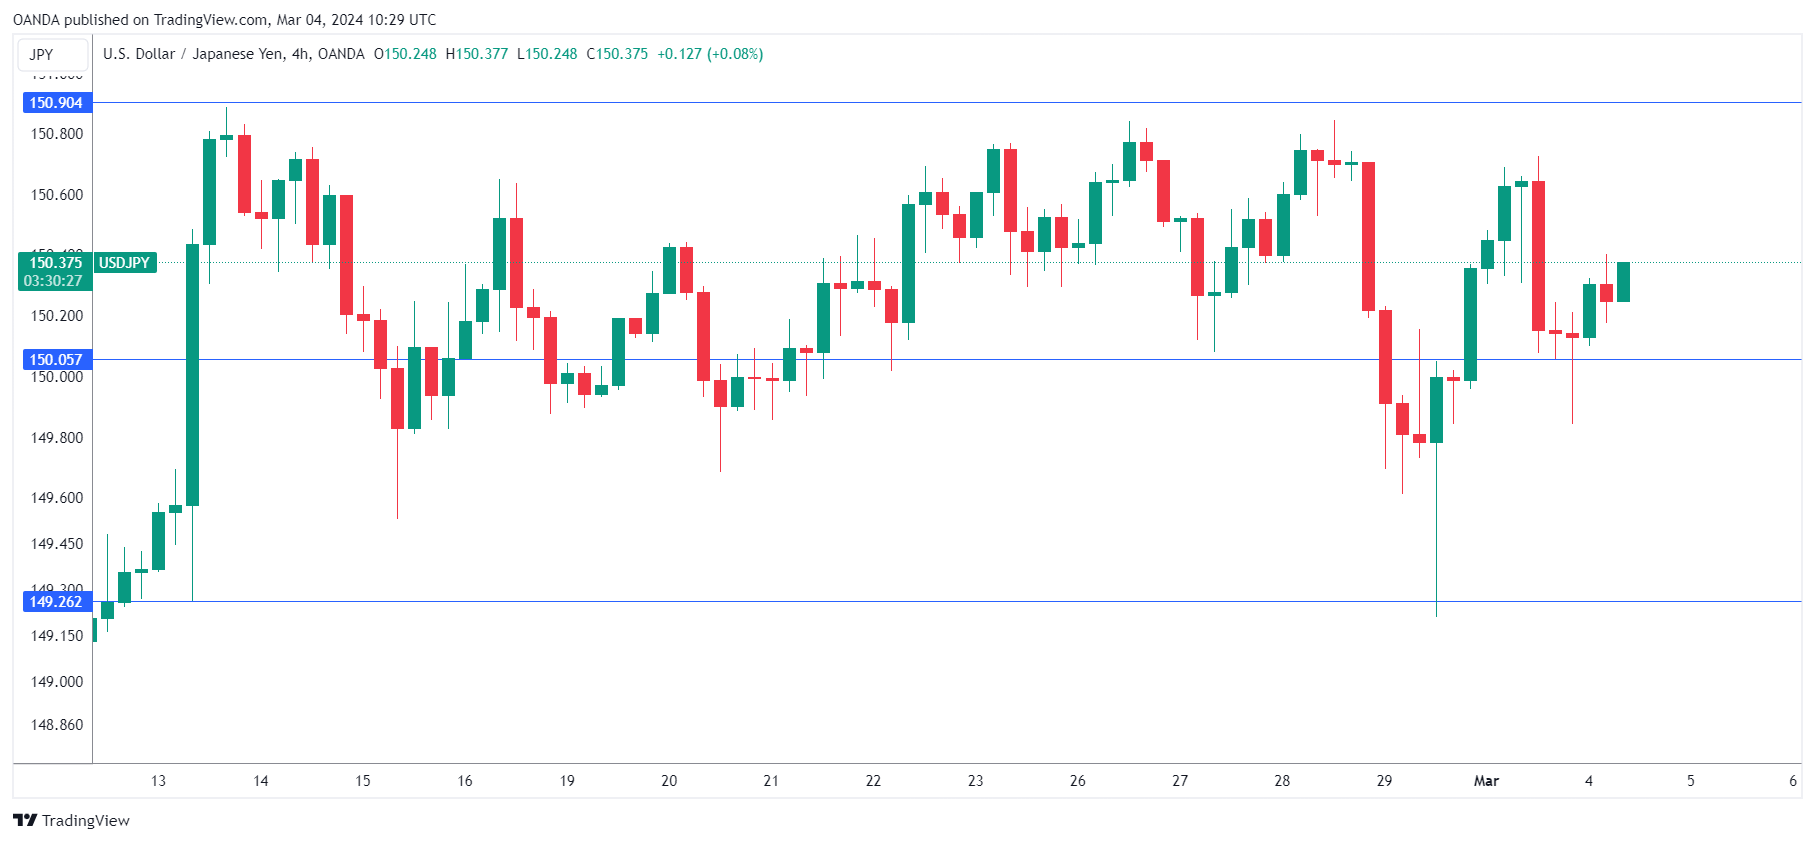
The Japanese yen is showing limited movement on Monday. In the European session, USD/JPY is trading at 150.34, up 0.13%.
Tokyo Core CPI expected to rise to 2.5%
Japan releases Tokyo Core CPI, considered the most important inflation indicator, on Tuesday. The index fell to 1.6% y/y in January, below expectations and the lowest rate since May 2022, but the market estimate for February stands at 2.5%.
Inflation remains a key factor for the Bank of Japan as it mulls exiting its ultra-loose monetary policy. According to a report on the weekend, the government is considering announcing an official end to deflation. This would be a symbolic move but would likely be viewed by the markets as another signal that Tokyo is planning to remove negative interest rates in the next several months. After years of an ultra-accommodative policy, such a move would mark a sea-change for the Bank of Japan and would likely give a strong boost to the ailing Japanese currency.
On Thursday, Bank of Japan board member Hajime Takata said that the BoJ must overhaul is ultra-loose monetary policy, including an end to negative rates and removing bond yield control. Takata added that the BoJ was “seeing prospects of achieving our 2% inflation target”.
The initial results of Japan’s annual wage negotiations will be released on March 15th, followed by the BoJ meeting on March 19. The wage talks are expected to result in workers receiving higher wages, which will likely result in higher inflation. The BoJ isn’t expected to make any policy changes at the March meeting, with April or June the likely dates for a major announcement.
USD/JPY Technical
- There is resistance at 150.90 at 151.69
- 150.05 and 149.26 are providing support
WTI Oil Price Reaches 4-month High Against the Backdrop of OPEC+ Decision
On Friday, the price of a barrel of WTI crude oil exceeded USD 80 per barrel due to the decision to continue the policy of reducing oil production by OPEC+ countries.
Saudi Arabia said on Sunday it would extend oil production cuts until June to “maintain stability and balance in oil markets,” an official statement said. Kuwait and the United Arab Emirates also said they would also continue cuts.
NYT writes that the decision was expected. At the same time, the price of WTI oil exceeded USD 80 per barrel on Friday for the first time since the beginning of November 2023.
The price chart for WTI oil shows that the market has been in an upward trend since mid-December - the price has formed an upward channel (shown in blue). In addition to the OPEC+ policy, the strength of demand is also supported by:
→ uncertainty in the military conflict between Hamas and Israel;
→ facts of attacks on oil tankers in the Red Sea.
Will the price be able to consolidate at the peak reached? Arguments against the development of such a scenario are provided by a technical analysis of the WTI oil price chart:
→ the price is at the upper border of the ascending blue channel (that is, near the resistance line);
→ the USD 80 level can act as psychological resistance with the formation of a false breakout pattern;
→ the top formed on Friday is in the resistance area of the Fibonacci level of 50% of the decline A→B.
Thus, there are prerequisites to assume that the market is in a vulnerable position for a pullback after the effect of the news about the OPEC+ decision is fully taken into account. It is possible that the price of WTI oil may roll back to the support of the median line of the ascending blue channel.
Start trading commodity CFDs with tight spreads. Open your trading account now or learn more about trading commodity CFDs with FXOpen.
This article represents the opinion of the Companies operating under the FXOpen brand only. It is not to be construed as an offer, solicitation, or recommendation with respect to products and services provided by the Companies operating under the FXOpen brand, nor is it to be considered financial advice.
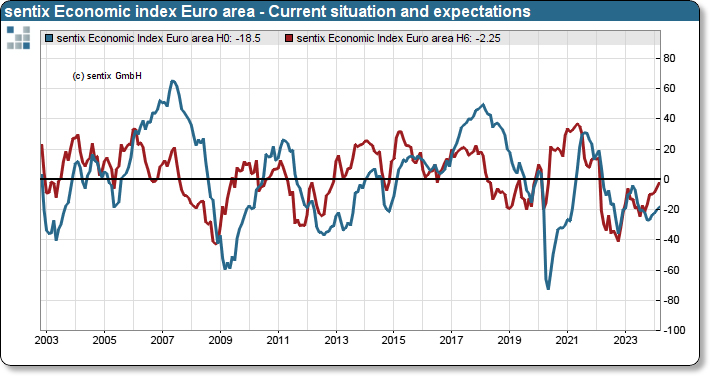
Eurozone Sentix rises to -10.5, but no classic spring revival
Eurozone Sentix Investor Confidence March climbed from -12.9 to -10.5 in March, slightly surpassing expectations of -10.8. This increment marks the fifth consecutive rise, achieving its highest level since April 2023. Current Situation Index also saw an increase for the fifth month, moving from -20.0 to -18.5, its highest since June 2023. Furthermore, Expectations Index had its sixth month of growth, advancing from -5.5 to -2.3, reaching its peak since February 2022, which predates the onset of the war in Ukraine.
Contrastingly, Germany, Eurozone's largest economy, displayed a divergent trend, with Investor Confidence declining for the third consecutive month to -27.9 from -27.1. Current Situation fell for the 3rd straight month from -39.3 to -40.5, lowest reading since July 2020. Expectations Index fell from -14.0 to -14.3.
Sentix analysts interpreted the overall Eurozone data as moving "in the right direction," though they cautioned against interpreting this as a sign of a "classic spring revival." This cautious stance is attributed to "changed interest rate landscape". Investors are expecting a more expansive monetary policy by ECB ahead.
Technical Outlook and Review
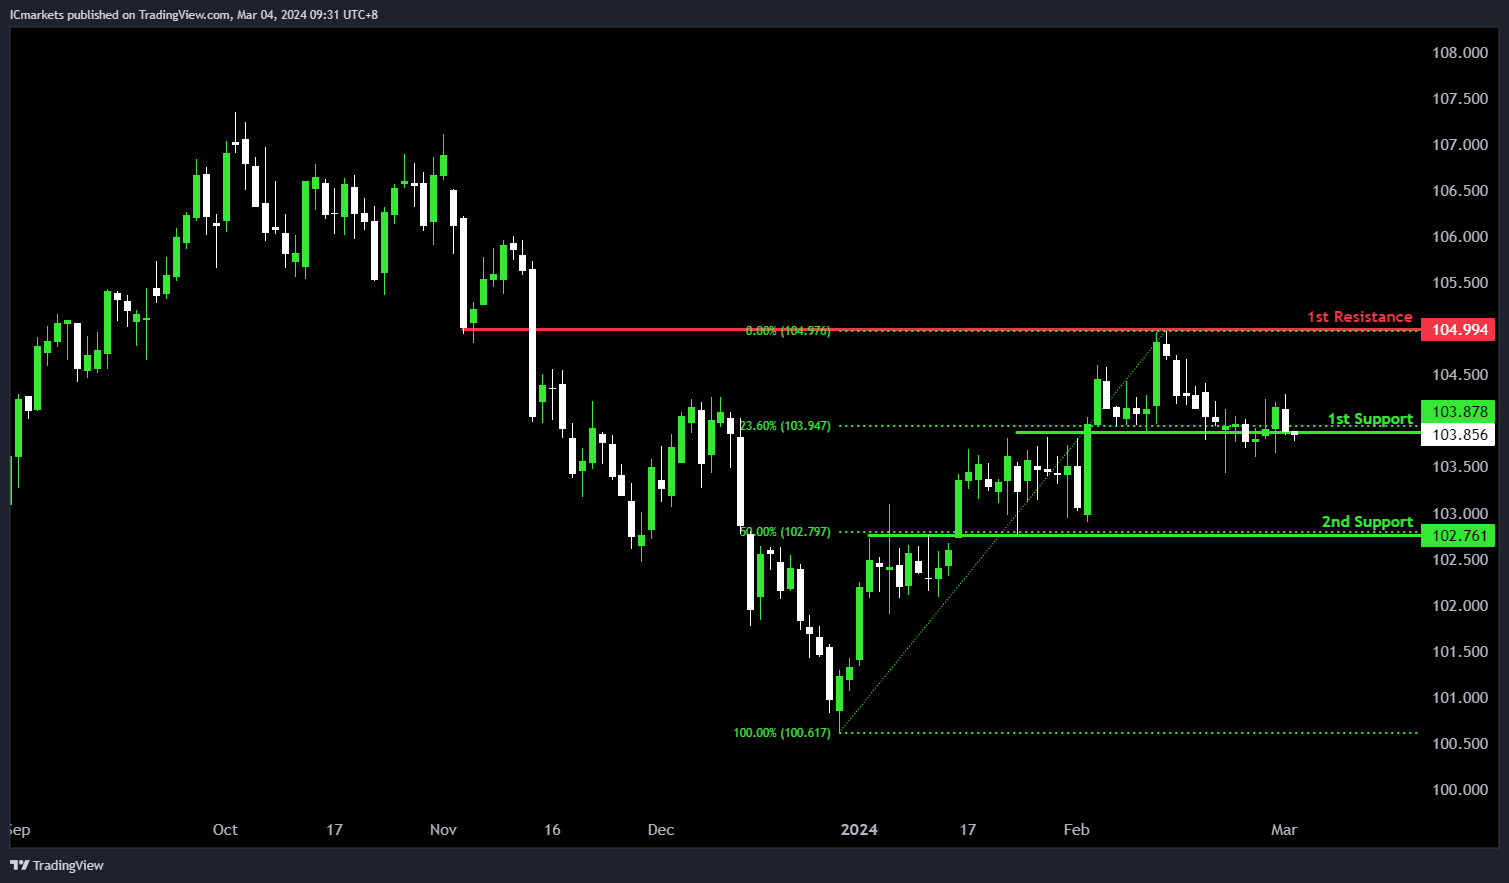
DXY:
The DXY (US Dollar Index) chart currently reflects bullish momentum, indicating a potential scenario of a bullish continuation towards the 1st resistance.
The 1st support level at 103.87 is recognized as an overlap support, coinciding with the 23.60% Fibonacci Retracement level. This convergence suggests a historically significant area where buying interest has previously emerged, potentially providing substantial support for the price.
Additionally, the 2nd support at 102.76 is characterized as an overlap support, aligning with the 50% Fibonacci Retracement level. This reinforces its significance as a key support zone, historically attracting buyers and potentially halting further downside movement.
Conversely, the 1st resistance at 104.99 is identified as an overlap resistance. This level historically serves as a significant barrier where selling pressure may intensify, potentially limiting upward movement in the short term.
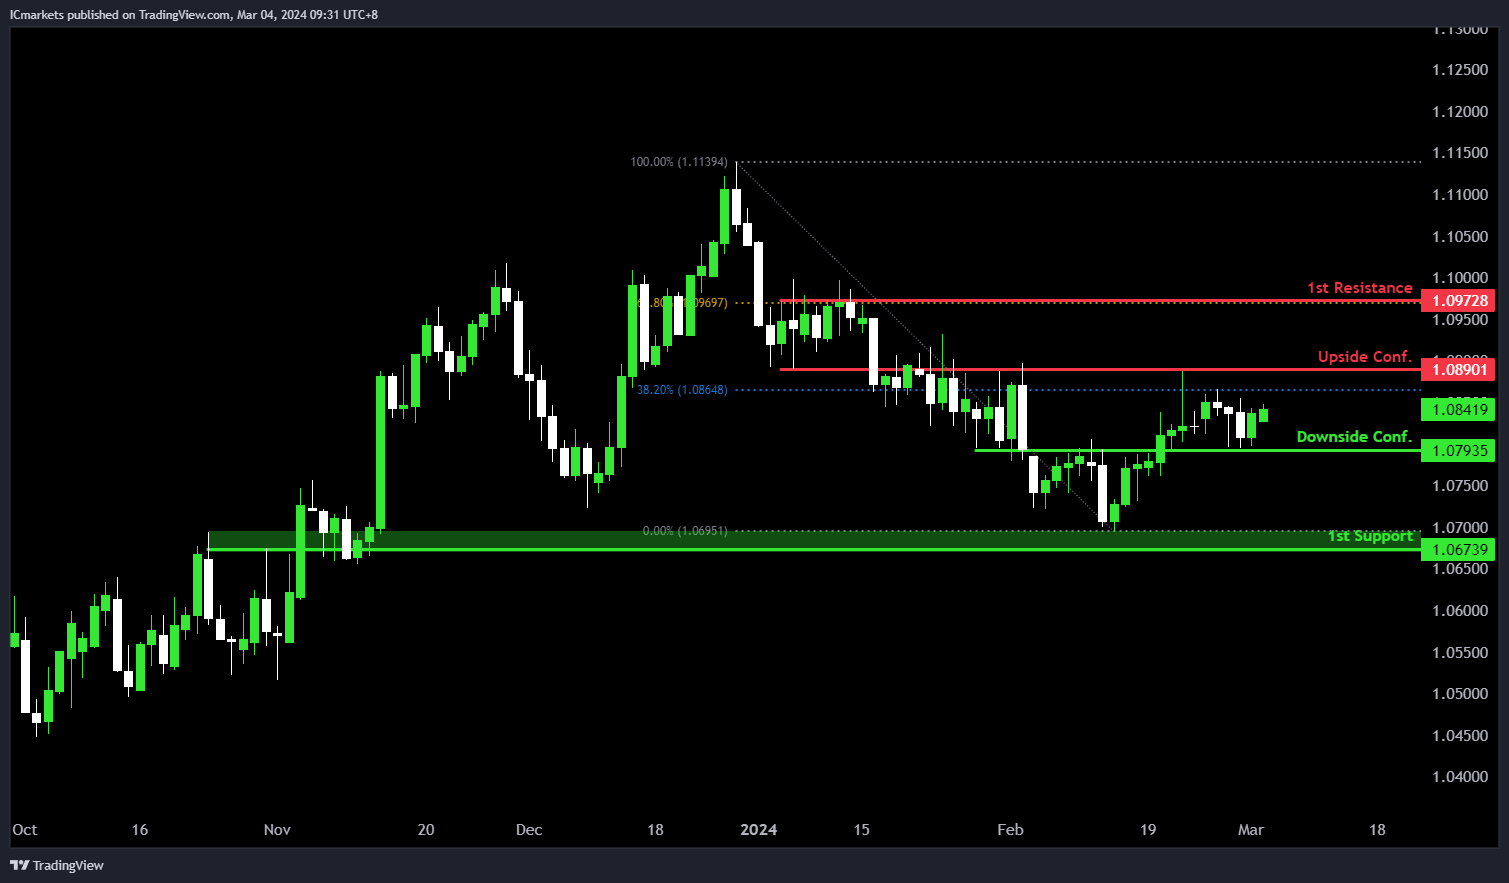
EUR/USD:
The EUR/USD chart currently reflects a neutral momentum, suggesting a potential scenario of fluctuation between the 1st resistance and 1st support levels.
The downside confirmation level at 1.0793 is recognized as an overlap support, historically indicating a significant area where buying interest has emerged, potentially providing support for the price.
Furthermore, the 1st support at 1.0673 is characterized as an overlap support, reinforcing its significance as a key level where buyers have historically intervened to prevent further decline.
On the upside, the upside confirmation level at 1.0890 is identified as an overlap resistance, coinciding with the 38.20% Fibonacci Retracement level. This convergence suggests a historically significant area where selling pressure may intensify, potentially limiting upward movement in the short term.
Moreover, the 1st resistance at 1.0972 is noted as a multi-swing high resistance, aligning with the 61.80% Fibonacci Retracement level. This further solidifies its significance as a level where selling interest may intensify, potentially capping the upside movement of prices.
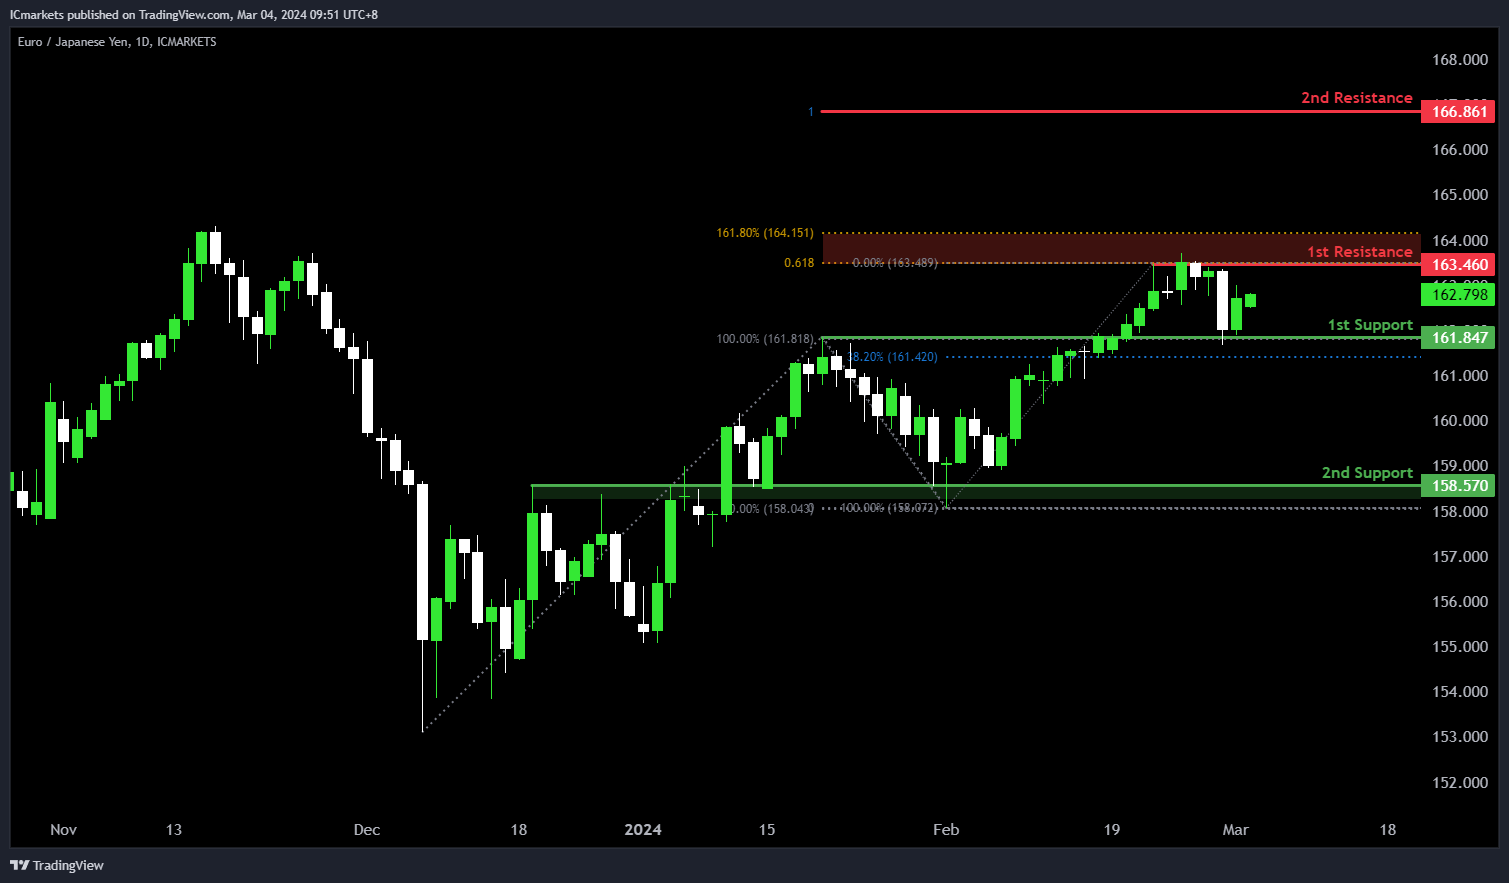
EUR/JPY:
The EUR/JPY chart is currently displaying bullish momentum, indicating a potential continuation towards the 1st resistance level.
The 1st support at 161.84 is identified as an overlap support, coinciding with the 38.20% Fibonacci Retracement level. This level historically signifies a point where buying interest has emerged, providing potential support for the price.
Furthermore, the 2nd support at 158.57 is characterized as an overlap support, further reinforcing its significance as a level where buyers have intervened in the past.
On the resistance side, the 1st resistance at 163.46 is identified as a multi-swing high resistance. It is notable for its confluence with the 161.80% Fibonacci Extension and the 61.80% Fibonacci Projection, indicating a strong barrier where selling pressure may intensify.
Additionally, the 2nd resistance at 166.86 is noted for its presence as a 100% Fibonacci Projection, further highlighting its importance as a level where selling interest may increase.
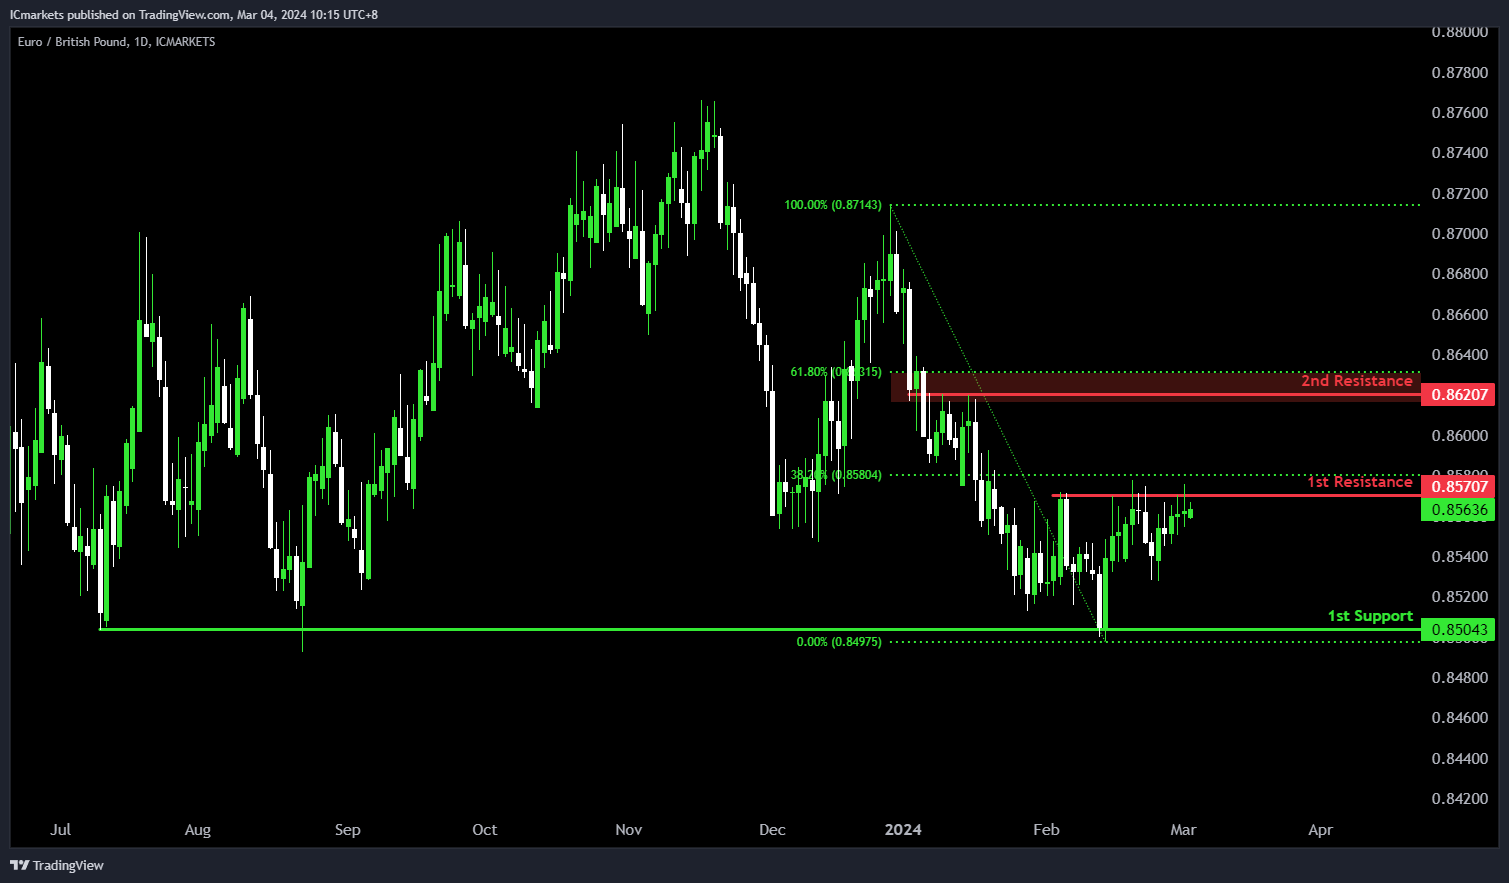
EUR/GBP:
The EUR/GBP chart currently indicates a bearish momentum, suggesting a potential scenario of a bearish reaction off the 1st resistance level followed by a drop towards the 1st support.
The 1st support level at 0.8504 is identified as a multi-swing low support, indicating its historical significance as a level where buying interest has previously emerged, potentially providing support for the price in the event of a decline.
On the resistance side, the 1st resistance at 0.8570 is identified as a multi-swing high resistance. Additionally, this level coincides with the 38.20% Fibonacci Retracement level, further reinforcing its significance as a barrier where selling pressure may increase, potentially causing a bearish reaction.
Furthermore, the 2nd resistance at 0.8620 is characterized as an overlap resistance, coinciding with the 61.80% Fibonacci Retracement level. This adds another layer of resistance, suggesting that selling interest may intensify at this level.
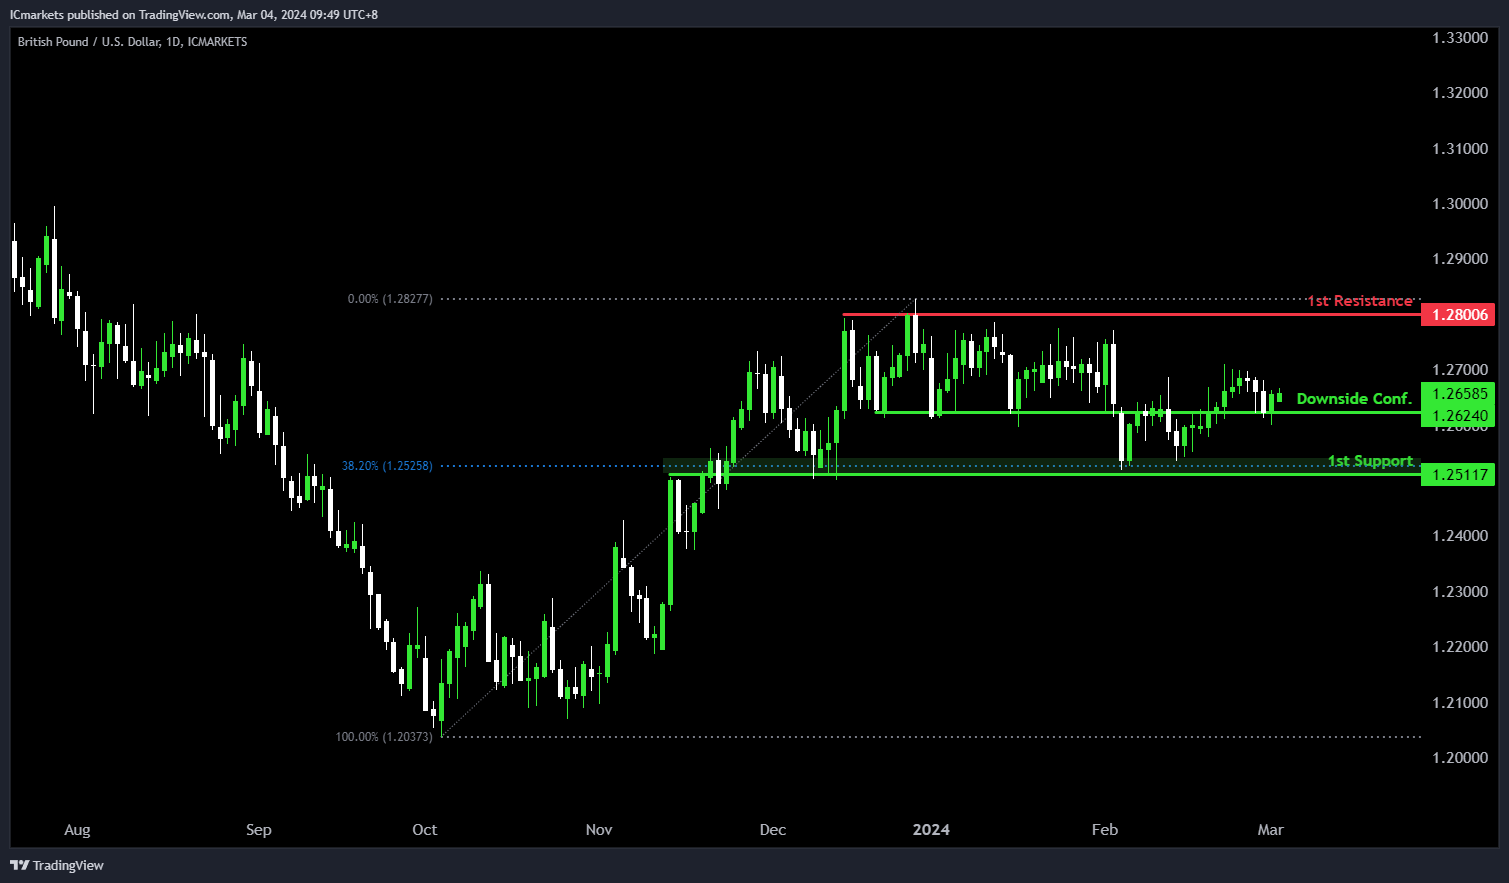
GBP/USD:
The GBP/USD chart currently indicates bearish momentum, suggesting a potential scenario of a bearish continuation towards the 1st support level.
The downside confirmation level at 1.2624 is recognized as an overlap support, historically indicating a significant area where buying interest has emerged, potentially providing support for the price.
Furthermore, the 1st support at 1.2511 is characterized as an overlap support, coinciding with the 38.20% Fibonacci Retracement level. This reinforces its significance as a key level where buyers have historically intervened to prevent further decline.
On the resistance side, the 1st resistance at 1.2800 is identified as a multi-swing high resistance. This level suggests historical significance as a barrier where selling pressure may increase, potentially limiting upward movement in the short term.
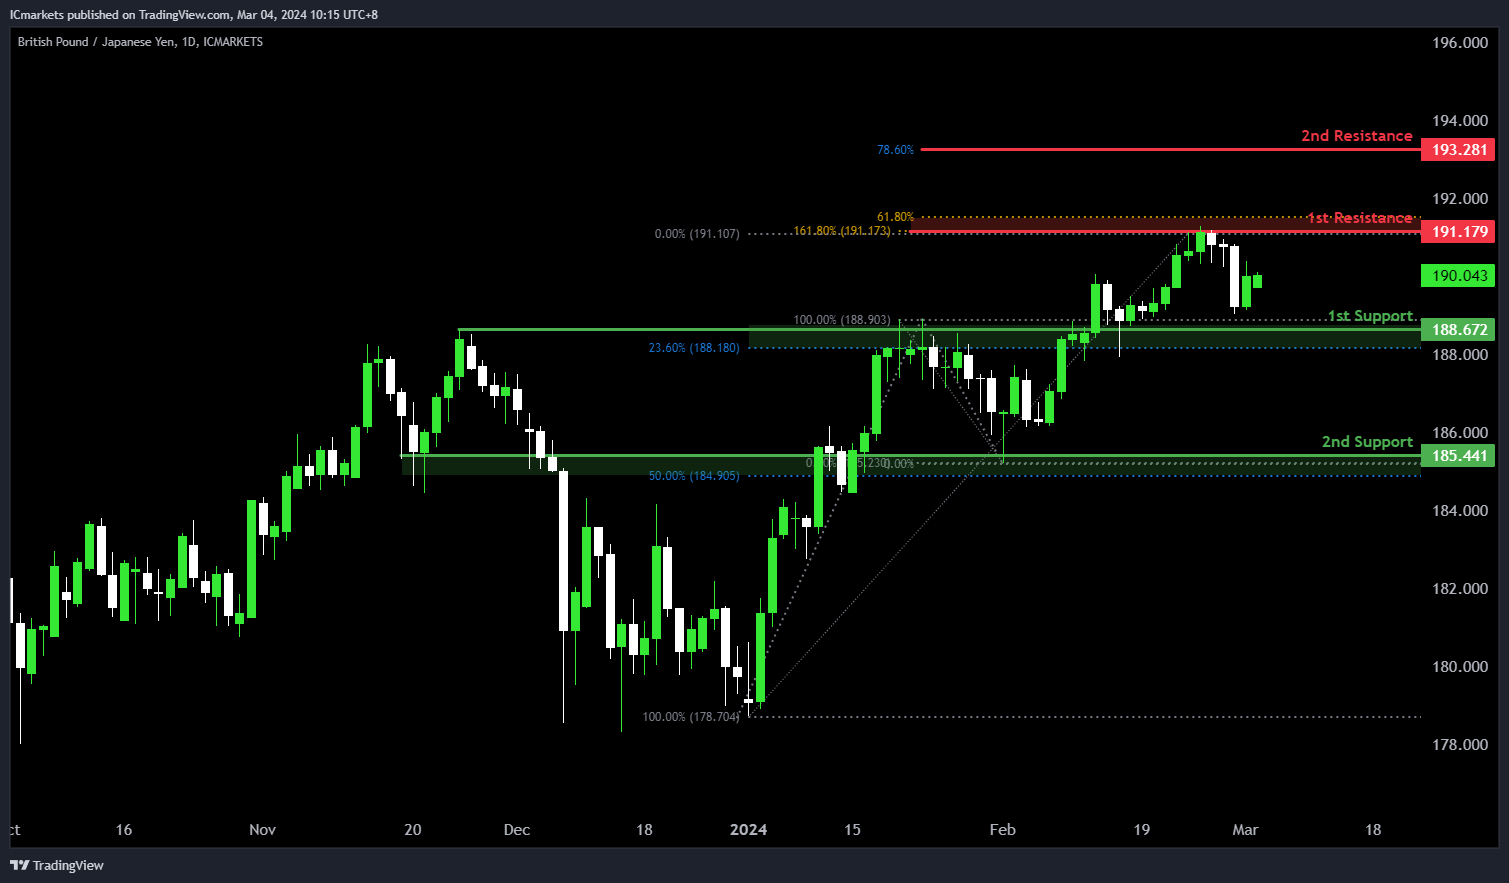
GBP/JPY:
The GBP/JPY chart currently exhibits bullish momentum, suggesting a potential scenario of a bullish continuation towards the 1st resistance.
The 1st support level at 188.67 is identified as an overlap support, coinciding with the 23.60% Fibonacci Retracement level. This level historically indicates a significant area where buying interest has emerged, potentially providing support for the price in case of a pullback.
Furthermore, the 2nd support at 185.44 is characterized as an overlap support, coinciding with the 50% Fibonacci Retracement level. This reinforces its significance as a level where buyers have historically intervened to prevent further decline.
On the resistance side, the 1st resistance level at 191.17 is identified as a swing high resistance. Additionally, this level is significant as it coincides with the 161.80% Fibonacci Extension and the 61.80% Fibonacci Retracement, indicating Fibonacci confluence and suggesting a strong resistance area.
Moreover, the 2nd resistance at 193.28 is noted for its presence at the 78.60% Fibonacci Retracement level, further reinforcing its importance as a level where selling pressure may intensify.
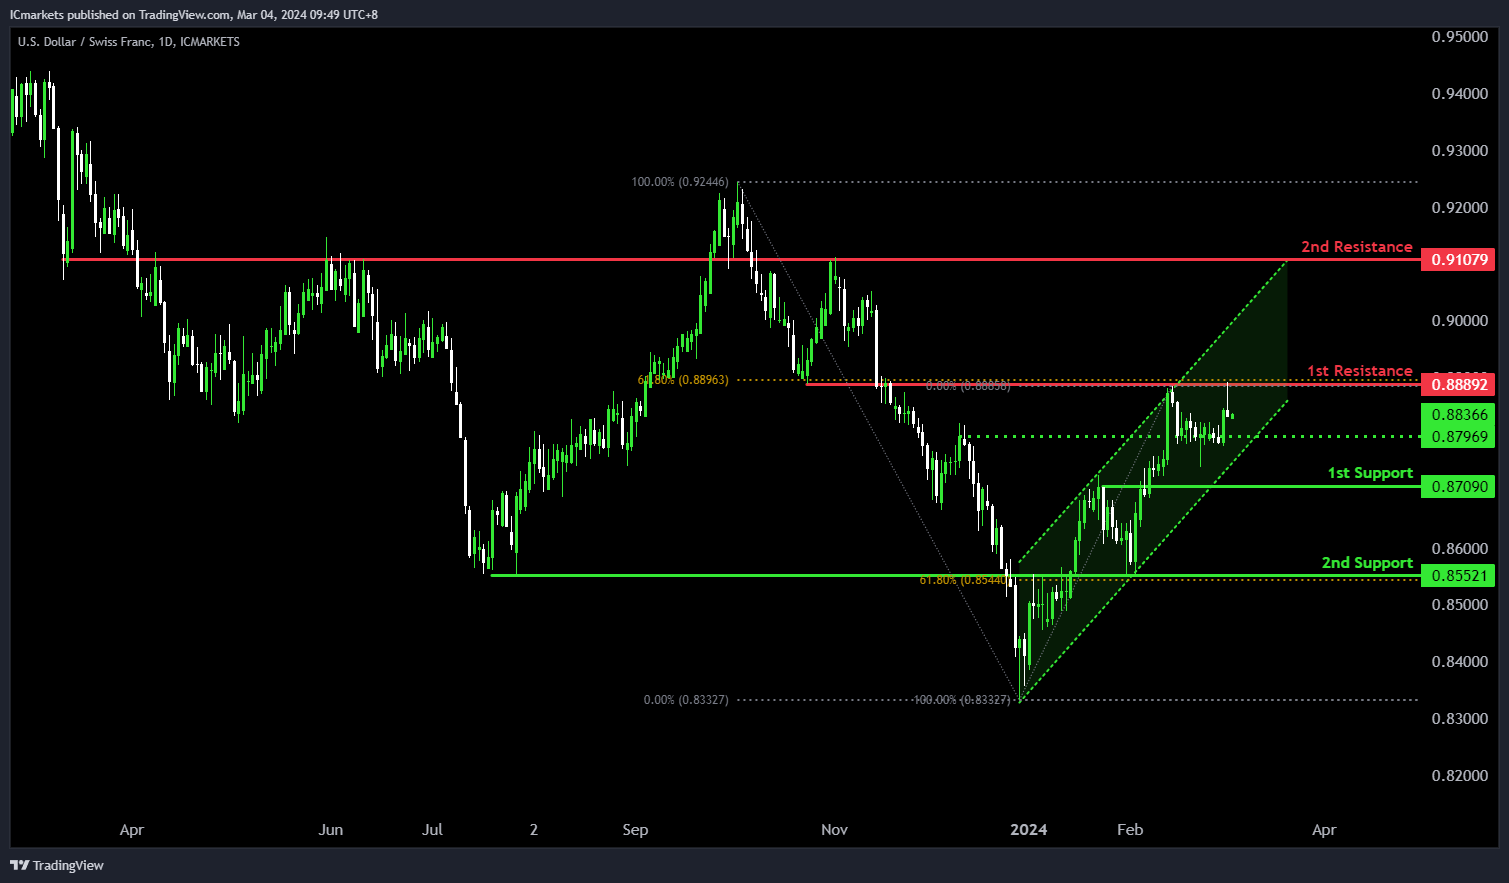
USD/CHF:
The USD/CHF chart exhibits bullish momentum, characterized by its presence in a bullish ascending channel, indicating a potential scenario of a short-term drop to the 1st support level before rebounding towards the 1st resistance.
The 1st support at 0.8709 is identified as a pullback support, historically indicating a level where buying interest has emerged, potentially providing support for the price.
Additionally, the 2nd support at 0.8552 is characterized as an overlap support, coinciding with the 61.80% Fibonacci Retracement level. This reinforces its significance as a key level where buyers may intervene to prevent further decline.
On the resistance side, the 1st resistance at 0.8889 is identified as an overlap resistance, coinciding with the 61.80% Fibonacci Retracement level. This level suggests historical significance as a barrier where selling pressure may increase.
Moreover, the 2nd resistance at 0.9107 is noted as an overlap resistance, further reinforcing its importance as a level where selling interest may intensify.
The intermediate support level at 0.8796 is also identified as an overlap support, providing additional confirmation of potential support for the price.
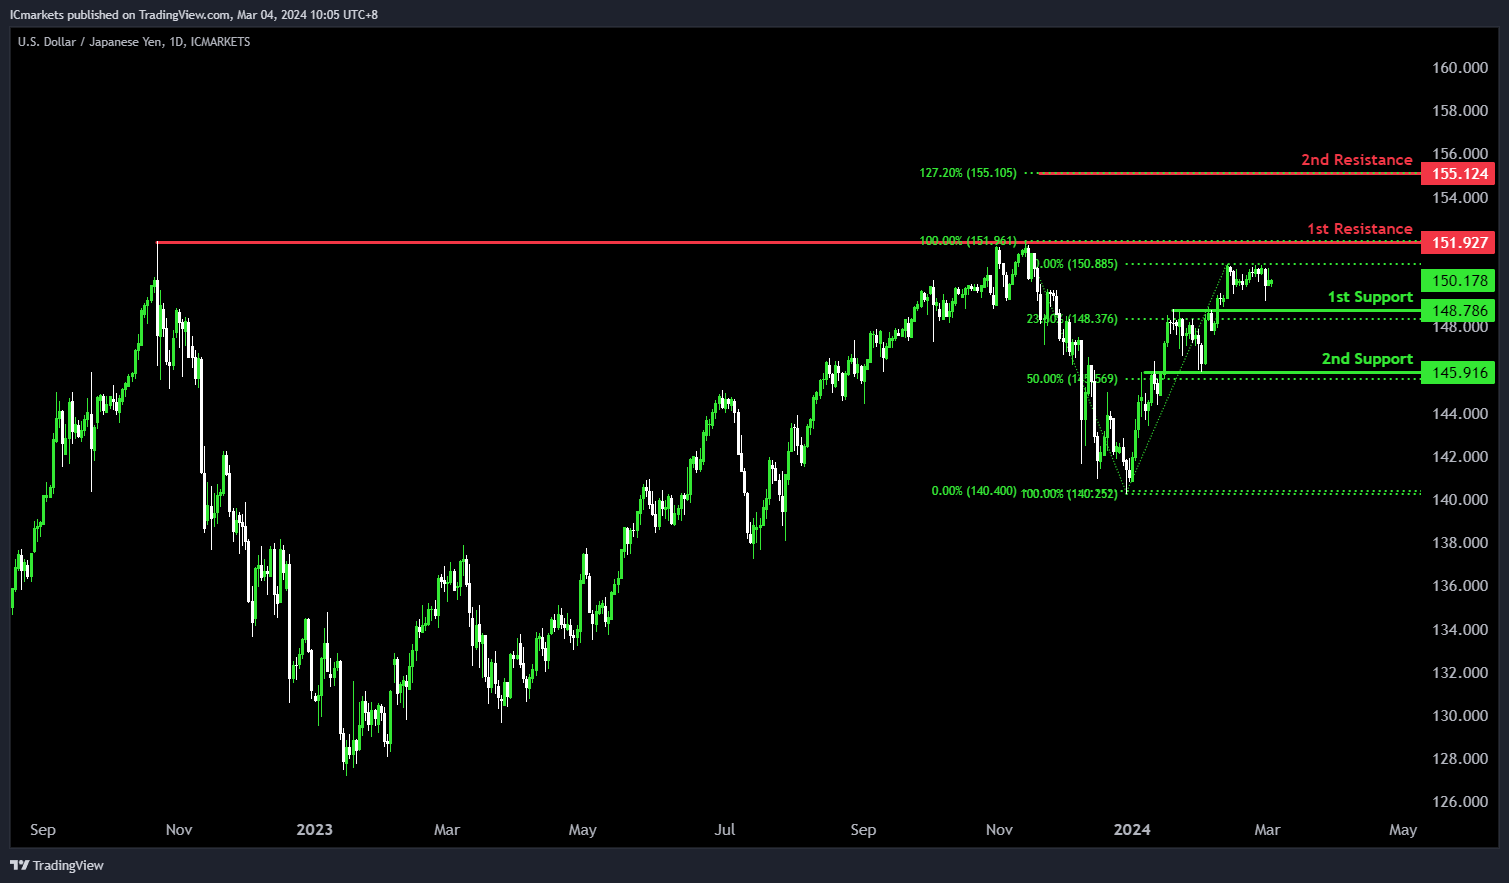
USD/JPY:
The USD/JPY chart is currently exhibiting bullish momentum, suggesting a potential short-term drop to the 1st support level before rebounding towards the 1st resistance.
The 1st support at 148.78 is identified as a pullback support, coinciding with the 23.60% Fibonacci Retracement level. This level historically indicates a point where buying interest has emerged, potentially offering support for the price.
Additionally, the 2nd support at 145.91 is characterized as an overlap support, aligning with the 50% Fibonacci Retracement level. This reinforces its significance as a level where buyers have historically intervened to prevent further decline.
On the resistance side, the 1st resistance at 151.92 is identified as a multi-swing high resistance, suggesting its historical importance as a barrier where selling pressure may increase, potentially limiting upward movement.
Moreover, the 2nd resistance at 155.12 is noted for its presence as a 127.20% Fibonacci Extension level, further solidifying its significance as a level where selling interest may intensify, potentially capping the upward movement of prices.
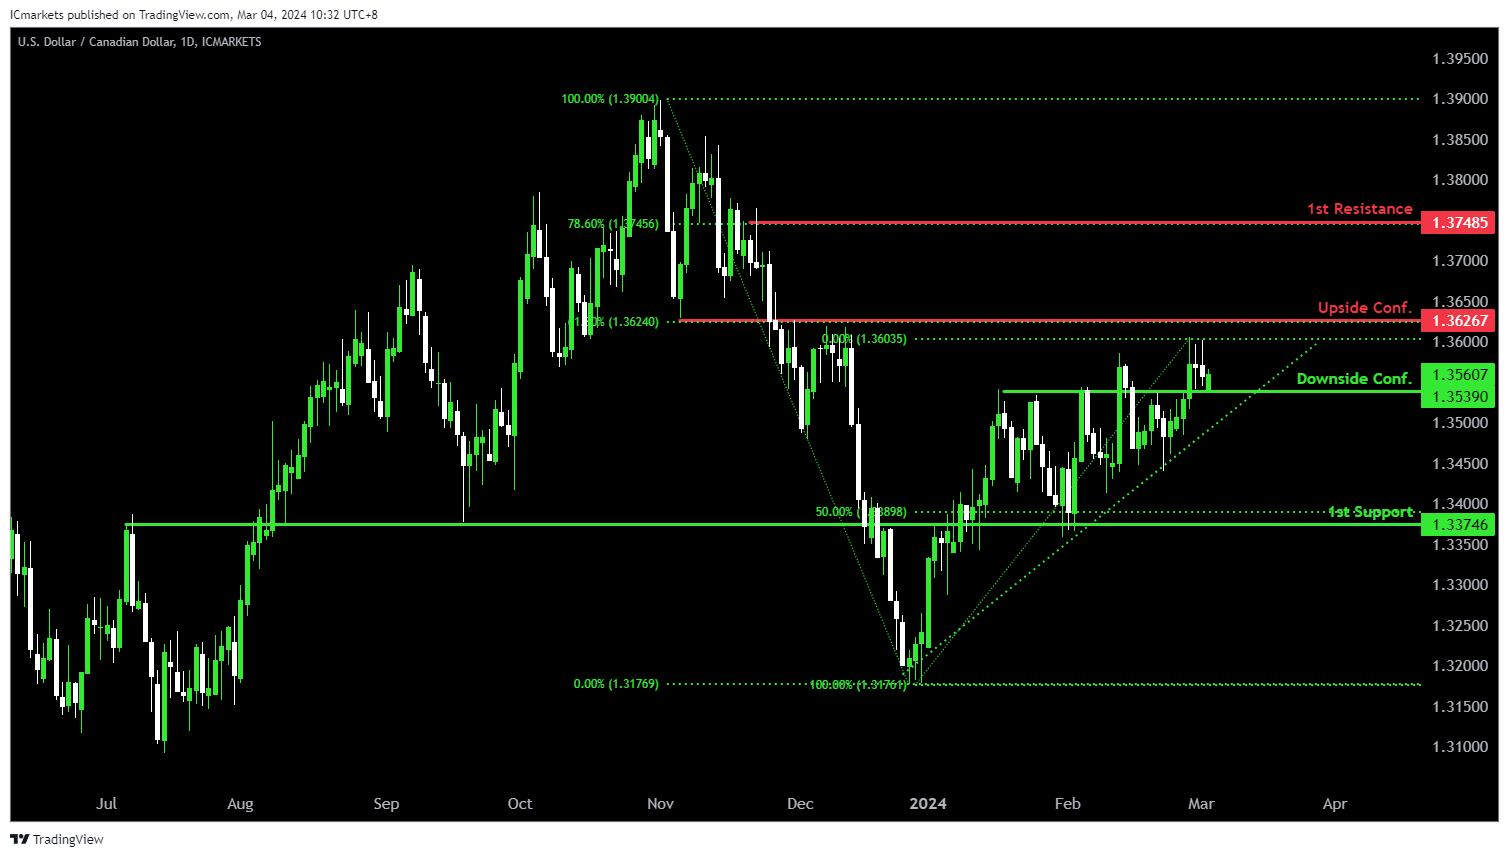
USD/CAD:
The USD/CAD chart currently exhibits an overall bullish momentum. In this context, there is a potential scenario for price to break above the Upside Confirmation and rise towards the 1st resistance.
The Upside Confirmation level at 1.3626 is identified as an overlap resistance that aligns with the 61.80% Fibonacci Retracement level. Higher up, the 1st resistance level at 1.3748 is marked as a pullback resistance that aligns with the 78.60% Fibonacci Retracement level, further highlighting its importance as a potential resistance zone.
To the downside, the Downside Confirmation level at 1.3539 is identified as an overlap support. Further below, the 2nd support level at 1.3374 is also marked as an overlap support that aligns close to the 50.00% Fibonacci retracement level, reinforcing its significance as a key support level.
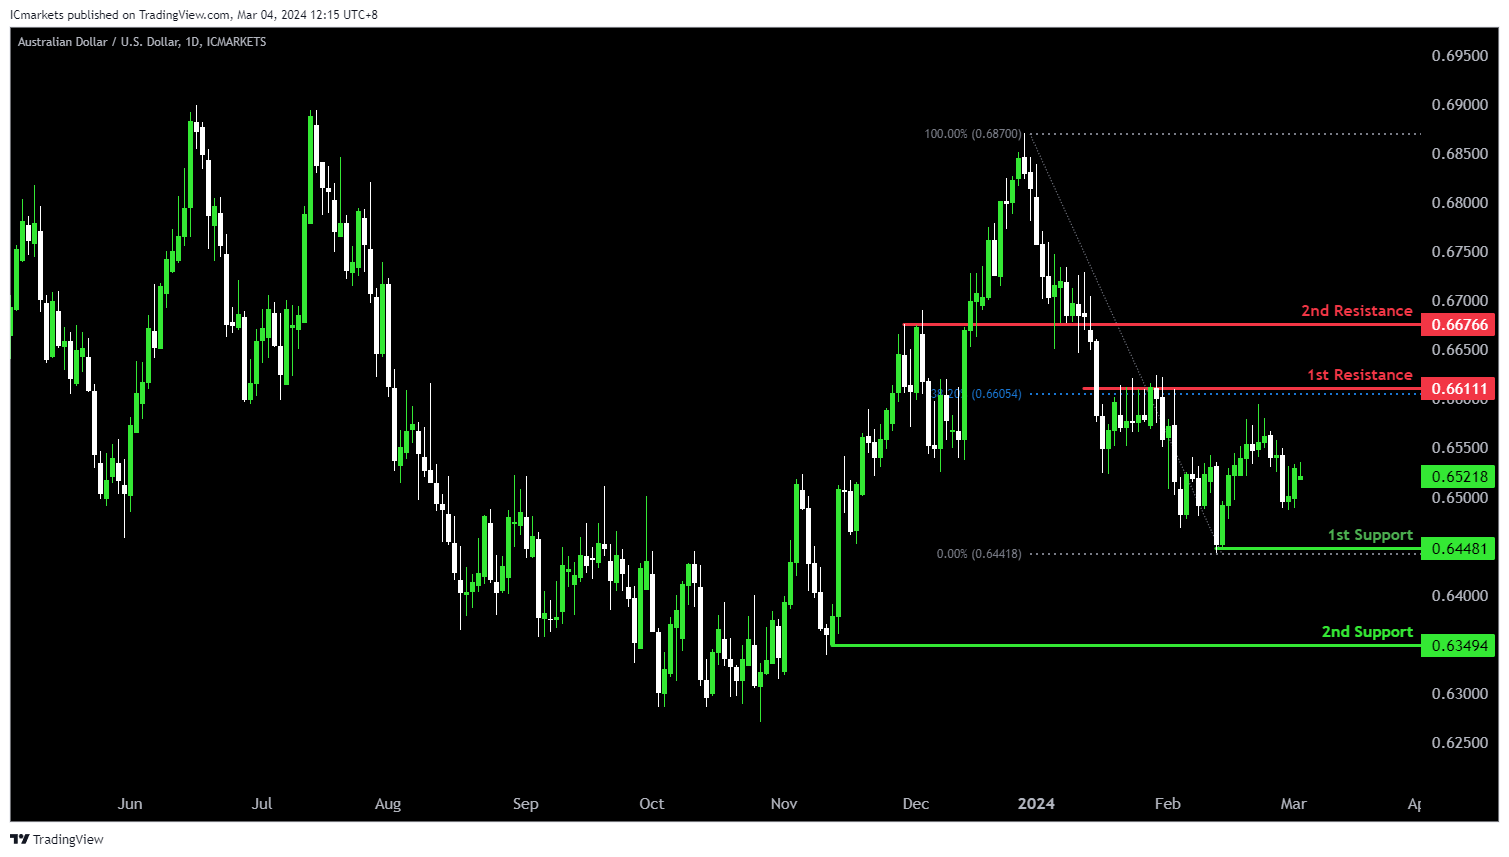
AUD/USD:
The AUD/USD chart currently exhibits an overall bearish momentum. In this context, there is a potential scenario for price to fall towards the 1st support.
The 1st support level at 0.6448 is identified as a pullback support. Further below, the 2nd support level at 0.6349 is also marked as a pullback support, further emphasizing its importance as a potential support zone.
To the upside, the 1st resistance level at 0.6611 is identified as a pullback resistance that aligns with the 38.20% Fibonacci Retracement level. Higher up, the 2nd resistance level at 0.6676 is noted as an overlap resistance, further highlighting its importance as a potential resistance zone.
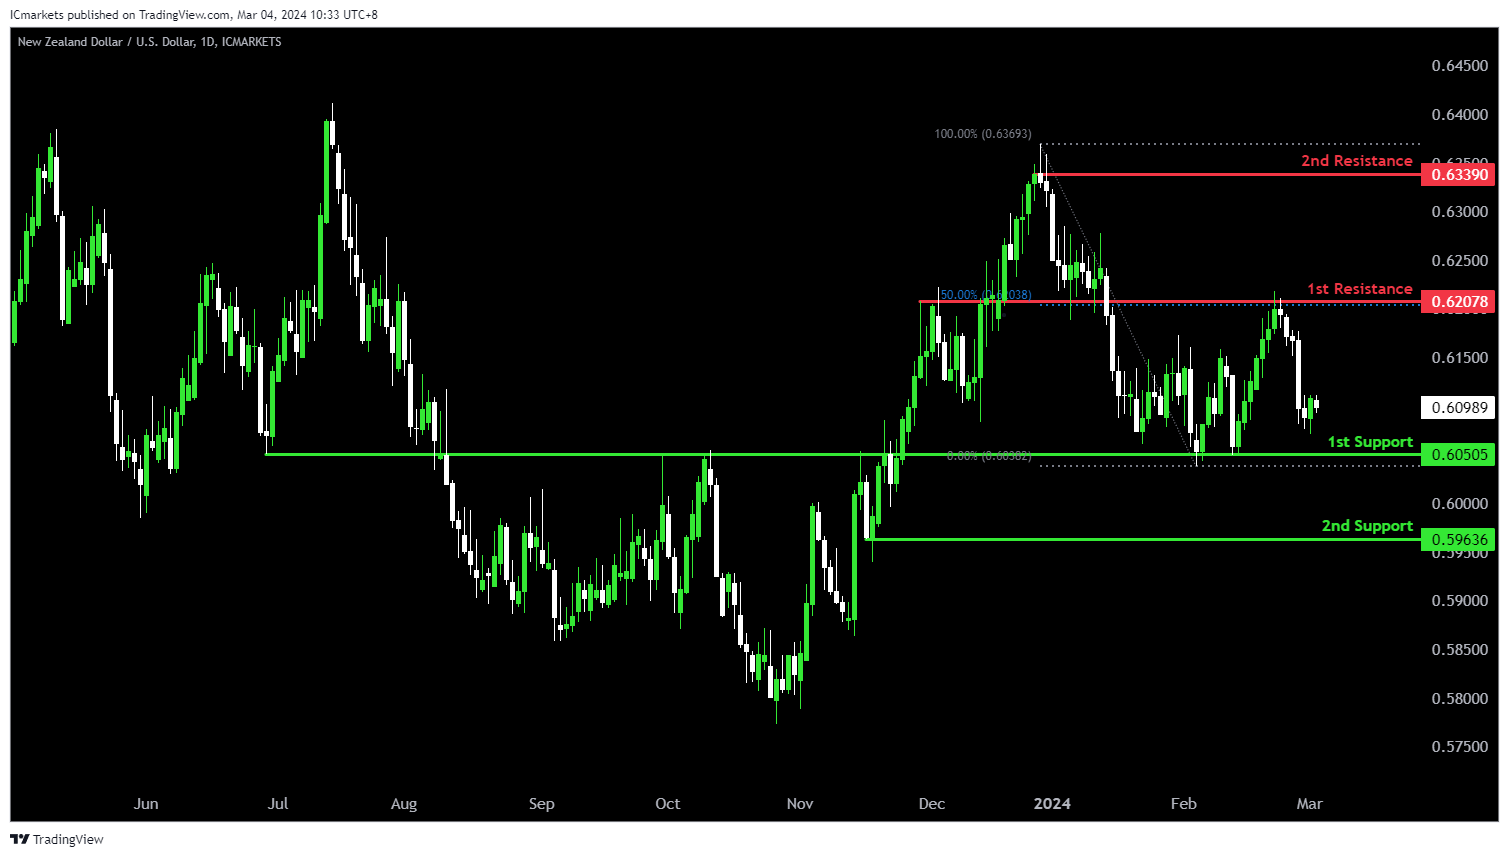
NZD/USD
The NZD/USD chart currently exhibits an overall bearish momentum. In this context, there is a potential scenario for price to fall towards the 1st support.
The 1st support level at 0.6050 is identified as an overlap support. Further below, the 2nd support level at 0.5963 is marked as a pullback support, further emphasizing its importance as a potential support zone.
To the upside, the 1st resistance level at 0.6207 is identified as an overlap resistance that aligns with the 50.00% Fibonacci Retracement level. Higher up, the 2nd resistance level at 0.6339 is noted as a swing-high resistance, further highlighting its importance as a potential resistance zone.
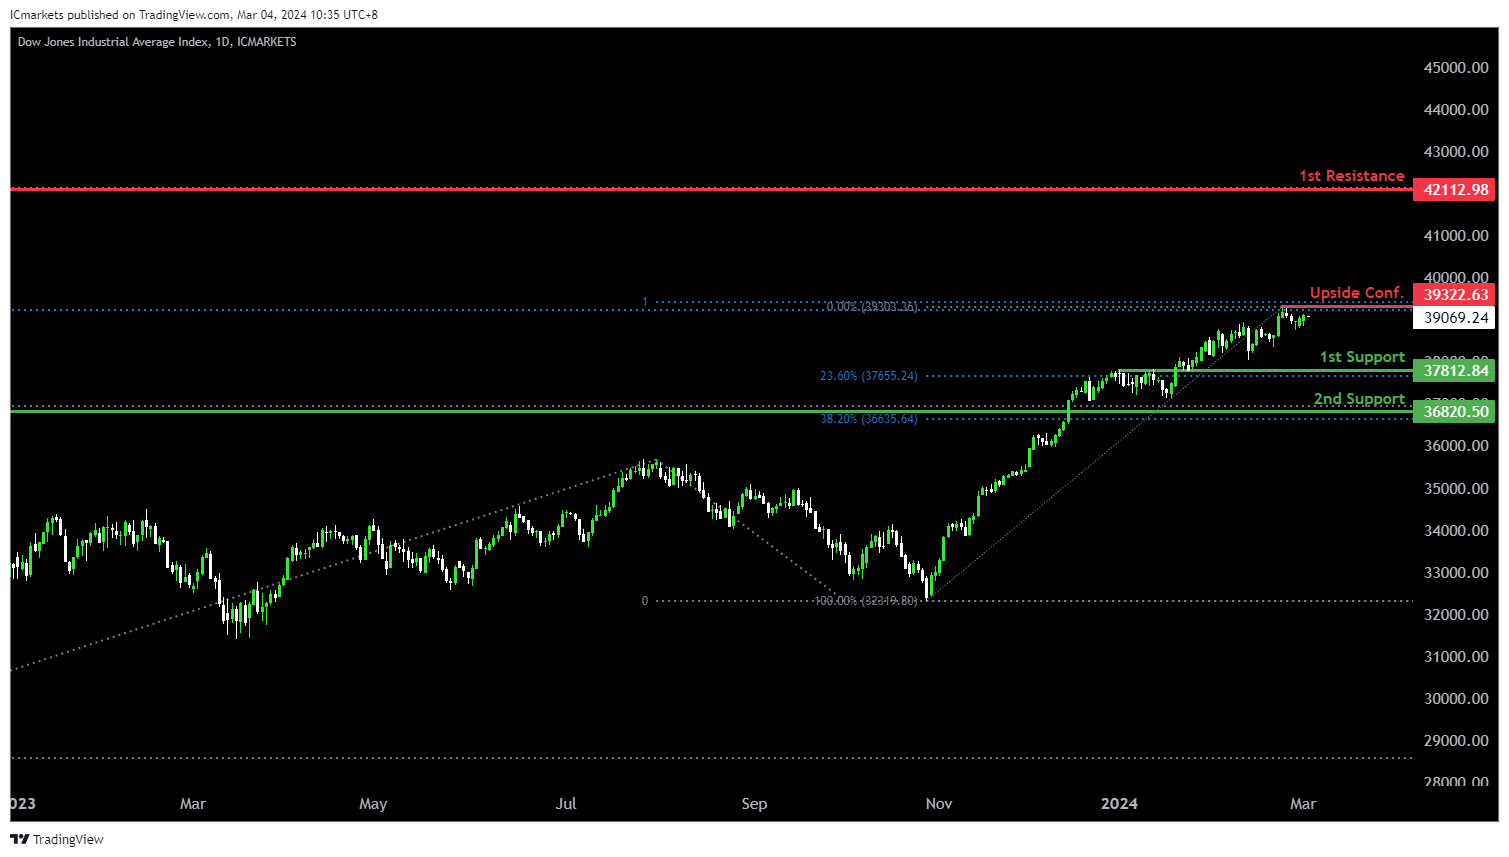
DJ30:
The DJ30 chart currently exhibits an overall bullish momentum. In this context, there is a potential scenario for price to make a bullish continuation towards the 1st resistance should it break above the Upside Confirmation.
The Upside Confirmation level at 39,322.63 is identified as a pullback resistance that aligns with a confluence of Fibonacci levels i.e. the 100.00% Projection and the 127.20% Extension. Higher up, the 2nd resistance level at 42,112.98 is noted as a resistance that aligns with the 161.80% Fibonacci Extension level, adding to its significance as a potential barrier to further bullish movement.
On the support side, the 1st support level at 37,812.84 is identified as an overlap support that aligns with the 23.60% Fibonacci Retracement level. Further below, the 2nd support at 36,820.50 is marked as a pullback support that aligns close to the 38.20% Fibonacci Retracement level, further reinforcing its significance as a potential level of support.
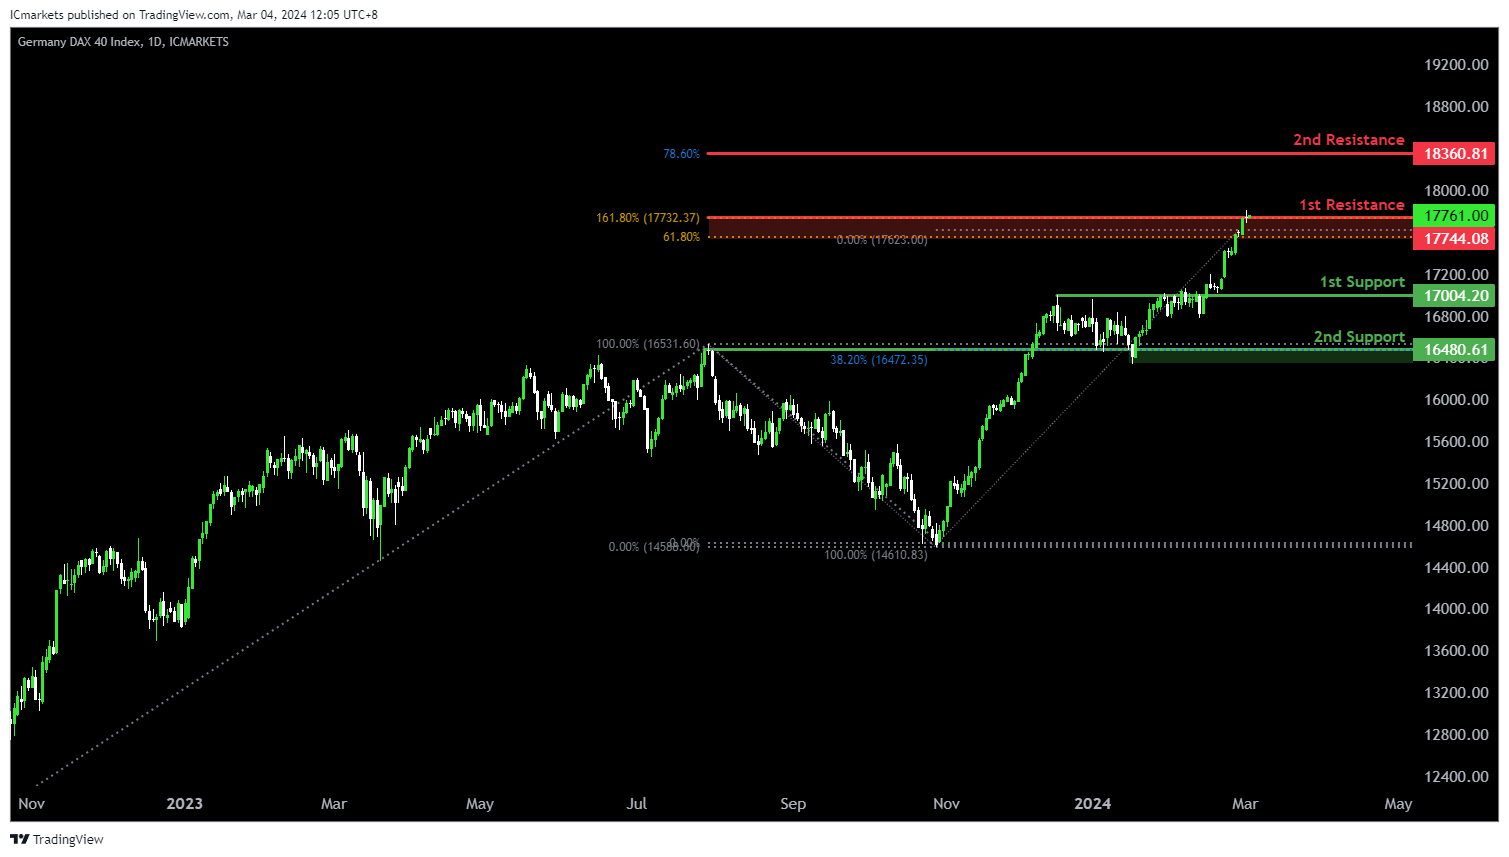
GER40:
The GER40 chart currently demonstrates an overall bullish momentum, suggesting a potential bullish breakout through the 1st resistance and rise towards the 2nd resistance.
The 1st resistance level at 17,7744.08 is identified as a resistance that aligns with a confluence of Fibonacci levels i.e. the 61.80% Projection and the 161.80% Extension. Higher up, the 2nd resistance level at 18,360.81 is marked as a resistance that aligns with the 78.60% Fibonacci Projection level, adding to its significance as a potential barrier to further bullish movement.
On the support side, the 1st support level at 17,004.20 is identified as an overlap support. Additionally, the 2nd support level at 16,480.61 is also noted as an overlap support that aligns with the 38.20% Fibonacci Retracement level, further reinforcing its importance as a potential area of support.
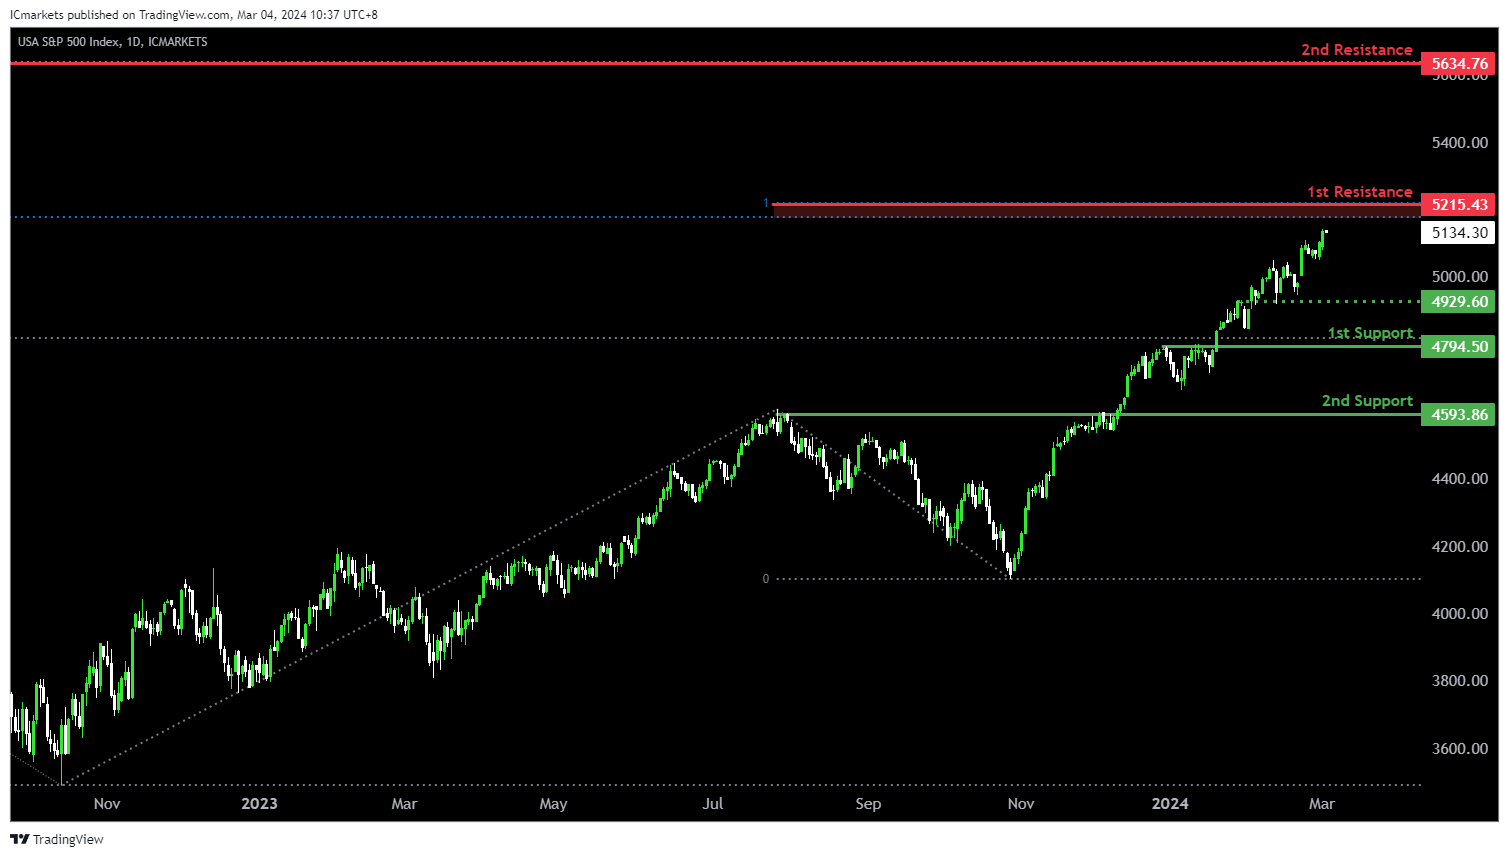
US500:
The US500 chart currently demonstrates an overall bullish momentum. In this context, there is a potential scenario for price to rise towards the 1st resistance.
The 1st resistance level at 5,215.43 is identified as a resistance that aligns with a confluence of Fibonacci levels i.e. the 127.20% Extension and the 100.00% Projection. Higher up, the 2nd resistance level at 5,634.76 is noted as a resistance that aligns with the 161.80% Fibonacci Extension level, adding to its significance as a potential barrier to further bullish movement.
On the support side, the 1st support level at 4,794.50 is identified as a pullback support. Further below, the 2nd support level at 4,593.86 is also marked as a pullback support, further reinforcing its significance as a potential area of support.
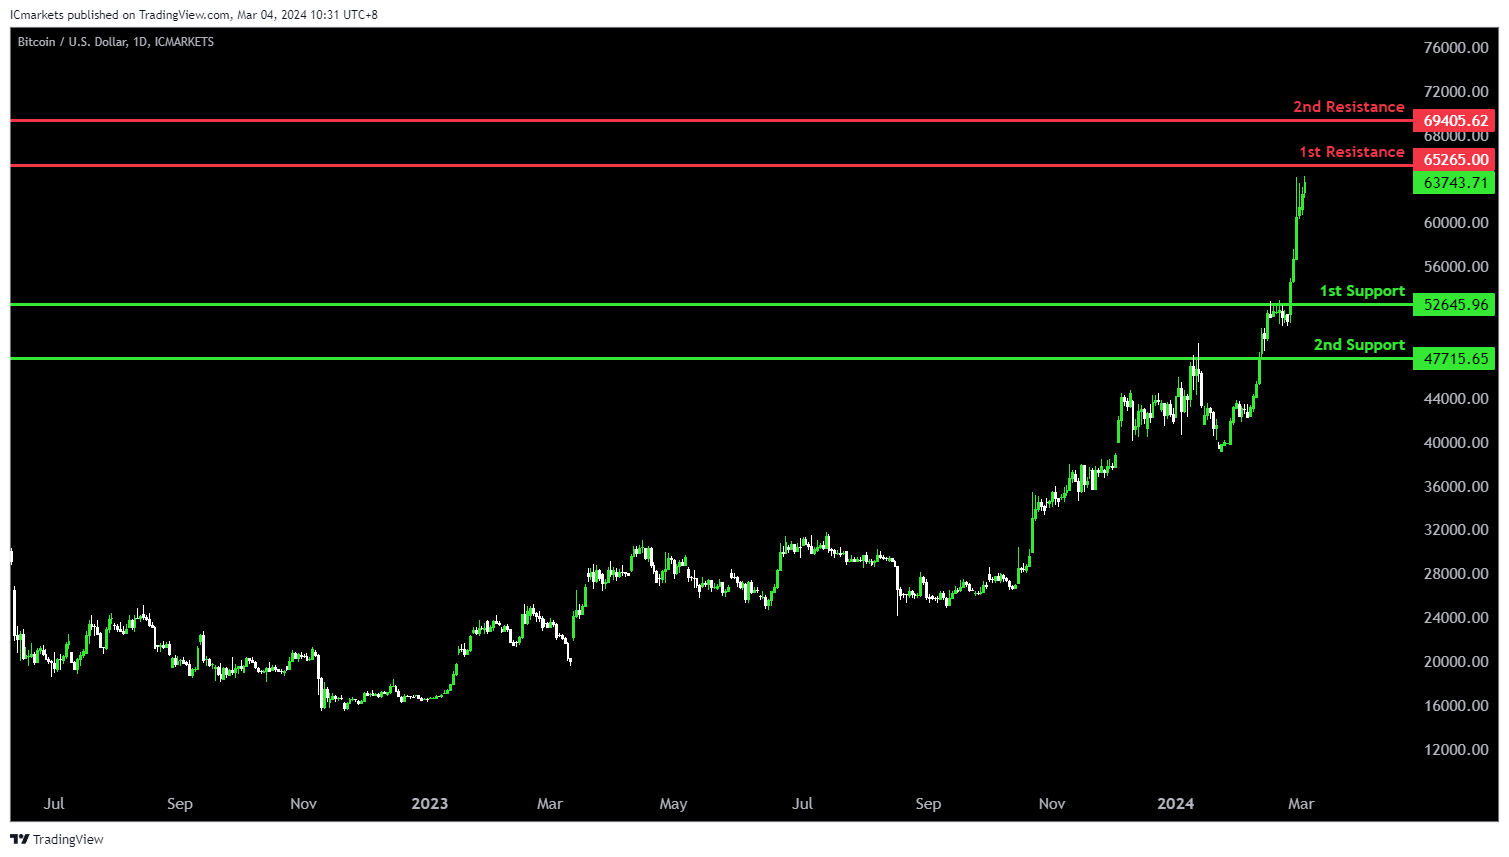
BTC/USD:
The BTC/USD chart currently demonstrates an overall bullish momentum, suggesting a potential continuation of the upward trend towards the 1st resistance.
The 1st resistance level at 65,265.00 is identified as a swing-high resistance. Higher up, the 2nd resistance level at 69,405.62 is also noted as a swing-high resistance at the all-time high, adding to its significance as a potential barrier to further bullish movement.
On the support side, the 1st support level at 52,645.96 is identified as an overlap support. Further below, the 2nd support level at 47,715.65 is also marked as an overlap support, further reinforcing its significance as a potential area of support.
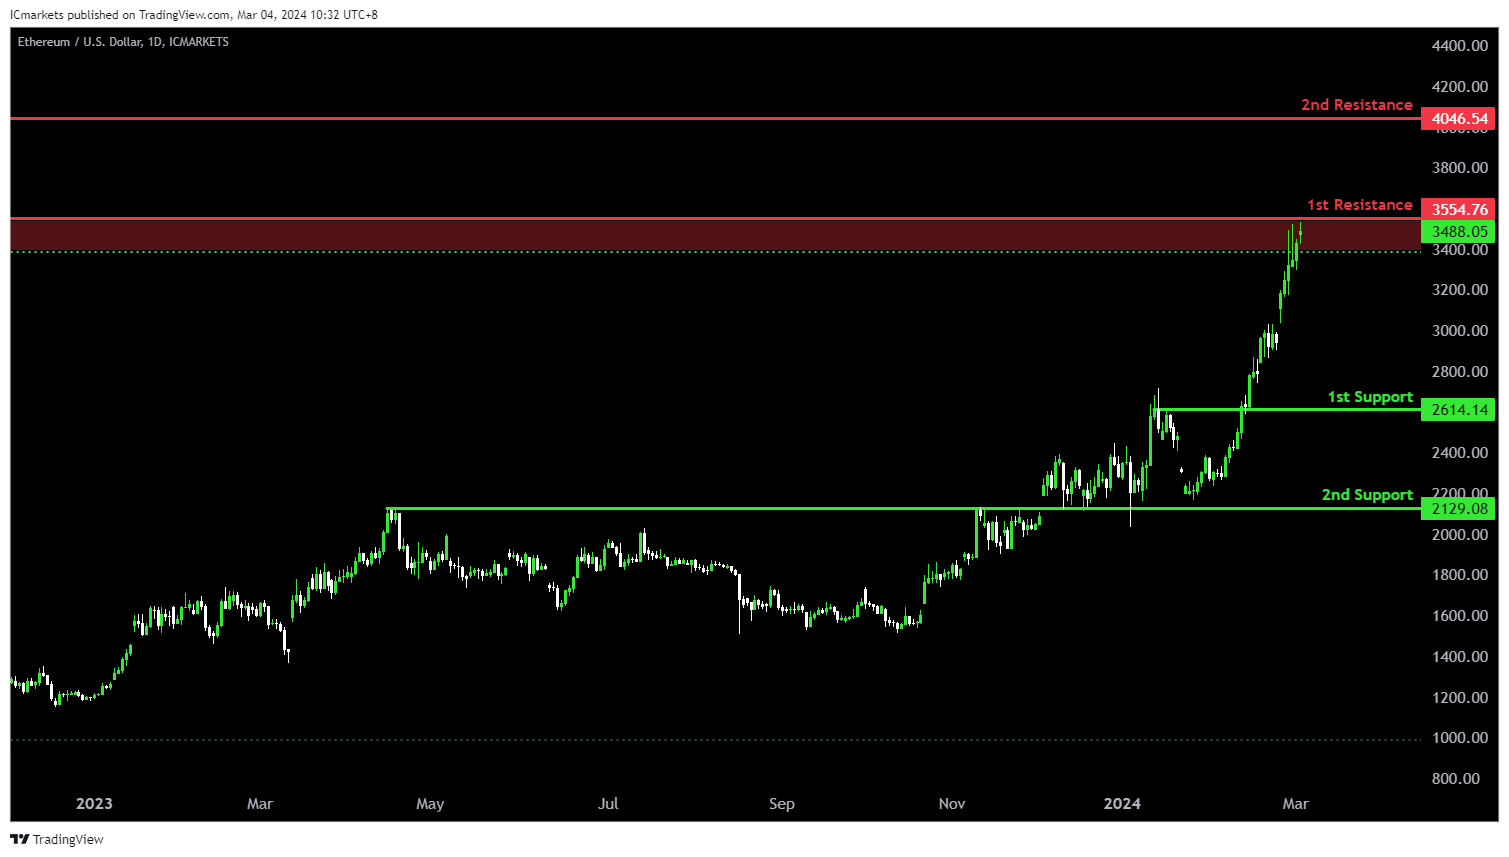
ETH/USD:
The ETH/USD chart currently demonstrates an overall bullish momentum, suggesting a potential continuation of the upward trend towards the 1st resistance.
The 1st resistance level at 3,554.76 is identified as a pullback resistance that aligns with the 61.80% Fibonacci Retracement level. Higher up, the 2nd resistance level at 4,046.54 is also noted as a pullback resistance that aligns with the 78.60% Fibonacci Retracement level, adding to its significance as a potential barrier to further bullish movement.
On the support side, the 1st support level at 2,614.14 is identified as a pullback support. Further below, the 2nd support level at 2,129.08 is marked as an overlap support, further reinforcing its significance as a potential area of support.
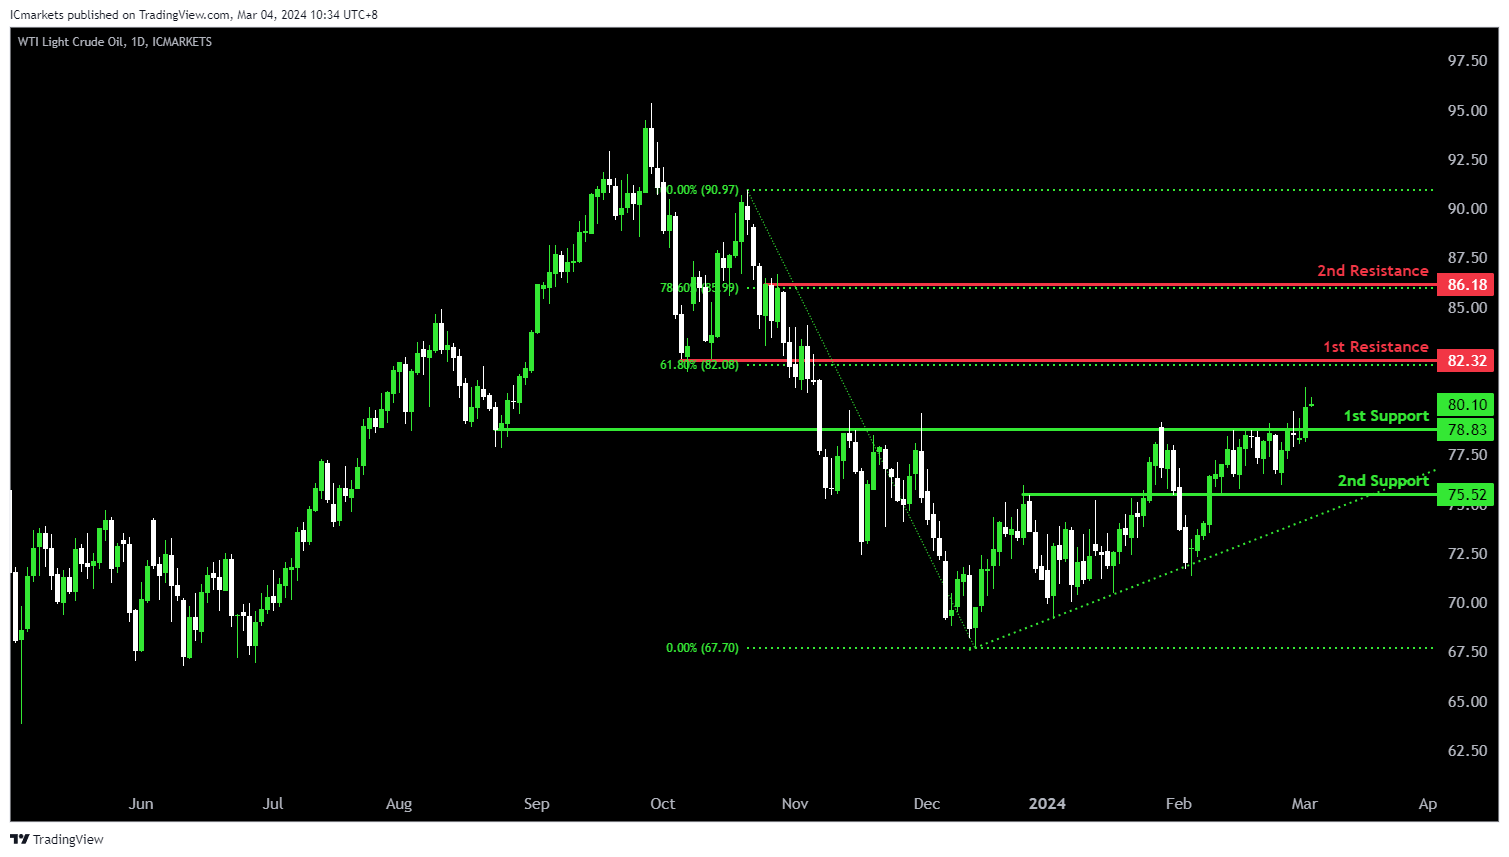
WTI/USD:
The WTI (West Texas Intermediate) chart currently exhibits an overall bullish momentum. In this context, there is a potential scenario for price to rise towards the 1st resistance.
The 1st resistance level at 82.32 is identified as a pullback resistance that aligns with the 61.80% Fibonacci Retracement level. Higher up, the 2nd resistance level at 86.18 is also marked as a pullback resistance that aligns with the 78.60% Fibonacci Retracement level, further highlighting its importance as a potential resistance zone.
To the downside, the 1st support level at 78.83 is identified as an overlap support. Further below, the 2nd support level at 75.52 is also marked as an overlap support, reinforcing its significance as a key support level.
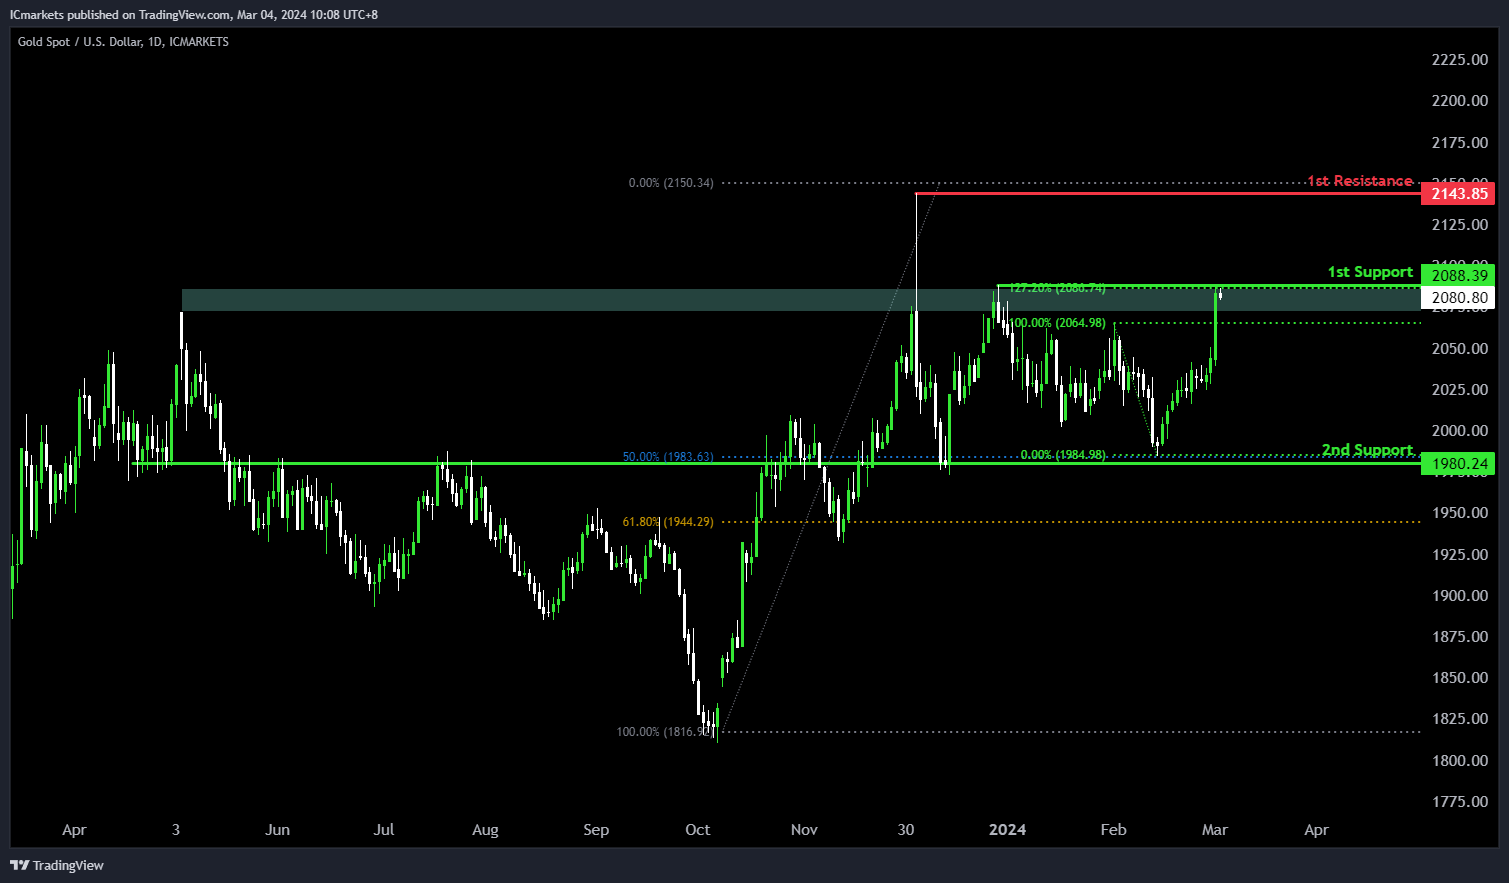
XAU/USD (GOLD):
The XAUUSD chart is currently experiencing bearish momentum, indicating a potential continuation towards the 1st support level.
The 1st support at 2088.39 is recognized as a swing low support, coinciding with the 127.20% Fibonacci Extension level. Historically, this level has provided significant support, potentially indicating a point where buying interest could emerge.
Furthermore, the 2nd support at 1980.24 is characterized as an overlap support, aligning with the 50% Fibonacci Retracement level. This reinforces its significance as a level where buyers have historically intervened to prevent further decline.
On the resistance side, the 1st resistance at 2143.85 is identified as a swing high resistance, suggesting its historical importance as a barrier where selling pressure may increase, potentially limiting upward movement.
XAU/USD: Gold Rises Further After Rallying 2% on Friday
Gold keeps firm tone and trading near new two-month high at the start of the week, after rallying 2% on Friday, in the biggest daily advance since Dec 13.
The yellow metal surged after markets got a clearer picture about the US rate outlook, as the latest economic data added to growing expectations that the Fed would start cutting rates in June, making the gold more attractive for investors.
Friday’s marginal close above Fibo barrier at $2081 (61.8% of $2141/$1984) generated fresh signal, exposing targets at $2100/04 (psychological / Fibo 76.4%) guarding key barrier at $2141 (record high of Dec 4).
Bulls so far do not show signs of fatigue despite overbought daily studies, though some price adjustment should be anticipated in coming sessions.
Limited dips should be ideally contained at $2060 zone (former tops of Jan12 / Feb1) to keep bulls intact.
Res: 2100; 2104; 2115; 2141.
Sup: 2080; 2062; 2050; 2044.
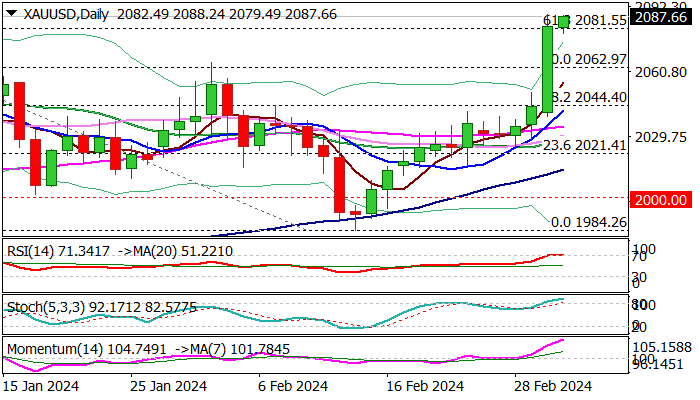
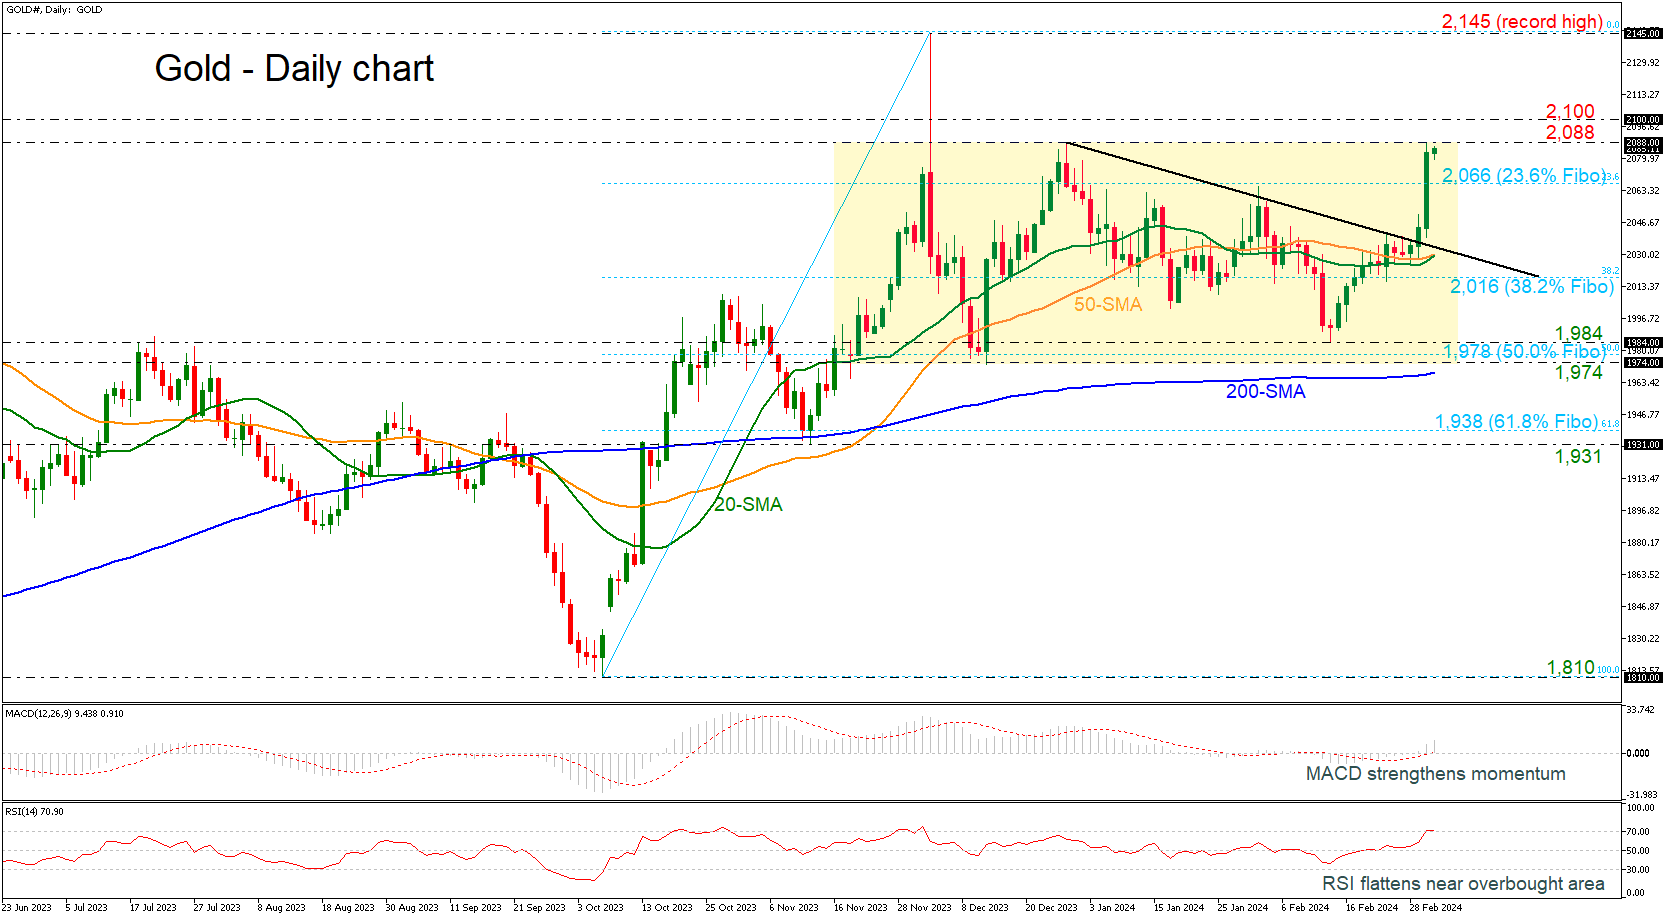
Gold Rally Pauses at 2,088 After Strong Bullish Move
- Gold prices break descending trend line
- Medium-term trend remains neutral
- RSI indicates overbought market
Gold prices posted an impressive bullish rally in the preceding week, touching the upper boundary of the medium-term trading range at 2,088 and penetrating the downtrend line to the upside.
The technical oscillators are confirming this view. The MACD is strengthening its momentum above its trigger and zero lines, while the RSI is holding near the overbought area, indicating that after the upside move, a bearish correction may be on cards.
In case the pair extends its short-term direction to the upside, the bulls will probably challenge the 2,100 resistance level. Further up, the area around the previous all-time high of 2,145 could be another potential obstacle for upward movements towards the next psychological numbers such as 2,200 and 2,300.
Alternatively, any declines may drive the price towards the immediate support of the 23.6% Fibonacci retracement level of the up leg from 1,810 to 2,145 at 2,066 before the 20- and the 50-day simple moving averages (SMAs) comes into view. Beneath the latter, the 38.2% Fibonacci of 2,016 could be another level in focus ahead of the 1,974-1,984 region, which encapsulates the lower boundary of the channel.
Summarizing, the precious metal maintains a neutral bias in the medium-term picture, despite the latest strong upside move.
Gold Technical: On the Cusp of a Potential Major Bullish Breakout
- Gold (XAU/USD) recorded its highest weekly gain of 2.33% year-to-date on 1 March 2024, and its best weekly return seen in the past three months.
- Positive technical elements and a softer real US 10-year Treasury yield below 2.15% support a potential major bullish breakout scenario for Gold (XAU/USD).
- Gold (XAU/USD) potential bullish breakout trigger level stands at US$2,090.
In the last two weeks, the price actions of Gold (XAU/USD) have started to jolt to the upside after a lull period of sideways movement since late December 2023. It has managed to record a weekly gain of 2.33% for the week ended 1 March 2024, its best weekly gain so far year-to-date and in the past three months.
Overall, it has exhibited bullish elements from a technical analysis perspective and intermarket cross-asset observations suggest the potential start of a medium-term bullish impulsive price action structure for Gold (XAU/USD).
Real US 10-year Treasury yield started to turn soft below 2.15% key resistance
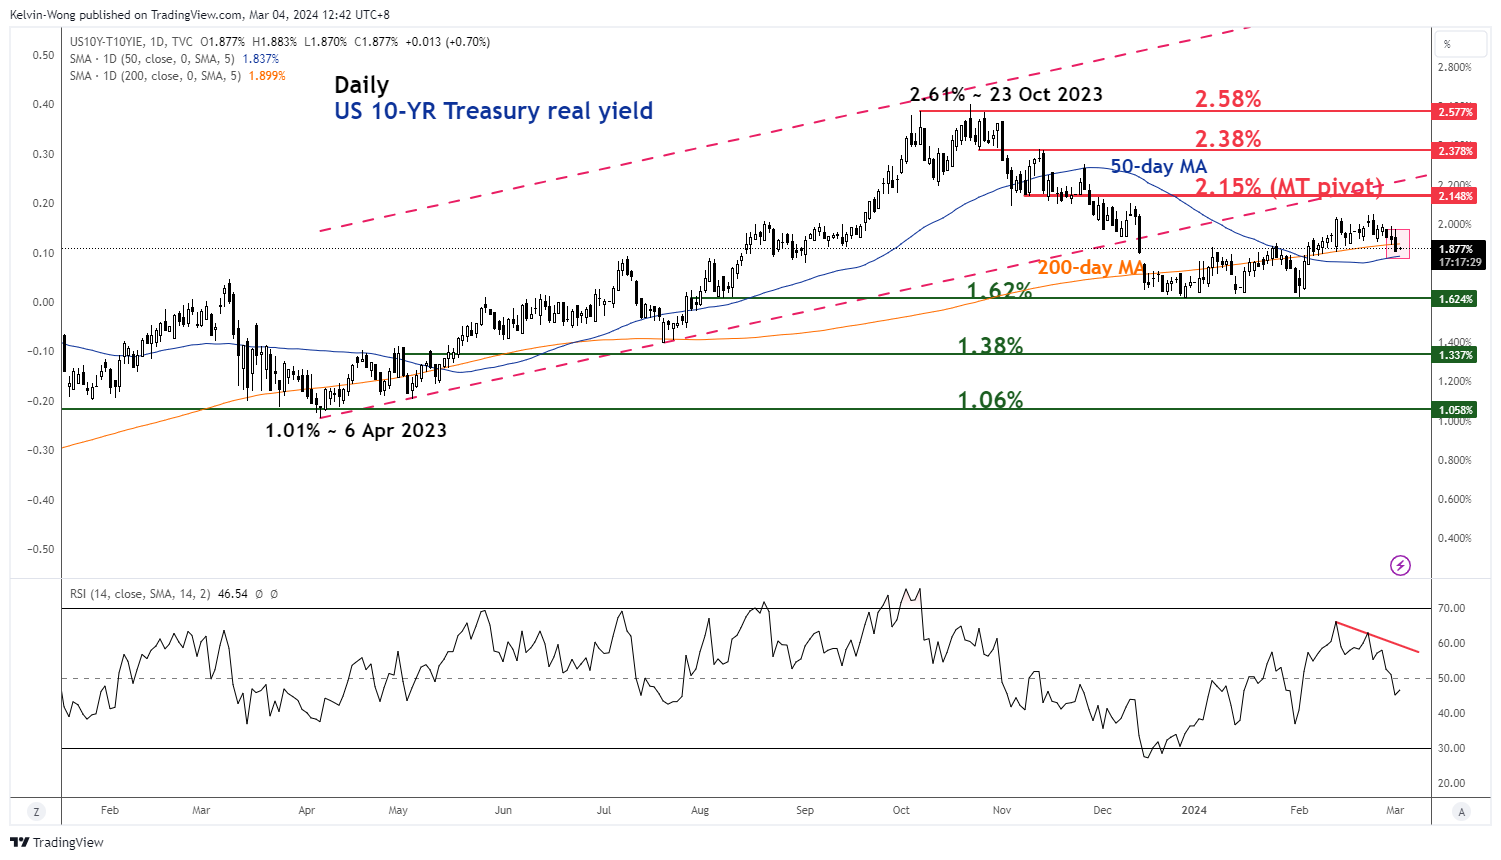
Fig 1: US 10-year Treasury real yield medium-term trend as of 4 Mar 2024 (Source: TradingView, click to enlarge chart)
In the past two weeks, the real US 10-year Treasury yield has started to inch lower (-19 basis points) from its 2.05% high printed on 23 February that wiped out the prior entire gains recorded earlier at the start of February to 13 February reinforced by the hotter than expected US CPI print for January.
Observations from key technical elements such as the reintegration back below its 200-day moving average last Friday, 1 March, and “prior lower highs” seen in the daily RSI momentum indicator before it pushed back down below the 50 level suggest that the short-term up move from 1 February is likely to have exhausted and the odds now are in favour of a medium-term down move as long as 2.15% key medium-term pivotal resistance is not surpassed to the upside.
Given that Gold (XAU/USD) has a significant indirect correlation with the real US 10-year Treasury yield as Gold does not yield any positive fixed income coupon, a further decline in the longer-term US Treasury yield is likely to support higher prices for Gold (XAU/USD).
Watch the key bullish breakout trigger level of US$ 2,090
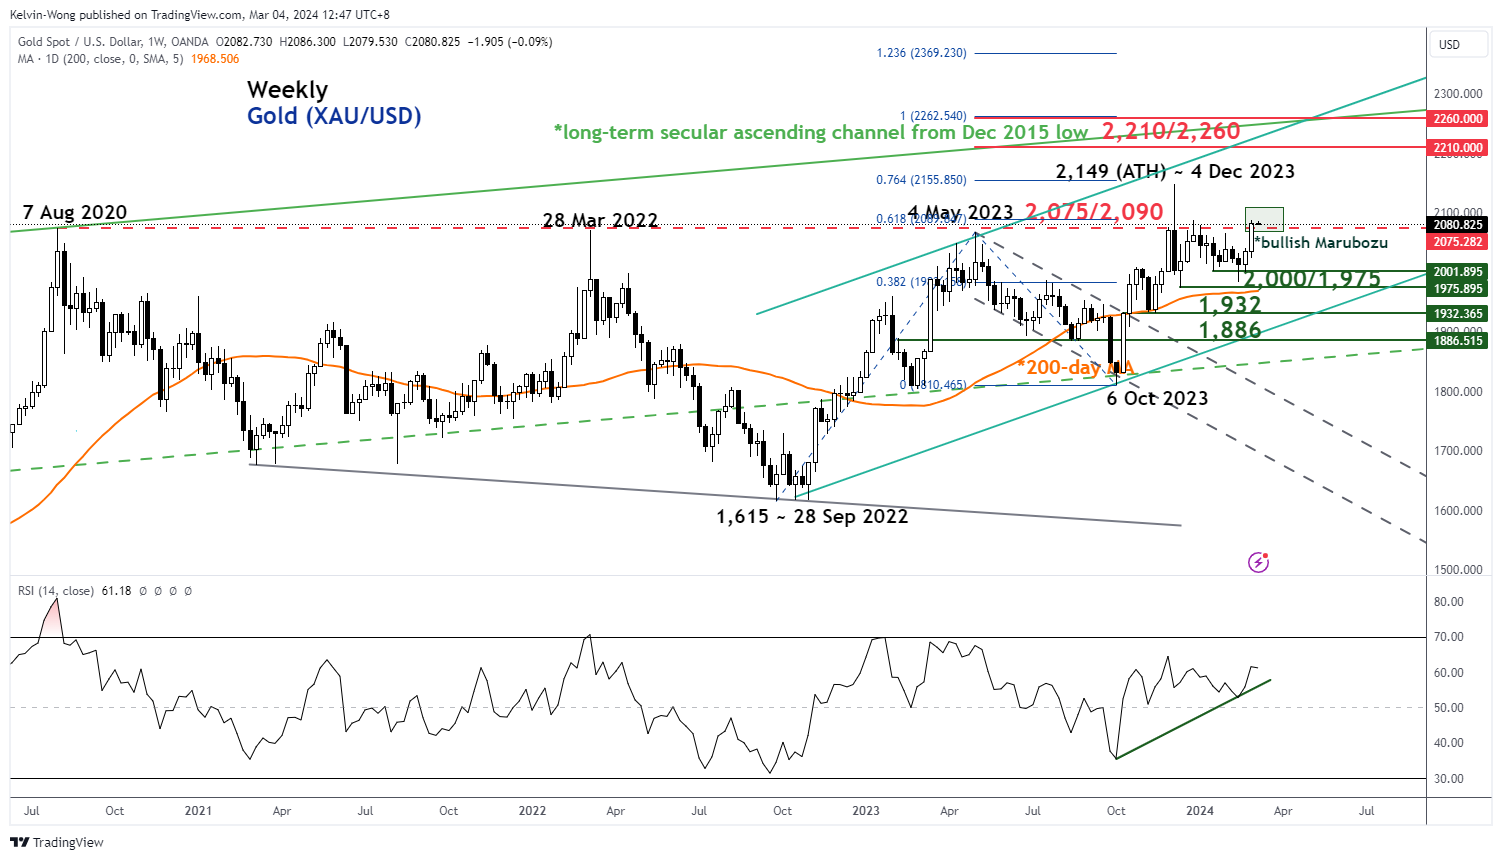
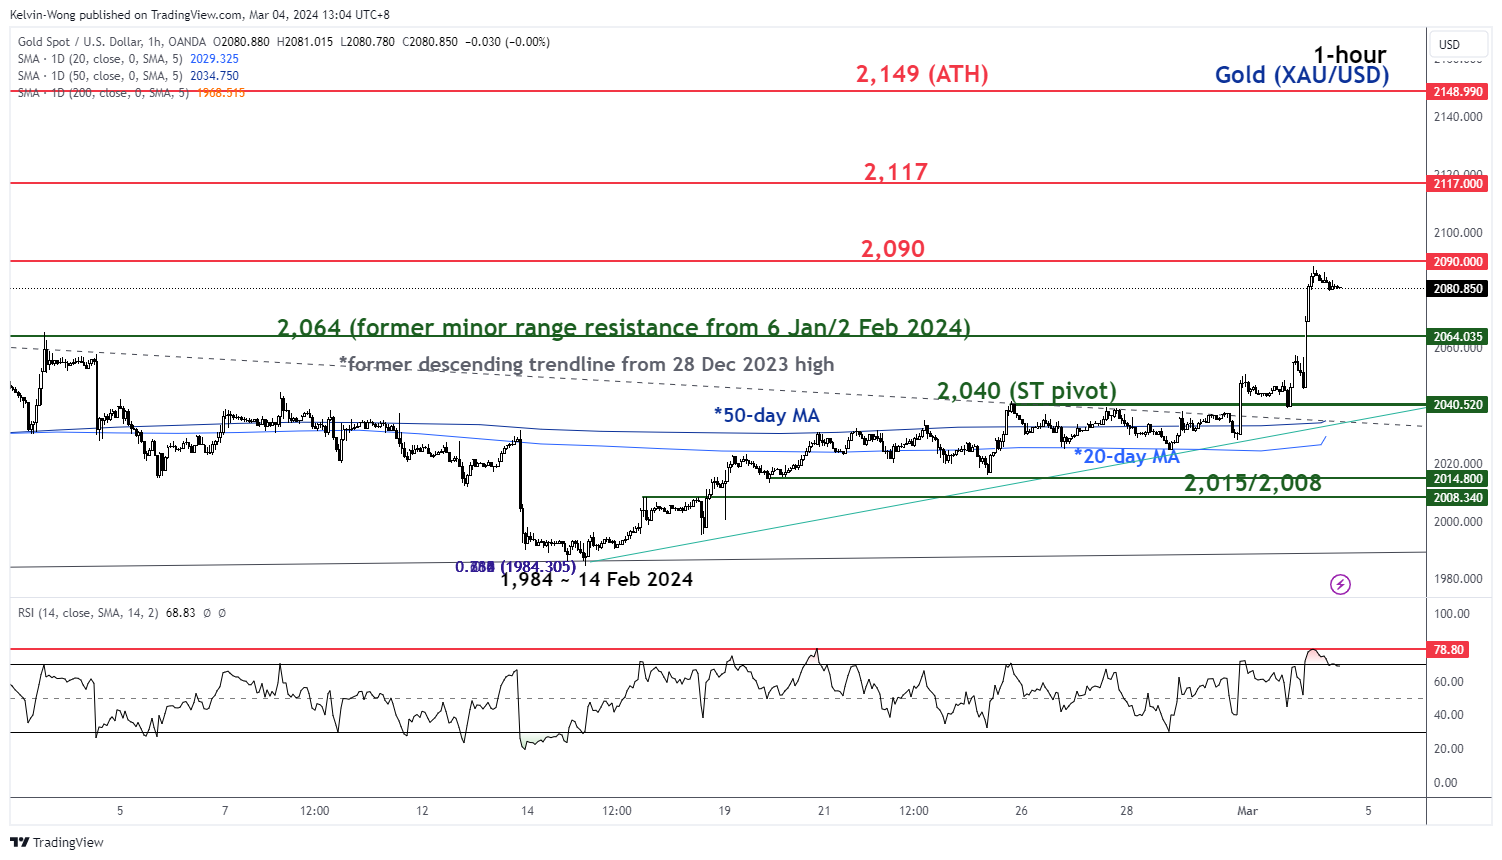
Fig 3: Gold (XAU/USD) short-term trend as of 4 Mar 2024 (Source: TradingView, click to enlarge chart)
Gold (XAU/USD) has now staged a fifth attempt on the major range resistance zone of US$2,075/2,090 of a complex sideways range configuration in place since 7 August 2020.
Interestingly, last week’s fifth attempt has managed to form a bullish candlestick pattern, a weekly bullish Marubozu right below US$2,090, and the prior four attempts did not yield such bullish candlestick-based price actions.
In addition, the weekly RSI momentum indicator has formed a “higher low” above the 50 level and has not reached the overbought region (above 70). These observations suggest that medium-term upside momentum is likely to have resurfaced. The next medium-term resistance zone to watch after US$2,090 will be at US$2,210/US$2,260 (Fibonacci extension cluster & upper boundary of a long-term secular ascending channel from December 2015 low, see Fig 2).
In the short-term, last Friday, 1 March steep upmove led the hourly RSI momentum indicator to hit an extreme overbought level of 78.80 which increases the risk of an imminent minor pull-back towards the US$2,064 near-term support (see Fig 3).
If the US$2,040 key short-term pivotal support holds in any potential pullbacks, the price actions of Gold (XAU/USD) are likely to evolve within short to medium-term bullish configurations. The next intermediate resistances to watch after US$2,090 (bullish range breakout level) are likely to be at US$2,117 and US$2,149 (current all-time high printed on 4 December 2023) in the short term.
On the flipside, failure to hold at US$2,040 invalidates the bullish tone to see an extension of the corrective pull-back to expose the next intermediate support at US$2,015/US$2,008 (congestion zone of 16/23 February 2024 & 76.4% Fibonacci retracement of the ongoing minor uptrend from 14 February 2024 low to 1 March 2024 high).
Some Key Topics Scheduled Later This Week
Markets
EMU and US data on Friday provided conflicting evidence for global interest rate markets. As hinted by the national data on Thursday, the Flash February EMU CPI doesn’t allow the ECB to feel comfortable that price growth is on track to sustainably return to the 2.0% target anytime soon. Due to favourable base effects, headline Y/Y inflation eased from 2.8 % to 2.6 %, but prices still rose 0.6% M/M, the fastest pace since April last year. Core inflation also slowed less than hoped for (3.1% from 3.3% vs 2.9% expected). The slowdown in services inflation still goes at a snail’s pace (3.9% Y/Y from 4.0%). Stubbornly high inflation kept European/German yields in a tight range near the YTD peak levels, but it was not enough to force a break higher. US yields earlier last week already looked like running into resistance even as PCE defators published on Thursday (0.3% M/M headline, 0.4% M/M core) confirmed that there was no reason at all for the Fed to rush to rate cuts in the near future. Still, a poor US Manufacturing ISM was enough for yields to leave the YTD peak levels. The headline index unexpectedly eased from 49.1 to 47.8 (49.5 expected). Most details were weak (production 48.4 from 50.4; employment 45.9 from 47.1, new orders 49.2 from 50.4), with exports orders (51.6 from 45.2) an exception to the rule. Prices continue to rise (52.5). There is no causal link between a softer ISM and Fed being able to cut rates soon(er), but US yields eased between 8.8 bps (5-y) and 5.1 bps (30-y). The US 10-y real yield also drifted further south off the 2.0% mark (1.86%). Moves in EMU yields remained limited post the CPI data. German yields varied between 1.1 bp (2-y) and +1.1 bp (30-y). The decline in real yields was enough to propel the S&P 500 (+0.8%) and the Nasdaq (+1.14%) to new record levels. The dollar traded on the backfoot. EUR/USD rebounded from to 1.08 area to close at 1.0837.
This morning, Asian equities mostly show modest gains with China underperforming as markets are looking out for the National People’s Congress. The Nikkei tops the symbolic barrier of 40 000. Later today, the calendar is almost empty, but some key topics are scheduled later this week. On Wednesday, Fed Chair Powel will testify before Congress. On Thursday, the ECB holds a regular policy meeting and will publish new Staff Economic Projections. Given recent inflation data, there is little reason for Powell and/or Lagarde to leave their cautious wait-and-see stance. Regarding the data, we keep a close eye at the US services ISM (Tuesday) and the payrolls (Friday). Softer data might extend Friday’s correction in yields. Still, we assume any setback to stay limited as long as Fed doesn’t become more specific in its guidance on a first rate cut. The dollar is trading with a tentatively soft bias but for now easily holds above first key support levels (DXY 103 area, EUR/USD 1.09 area).
News & Views
Rating bureau S&P raised Portugal’s creditworthiness to A- from BBB+ with a positive outlook potentially paving the way for further upgrades within the next 24 months. The agency lauded the country’s steep deleveraging and ongoing strong budgetary performances, which is fueling a “significant and continued improvement in the external financial position and alleviating external liquidity risks.” Last year’s surplus, estimated at 1% of GDP, will ease but remain positive at 0.2% this year. S&P expects economic growth to decelerate to 1.4% this year and to pick up slightly but remain below 2% beyond 2024, underpinned by a robust labour market and rising real incomes, easing monetary conditions and an obstacle-free disbursement of the remaining €13.7bn EUNextGen resources. Inflation should return to the 2% target by 2026. The credit watcher sees no major risks coming from the upcoming elections in March 2024 to the fiscal discipline currently in place.
OPEC over the weekend confirmed a widely expected extension of current output curbs through June. With current demand lackluster and the future uncertain amid (delayed) central bank easing and China’s economic struggle, the oil production group stuck to a 2.2 million-barrel-a-day reduction. That’s the amount on paper though and several OPEC members have consistently exceeded their quota’s. The OPEC statement noted that these voluntary cuts “will be returned gradually subject to market conditions” after the second quarter. Limiting supply at a time of weak demand has helped the likes of Brent to recover from the December lows around $74/b to a short-term equilibrium trading zone between $80-85.
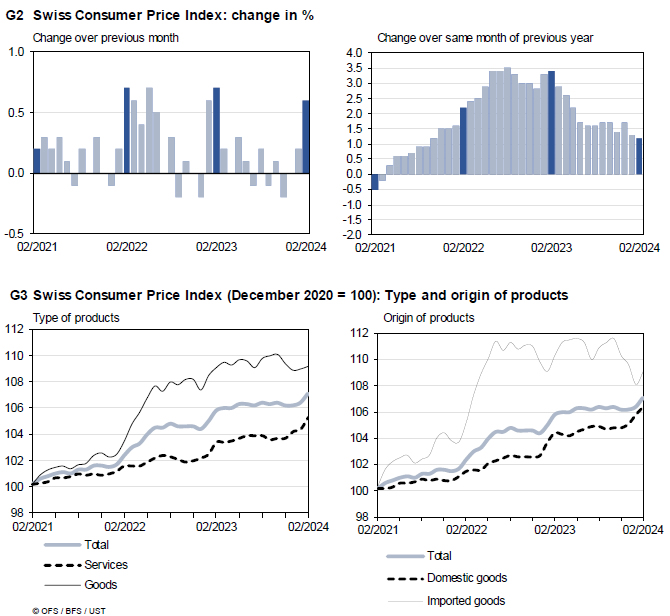
Swiss CPI rises 0.6% mom in Feb, slows to 1.2% yoy
Swiss CPI rose 0.6% mom in February, above expectation of 0.5% mom. CPI core (excluding fresh and seasonal products, energy and fuel) rose 0.7% mom. Domestic products prices rose 0.5% mom while imported products prices rose 1.0% mom.
For the year, CPI slowed from 1.3% yoy to 1.2% yoy, above expectation of 1.1% yoy. CPI core slowed from 1.2% yoy to 1.1% yoy. Domestic product prices growth slowed from 2.0% yoy to 1.9% yoy. Imported products prices growth improved from -0.9% yoy to -1.0% yoy.