
Sample Category Title
Bitcoin Resumes Rally After Mild Consolidation, Record High in Focus
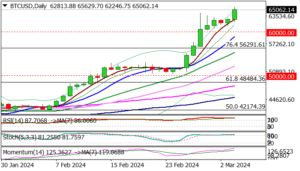
Bitcoin advanced over 4% during early trading on Monday, signaling bullish continuation after a brief consolidation in past few sessions.
Fresh rise above 65000 (the highest since November 2021) confirms very strong bids and very low supply, despite negative technical signals from overbought studies.
Bitcoin has registered record monthly gains of 45% in February, with fresh extension higher, neutralizing initial signals of correction, developed on daily chart last week.
Bulls cracked target at 64821 (April 2021) and focusing record high at 68911 (November 2021), where some headwinds could be expected, with firm break here to open way for 70000+ gains.
Broken psychological 60000 level reverted to solid support and should keep the downside protected.
Res: 66000; 68911; 70000; 71000
Sup: 61371; 60711; 60000; 58894
EUR/USD Mid-Day Outlook
Daily Pivots: (S1) 1.0808; (P) 1.0825; (R1) 1.0857; More...
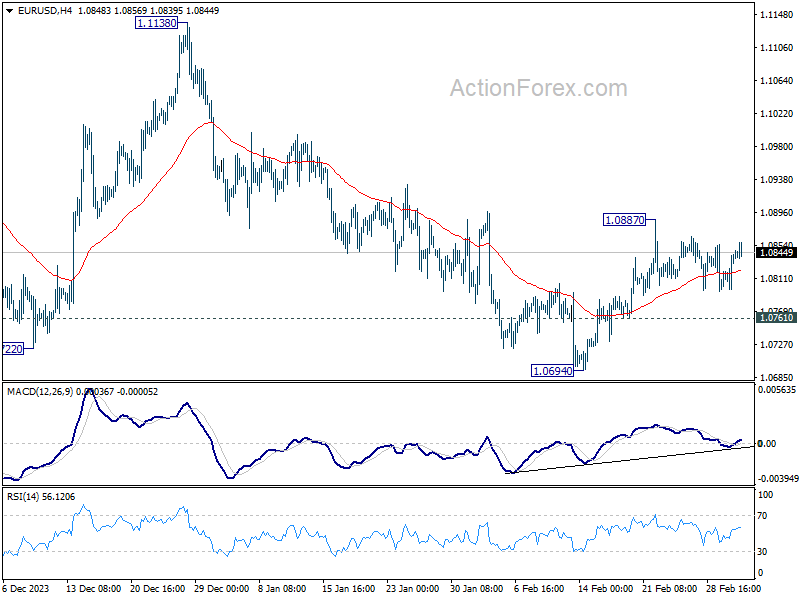
EUR/USD is staying in consolidation below 1.0887 and intraday bias stays neutral. On the upside, break of 1.0887 and sustained trading above 55 D EMA (now at 1.0831) will affirm the case that fall from 1.1138 has completed. Stronger rally would then be seen back to 1.1138. However, break of 1.0761 will turn bias back to the downside for retesting 1.0694 support.
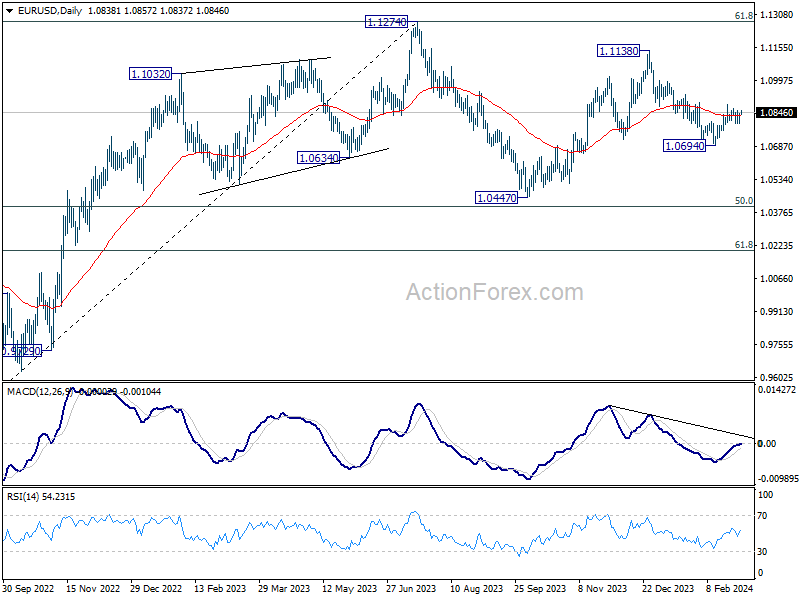
In the bigger picture, price actions from 1.1274 are viewed as a corrective pattern to rise from 0.9534 (2022 low). Rise from 1.0447 is seen as the second leg. While further rally could cannot be ruled out, upside should be limited by 1.1274 to bring the third leg of the pattern. Meanwhile, sustained break of 1.0694 support will argue that the third leg has already started for 1.0447 and possibly below.
GBP/USD Mid-Day Outlook
Daily Pivots: (S1) 1.2615; (P) 1.2640; (R1) 1.2679; More...
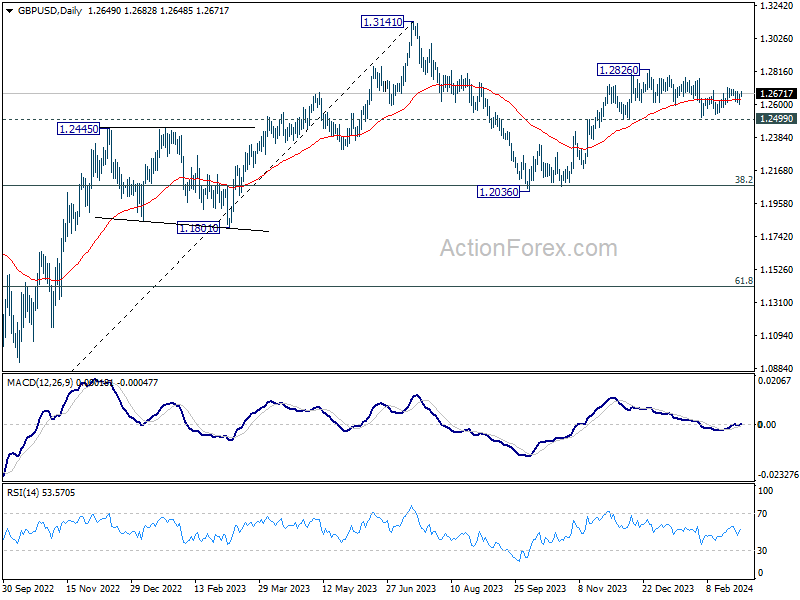
Intraday bias in GBP/USD stays neutral for the moment. On the upside, break of 1.2708 resistance will indicate that correction from 1.2826 has completed. Intraday bias will be back on the upside for retesting 1.2826. Nevertheless, decisive break of 1.2499 will argue that whole rise from 1.2036 has completed and turn near term outlook bearish.
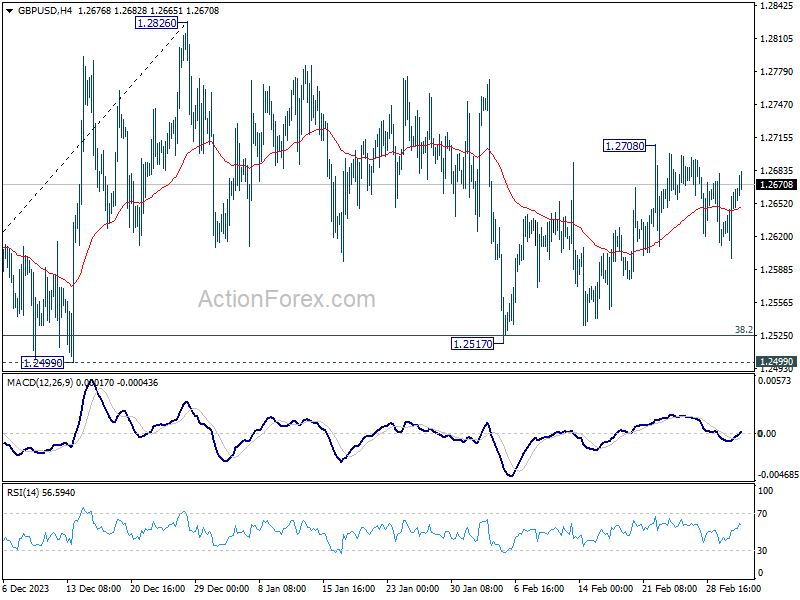
In the bigger picture, price actions from 1.3141 medium term top are seen as a corrective pattern to up trend from 1.0351 (2022 low). Rise from 1.2036 is seen as the second leg, which could be still in progress. But upside should be limited by 1.3141 to bring the third leg of the pattern. Meanwhile, break of 1.2499 support will argue that the third leg has already started for 38.2% retracement of 1.0351 (2022 low) to 1.3141 at 1.2075 again.
USD/JPY Mid-Day Outlook
Daily Pivots: (S1) 149.79; (P) 150.26; (R1) 150.56; More...
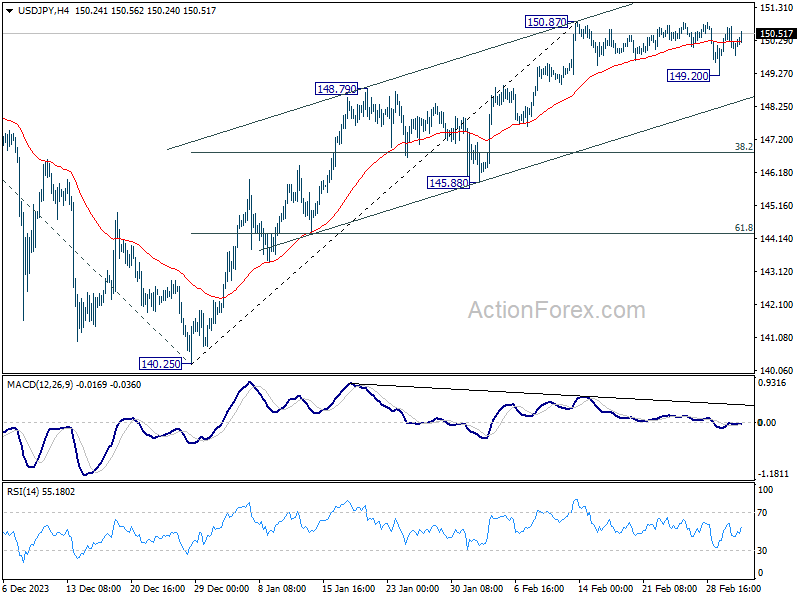
USD/JPY is still extending the consolidation from 150.87 and intraday bias remains neutral. On the upside, break of 150.87 will resume the rise from 140.25 to 151.89/93 key resistance zone. On the other hand, considering bearish divergence condition in 4H MACD, firm break of 149.20 will confirm short term topping at 150.87. Deeper fall would be seen to channel support (now at 148.47), even as a corrective move.
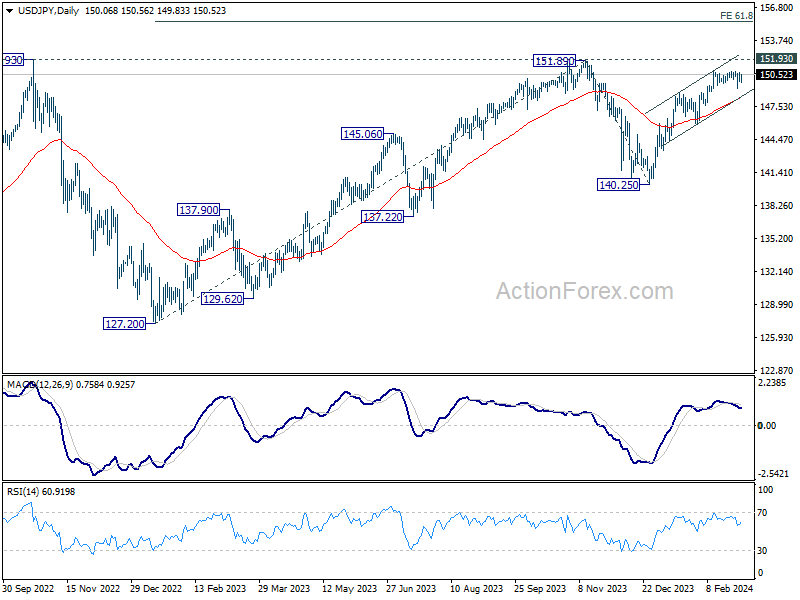
In the bigger picture, rise from 140.25 is seen as resuming the trend from 127.20 (2023 low). Decisive break of 151.89/.93 resistance zone will confirm this bullish case and target 61.8% projection of 127.20 to 151.89 from 140.25 at 155.50. However, break of 148.79 resistance turned support will delay this bullish case, and extend the corrective pattern from 151.89 with another falling leg.
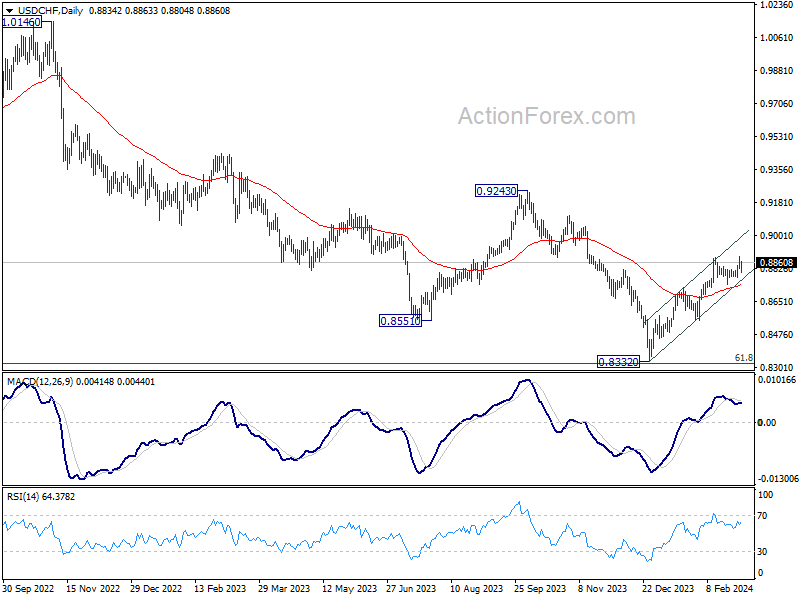
USD/CHF Mid-Day Outlook
Daily Pivots: (S1) 0.8811; (P) 0.8852; (R1) 0.8874; More....
USD/CHF rebounds notably after drawing support from 55 4H EMA, but stays below 0.8891 temporary top. Intraday bias remains neutral first. Further rally is in favor as long as 0.8741 support holds. Break of 0.8891 will resume the whole rebound from 0.8332 towards 0.9243 key resistance. Nevertheless, break of 0.8741 support will turn bias back to the downside for deeper pullback.
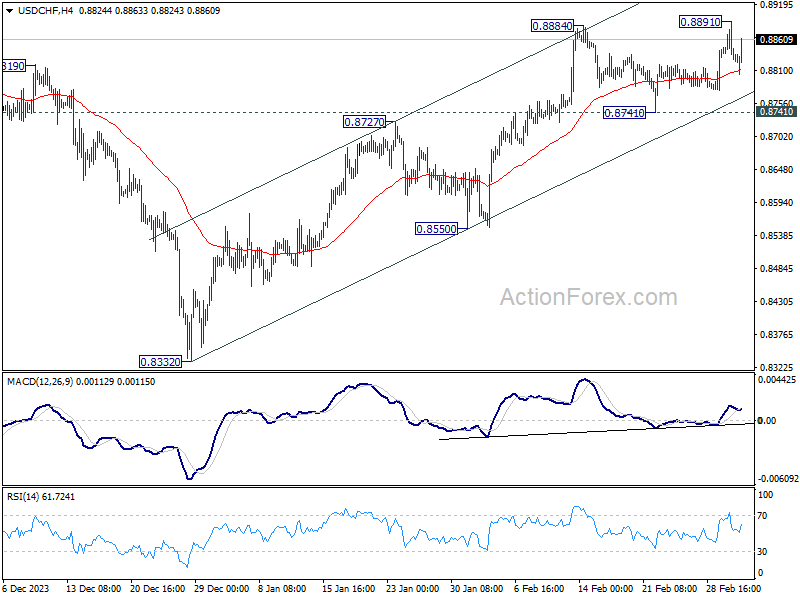
In the bigger picture, a medium term bottom should be formed at 0.8332, on bullish convergence condition in W MACD, just ahead of 0.8317 long term fibonacci support. It's still early to decide if the larger down trend from 1.0146 (2022 high) is reversing. But further rise should be seen to 0.9243 resistance even as a correction.
Swiss Franc Pressured after After Fleeting Bounce; Bitcoin Surges Above 65k
Swiss Franc bounced briefly earlier today, following release of slightly stronger than expected Swiss CPI data, only to see those gains quickly dissipate. With inflation levels persistently below SNB target, market consensus continues to lean towards an interest rate cut within the year, with September eyed as the probable month for the first reduction. However, the possibility of a rate cut as early as June has not been entirely dismissed. Meanwhile, the resurgence in the Franc's sell-off, has bolstered Sterling, and to a lesser extent, Euro and Dollar.
On another front, Yen is trading as the day's weakest performer for now, even trailing behind the weak Swiss Franc. Risk-on market sentiment, spurred by Nikkei's ascent above the 40k mark to set another record high, has been the predominant influence on Yen. This investor optimism seems to be dimming the spotlight on BoJ rate hike expectations. Kiwi, Aussie, and Canadian Dollar displaying varied performances in the backdrop of these developments.
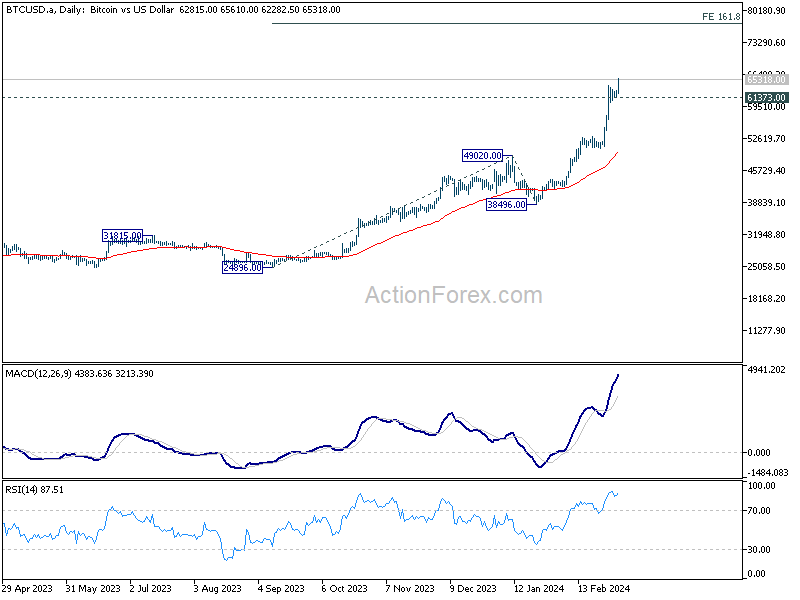
Technically, Bitcoin's up trend resumes today and breaks over 65k handle. Near term outlook will now stay bullish as long as 61373 support holds. While it's clearly overbought as seen in D RSI, based on the current momentum, there shouldn't be any problem in breaking through 68986 record high. It might only start trying to make a medium term after hitting 161.8% projection of 24896 to 49020 from 38496 at 77528.
In Europe, at the time of writing, FTSE is down -0.61%. DAX is down -0.03%. CAC is up 0.09%. UK 10-year yield is up 0.006 at 4.220. Germany 10-year yield is down -0.013 at 2.408. Earlier in Asia, Nikkei rose 0.50%. Hong Kong HSI rose 0.04%. China Shanghai SSE rose 0.41%. Singapore Strait Times fell -0.43%. Japan 10-year JGB yield fell -0.004 to 0.716.
Eurozone Sentix rises to -10.5, but no classic spring revival
Eurozone Sentix Investor Confidence March climbed from -12.9 to -10.5 in March, slightly surpassing expectations of -10.8. This increment marks the fifth consecutive rise, achieving its highest level since April 2023. Current Situation Index also saw an increase for the fifth month, moving from -20.0 to -18.5, its highest since June 2023. Furthermore, Expectations Index had its sixth month of growth, advancing from -5.5 to -2.3, reaching its peak since February 2022, which predates the onset of the war in Ukraine.
Contrastingly, Germany, Eurozone's largest economy, displayed a divergent trend, with Investor Confidence declining for the third consecutive month to -27.9 from -27.1. Current Situation fell for the 3rd straight month from -39.3 to -40.5, lowest reading since July 2020. Expectations Index fell from -14.0 to -14.3.
Sentix analysts interpreted the overall Eurozone data as moving "in the right direction," though they cautioned against interpreting this as a sign of a "classic spring revival." This cautious stance is attributed to "changed interest rate landscape". Investors are expecting a more expansive monetary policy by ECB ahead.
Swiss CPI rises 0.6% mom in Feb, slows to 1.2% yoy
Swiss CPI rose 0.6% mom in February, above expectation of 0.5% mom. CPI core (excluding fresh and seasonal products, energy and fuel) rose 0.7% mom. Domestic products prices rose 0.5% mom while imported products prices rose 1.0% mom.
For the year, CPI slowed from 1.3% yoy to 1.2% yoy, above expectation of 1.1% yoy. CPI core slowed from 1.2% yoy to 1.1% yoy. Domestic product prices growth slowed from 2.0% yoy to 1.9% yoy. Imported products prices growth improved from -0.9% yoy to -1.0% yoy.
Japan's capital expenditure surges 16.4% in Q4, signaling strong business investment momentum
Japan's capital expenditure surged remarkably by of 16.4% yoy in Q4, significantly outperforming expectations of 2.9% yoy increase. This marked the eleventh consecutive quarter of business investment growth, highlighting the robust confidence among Japanese corporations in the country's economic prospects.
The impressive figures come as a beacon of optimism, especially considering they will contribute to the revision of Q4's GDP data, which initially indicated unexpected contraction of -0.4% qoq. With this revision, it's anticipated that Japan may have narrowly avoided slipping into a technical recession.
The investment growth was particularly pronounced among manufacturers, who increased their spending by 20.6% yoy. This 11th consecutive quarter of expansion was predominantly driven by the information and communication machinery and transport equipment sectors.
Non-manufacturers also contributed with 14.2% yoy increase in investment, marking the sixth consecutive quarter of growth. The telecommunication, transportation, and postal service sectors were notably instrumental in this rise.
A Finance Ministry official commented on the data, stating, "The results reflect our view that the economy is recovering moderately. But we will need to monitor the impact of slowing overseas economies and inflation on corporate activity."
USD/CHF Mid-Day Outlook
Daily Pivots: (S1) 0.8811; (P) 0.8852; (R1) 0.8874; More....
USD/CHF rebounds notably after drawing support from 55 4H EMA, but stays below 0.8891 temporary top. Intraday bias remains neutral first. Further rally is in favor as long as 0.8741 support holds. Break of 0.8891 will resume the whole rebound from 0.8332 towards 0.9243 key resistance. Nevertheless, break of 0.8741 support will turn bias back to the downside for deeper pullback.
In the bigger picture, a medium term bottom should be formed at 0.8332, on bullish convergence condition in W MACD, just ahead of 0.8317 long term fibonacci support. It's still early to decide if the larger down trend from 1.0146 (2022 high) is reversing. But further rise should be seen to 0.9243 resistance even as a correction.
Economic Indicators Update
| GMT | Ccy | Events | Actual | Forecast | Previous | Revised |
|---|---|---|---|---|---|---|
| 21:45 | NZD | Terms of Trade Index Q4 | -7.80% | -0.20% | -0.60% | |
| 23:50 | JPY | Capital Spending Q4 | 16.40% | 2.90% | 3.40% | |
| 23:50 | JPY | Monetary Base Y/Y Feb | 2.40% | 4.70% | 4.80% | |
| 00:00 | AUD | TD Securities Inflation M/M Feb | -0.10% | 0.30% | ||
| 00:30 | AUD | Building Permits M/M Jan | -1.00% | 4.00% | -9.50% | -10.10% |
| 07:30 | CHF | CPI M/M Feb | 0.60% | 0.50% | 0.20% | |
| 07:30 | CHF | CPI Y/Y Feb | 1.20% | 1.10% | 1.30% | |
| 09:30 | EUR | Eurozone Sentix Investor Confidence Mar | -10.5 | -10.8 | -12.9 |
Two Drivers of Crypto Growth
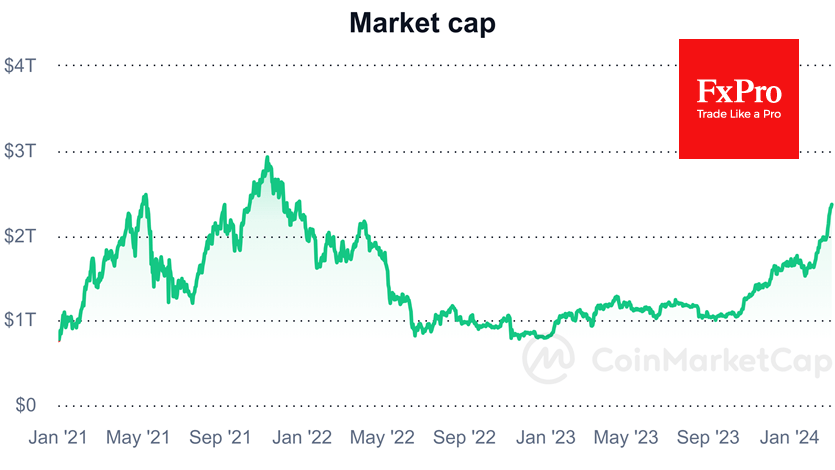
Market picture
Crypto market capitalisation rose 5% in 24 hours to $2.44 trillion, driven by extreme greed. The crypto market had a higher capitalisation for a few days in May and October-December 2021, but that was in an ageing bull market compared to a relatively young one now.
The current growth wave can be broken down into two drivers. The first is the demand for Bitcoin and Ethereum. They are favoured by large investors concerned about a new wave of problems at US regional banks. This buying interest also applies to gold. Almost exactly a year ago, we saw a similar move that saw the price of BTC rise by a third in a week.
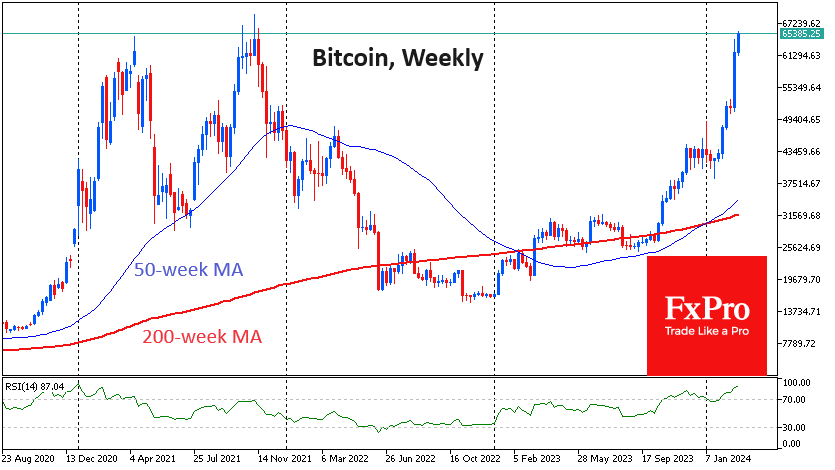
In early trading on Monday, the price of bitcoin was above $65K. That’s about 5% off the all-time high, but the cryptocurrency has only been above that level for a few hours, and we’ve only seen three daily closes above that level.
The other half of the rise is the demand for meme coins, which goes hand in hand with FOMO. Despite the meteoric rise, the market has not yet reached the absurd highs to start talking about reversal risks.
News background
Influential logger and analyst PlanB has declared the beginning of a FOMO bull market period according to his Stock-to-Flow model. According to him, “The accumulation phase is over. There are no more easy buying opportunities in orderly and slow-growing markets”. The crypto market has been in FOMO for about ten months: “extreme price spikes combined with multiple 30% drops,” PlanB believes.
The Solana-based meme token dogwifhat (WIF) is up 390% in a week, a record high among the top 100 cryptocurrencies. With a capitalisation of nearly $1.7 billion, it ranks 62nd on CoinMarketCap.
According to Lookonchain, an unidentified crypto investor sold all PEPE’s accumulated 1.97 trillion meme tokens for $6.07 million and bought other altcoins – netting $3.49 million. PEPE rose 310% in one week. Lookonchain has a whale wallet that is classed as ‘smart’, meaning that most of the trades on the address are profitable.
Macroeconomic factors could prove to be the main obstacles to further BTC growth in the short term, according to Grayscale. If inflation remains stubbornly high, the Fed may delay a rate cut. A higher interest rate is likely to be positive for the dollar and negative for Bitcoin.
The Bank for International Settlements has issued recommendations on the regulation, supervision and oversight of global stablecoins (GSCs) to address the financial stability risks posed by GSCs both domestically and internationally.
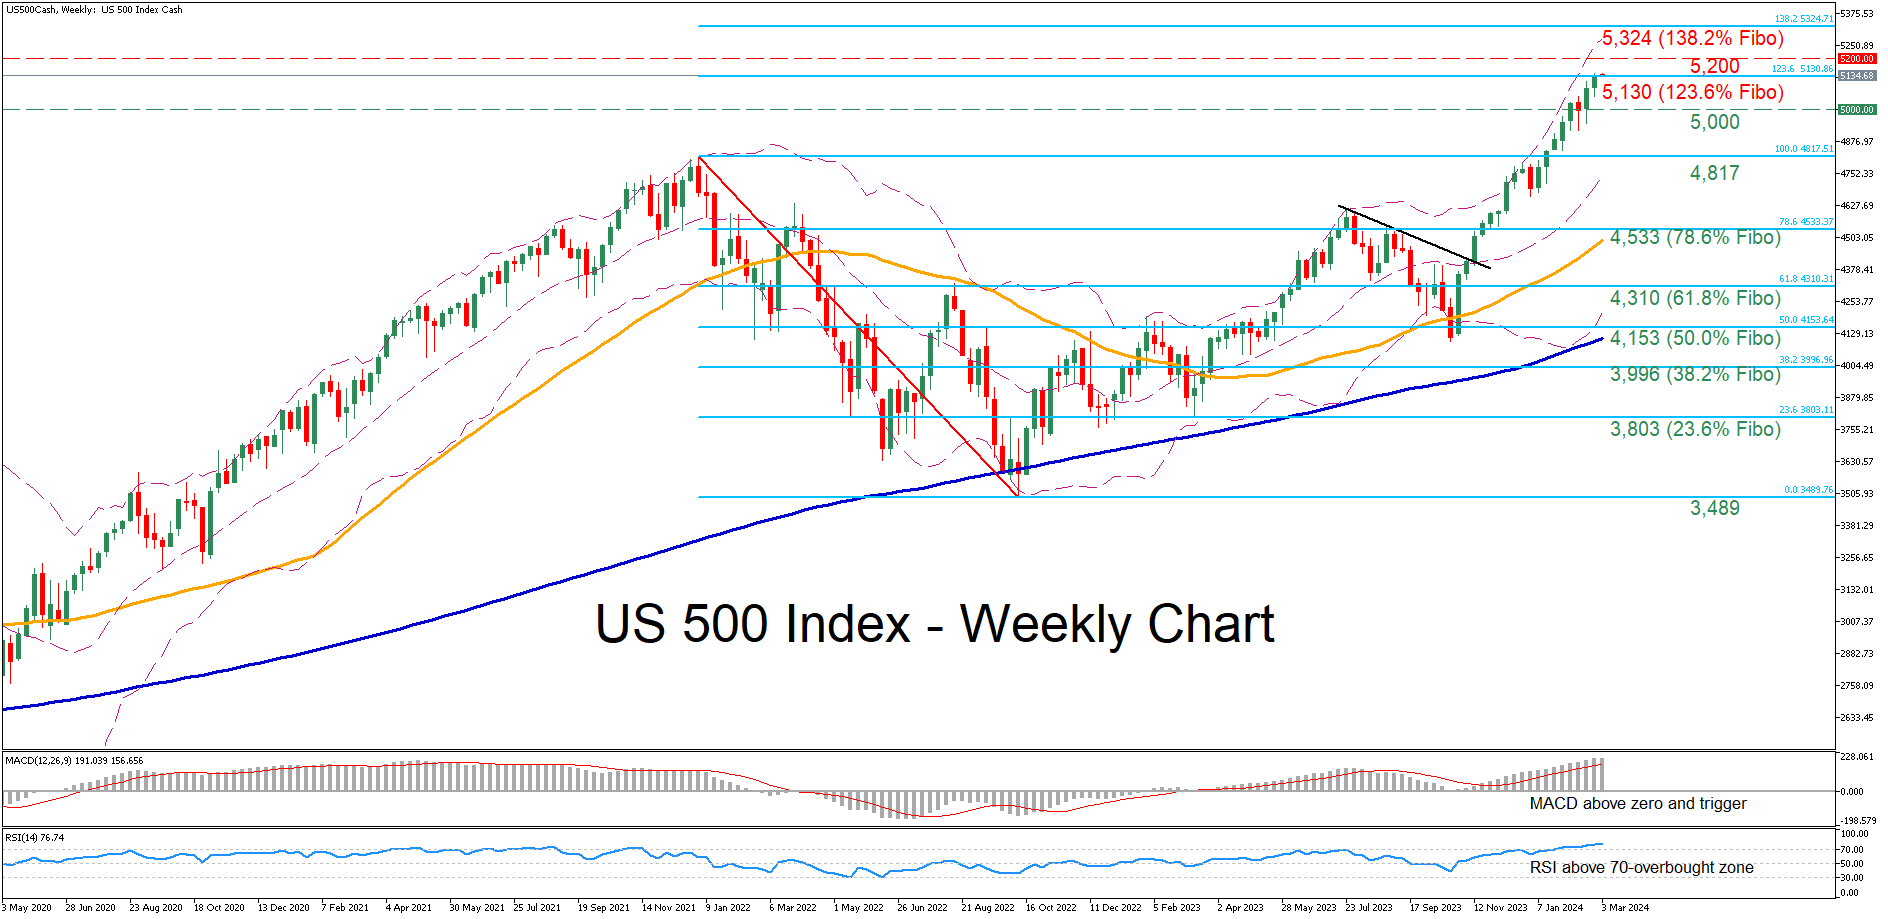
US 500 Battles With 123.6% Fibonacci
- US 500 cash index extends its series of record highs
- Tests 123.6% Fibonacci extension of its 2022 downtrend
- Oscillators look overbought, increasing risk of a pullback
The US 500 stock index (cash) has been staging an impressive rally since it bottomed out in October 2023, generating consecutive all-time highs. Given that the price is trading into uncharted waters, the Fibonacci extensions of its most recent downtrend could provide potential future resistance zones.
Should bullish pressures persist, buyers might initially claim 5,130, which is the 123.6% Fibonacci extension of the 4,817-3,489 downtrend. Surpassing that zone, the price could storm towards the 5,200 round number. Further advances could then cease around the 138.2% Fibo of 5,324.
On the flipside, if the index experiences a pullback, the 5,000 psychological level could act as the first line of defence. Should that barricade fail, the bears could attack the 2021 peak of 4,817, which could serve as support in the future. Failing to halt there, the price may challenge the 78.6% Fibo of 4,533.
Overall, the US 500 index has been facing persistent upside pressures, which have resulted in consecutive all-time highs in 2024. However, the price could soon experience a pullback as the momentum indicators are flagging extremely overbought signals.
Will NFP Report Confirm Fed’s ‘Higher for Longer’ Mantra?
- Market scales back rate cut expectations
- Inflation is not cooling as fast as expected
- Powell testifies before Congress on Wednesday and Thursday
- Spotlight to turn to NFP report on Friday at 13:30 GMT
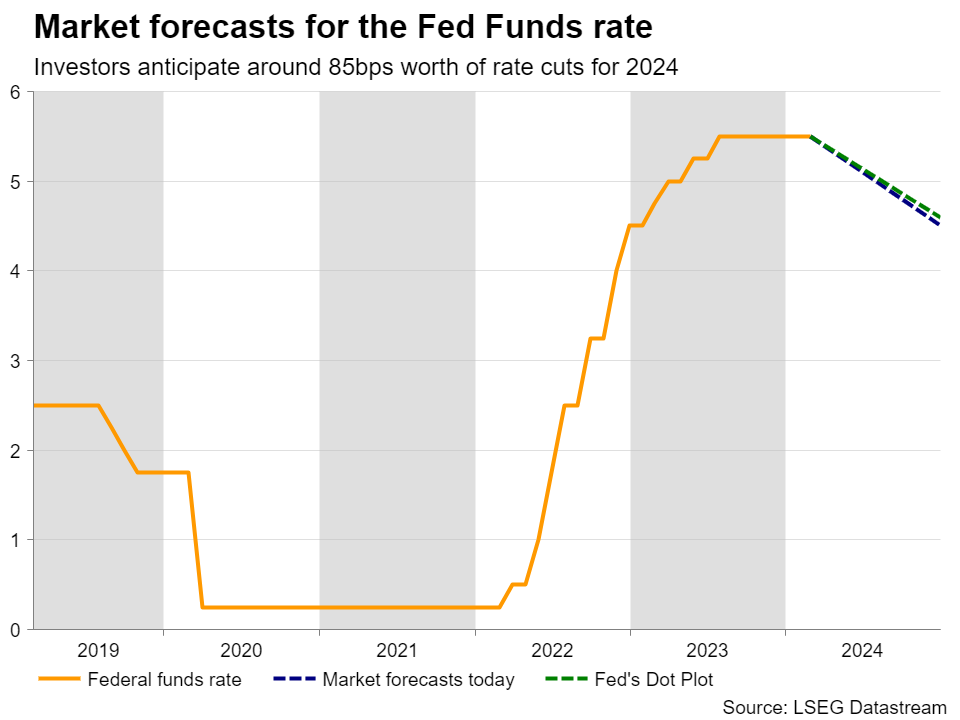
Investors get closer to the Fed’s dot plot
At its latest gathering, the FOMC appeared less dovish than expected. Policymakers decided to left interest rates untouched and dropped a longstanding reference to the possibility of further hikes. Nonetheless, they noted that it may not be appropriate to lower interest rates until they gain confidence that inflation is moving sustainably towards the 2% target. At the press conference, Fed Chair Powell was more specific, noting that a March rate cut was not the Fed’s “base case.”
Immediately after the decision, market participants pushed their bets of a first 25bps to May, while incoming data after the decision prompted them to scale back their expectations even further. Currently, the probability of a May reduction stands at around 25%, while a quarter-point cut is not fully priced in for June either. What’s more, the total number of basis points worth of rate cuts expected by the end of the year is at around 85, slightly more than the Fed’s own projection of 75. This suggests that there is still some room left for upside adjustment in the market’s implied interest rate path.
Powell testifies, NFPs the highlight
With that in mind, investors are now likely to turn their gaze to Powell’s testimony on monetary policy before Congress on Wednesday and Thursday, and Friday’s employment report for February.
With data since the latest Fed gathering pointing to stellar employment gains, a robust economic performance, and inflation not cooling as fast as anticipated, Powell is unlikely to deviate from the view that lowering interest rates is not an urgency.
As for Friday’s jobs data, the forecasts suggest that the unemployment rate held steady at 3.7%, while nonfarm payrolls are expected to have increased by 200k. According to the S&P Global composite PMI for the month, job creation was broad based, but the overall pace eased to the slowest in three months, corroborating the expectations of a slowdown in payrolls growth.
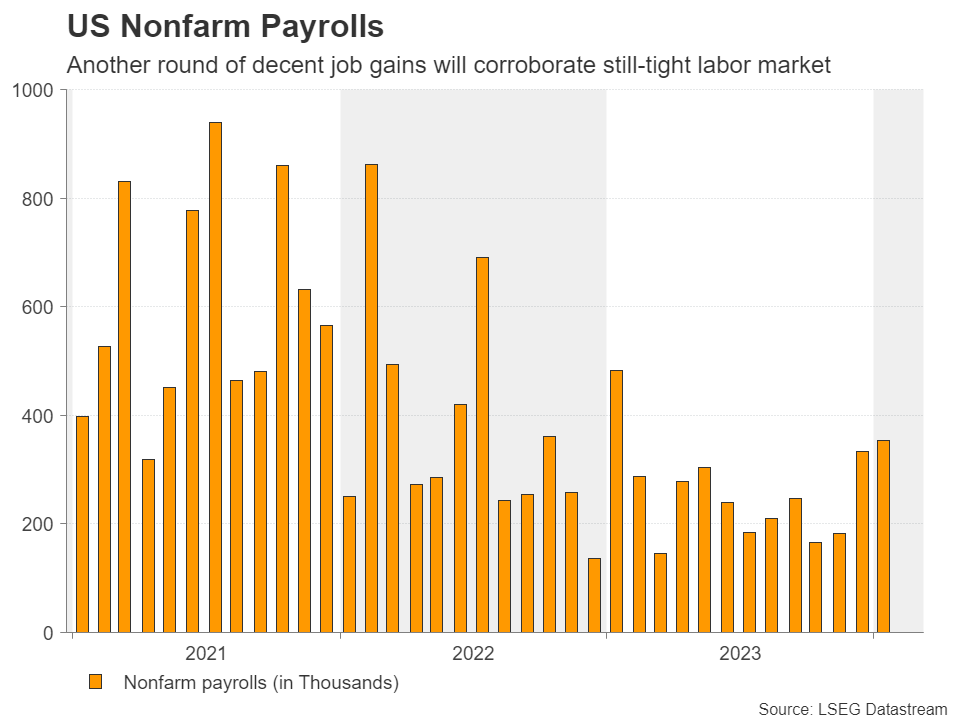
That said, after January’s stellar NFP print, another month of decent employment gains would confirm that the labor market remains tight and corroborate the view that the US economy is firing on all cylinders.
Wages also in focus amid stickier inflation
Investors may pay extra attention to the wage growth data too, as they try to estimate where inflation may be headed after the CPI and PPI data pointed to stickier than expected price pressures during January. Expectations are for average hourly earnings to have slowed to 0.2% m/m from 0.6%, with the y/y rate ticking down to 4.4% from 4.5%. This could imply that price pressures may continue easing in the months to come.
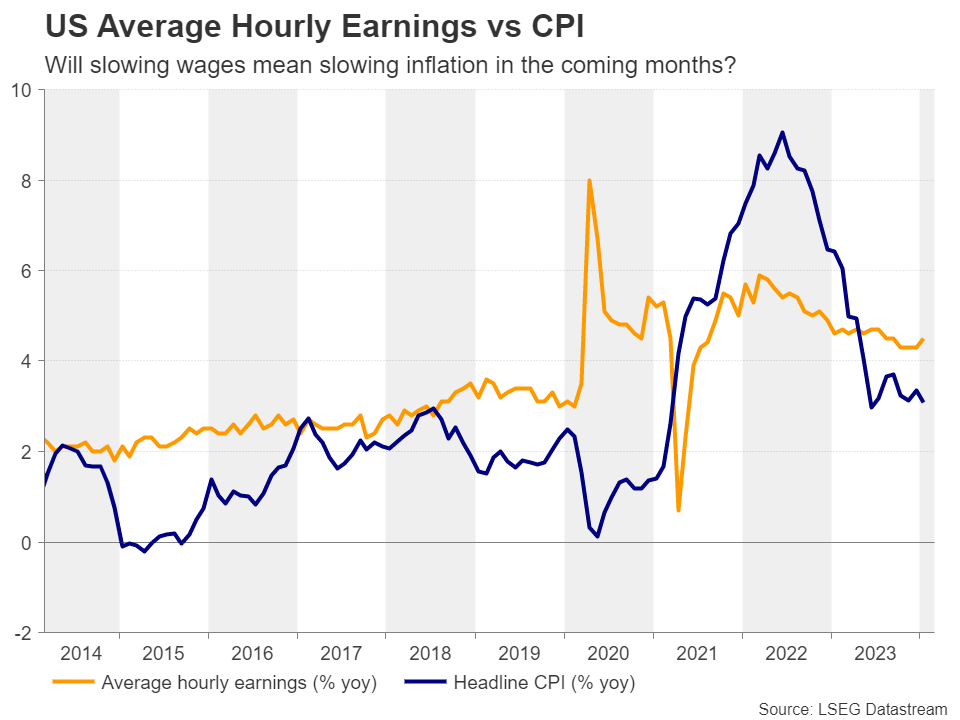
However, with the S&P Global PMIs suggesting that selling prices for goods and services accelerated somewhat in February, a minor slowdown in yearly earnings is unlikely to prompt market participants to bring forward their rate cut bets. They may even scale them further back if indeed the report points to decent job gains, conditional of course upon Powell sticking to his “higher for longer” view in the previous days.
A decent report could fuel the dollar’s engines
The US dollar could strengthen should this be the case, especially against the yen which resumed its fall after BoJ Governor Ueda contradicted Takata’s view that the 2% inflation goal is within sight, adding to speculation that even if a hike is delivered just after the spring wage negotiations, the pace of subsequent hikes in Japan will be very gradual.
Dollar/yen rebounded on Friday, after hitting support slightly below the key support zone of 149.60. That said, although the prevailing uptrend remains to the upside, the pair may need to break above the key resistance of 150.80 for a continuation to be confirmed.
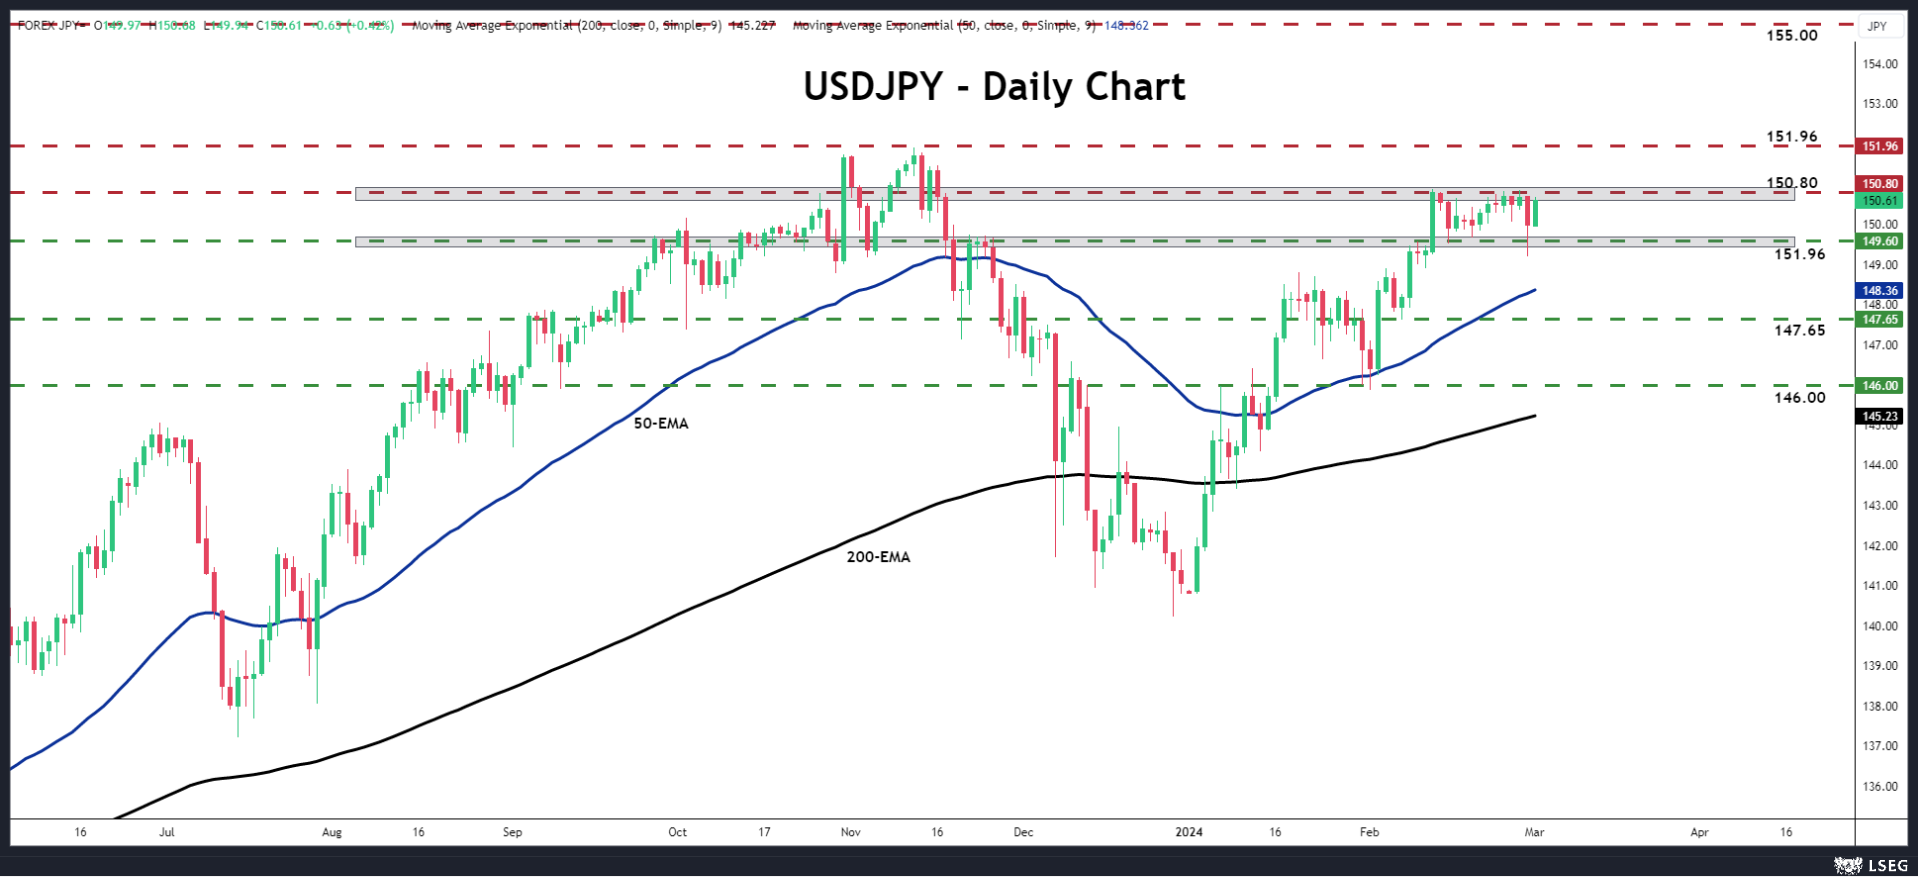
Such a break could pave the way towards the 151.94 zone, hit back in October 2022 before the BoJ intervened to support the yen. The pair stopped slightly below that zone in November 2023 too. If buyers are willing to remain in the driver’s seat and decide to push the pair above that ceiling this time around, the pair may travel towards the psychological figure of 155.00.
However, it is worth mentioning that the higher the pair goes the higher the risk of another intervention episode by Japanese authorities. But for the broader outlook of this pair to change, declines all the way below the 146.00 zone may be needed. That zone acted as support on January 31 and February 1.
Will Bank of Canada Pave the Way for a Rate Cut after CPI Drop?
- Bank of Canada kicks off March round of central bank meetings
- Dovish tilt is possible after CPI drops back below 3.0%
- Wednesday’s decision, due 14:45 GMT, may deepen loonie’s losses
Progress on inflation
The Bank of Canada heads towards its second policy meeting of the year with some good news on the inflation front. The consumer price index eased to 2.9% y/y in January from 3.4%, falling below 3.0% for the first time since June 2023 when the disinflation process came to a pause.
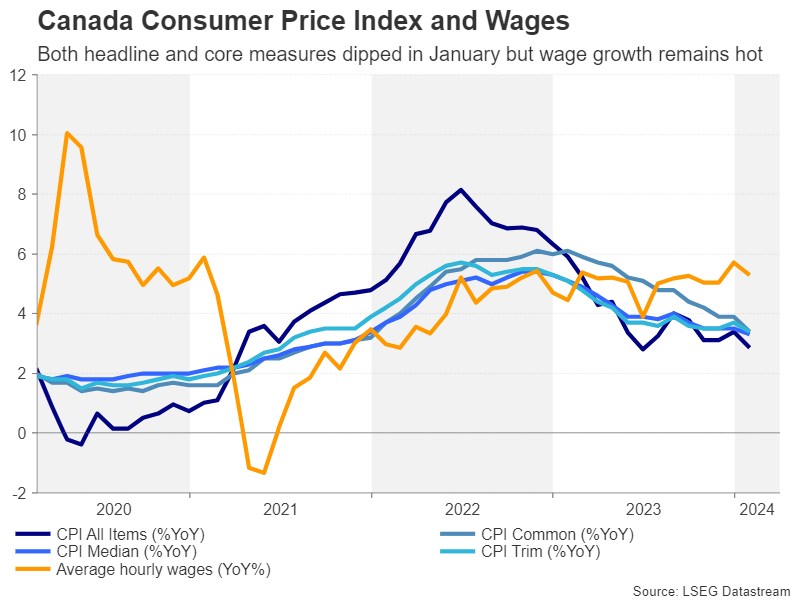
Crucially for policymakers, all three of the Bank of Canada’s core measures of inflation tumbled in January to levels last seen in late 2021. Whilst it’s too early to know whether this will be another temporary dip, the likelihood that inflation will soon hit 2% has gone up, raising the prospect of a rate cut sooner rather than later.
Overall rate cut expectations have been pared back since the start of the year, in line with the repricing for the Fed and other major central banks. Nevertheless, a 25-basis-point rate cut is now almost fully priced in for June.
Will the BoC flag a rate cut?
The Bank of Canada had predicted in January that inflation would hold around 3.0% in the first half of 2024 so the lower-than-expected CPI print could prompt officials to anticipate a faster return to the 2% target.
However, policymakers will likely want to see more evidence of inflation heading towards 2% in a sustainable manner and more data won’t become available until the Bank of Canada’s April meeting when coincidentally a new set of projections are also due to be published. Hence, a major policy shift is unlikely at the March meeting.
Not a good start to 2024 for the loonie
Yet, for the Canadian dollar, which has been on the backfoot versus the greenback all year, even a slight dovish lean by tweaking the language in the statement could worsen the bearish pressure.
Dollar/loonie is currently trading near two-month highs as the pair eyes the 1.3600 level. A dovish hold on Wednesday could see the pair test the 61.8% Fibonacci retracement level of the November-December downleg before aiming for the 78.6% Fibonacci of 1.3745.
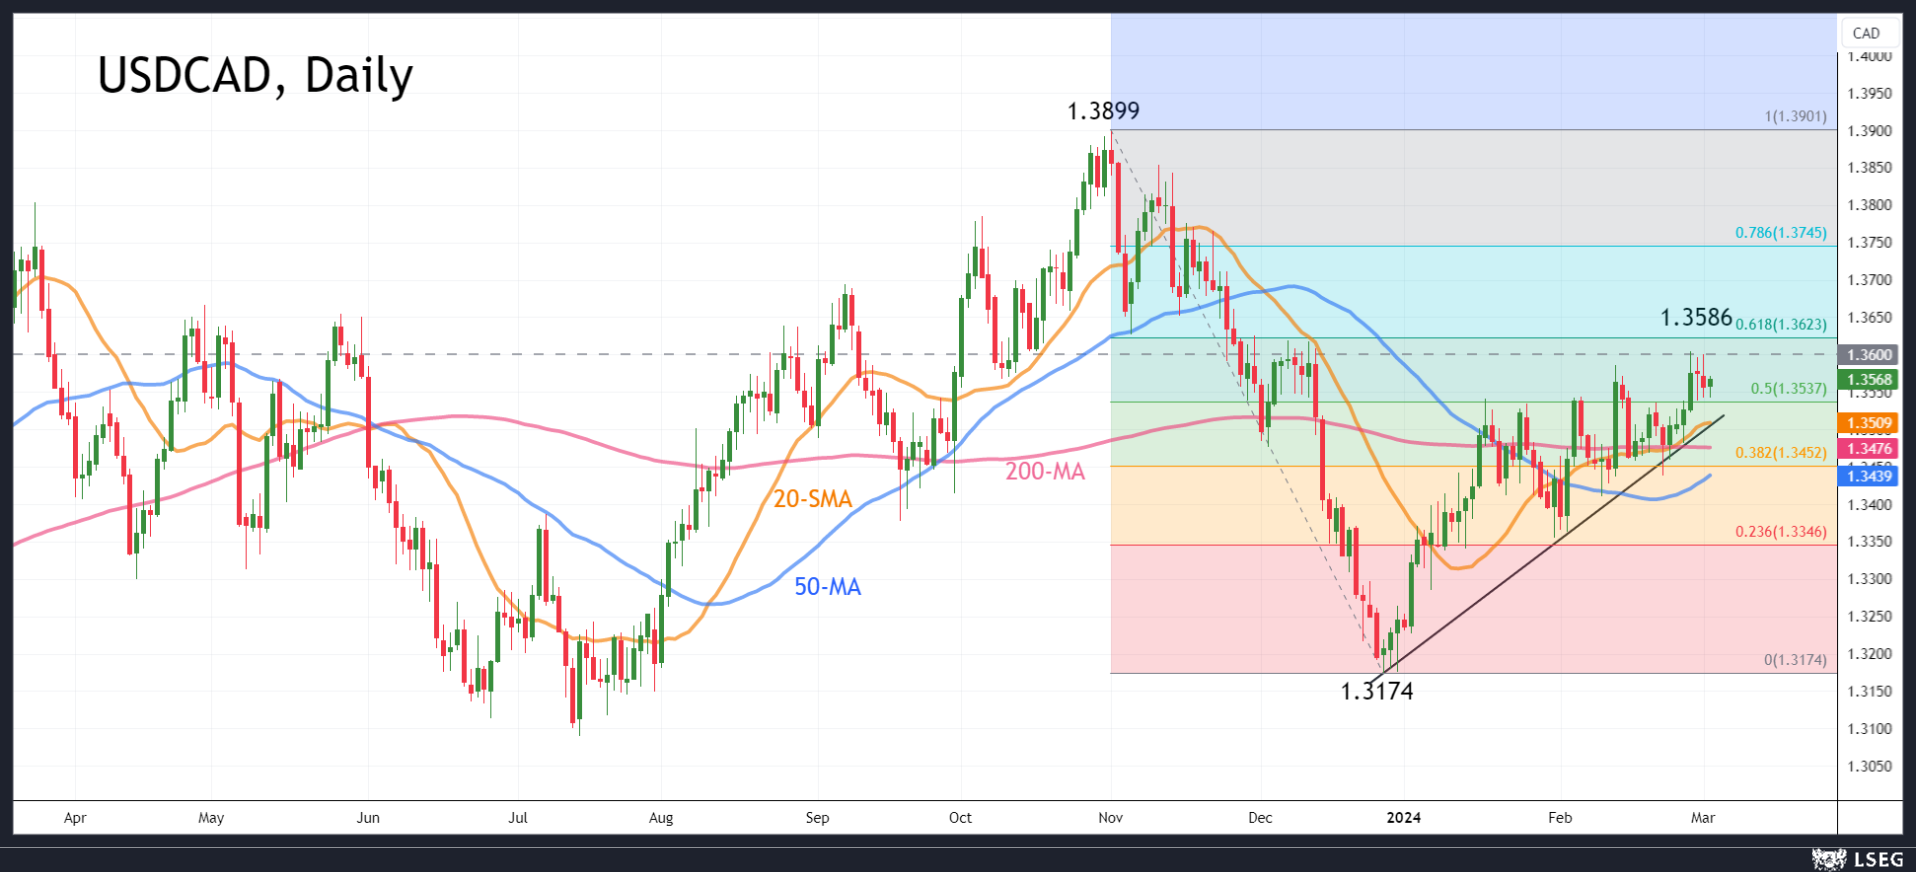
However, if the BoC maintains a cautious stance amid concerns about the housing market heating up again, dollar/loonie could pull back towards its ascending trendline that is being tracked by the 20-day moving average. A bigger correction would bring the 50-day moving average into scope at 1.3439.
Canada’s property market conundrum
Canada’s property slump appears to have bottomed and there are some indications that house prices have started to rise again. A recovery in the housing market at a time when shelter costs are already very high due to rising rental prices and higher mortgage costs could complicate things for the Bank of Canada.
Shelter inflation is currently the biggest upward contributor to prices in Canada and cutting rates risks exacerbating the problem.
A brighter outlook
The rebound in housing comes amid a broader bounce back in economic activity. Canada’s economy returned to growth in the final quarter of 2024 following a contraction in GDP in Q3. The jobs market also appears to be on the mend with the unemployment ticking lower in January.
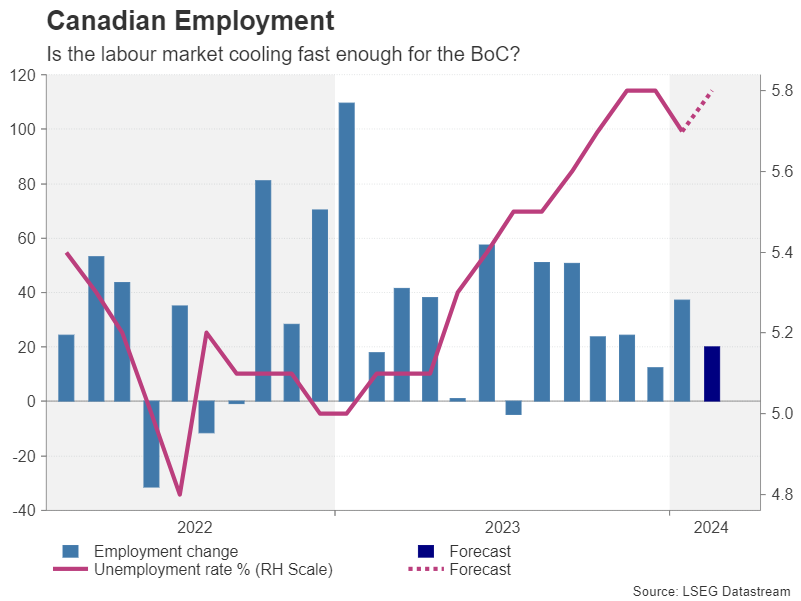
The next employment report is released on Friday (13:30 GMT) and investors will be watching for more signs that jobs growth is picking up. With wage growth running above 5.0%, a hot labour market would be another obstacle for the Bank of Canada to cut rates anytime soon.