Sample Category Title
Japan’s capital expenditure surges 16.4% in Q4, signaling strong business investment momentum
Japan's capital expenditure surged remarkably by of 16.4% yoy in Q4, significantly outperforming expectations of 2.9% yoy increase. This marked the eleventh consecutive quarter of business investment growth, highlighting the robust confidence among Japanese corporations in the country's economic prospects.
The impressive figures come as a beacon of optimism, especially considering they will contribute to the revision of Q4's GDP data, which initially indicated unexpected contraction of -0.4% qoq. With this revision, it's anticipated that Japan may have narrowly avoided slipping into a technical recession.
The investment growth was particularly pronounced among manufacturers, who increased their spending by 20.6% yoy. This 11th consecutive quarter of expansion was predominantly driven by the information and communication machinery and transport equipment sectors.
Non-manufacturers also contributed with 14.2% yoy increase in investment, marking the sixth consecutive quarter of growth. The telecommunication, transportation, and postal service sectors were notably instrumental in this rise.
A Finance Ministry official commented on the data, stating, "The results reflect our view that the economy is recovering moderately. But we will need to monitor the impact of slowing overseas economies and inflation on corporate activity."
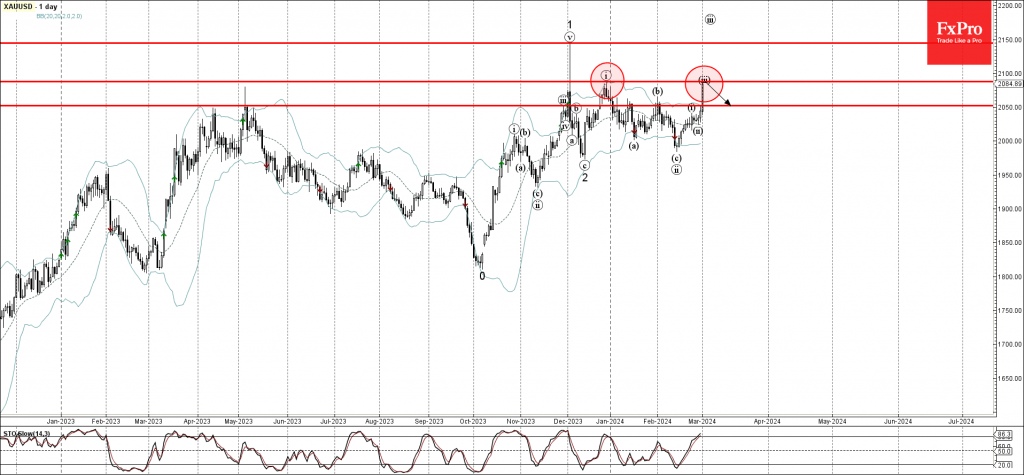
Gold may lose momentum above 2100 despite strong rally
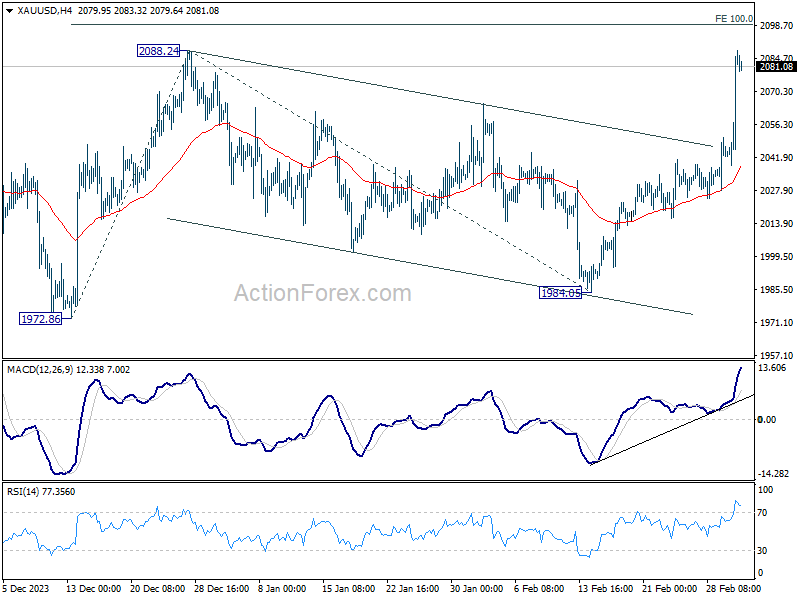
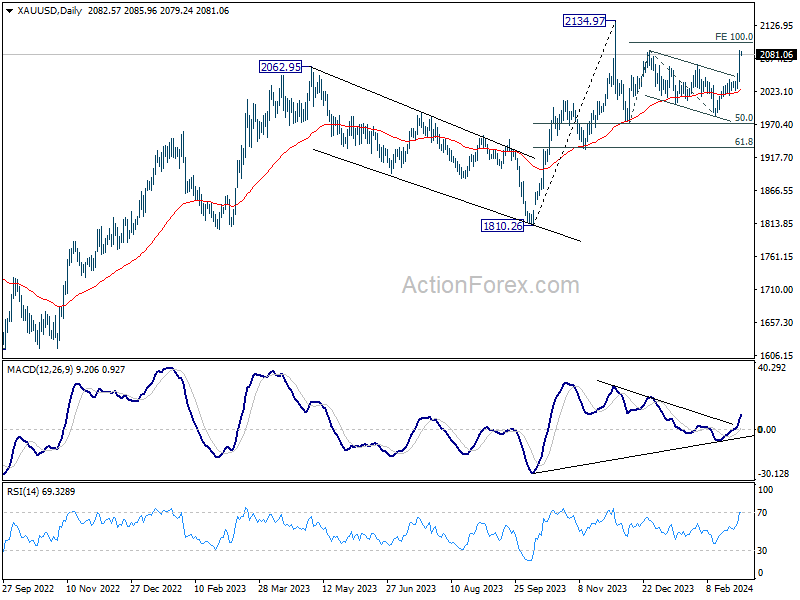
Gold accelerated sharply higher last week, propelled in part by the significant decline in US treasury yields on Friday. Technically, the key question now is whether the bounce from 1972.86 signifies the commencement of long-term uptrend resumption, or merely constitutes the second leg of the medium term corrective pattern from 2134.97.
For now, favor is mildly on the latter case. Hence, while further rally is likely through 100% projection of 1972.86 to 2088.24 from 1984.05 at 2099.43, Gold should start to lose upside momentum above there, and top below 2134.97.
Nevertheless, further upside acceleration above 2099.43, or around 2100 in short, would argue that Gold is already ready to resume the long term up trend.
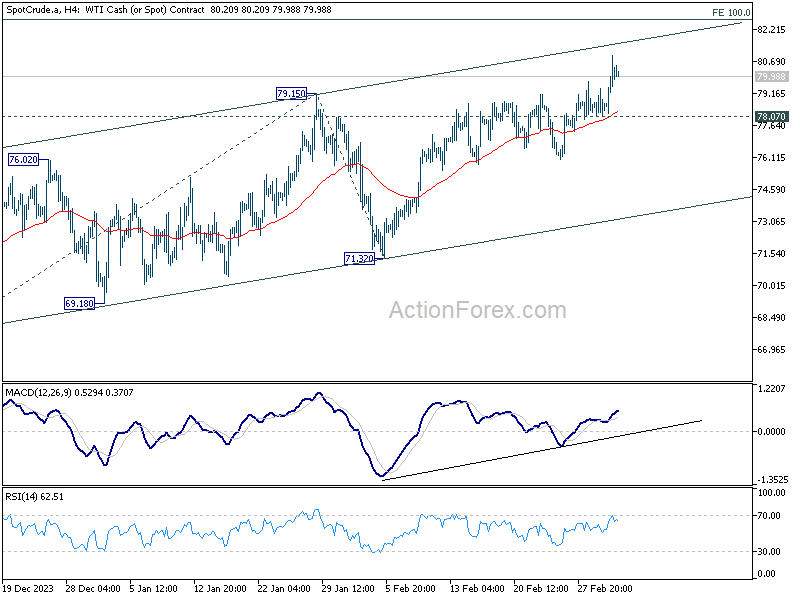
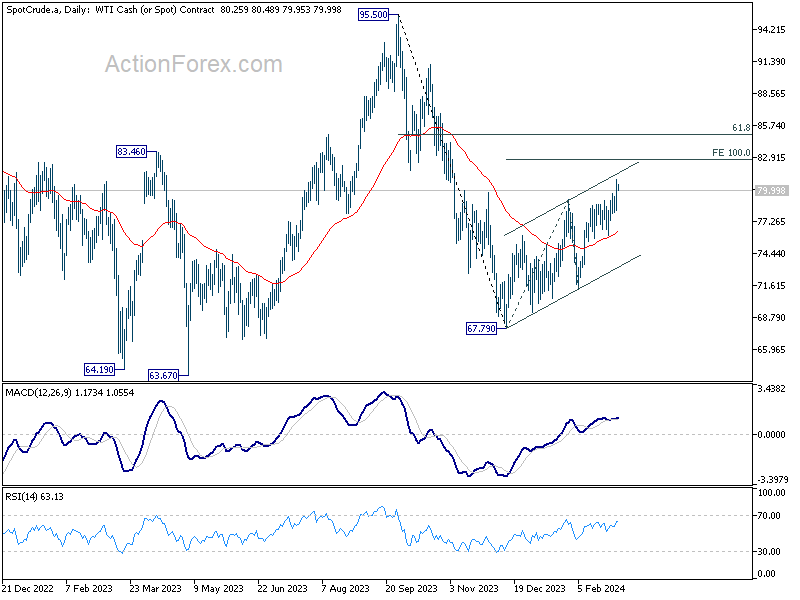
OPEC+ extends production cuts, more upside in WTI in near term
OPEC+ members announced on Sunday their agreement to extend voluntary oil output cuts of 2.2m barrels per day into Q2, aiming to stabilize the market and support oil prices. Saudi Arabia, the de facto leader of the oil cartel, committed to prolonging its substantial voluntary cut of 1m bpd through the end of June, effectively maintaining its production levels around 9m bpd. Additionally, Russia announced it would reduce its oil production and exports by an extra 471k bpd Q2.
Technically speaking, WTI's rise from 67.79 is still seen as a corrective bounce for now. Further rally is expected as long as 78.07 support holds, to 100% projection of 67.79 to 79.15 from 71.32 at 82.68. However, strong resistance could emerge below 61.8% retracement of 95.50 to 67.79 at 84.91 to limit upside and bring reversal.
EUR/USD Aims Higher, Bitcoin Could Extend Gains
Key Highlights
- EUR/USD is aiming for a move toward the 1.0920 resistance.
- A bullish flag seems to be forming with resistance at 1.0845 on the 4-hour chart.
- Bitcoin is showing positive signs and might extend gains above $63,000.
- Gold prices surged above the $2,050 resistance zone.
EUR/USD Technical Analysis
The Euro started a recovery wave above the 1.0820 level against the US Dollar. EUR/USD is now consolidating gains and might aim for a move toward the 1.0920 level.
Looking at the 4-hour chart, the pair settled above the 1.0800 level, the 100 simple moving average (red, 4-hour), and the 200 simple moving average (green, 4-hour). It is now aiming for more gains above the 1.0850 level.
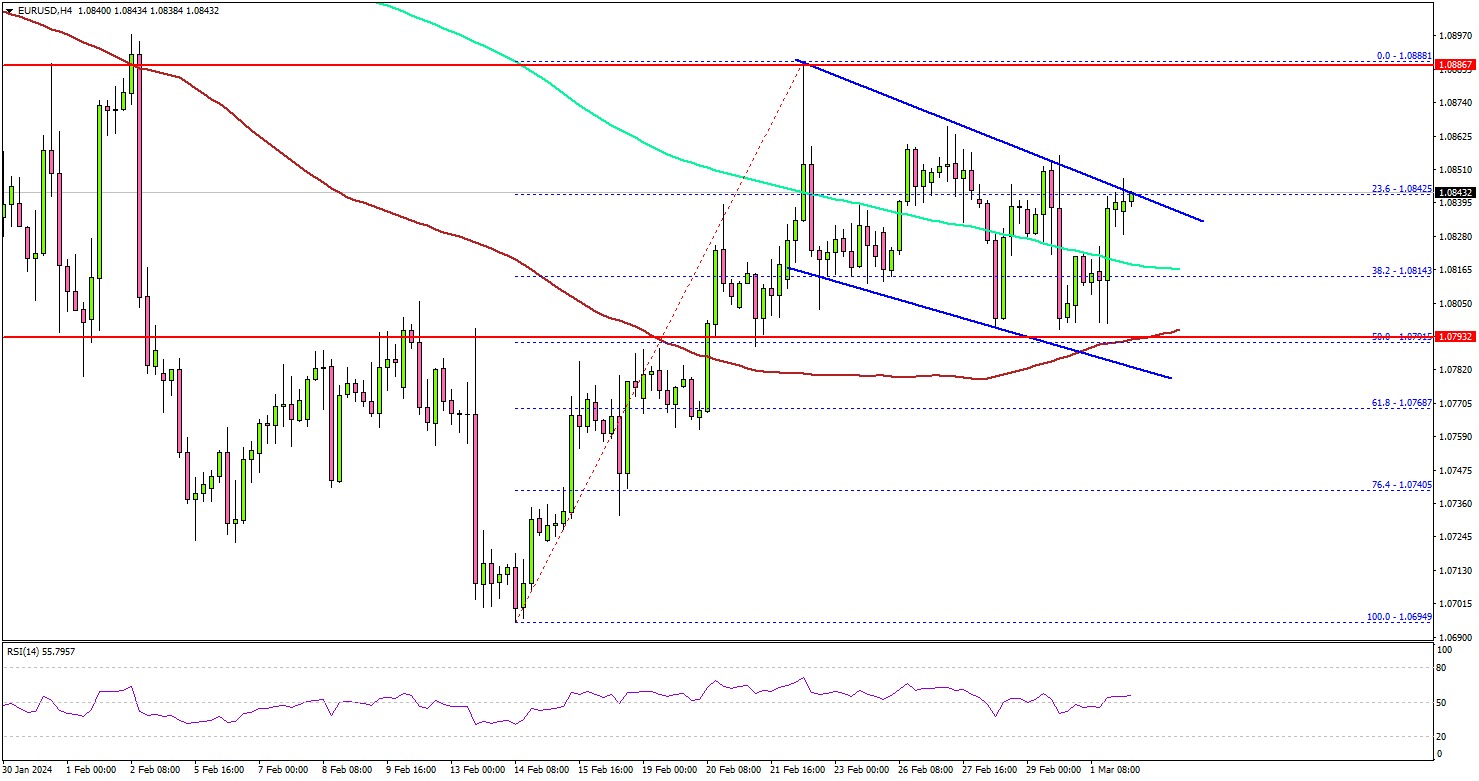
There is also a bullish flag that seems to be forming with resistance at 1.0845 on the same chart. A clear move above the 1.0845 level could send the pair toward 1.0890.
The main resistance is near 1.0920. A close above the 1.0920 zone could open the doors for more upsides. The next stop for the bulls might be 1.0980.
Immediate support is near the 1.0820 level. The next major support is at 1.0800 or the 100 simple moving average (red, 4-hour). If there is a downside break below the 1.0800 support, the pair could decline toward the 1.0740 support.
Looking at Gold, there was a strong increase above the $2,050 resistance and the bulls might aim for a move toward $2,120.
Economic Releases
- Euro Zone Sentix Investor Confidence for March 2024 - Forecast -12.2, versus -12.9 previous.
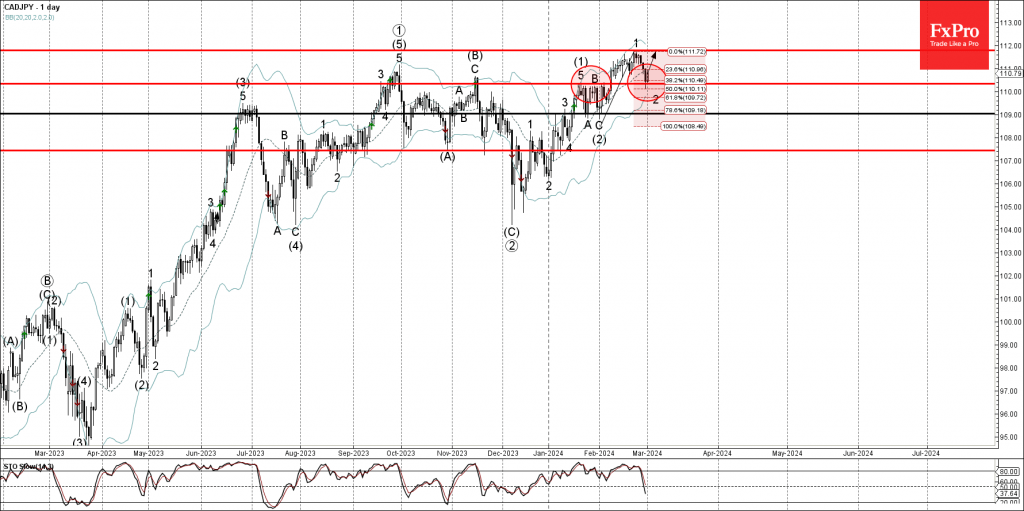
CADJPY Wave Analysis
- CADJPY reversed from key support level 110.30
- Likely to rise to resistance level 112.00
CADJPY currency pair recently reversed up from the key support level 110.30 (former strong resistance from January).
The support level 110.30 was strengthened by the lower daily Bollinger Band and by the 38.2% Fibonacci correction of the previous upward impulse 1 from January.
Given the clear daily uptrend, CADJPY currency pair can be expected to rise further toward the next resistance level 112.00 (which stopped the previous impulse wave 1).
Gold Wave Analysis
- Gold approached key resistance level 2090.00
- Likely to correct down to support level 2050.00
Gold today rose sharply after the price broke through the key resistance level 2050.00 (which has been reversing the price from the start of January).
The price is currently trading close to the key resistance level 2090.00, former monthly high from last December.
Given the strength of the resistance level 2090.00 and the overbought daily Stochastic, Gold can be expected to all further toward the next support level 2050.00.
Forex and Cryptocurrencies Forecast
EUR/USD: Weak Bulls vs. Weak Bears
Throughout the past week, EUR/USD has been trading within a narrow channel. News favouring the euro pushed it towards the resistance level at 1.0865, while positive developments for the dollar brought it back to the support level at 1.0800. However, neither the bulls nor the bears had enough strength to break through these defence lines.
The preliminary GDP data for the US in Q4 2023, released on Wednesday, 28 February, put pressure on the American currency as it fell short of both forecasts and the previous figure – 3.2% against 3.3% and 4.9%, respectively. However, the dollar managed to recover its losses the following day. This rebound was related to the Personal Consumption Expenditures (PCE) Index in the US, a measure used by the Federal Reserve to calculate inflation levels and a crucial factor in determining the regulator's future actions.
The US Bureau of Economic Analysis report, released on 29 February, revealed that the Core PCE, which excludes volatile food and energy prices, stood at 2.8% year-on-year in January. This was slightly below the previous value of 2.9% but matched analysts' forecasts precisely. On a monthly basis, the PCE increased from 0.1% to 0.4%. Market participants were immediately reminded of previously published data on consumer (CPI) and producer (PPI) inflation, which were higher than expected. This convinced them that, despite the GDP decline, the regulator might continue to postpone the start of easing its monetary policy. (Currently, the market expects the Fed to begin a rate-cutting cycle in June).
Hawkish comments from Federal Reserve officials, following the PCE publication, supported the American currency. Mary Daly, head of the Federal Reserve Bank of San Francisco, stated that lowering rates too quickly could lead to inflation stagnation. Meanwhile, her colleague, Raphael Bostic, president of the Federal Reserve Bank of Atlanta, suggested that it might be appropriate to start cutting rates in the summer.
The sellers of the single European currency were also influenced by relatively weak statistics from the Eurozone, where the volume of consumer lending in January showed the slowest growth since 2016. This indicator increased by only 0.3%. Experts cite the pressure on consumers from the high interest rates of the European Central Bank (ECB) as the main reason for this trend, which could become an additional argument for lowering them.
Regarding consumer inflation, the figures in Europe were quite mixed. Data published at the beginning of the last week from Spain and France came out stronger than forecasts. Meanwhile, in Germany, the CPI fell from 3.1% to 2.7% year-on-year, aligning with market expectations. The dynamics of EUR/USD could have been influenced by the Eurozone's overall figures, which were published on the first day of spring. The preliminary report from Eurostat showed that the Consumer Price Index (CPI) increased by 2.6% year-on-year in February, lower than the 2.8% growth in January but above the 2.5% forecast. Core inflation for the month decreased to 3.1% year-on-year compared to the previous figure of 3.3%, but it exceeded expectations of 2.9%. While inflation fell on a yearly basis, it sharply rose on a monthly basis, from a negative -0.4% to +0.6%.
At the very end of the working week, the final values of the Manufacturing Sector Purchasing Managers' Index (PMI) in the United States were released, somewhat disappointing market participants. The PMI for February fell from 49.1 to 47.8 points, despite being expected to rise to 49.5. As a result, after rebounding from the support level at 1.0800, EUR/USD once again moved upward, closing the week at 1.0839. As for the near-term forecast, as of the evening of Friday, 1 March, 45% of experts voted for the dollar's strengthening and the pair's decline. 30% sided with the euro, while 25% held a neutral position. Among the oscillators on D1, only 20% are coloured red, another 20% are in neutral grey, and the remaining 60% are green, with 10% of them in the overbought zone. Among the trend indicators: 20% are red, and 80% green. The nearest support levels for the pair are found at 1.0800, followed by 1.0725-1.0740, 1.0680-1.0695, 1.0620, 1.0495-1.0515, and 1.0450. Resistance zones are located at 1.0845-1.0865, 1.0925, 1.0985-1.1015, 1.1050, 1.1110-1.1140, and 1.1230-1.1275.
As for the upcoming week, the value of the Services Sector Purchasing Managers' Index (PMI) in the US will be announced on Tuesday, 5 March. Wednesday and Thursday are set to bring a batch of data from the US labour market, with Federal Reserve Chairman Jerome Powell scheduled to speak in Congress on the same days. The main event of the week will be the European Central Bank (ECB) meeting on Thursday, 7 March. Market participants expect the pan-European regulator to leave the interest rate unchanged at 4.50%, so the subsequent press conference by the central bank's leadership and their comments on future monetary policy will be of particular interest. The end of the week could also prove to be quite volatile. On Friday, 8 March, we will first receive data on the Eurozone's GDP for Q4 2023, followed by a batch of very important statistics from the American labour market, including the unemployment rate, average wage level, and the number of new jobs created outside the agricultural sector (Non-Farm Payrolls, NFP).
GBP/USD: Will the Budget Bolster the Pound?
With the European Central Bank (ECB) meeting just a few days away, the Federal Reserve (Fed) and the Bank of England (BoE) meetings are not due for a while: on 20 and 21 March, respectively. The nearest key event for the sterling pound in the coming week will be the announcement of the budget by the UK Government on Wednesday, 6 March. This budget is pre-election, and therefore, according to strategists at the Dutch Rabobank, it could have a significant impact on the British currency, which in 2024 is the second most successful G10 currency after the US dollar.
It's worth noting that, according to current rules, general elections in the UK must take place no later than 28 January 2025. According to The Guardian, Prime Minister Rishi Sunak is leaning towards holding them in the second half of 2024. However, The Daily Telegraph reports that elections for the lower house of the British Parliament could occur even earlier: as soon as this spring.
Economists at Rabobank anticipate that the pre-election budget will include fiscal incentives, which could serve as a new stimulus for strengthening the pound. This entails a moderate easing of fiscal policy, potentially involving changes more in national insurance than in income tax. Any reforms that could boost incentives to work or changes in regulation that might enhance investment incentives will be of particular interest to the market. An increase in the labour force would contribute to economic growth and, therefore, could be seen as a favourable factor for the British pound.
Both Rabobank and the Japanese MUFG Bank believe that the extent of potential fiscal incentives is unlikely to be sufficient to significantly improve the metrics of the British economy. However, even a small number of such stimuli is likely to reinforce the general view that the Bank of England will not be in a hurry to cut interest rates and will not do so either in May or June.
Let's recall that at its meeting on 1 February, the Bank of England (BoE) maintained the rate at the previous level of 5.25%. The accompanying statement mentioned that "more evidence is needed that the Consumer Price Index will fall to 2.0% and remain at this level before cutting rates." Market participants are anticipating the first rate cut to occur in August. This expectation has already been factored into prices and prevents GBP/USD from declining.
However, if inflation remained unchanged at 4.0% in February and the country's GDP contracted by -0.3%, it seems the Government intends to bolster the economy with new fiscal incentives. Nonetheless, if these measures do not lead to GDP growth, discussions may once again turn towards an imminent rate cut, which would exert pressure on the pound.
GBP/USD concluded the past week at the level of 1.2652, failing to break out of the medium-term sideways channel of 1.2600-1.2800. Regarding the analysts' forecast for the near future, their opinions were evenly divided: a third voted for the pair's decline, a third for its rise, and a third remained neutral. Among the oscillators on D1, 25% point south, 40% look north, and the remaining 35% are pointing east. Trend indicators, as a week ago, show a significant bias towards the British currency – 80% indicating north and 20% south. Should the pair move southward, it will encounter support levels and zones at 1.2575-1.2600, 1.2500-1.2535, 1.2450, 1.2375, and 1.2330. In the event of a rise, it will meet resistance at levels 1.2695-1.2710, 1.2785-1.2815, 1.2880, 1.2940, 1.3000, and 1.3140.
Besides the announcement of the country's budget on 6 March, no significant macroeconomic statistics regarding the economy of the United Kingdom are scheduled for release in the coming week.
USD/JPY: Petal Predictions
There's an ancient method of fortune-telling with a flower. A girl takes a flower in her hand and plucks the petals one by one: the first one means someone will love her, the second means they won't, the third means love, the fourth means no love, and so on until the petals run out. The fate declared by the last petal is believed to come true. This method of fortune-telling can quite aptly be applied to the Bank of Japan (BoJ): will change its monetary policy, won't change, will change, won't change...
Low interest rates make the yen cheap, which in turn stimulates exports, making Japanese goods competitive in foreign markets. However, on the flip side, it creates problems for the national industry as it makes imports more expensive, primarily the import of raw materials and energy resources.
In January, the trade balance was sharply negative. If in December the balance was in favour of imports (+69 billion yen), in January, it collapsed to minus 1758 billion yen. Looking at the balance for the entire year of 2023, imports often lost to exports. Industrial production decreased by -7.5% in January, which is worse than the previous growth of +1.4% and the forecast of -6.7%. Thus, Japanese officials, like with the flower method, wonder what is better and more important – supporting the economy or fighting inflation. Meanwhile, the BoJ does not take any concrete steps but limits itself to vague statements, often very contradictory.
On 29 February, following hawkish comments from Bank of Japan (BoJ) Board member Hajime Takata, the yield on Japanese government bonds rose from 0.68% to 0.71%, and USD/JPY plummeted from 150.14 to 149.20. This high-ranking official stated that the BoJ should consider the possibility of adopting flexible countermeasures, including moving away from monetary easing policies, which investors interpreted as a signal for a rate hike.
However, just a day later, Kazuo Ueda, the head of the Bank of Japan, stated that the country's economy would continue to recover gradually, and the GDP decline in the fourth quarter was somewhat of a correction after the strong growth spurred by the economic restart post-COVID pandemic. According to Ueda, inflation is decreasing at a faster pace than expected, without any rate hikes. Following this, USD/JPY reversed direction, heading north and rising to 150.70.
The main advantage of the yen right now is that while the major G10 central banks are considering easing their policies, the Bank of Japan can only contemplate tightening its policy. It is clear that it will not lower its already negative interest rate of -0.10%. Commerzbank still does not rule out the possibility that the BoJ may decide to take initial steps towards normalizing its monetary policy soon. "However, we expect this to be limited in nature," write the bank's economists. "As in 2000 and 2006, the first interest rate hikes are likely to slow inflation. After that, there will be no further normalization." As a result, Commerzbank forecasts a gradual decline in USD/JPY to 142.00 by December this year, followed by a steady rise to 146.00 by the end of 2025.
Last week concluded at 150.10 for the pair, following the release of weak PMI data in the US manufacturing sector. Looking ahead, the analysts' median forecast positions 60% in favor of the bears for the USD/JPY pair, 20% for the bulls, and 20% remain indecisive. On the D1 oscillators, 65% are green (with 10% in the overbought zone), and the remaining 35% display a neutral-grey color. Similarly, 65% of the trend indicators are green, with 35% red. The nearest support level is at 149.60, followed by 149.20, 148.25-148.40, 147.65, 146.65-146.85, 144.90-145.30, 143.40-143.75, 142.20, and 140.25-140.60. Resistance levels and zones are at 150.90, 151.70-152.05, and 153.15.
In the upcoming week's calendar, Tuesday, 5 March, is notable for the announcement of the Consumer Price Index (CPI) in the Tokyo region. There are no other significant events related to the Japanese economy scheduled for the near future.
CRYPTOCURRENCIES: New Records for the "Naked King"
Last week, bitcoin set historical highs against local currencies in many countries. Now, the leading cryptocurrency is aiming to test and possibly surpass its all-time high of $68,917, reached on 10 November 2021. At least, the current dynamics suggest this goal: starting from $50,894 on Monday, 26 February, BTC/USD soared to $63,925 by Wednesday, gaining more than 25% in just three days. At this point, the Bitcoin Fear & Greed Index jumped to 82 points, entering the Extreme Greed zone. As Matt Simpson, a senior market analyst at City Index, wrote, "If this were any other market, it would probably be classified as 'peak overheating – stay away from this bubble.' But bitcoin has entered a parabolic rally phase, and there are no immediate signs of a peak forming.".
Let's recall that on 1 February, BTC was trading at $41,877. Thus, in 29 days, the digital gold gained approximately 50%, making this past February the most successful month for investors in the last three years. We thoroughly examined the five reasons behind the ongoing bull rally in our previous review, ranging from the most to the least important. Large investments in spot Bitcoin ETFs acted as a catalyst for the frenzied demand for bitcoin. However, as noted by JPMorgan, purchases by retail crypto investors with relatively small amounts have even surpassed the cash flows from large companies at this point.
Glassnode analysts believe that the current situation resembles the boom observed in 2020–2021. The dynamics of capital flows, exchange activity, leverage in crypto derivatives, and demand from both institutional and retail speculators all indicate an explosion in investors' risk appetite. Signs of speculative sentiment have also emerged in the derivatives market. The total open interest (OI) in bitcoin futures reached $21 billion and is also approaching the euphoria levels of 2021. Only in 7% of trading days was the OI value higher. The substantial increase in the liquidation of short positions on bitcoin acted as an additional trigger.
Investor, founder of Heisenberg Capital, and host of the Keiser Report, Max Keiser, compared investing in the leading cryptocurrency to buying shares of Warren Buffett's Berkshire Hathaway in March 1985, when they were priced at $1,500 each. Since then, the price of these shares has risen to $629,000. According to Keiser, bitcoin has the potential to increase by more than 41,000%. If the leading cryptocurrency experiences such rapid growth, each coin would be worth over $21,000,000, and the digital asset's market capitalization would exceed $450 trillion. (For comparison, the current market capitalization of Apple Inc. is $2.82 trillion, making it one of the most valuable companies in the world, followed by Microsoft at $2.0 trillion, Alphabet at $1.77 trillion, and Amazon at $1.6 trillion).
Furthermore, Max Keiser warned traders and investors of a potential major crash in the US stock market. He stated, "A crash akin to 1987 is coming. Bitcoin is the perfect safe haven, whose price will soar above $500,000." It should be noted that bitcoin has completely "decoupled" from such risk assets as stocks, and its correlation with stock indices such as the S&P500, Dow Jones, and Nasdaq has virtually dropped to zero.
After BTC/USD broke through the $56,000 level on 27 February, legendary trader, analyst, and head of Factor LLC, Peter Brandt, revised his forecast for the first cryptocurrency's rate in 2025 from $120,000 to $200,000. The expert raised the bar as bitcoin overcame the upper boundary of resistance of a 15-month channel (on the BTC/USD chart, these are the trend lines that connect the lows of November 2022 and September 2023, as well as the highs of April 2023 and January 2024). According to Brandt, the current bullish cycle will conclude in August-September 2025. By that time, the quotes of the digital gold should reach the stated goal.
Regarding the exit point from the position, Brandt, half-jokingly, half-seriously, wrote that he would use laser eyes on the X network as a "contrarian indicator," just as in 2021. "So, folks," he urged, "if you want bitcoin to maintain a strong trend, please do not post laser eyes on your social media profile picture. Too many laser eyes are a sell signal."
A similar figure was mentioned by ChatGPT-4. According to this Artificial Intelligence, by August 2025, the price of BTC could reach $179,000. However, ChatGPT-4 acknowledged the difficulty of precise forecasting and warned that "these calculations are speculative and depend on a wide range of unpredictable economic, regulatory, and technological factors.".
Regarding the current year, 2024, the price of the first cryptocurrency could reach $150,000 in the next 10 months. This opinion was expressed by Tom Lee, co-founder of the analytical firm Fundstrat, in an interview with CNBC. "ETFs increase demand, halving reduces supply, and the expected easing of monetary policy all support risk assets and bitcoin," he explained. At the same time, the expert believes that a correction in the crypto market should not be expected in the near future. In the long-term perspective, Lee reiterated his January forecast of bitcoin reaching $500,000 within five years. "It's sound money, I think it's proving its utility. It's a great store of value, a good risk asset, and also incredibly safe," added the Fundstrat co-founder.
As of the review's writing on the evening of Friday, 1 March, BTC/USD is trading in the vicinity of $62,500. The total market capitalization of the crypto market has surpassed an important threshold of $2 trillion and reached $2.34 trillion (up from $1.95 trillion a week ago). The Crypto Fear & Greed Index has risen from 76 to 80 points and is in the Extreme Greed zone.
And finally, a fly in the ointment amidst the general rejoicing. Contrary to numerous bitcoin enthusiasts, experts at the European Central Bank believe that the fair value of BTC is... zero. And this is despite the approval of spot bitcoin ETFs in the US and the current price rally.
In November 2022, ECB experts published an article titled "Bitcoin's Last Stand". There, they referred to the stabilization of the cryptocurrency's quotes as "an artificially induced last gasp before the road to ultimate irrelevance". Since then, the price of digital gold has risen from ~$17,000 to ~$60,000. However, this has not caused the bank's specialists to change their opinion. In a new essay titled "ETF Approval - New Clothes for the Naked King", they stated that they were right in their main arguments more than a year ago. Firstly, bitcoin has failed as a global decentralized digital currency for payments. Secondly, the cryptocurrency has not become a suitable investment asset whose value will inevitably increase.
"Bitcoin is still not suitable as an investment," the essay states. "It does not generate any cash flows (like real estate) or dividends (like stocks), cannot be productively used (like commodities), does not offer any social benefits (like gold jewellery), or subjective value based on outstanding abilities (like works of art)," believe ECB experts. It would be interesting to see what they would say if, for example, Max Keiser's forecast comes true, and the "naked king" is worth $21 million per coin.
Yen Rises on BoJ Rate Speculation, But Gains Muted
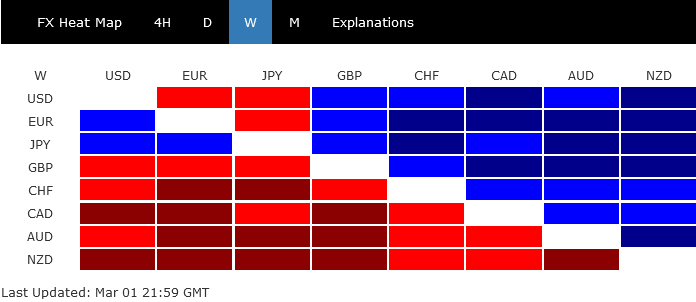
Yen ended as the best performer last week amidst intensifying discussions around BoC rate hike, spurred by comments from the central bank's officials. The anticipation of policy tightening propelled Yen forward, although gains were tempered by uncertainties surrounding the timing of the first move, and the path of subsequent rate increases. The claimed the position of the second strongest currency, supported by higher than expected inflation data. Dollar ranked third, with its rally hindered by a series of weak economic data.
On the other hand, New Zealand Dollar found itself at the bottom of the performance chart, suffering significant losses after RBNZ decided to keep interest rates steady. The central bank's statement was perceived as less hawkish than market participants feared, diminishing expectations for future rate hikes. Australian Dollar and Canadian Dollar also faced headwinds, ending the week among the weakest currencies, while Sterling and Swiss Franc were mixed.
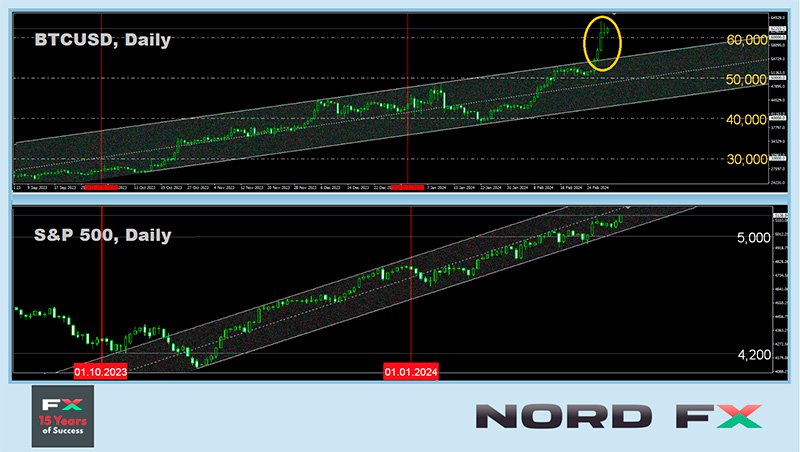
The broader financial markets embraced risk-on mood, evidenced by record-setting performances across major indices. DOW, S&P 500, NASDAQ, DAX, CAC, and Nikkei all soared to new heights, underlining a pervasive optimism among investors. Gold capitalized on Dollar's late-week pullback, mounting a surge that positions it on the cusp of reaching new record high. Simultaneously, Bitcoin broke through the 60k mark, signaling readiness to test its historical peak as well.
NASDAQ Reaches New Heights, 10-Year Yield Declines, Fed Still Seen to Cut in June
US economic data released last week painted a slightly dovish picture for Fed, subtly tipping the scales towards the start of rate reduction within the first half of this year. On the one hand, the alignment of both headline and core PCE inflation with market expectations last week signaled continued, albeit slow, disinflation progress.
On the other hand, the surprising downturn in ISM Manufacturing Index, which not only underscored the ongoing 16-month contraction within the manufacturing sector but also suggested exacerbation of the situation. Further compounding the outlook were the final consumer survey readings from University of Michigan, which revealed declines across all three measures—sentiment, current conditions, and consumer expectations—exceeding preliminary estimates.
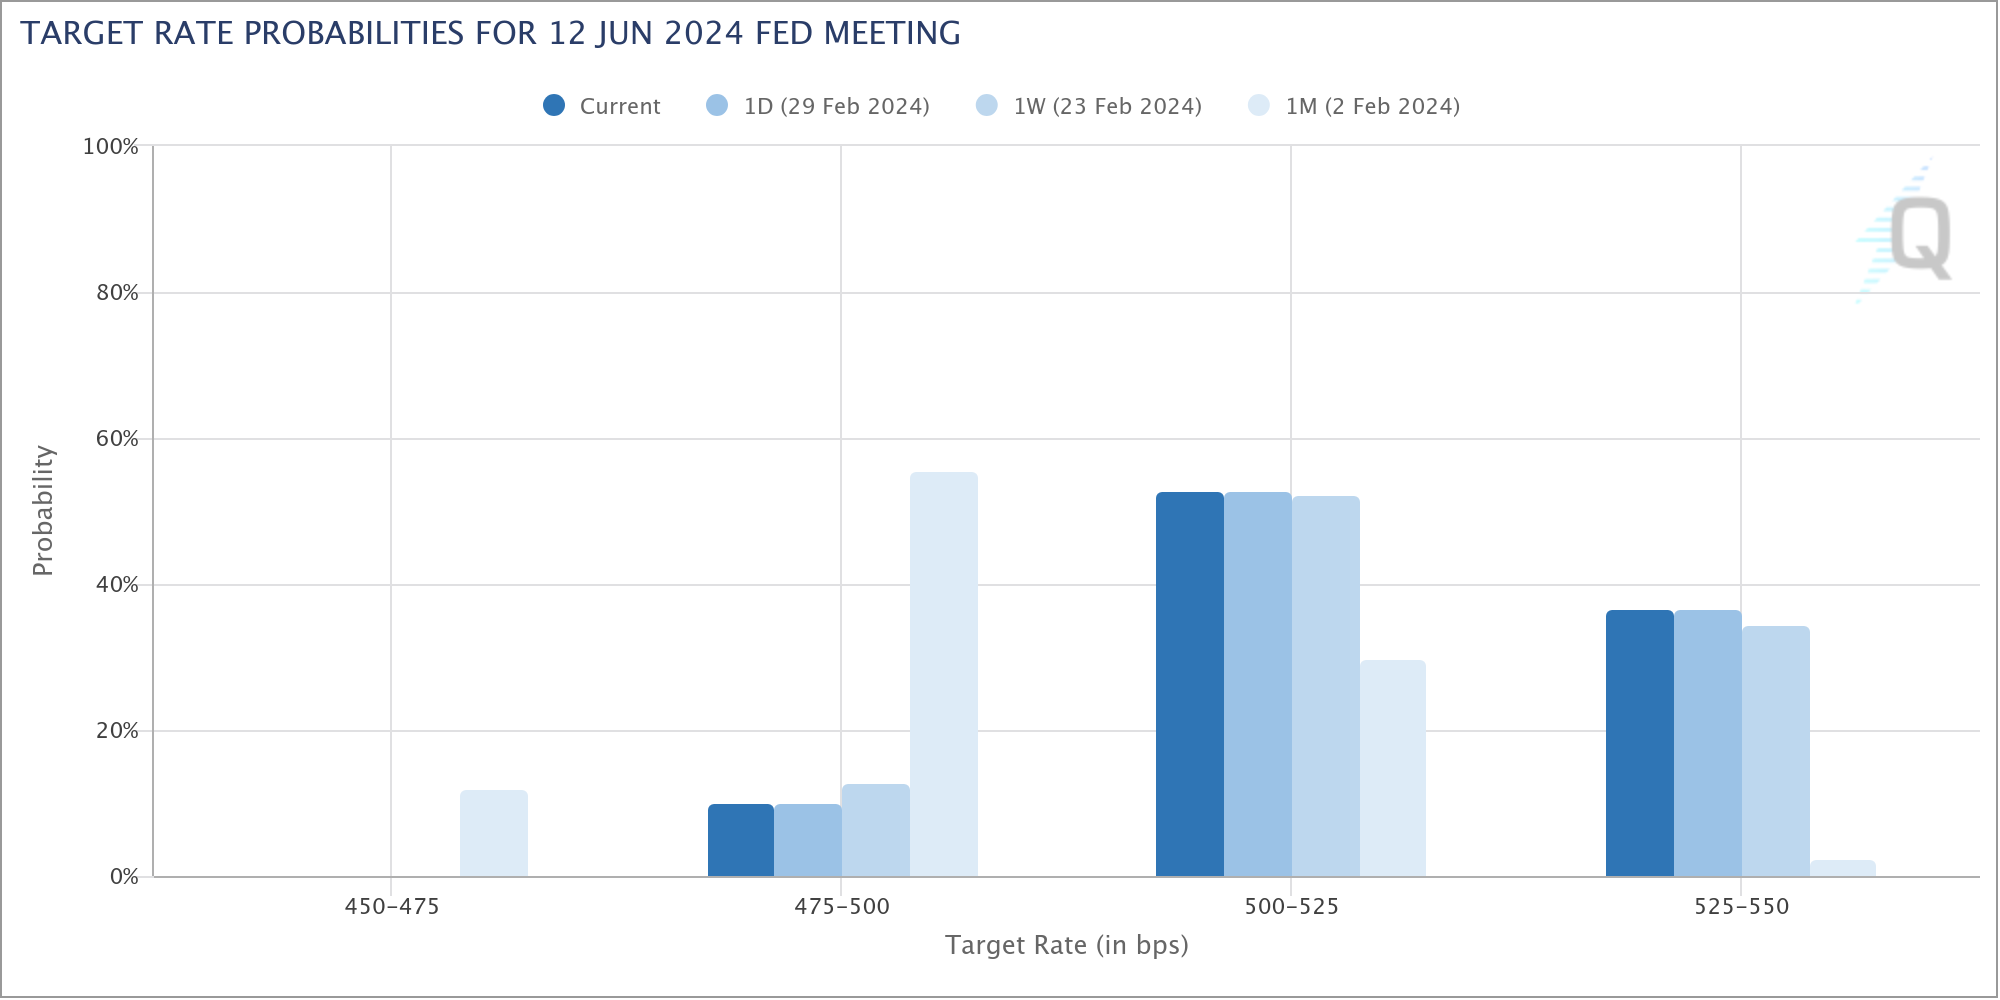
In response to this trio of economic indicators, fed funds futures are now pricing in slightly less than 65% chance of the first rate cut in June, essentially unchanged from a week prior.
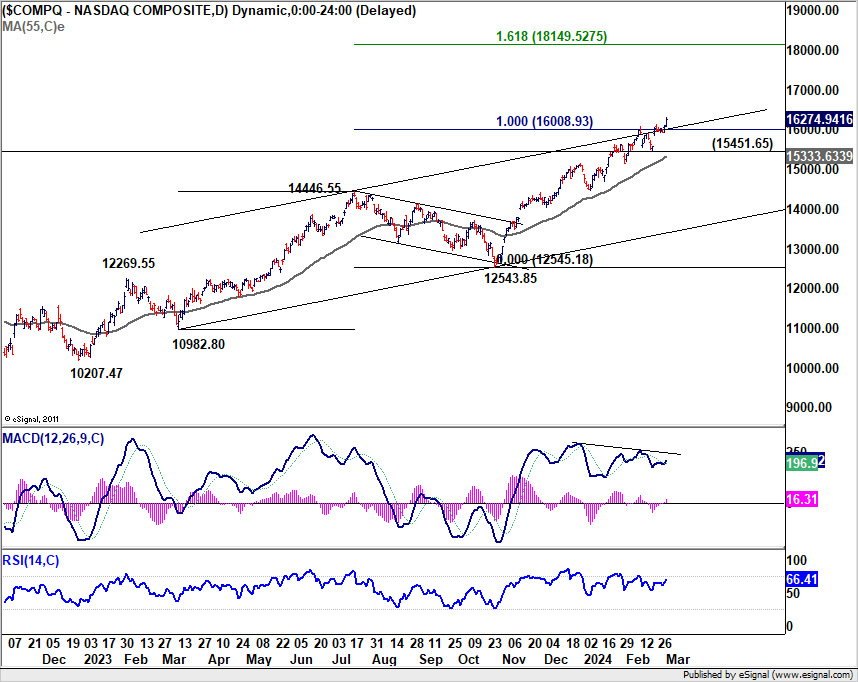
Amidst these economic undercurrents, NASDAQ managed to rally to new record highs, finally joining its counterparts, DOW and S&P 500, in achieving this milestone. The tech-heavy index has been particularly buoyed by the dual forces of anticipated monetary policy easing and a burgeoning enthusiasm for artificial intelligence technologies, notably propelled by Nvidia's strong uptrend.
Technically, the break of the medium term channel resistance as well as 100% projection of 10982.80 to 14446.55 from 12543.85 at 16008.93 suggests that NASDAQ is probably now in acceleration phase again. That's, though, subject to confirmation by D MACD breaking above the falling trend line. In any case, outlook will stay bullish as long as 15451.65 support holds. Next target is 161.8% projection at 18149.52.
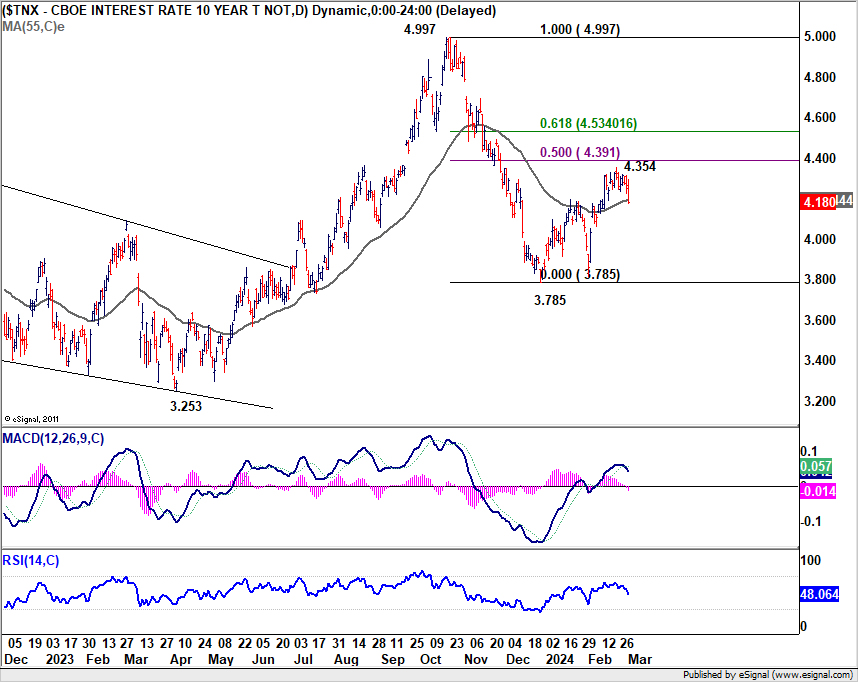
The bond market, too, has responded to these developments, with 10-year yield falling notable on Friday to close at 4.180, alongside 2-year yield, which saw its most significant daily decline since the end of January. For 10-year yield, the close below 55 D EMA (now at 4.189) is a near term bearish sign. Sustained trading below the EMA will argue that recovery from 3.785 has completed at 4.354, and bring deeper all back to 4.000 mark or below.
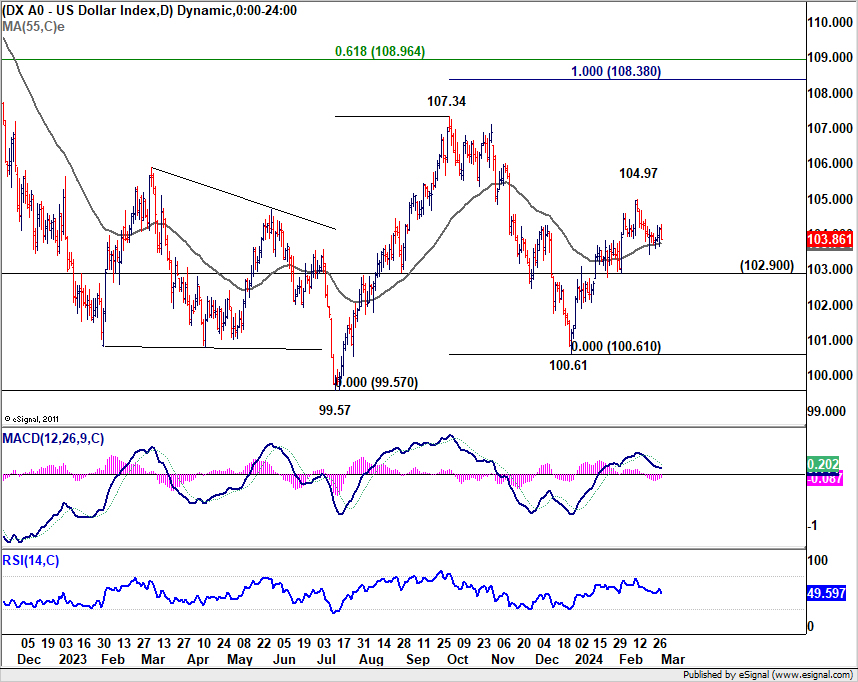
Dollar Index's recovery last week was rather weak and lacks conviction. Corrective retreat from 104.97 short term top is still in progress and could extend lower, probably until there is more evidence supporting Fed to delay rate cut to the second half of the year. Nevertheless, near term outlook will stay bullish as long as 102.90 support holds. Rise from 100.61, as the third leg of the pattern from 99.57, is still in favor to continue through 104.97 towards 107.34 resistance at a later stage.
BoJ's Rate Hike Debate Intensifies; Nikkei Hits Record
In Japan, the discourse surrounding BoJ's monetary policy has become increasingly animated, marked by diverging opinions among the central bank's top officials.
The conversation intensified following remarks from BoJ board member Hajime Takata, who posited that Japan is on the cusp of achieving sustainable 2% inflation. Takata advocated for a proactive and flexible approach to monetary policy adjustments, sparking immediate speculation among market observers that a rate hike could be on the horizon, as soon as March.
However, Governor Kazuo Ueda introduced a note of caution into the debate, suggesting that Japan has yet to reach the threshold of sustainable 2% inflation, thereby tempering expectations for an imminent policy shift.
Despite the divergent views on inflation and interest rate adjustments, both Takata and Ueda concurred on the positive developments emerging from this year's Spring wage negotiations. They hinted at the possibility that wage hikes in the current year might outpace those of the previous year, contributing to wage-price spiral.
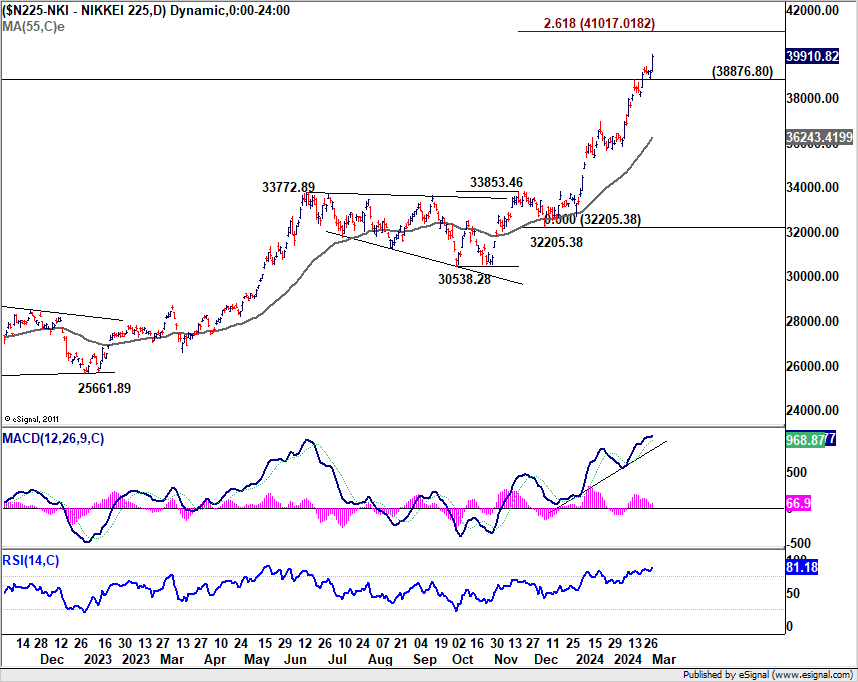
Amidst these monetary policy deliberations, Nikkei showcased remarkable resilience and bullish momentum, ascending to record-breaking close of 39,910.82, narrowly missing 40k mark. Near term outlook will stay bullish as long as 38876.80 support holds. Next target is 261.8% projection of 30538.28 to 33853.46 from 32205.38 at 41017.01. Break of 38876.80 will bring consolidations first, before rising again.
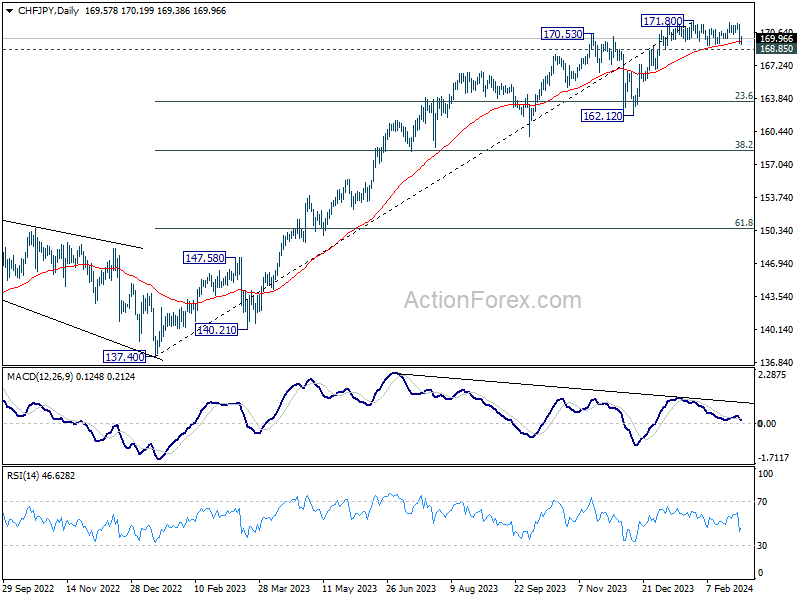
Despite the recent volatility stirred by rate hike speculations, a definitive bullish trend reversal in Yen remains unconfirmed, even against the relatively weak Swiss Franc. As long as 168.85 support holds in CHF/JPY, larger up trend could still resume through 171.80 resistance at a later stage. Nevertheless, considering bearish divergence condition in D MACD, firm break of 168.85 will argue that it's already in correction to the whole rise from 137.40. In this case, near term outlook will be turned bearish for 162.12 support.
Euro Leads Against Sterling and Franc Following Inflation Data
Euro was the strongest performer among European majors last week, supported by stronger than expected inflation data, despite the ongoing progress in disinflation. This development has led even the most dovish observers of ECB to concur that an interest rate cut in the upcoming Thursday meeting is off the table, with meaningful discussions on rate reductions also unlikely. For now, given the current hawk-dove balance within ECB, a rate cut in June appears more feasible than in April.
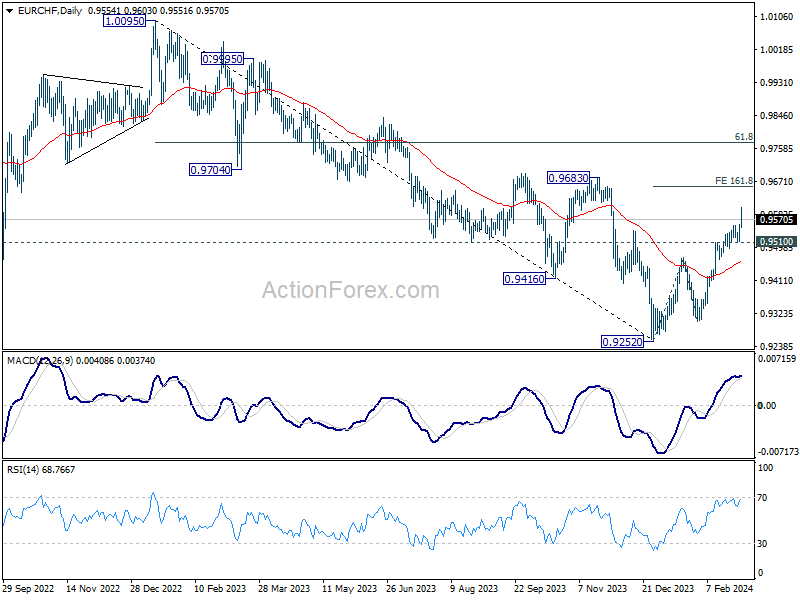
EUR/CHF's rally from 0.9252 continued last week and showed sign of reacceleration. Near term outlook will stay bullish as long as 0.9510 support holds. Next target is 161.8% projection of 0.9252 to 0.9471 from 0.9304 at 0.9658. For now, this rebound is still seen a corrective move and could be limited by 0.9683 resistance. However, decisive break of 0.9683 will argue that EUR/CHF is already in medium term bullish trend reversal.
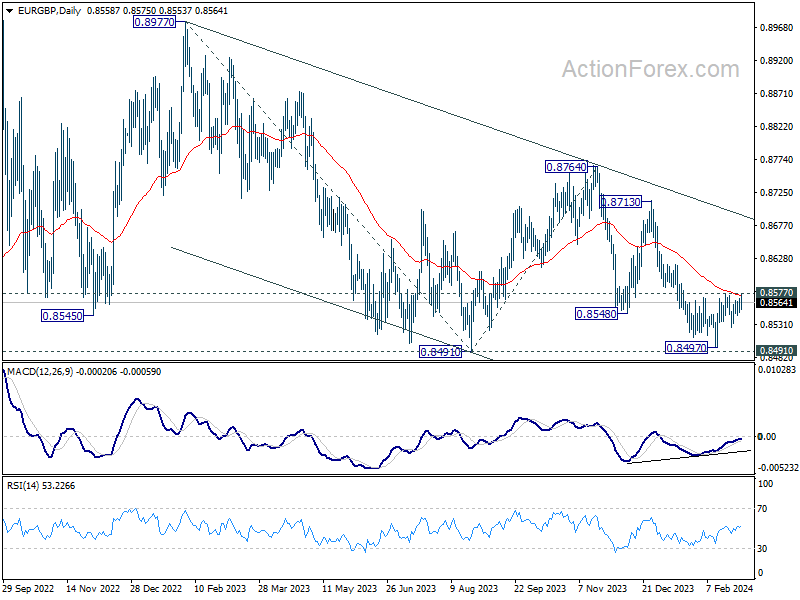
EUR/GBP recovered mildly last week but upside is capped below 0.8577 as well as 55 D EMA. Larger down trend is still in favor to resume through 0.8491/7 support zone at a later stage. However, considering bullish convergence condition in D MACD, sustained break of 55 D EMA will suggest that fall from 0.8764 has completed. Further rebound should then be seen, either as a correction to fall from 0.8764 or as the third leg of the pattern from 0.8491.
USD/JPY Weekly Outlook
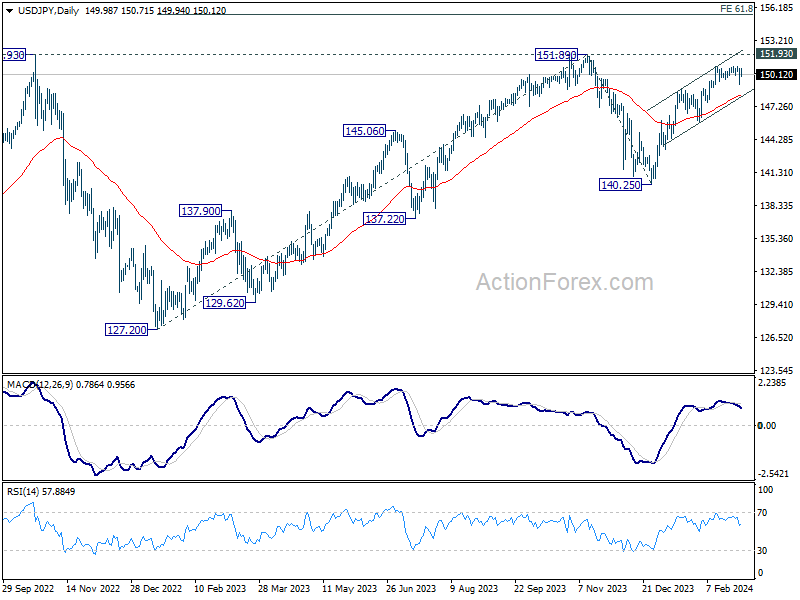
USD/JPY dipped to 149.20 last week but quickly recovered. Initial bias remains neutral this week first. On the upside, break of 150.87 will resume the rise from 140.25 to 151.89/93 key resistance zone. On the other hand, considering bearish divergence condition in 4H MACD, firm break of 149.20 will confirm short term topping at 150.87. Deeper fall would be seen to channel support (now at 148.33), even as a corrective move.
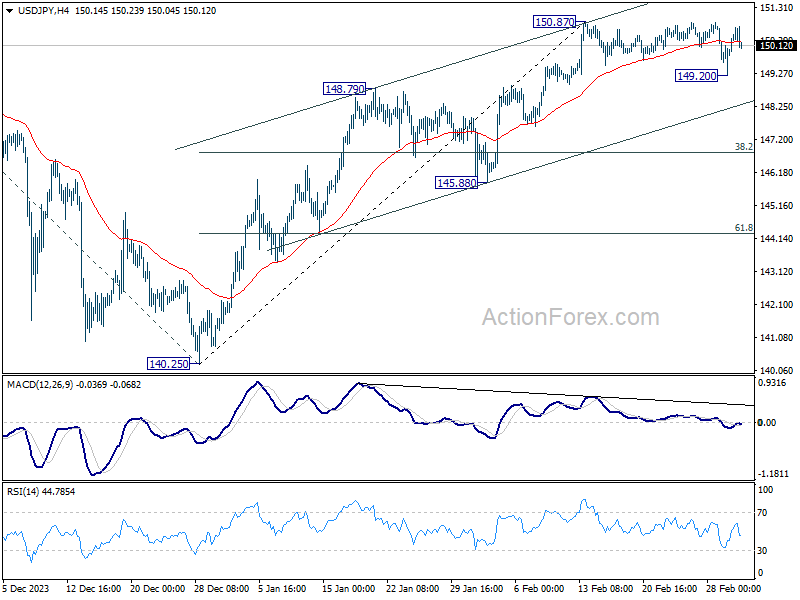
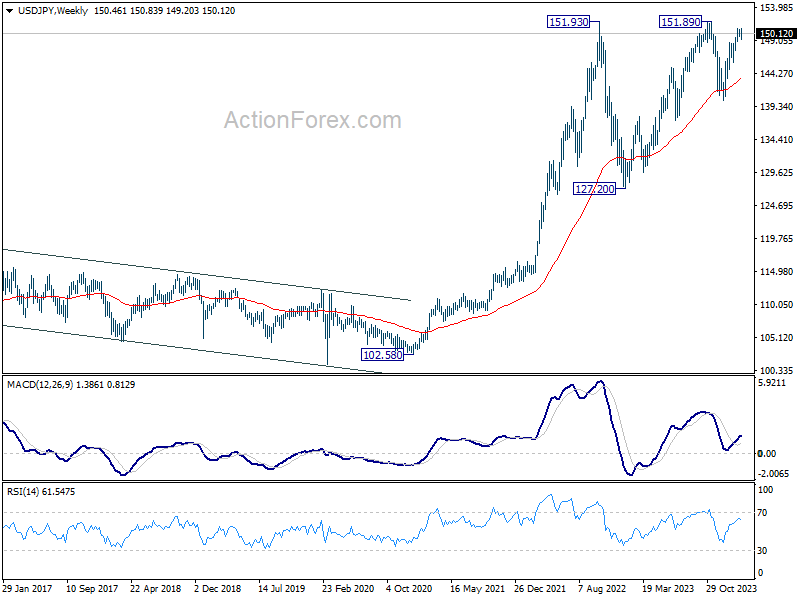
In the bigger picture, rise from 140.25 is seen as resuming the trend from 127.20 (2023 low). Decisive break of 151.89/.93 resistance zone will confirm this bullish case and target 61.8% projection of 127.20 to 151.89 from 140.25 at 155.50. However, break of 148.79 resistance turned support will delay this bullish case, and extend the corrective pattern from 151.89 with another falling leg.
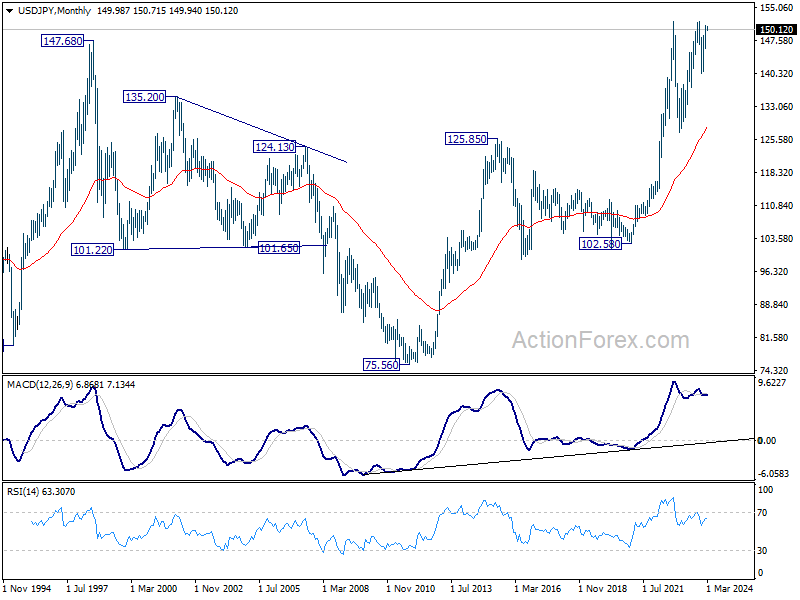
In the long term picture, as long as 125.85 resistance turned support holds (2015 high), up trend from 75.56 (2011 low) is still in favor to continue through 151.93 (2022 high) at a later stage.
EUR/USD Weekly Outlook
EUR/USD stayed in range trading below 1.0887 last week and outlook is unchanged. Initial bias stays neutral this week. On the upside, break of 1.0887 and sustained trading above 55 D EMA (now at 1.0831) will affirm the case that fall from 1.1138 has completed. Stronger rally would then be seen back to 1.1138. However, break of 1.0761 will turn bias back to the downside for retesting 1.0694 support.
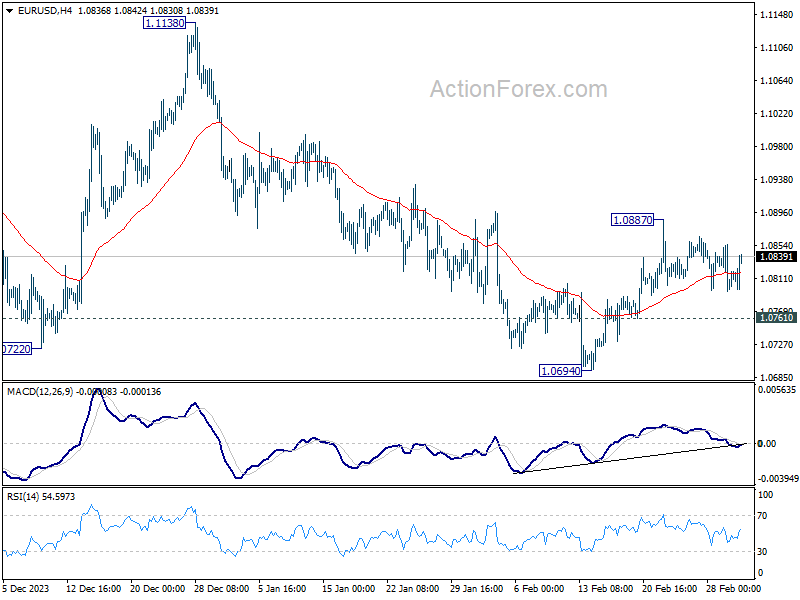
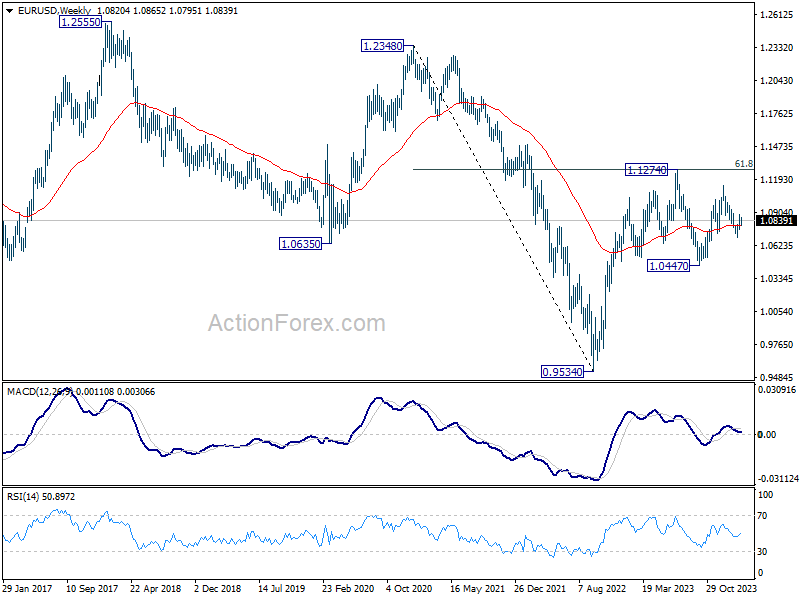
In the bigger picture, price actions from 1.1274 are viewed as a corrective pattern to rise from 0.9534 (2022 low). Rise from 1.0447 is seen as the second leg. While further rally could cannot be ruled out, upside should be limited by 1.1274 to bring the third leg of the pattern. Meanwhile, sustained break of 1.0694 support will argue that the third leg has already started for 1.0447 and possibly below.
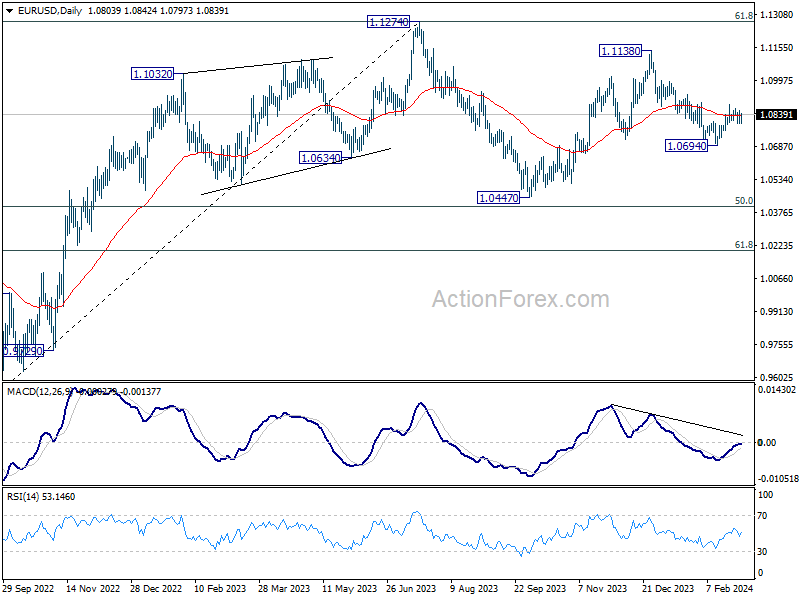
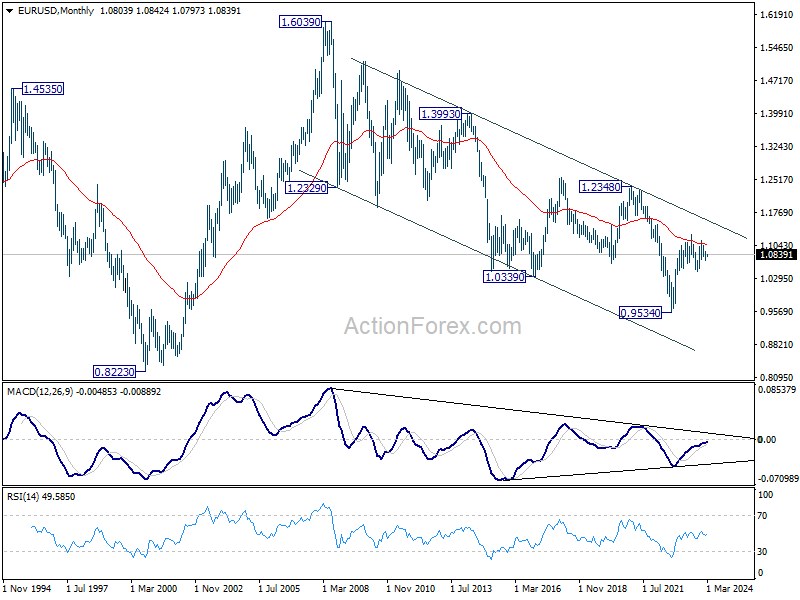
In the long term picture, a long term bottom is in place at 0.9534 on bullish convergence condition in M MACD. It's still early to call for bullish trend reversal with the pair staying inside falling channel in the monthly chart. Nevertheless, sustained trading above 55 M EMA (now at 1.1052) and break of 1.1274 resistance will raise the chance of reversal and target 1.2348 resistance for confirmation.