
Sample Category Title
AUD/USD Weekly Report
AUD/USD's decline argues that corrective recovery from 0.6442 has completed at 0.6594. But as a temporary low was formed at 0.6486, initial bias is neutral this week first. On the downside, below 0.6486 will target a retest on 0.6442 first. Firm break there will resume whole decline from 0.6870. However, on the upside, break of 0.6594 will resume the rebound from 0.6442 and turn bias back to the upside instead.
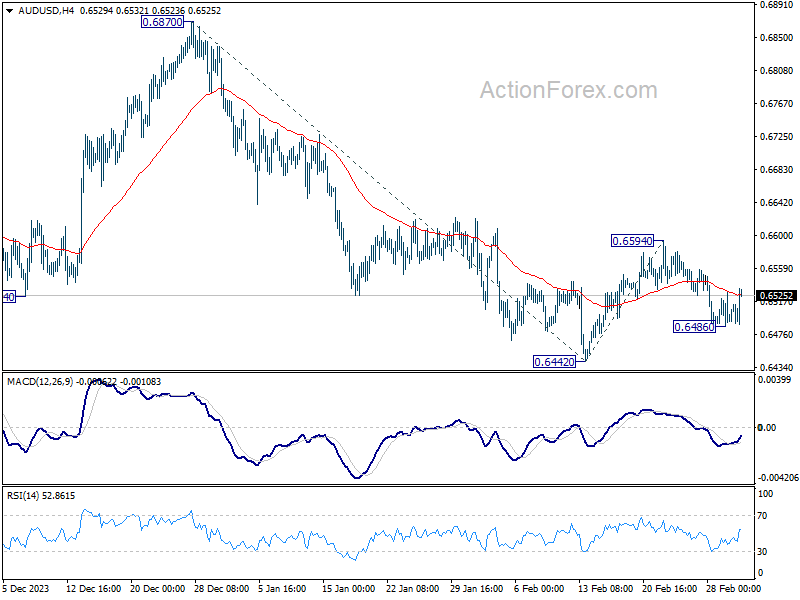
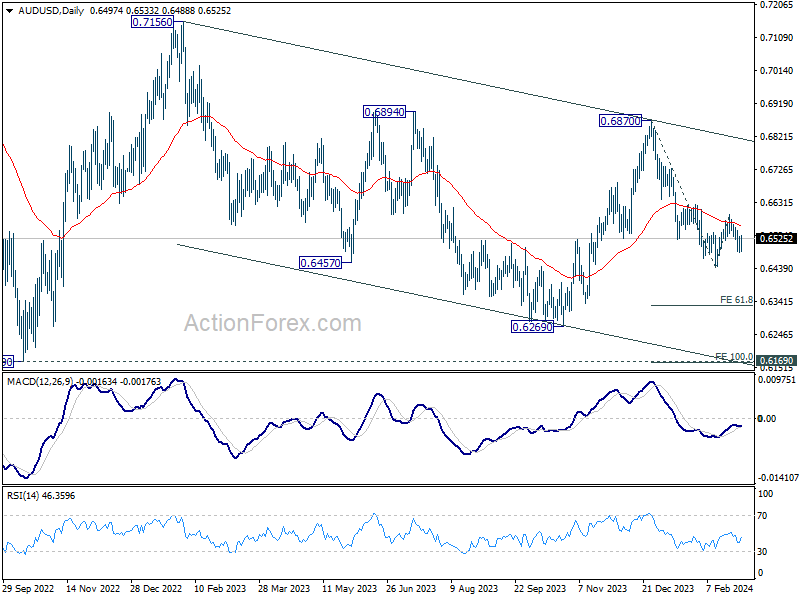
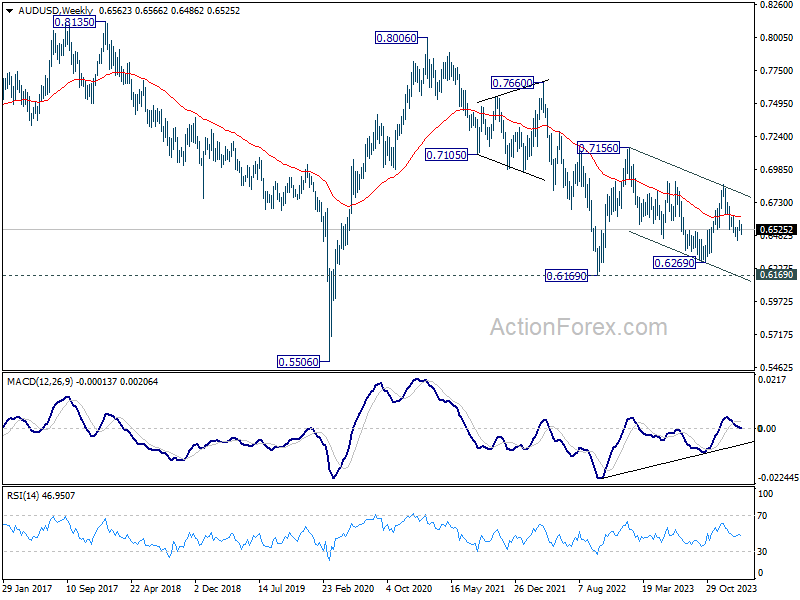
In the bigger picture, price actions from 0.6169 (2022 low) are seen as a medium term corrective pattern to the down trend from 0.8006 (2021 high). Fall from 0.7156 (2023 high) is seen as the second leg, which might still be in progress. Overall, sideway trading could continue in range of 0.6169/7156 for some more time. But as long as 0.7156 holds, an eventual downside breakout would be mildly in favor.
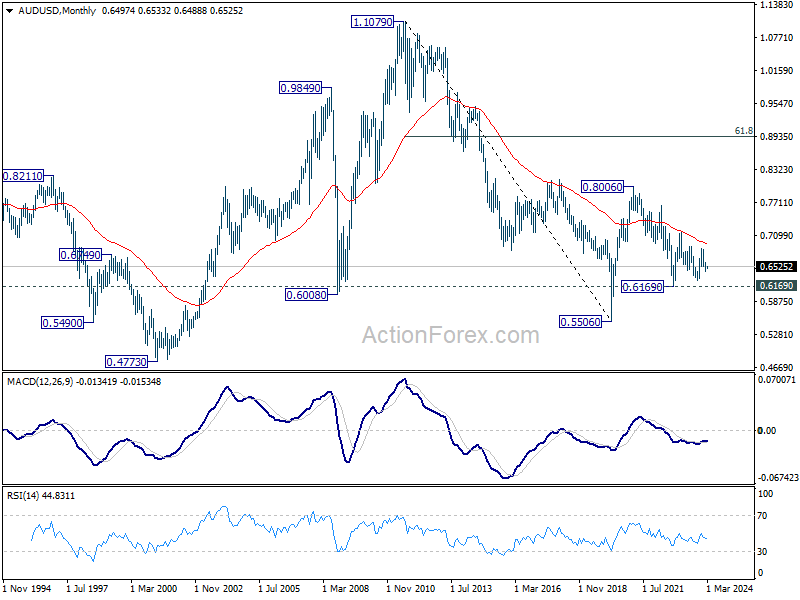
In the long term picture, the down trend from 1.1079 (2011 high) should have completed at 0.5506 (2020 low) already. It's unsure yet whether price actions from 0.5506 are developing into a corrective pattern, or trend reversal. But in either case, fall from 0.8006 is seen the second leg of the pattern. Hence, in case of deeper decline, strong support should emerge above 0.5506 to bring reversal.
USD/CAD Weekly Outlook
USD/CAD edged higher to 1.3605 last week but retreated again. Initial bias remains neutral this week for more consolidations. Further rally is expected as long as 1.3439 support holds. Break of 1.3605 will resume the rise from 1.3176 and target 100% projection of 1.3176 to 1.3540 from 1.3357 at 1.3721 next.
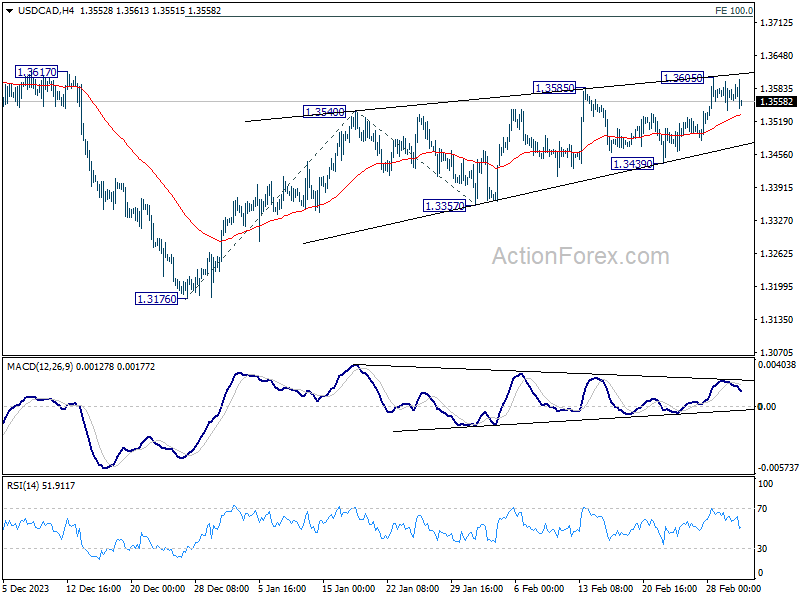
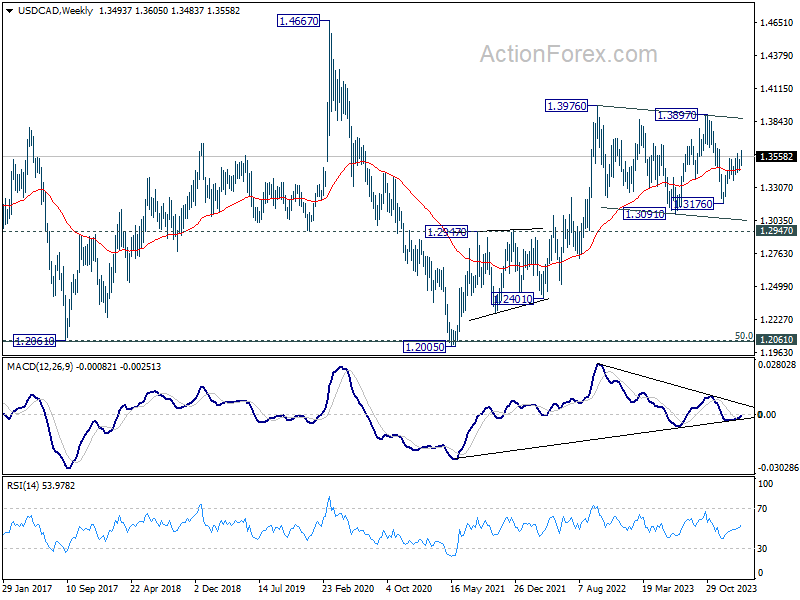
In the bigger picture, price actions from 1.3976 (2022 high) are viewed as a corrective pattern only. In case of another fall, strong support should emerge above 1.2947 resistance turned support to bring rebound. Overall, larger up trend from 1.2005 (2021 low) is still expected to resume through 1.3976 at a later stage.
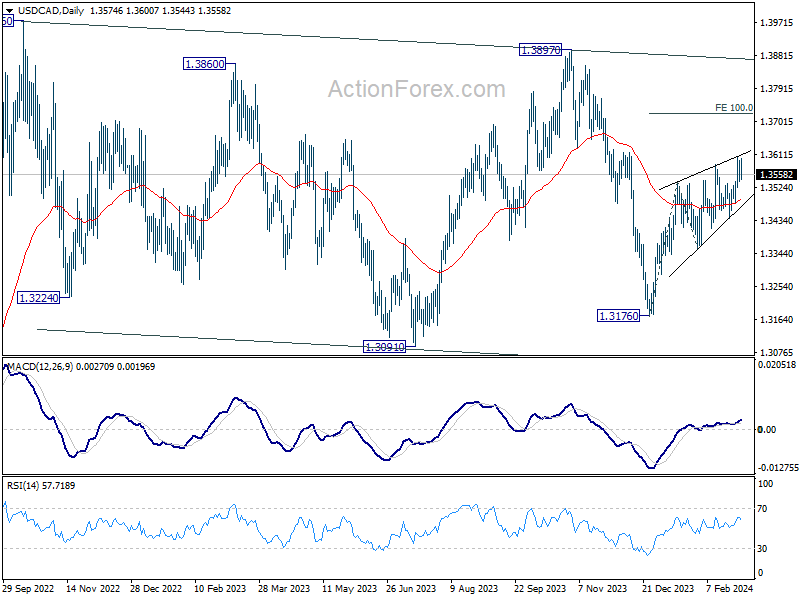
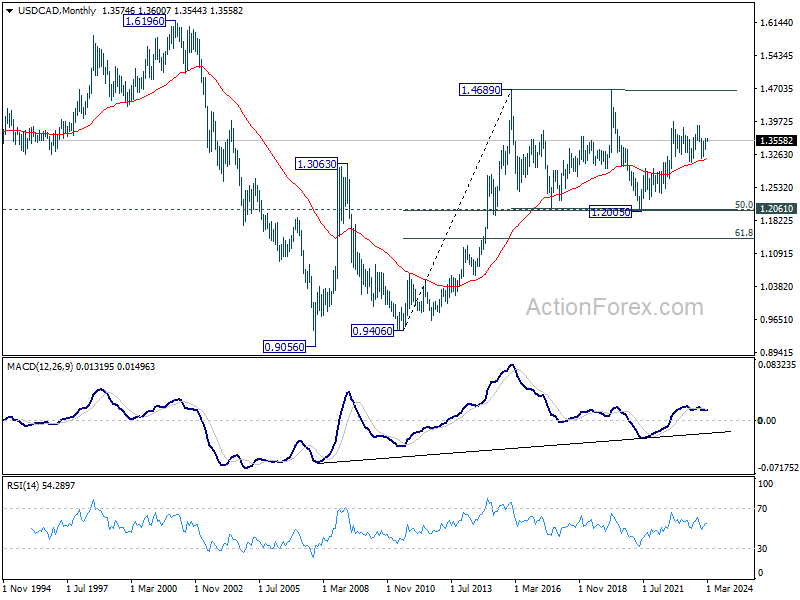
In the longer term picture, price actions from 1.4689 (2016 high) are seen as a consolidation pattern, which might have completed at 1.2005. That is, up trend from 0.9506 (2007 low) is expected to resume at a later stage. This will remain the favored case as long as 1.2947 resistance turned support holds.
GBP/JPY Weekly Outlook
GBP/JPY retreated to 189.02 last week but recovered since then. Initial bias is turned neutral this week first. Risk is mildly on the downside as long as 191.29 resistance holds. Firm break of 188.90 resistance turned support will bring deeper fall to 38.2% retracement of 178.32 to 191.29 at 186.33, as a correction to rise from 178.32. Nevertheless, decisive break of 191.29 will resume larger up trend.
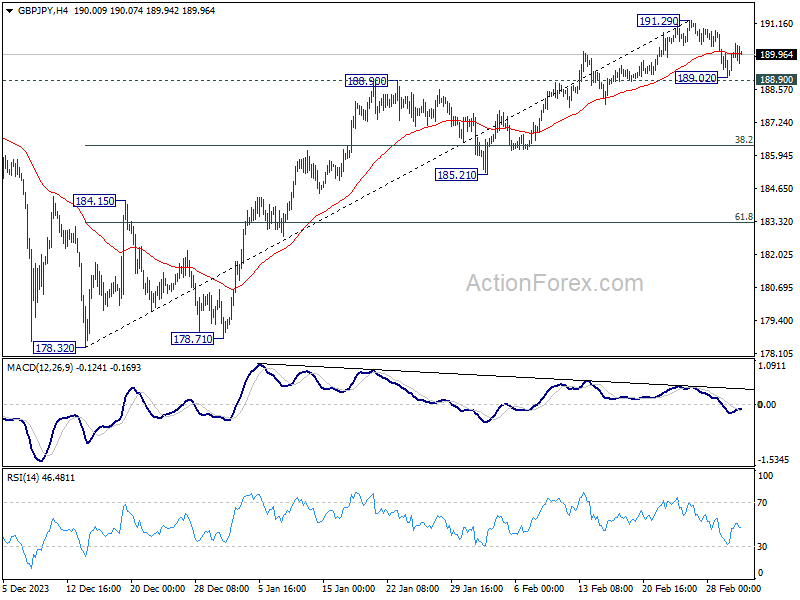
In the bigger picture, up trend from 123.94 (2020 low) is in progress. Medium term outlook will stay bullish as long as 178.32 support holds. Next target is 195.86 long term resistance (2015 high).
In the longer term picture, rise from 122.75 (2016 low) is seen as the third leg of the pattern from 116.83 (2011 low). Further rally will remain in favor as long as 172.11 resistance turned support holds. Break of 195.86 (2015 high) is possible. But strong resistance could be seen from 61.8% retracement of 251.09 (2007 high) to 116.83 at 199.80 to limit upside, at least on first attempt.
EUR/JPY Weekly Outlook
EUR/JPY dipped to 161.67 last week but recovered since then. Initial bias is turned neutral this week first. Another decline is mildly in favor as long as 163.70 resistance holds. Below 161.67 will target channel support (now at 161.11). However, firm break of 163.70 will resume the rally from 153.15 to retest 164.29 high.
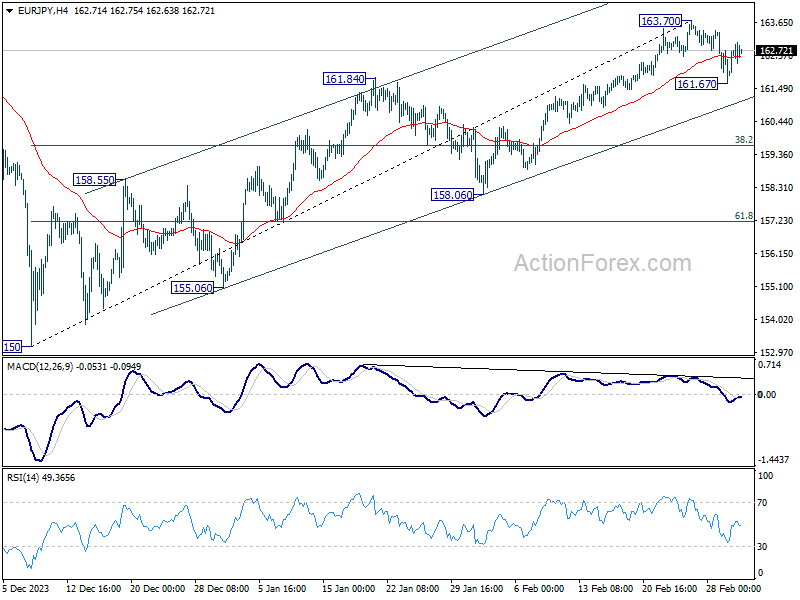
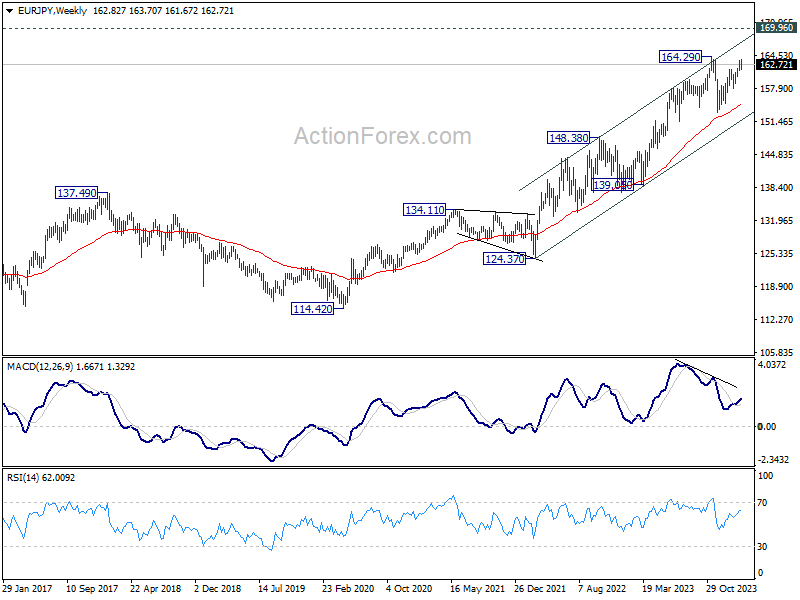
In the bigger picture, price actions from 164.29 medium term top are seen as a correction to rise from 139.05 only. As long as 148.38 resistance turned support holds (2022 high), larger up trend from 114.42 (2020 low) is expected to resume through 164.29 at a later stage. Next target would be 169.96 (2008 high).
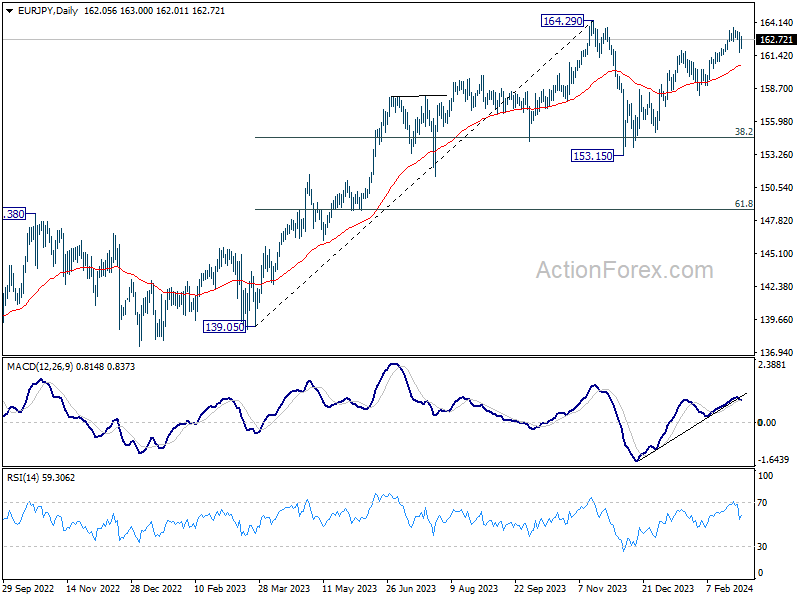
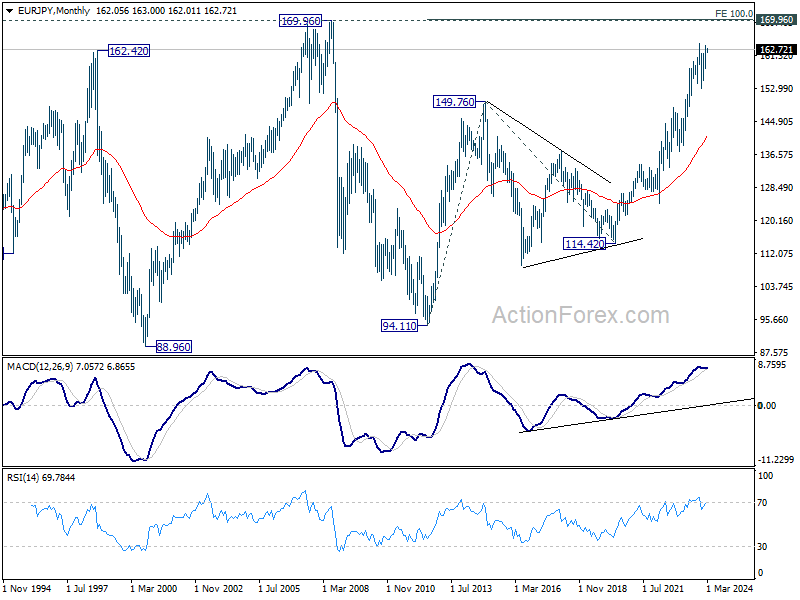
In the long term picture, rise from 114.42 (2020 low) is seen as the third leg of the whole up trend from 94.11 (2012 low). Next target is 100% projection of 94.11 to 149.76 from 114.42 at 170.07 which is close to 169.96 (2008 high). This will remain the favored case as long as 148.38 resistance turned support holds.
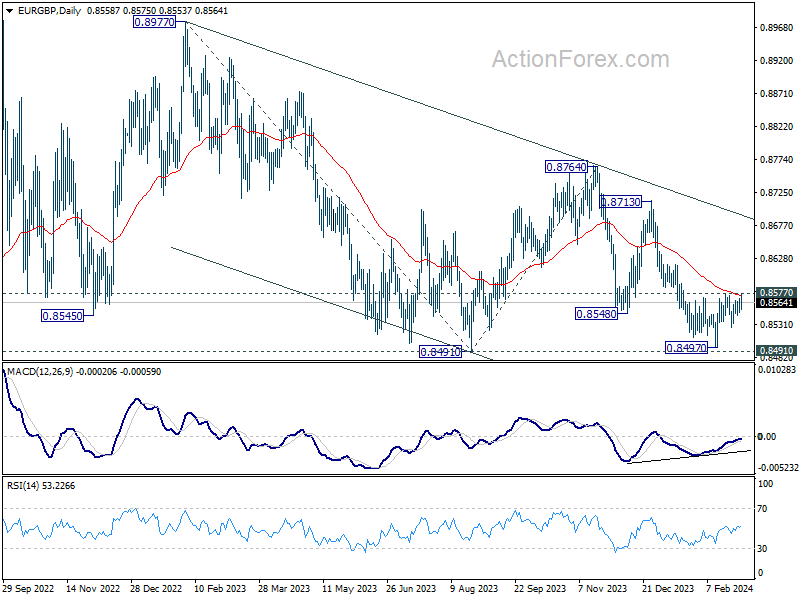
EUR/GBP Weekly Outlook
EUR/GBP recovered last week but failed to break through 0.8577 so far. Initial bias remains neutral this week first. Considering bullish convergence condition in D MACD, decisive break of 0.8577 and 55 D EMA (now at 0.8574) will argue that fall from 0.8764 has completed. Intraday bias will be back on the upside for rebound towards 0.8713 resistance. Nevertheless, firm break of 0.8491/7 support zone will confirm larger down trend resumption.
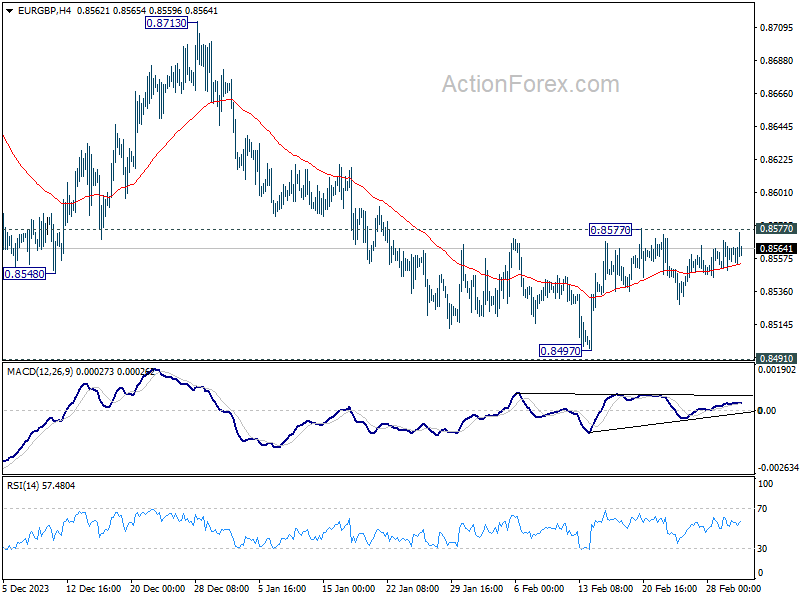
In the bigger picture, fall from 0.8764 is seen as another leg in the whole down trend from 0.9267 (2022 high). Outlook will stay bearish as long as 0.8713 resistance holds. Break of 0.8491 will target 61.8% projection of 0.8977 to 0.8491 from 0.8764 at 0.8464.
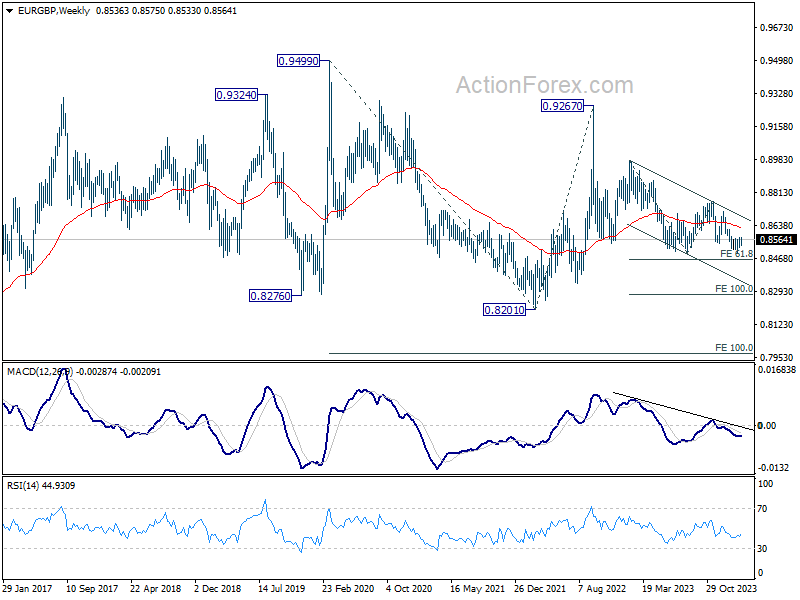
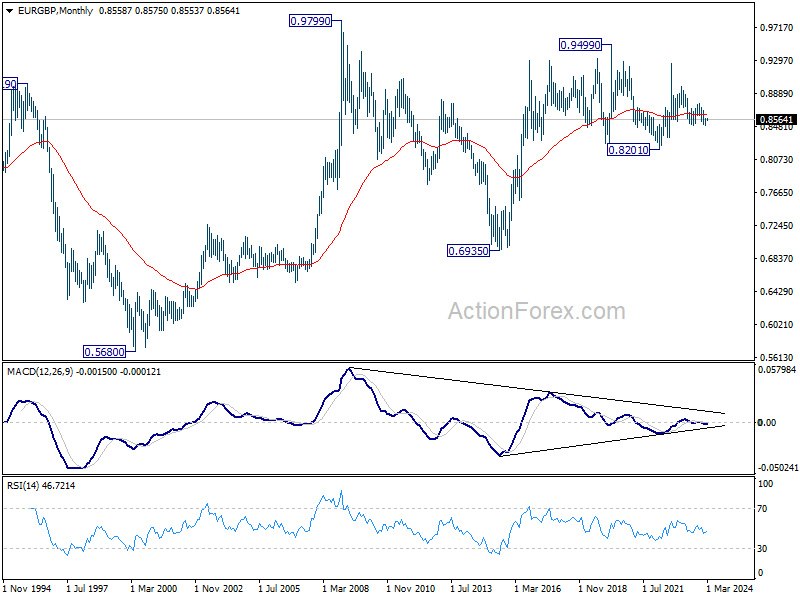
In the long term picture, price action from 0.9499 (2020 high) is seen as part of the long term range pattern from 0.9799 (2008 high). Fall from 0.9267 is the third leg of the pattern from 0.9499. Break of 0.8201 (2022 low) will target 100% projection of 0.9499 to 0.8201 from 0.9267 at 0.7969.
EUR/AUD Weekly Outlook
EUR/AUD's rebound from 1.6127 resumed last week and edged higher to 1.6692, but retreated since then. Initial bias stays neutral this week first. Current development suggests that whole correction from 1.7062 should have completed with three waves down to 1.6127. Further rally is expected as long as 1.6450 support holds. Above 1.6692 will target 61.8% projection of 1.6127 to 1.6671 from 1.6450 at 1.6786 next.
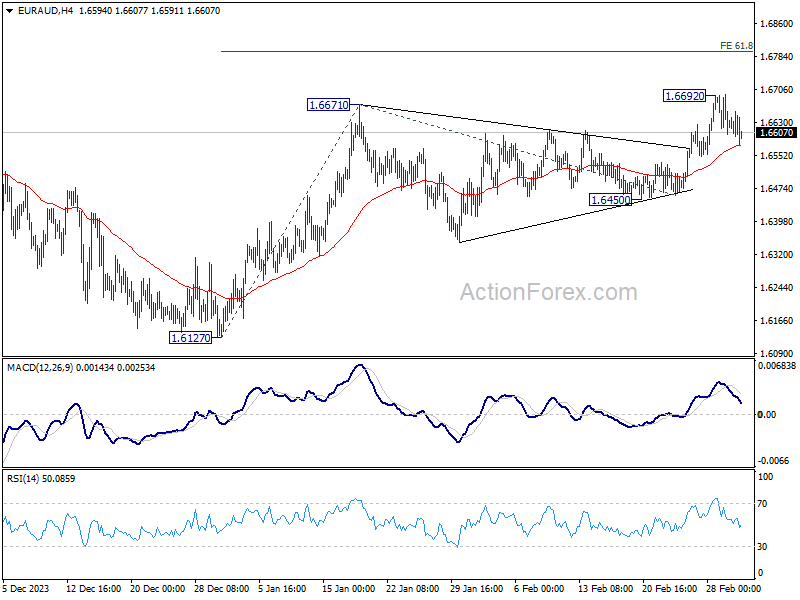
In the bigger picture, fall from 1.7062 medium term top is seen as a correction to the up trend from 1.4281 (2022 low). Break of 1.6844 resistance will argue that this up trend is ready to resume through 1.7062 high. In case of another fall, strong support should be seen around 1.5846 and 38.2% retracement of 1.4281 to 1.7062 at 1.6000 to bring rebound.
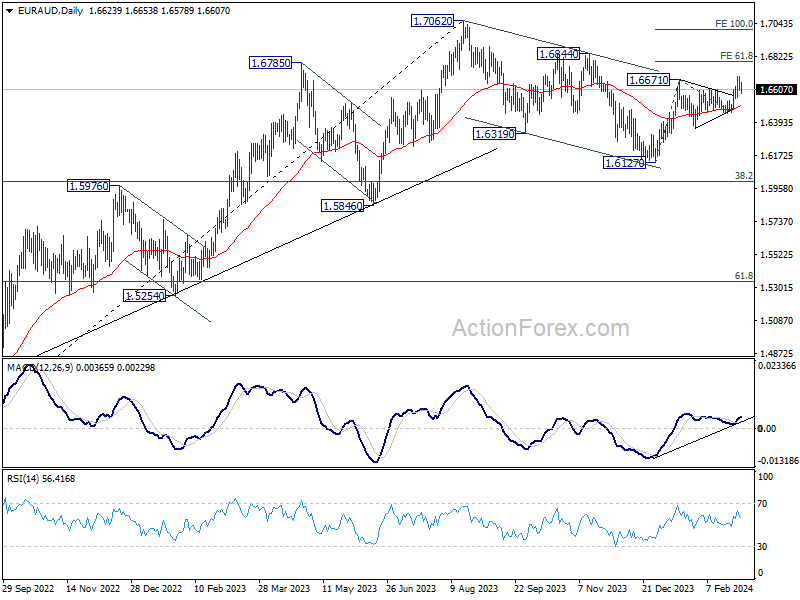
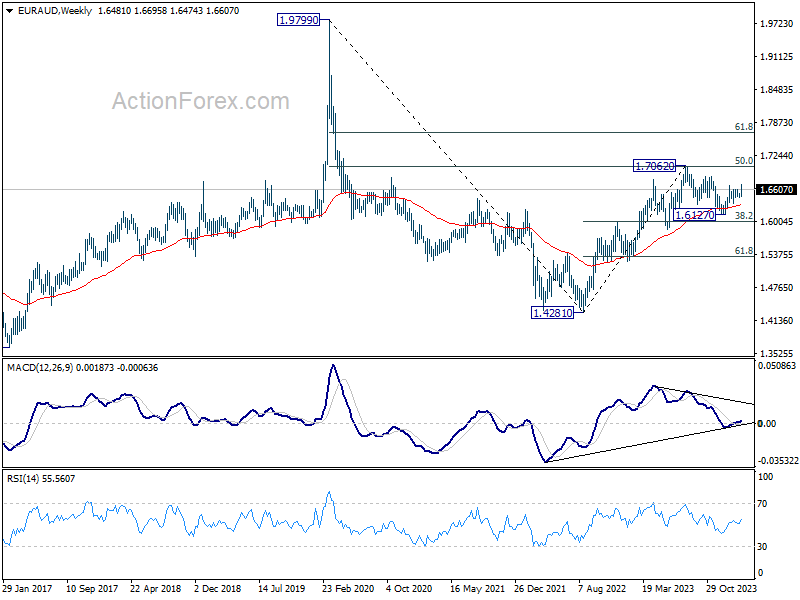
In the longer term picture, price actions from 1.9799 (2020 high) are seen as a long term decline at the same scale as the rise from 1.1602 (2012 low). Rebound from 1.4281 is seen as the second leg. As long as 55 M EMA (now at 1.5932) holds, this second leg could still extend higher. However, sustained trading below 55 M EMA will open up the bearish case for extending the decline through 1.4281 low.
EUR/CHF Weekly Outlook
EUR/CHF's rally from 0.9252 continued last week and hit as high as 0.9603. Initial bias stays on the upside this week for 161.8% projection of 0.9252 to 0.9471 from 0.9304 at 0.9658 next. For now, further rally is expected as long as 0.9510 support holds, in case of retreat.
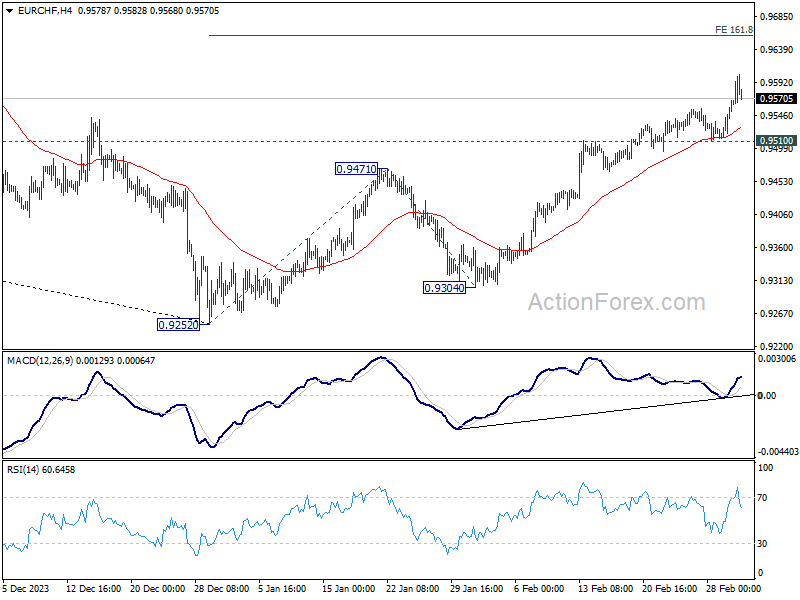
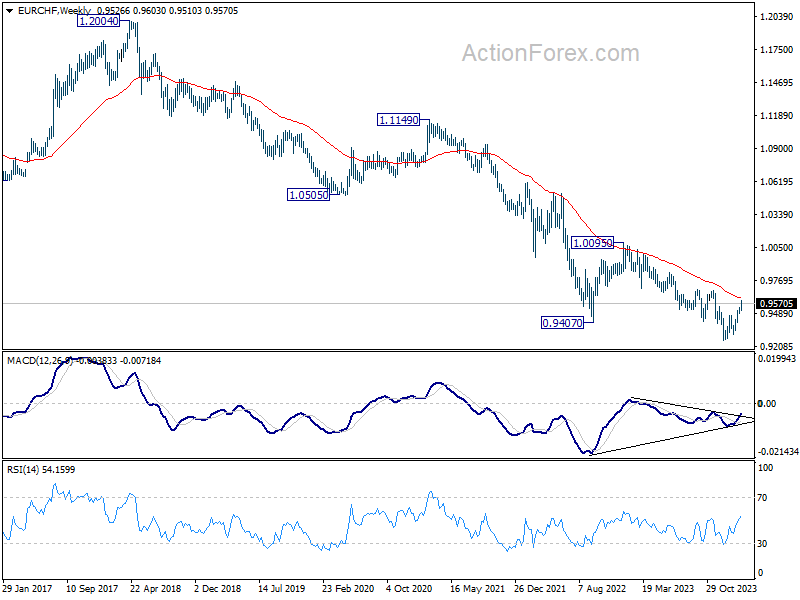
In the bigger picture, as long as 0.9683 resistance holds, rebound from 0.9252 are seen as a corrective move only. Larger down trend is expected to resume through 0.9252 after the correction completes. However, firm break of 0.9683 and sustained trading above 55 W EMA (now at 0.9622) will argue that 0.9252 is already a medium term bottom. Stronger rise would then be seen 61.9% retracement of 1.0095 to 0.9252 at 0.9773 and above.
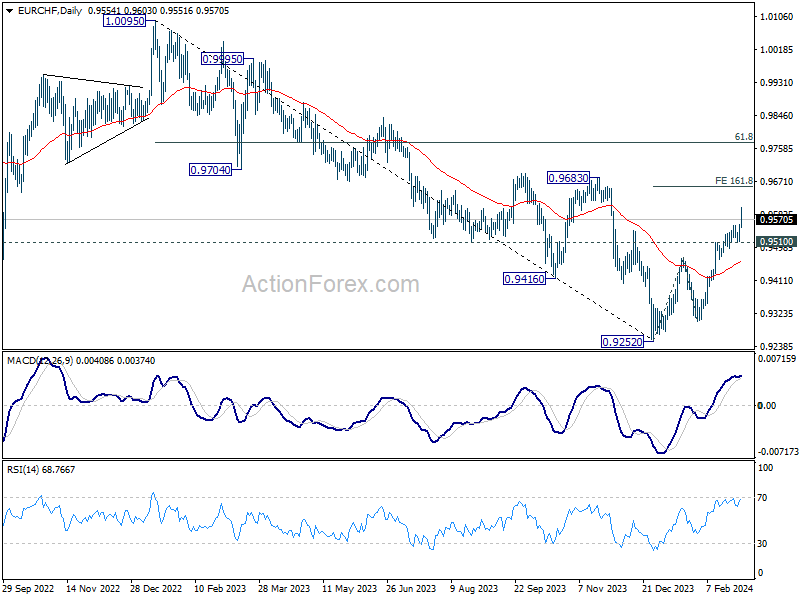
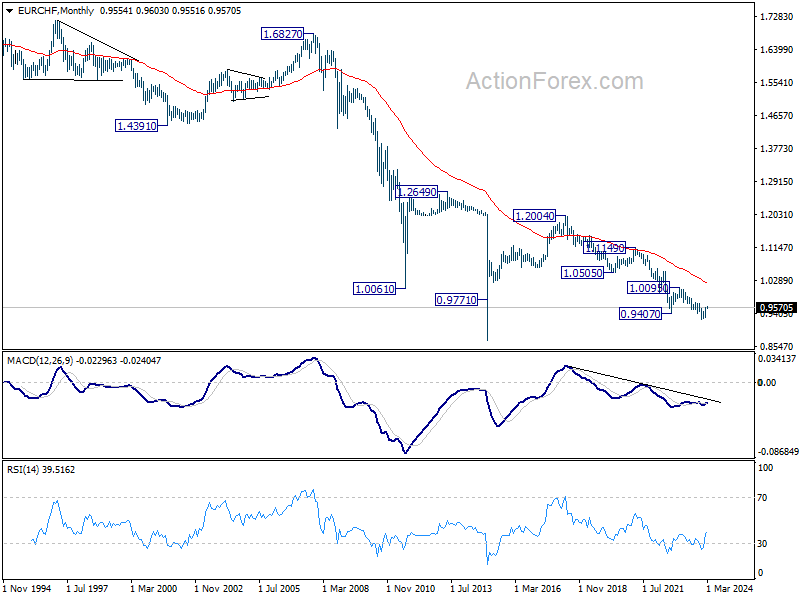
In the long term picture, fall from 1.2004 (2018 high) is part of the multi-decade down trend. Firm break of 1.0095 resistance is needed to be the first sign of long term bottoming. Otherwise, outlook will remain bearish.
Summary 3/4 – 3/8
Monday, Mar 4, 2024
| GMT | Ccy | Events | Consensus | Previous |
|---|---|---|---|---|
| 21:45 | NZD | Terms of Trade Index Q4 | -0.20% | -0.60% |
| 23:50 | JPY | Capital Spending Q4 | 2.90% | 3.40% |
| 23:50 | JPY | Monetary Base Y/Y Feb | 4.70% | 4.80% |
| 00:00 | AUD | TD Securities Inflation M/M Feb | 0.30% | |
| 00:30 | AUD | Building Permits M/M Jan | 4.00% | -9.50% |
| 07:30 | CHF | CPI M/M Feb | 0.50% | 0.20% |
| 07:30 | CHF | CPI Y/Y Feb | 1.10% | 1.30% |
| 09:30 | EUR | Eurozone Sentix Investor Confidence Mar | -10.8 | -12.9 |
| 23:30 | JPY | Tokyo CPI Y/Y Feb | 1.60% | |
| 23:30 | JPY | Tokyo CPI ex Fresh Food Y/Y Feb | 2.50% | 1.60% |
| 23:30 | JPY | Tokyo CPI ex Food & Energy Y/Y Feb | 3.10% |
| GMT | Ccy | Events | |
|---|---|---|---|
| 21:45 | NZD | Terms of Trade Index Q4 | |
| Forecast: -0.20% | Previous: -0.60% | ||
| 23:50 | JPY | Capital Spending Q4 | |
| Forecast: 2.90% | Previous: 3.40% | ||
| 23:50 | JPY | Monetary Base Y/Y Feb | |
| Forecast: 4.70% | Previous: 4.80% | ||
| 00:00 | AUD | TD Securities Inflation M/M Feb | |
| Forecast: | Previous: 0.30% | ||
| 00:30 | AUD | Building Permits M/M Jan | |
| Forecast: 4.00% | Previous: -9.50% | ||
| 07:30 | CHF | CPI M/M Feb | |
| Forecast: 0.50% | Previous: 0.20% | ||
| 07:30 | CHF | CPI Y/Y Feb | |
| Forecast: 1.10% | Previous: 1.30% | ||
| 09:30 | EUR | Eurozone Sentix Investor Confidence Mar | |
| Forecast: -10.8 | Previous: -12.9 | ||
| 23:30 | JPY | Tokyo CPI Y/Y Feb | |
| Forecast: | Previous: 1.60% | ||
| 23:30 | JPY | Tokyo CPI ex Fresh Food Y/Y Feb | |
| Forecast: 2.50% | Previous: 1.60% | ||
| 23:30 | JPY | Tokyo CPI ex Food & Energy Y/Y Feb | |
| Forecast: | Previous: 3.10% | ||
Tuesday, Mar 5, 2024
| GMT | Ccy | Events | Consensus | Previous |
|---|---|---|---|---|
| 00:01 | GBP | BRC Like-For-Like Retail Sales Y/Y Feb | 1.40% | |
| 00:30 | AUD | Current Account Balance (AUD) Q4 | 5.0B | -0.2B |
| 01:45 | CNY | Caixin Services PMI Feb | 52.9 | 52.7 |
| 07:45 | EUR | France Industrial Output M/M Jan | -0.10% | 1.10% |
| 08:45 | EUR | Italy Services PMI Feb | 52.3 | 51.2 |
| 08:50 | EUR | France Services PMI Feb F | 48 | 48 |
| 08:55 | EUR | Germany Services PMI Feb F | 48.2 | 48.2 |
| 09:00 | EUR | Eurozone Services PMI Feb F | 50 | 50 |
| 09:30 | GBP | Services PMI Feb F | 54.3 | 54.3 |
| 10:00 | EUR | Eurozone PPI M/M Jan | -0.10% | -0.80% |
| 10:00 | EUR | Eurozone PPI Y/Y Jan | -10.60% | |
| 14:45 | USD | Services PMI Feb F | 51.3 | 51.3 |
| 15:00 | USD | ISM Services PMI Feb | 0.30% | 53.4 |
| 15:00 | USD | Factory Orders M/M Jan | -2.80% | 0.20% |
| GMT | Ccy | Events | |
|---|---|---|---|
| 00:01 | GBP | BRC Like-For-Like Retail Sales Y/Y Feb | |
| Forecast: | Previous: 1.40% | ||
| 00:30 | AUD | Current Account Balance (AUD) Q4 | |
| Forecast: 5.0B | Previous: -0.2B | ||
| 01:45 | CNY | Caixin Services PMI Feb | |
| Forecast: 52.9 | Previous: 52.7 | ||
| 07:45 | EUR | France Industrial Output M/M Jan | |
| Forecast: -0.10% | Previous: 1.10% | ||
| 08:45 | EUR | Italy Services PMI Feb | |
| Forecast: 52.3 | Previous: 51.2 | ||
| 08:50 | EUR | France Services PMI Feb F | |
| Forecast: 48 | Previous: 48 | ||
| 08:55 | EUR | Germany Services PMI Feb F | |
| Forecast: 48.2 | Previous: 48.2 | ||
| 09:00 | EUR | Eurozone Services PMI Feb F | |
| Forecast: 50 | Previous: 50 | ||
| 09:30 | GBP | Services PMI Feb F | |
| Forecast: 54.3 | Previous: 54.3 | ||
| 10:00 | EUR | Eurozone PPI M/M Jan | |
| Forecast: -0.10% | Previous: -0.80% | ||
| 10:00 | EUR | Eurozone PPI Y/Y Jan | |
| Forecast: | Previous: -10.60% | ||
| 14:45 | USD | Services PMI Feb F | |
| Forecast: 51.3 | Previous: 51.3 | ||
| 15:00 | USD | ISM Services PMI Feb | |
| Forecast: 0.30% | Previous: 53.4 | ||
| 15:00 | USD | Factory Orders M/M Jan | |
| Forecast: -2.80% | Previous: 0.20% | ||
Wednesday, Mar 6, 2024
| GMT | Ccy | Events | Consensus | Previous |
|---|---|---|---|---|
| 00:30 | AUD | GDP Q/Q Q4 | 0.30% | 0.20% |
| 07:00 | EUR | Germany Trade Balance (EUR) Jan | 21.0B | 22.2B |
| 09:30 | GBP | Construction PMI Feb | 49.2 | 48.8 |
| 10:00 | EUR | Eurozone Retail Sales M/M Jan | 0.10% | -1.10% |
| 13:15 | USD | ADP Employment Change Feb | 150K | 107K |
| 13:30 | CAD | Labor Productivity Q/Q Q4 | -0.10% | -0.80% |
| 14:45 | CAD | BoC Interest Rate Decision | 5.00% | 5.00% |
| 15:00 | USD | Fed's Chair Powell testifies | ||
| 15:00 | USD | Wholesale Inventories Jan F | -0.10% | -0.10% |
| 15:00 | CAD | Ivey PMI Feb | 54.4 | |
| 15:30 | USD | Crude Oil Inventories | 4.2M | |
| 19:00 | USD | Fed's Beige Book | ||
| 21:45 | NZD | Manufacturing Sales Q4 | -2.70% |
| GMT | Ccy | Events | |
|---|---|---|---|
| 00:30 | AUD | GDP Q/Q Q4 | |
| Forecast: 0.30% | Previous: 0.20% | ||
| 07:00 | EUR | Germany Trade Balance (EUR) Jan | |
| Forecast: 21.0B | Previous: 22.2B | ||
| 09:30 | GBP | Construction PMI Feb | |
| Forecast: 49.2 | Previous: 48.8 | ||
| 10:00 | EUR | Eurozone Retail Sales M/M Jan | |
| Forecast: 0.10% | Previous: -1.10% | ||
| 13:15 | USD | ADP Employment Change Feb | |
| Forecast: 150K | Previous: 107K | ||
| 13:30 | CAD | Labor Productivity Q/Q Q4 | |
| Forecast: -0.10% | Previous: -0.80% | ||
| 14:45 | CAD | BoC Interest Rate Decision | |
| Forecast: 5.00% | Previous: 5.00% | ||
| 15:00 | USD | Fed's Chair Powell testifies | |
| Forecast: | Previous: | ||
| 15:00 | USD | Wholesale Inventories Jan F | |
| Forecast: -0.10% | Previous: -0.10% | ||
| 15:00 | CAD | Ivey PMI Feb | |
| Forecast: | Previous: 54.4 | ||
| 15:30 | USD | Crude Oil Inventories | |
| Forecast: | Previous: 4.2M | ||
| 19:00 | USD | Fed's Beige Book | |
| Forecast: | Previous: | ||
| 21:45 | NZD | Manufacturing Sales Q4 | |
| Forecast: | Previous: -2.70% | ||
Thursday, Mar 7, 2024
| GMT | Ccy | Events | Consensus | Previous |
|---|---|---|---|---|
| 00:30 | AUD | Trade Balance (AUD) Feb | 11.50B | 10.96B |
| 03:00 | CNY | Trade Balance (USD) Feb | 110.3B | 75.3B |
| 03:00 | CNY | Trade Balance (CNY) Feb | 620B | 541B |
| 06:45 | CHF | Unemployment Rate Feb | 2.20% | 2.20% |
| 07:00 | EUR | Germany Factory Orders M/M Jan | -6.00% | 8.90% |
| 08:00 | CHF | Foreign Currency Reserves (CHF) Feb | 662B | |
| 13:15 | EUR | ECB Main Refinancing Rate | 4.50% | 4.50% |
| 13:30 | CAD | Trade Balance (CAD) Jan | 0.3B | -0.3B |
| 13:30 | CAD | Building Permits M/M Jan | 2.10% | -14% |
| 13:30 | USD | Initial Jobless Claims (Mar 1) | 212K | 215K |
| 13:30 | USD | Trade Balance (USD) Jan | -63.2B | -62.2B |
| 13:30 | USD | Nonfarm Productivity Q4 | 3.20% | 3.20% |
| 13:30 | USD | Unit Labor Costs Q4 | 0.50% | 0.50% |
| 13:45 | EUR | ECB Press Conference | ||
| 15:00 | USD | Fed's Chair Powell testifies | ||
| 15:30 | USD | Natural Gas Storage | -96B | |
| 23:30 | JPY | Labor Cash Earnings Y/Y Jan | 1% | |
| 23:30 | JPY | Overall Household Spending Y/Y Jan | -4.30% | -2.50% |
| 23:50 | JPY | Bank Lending Y/Y Feb | 3.10% | |
| 23:50 | JPY | Current Account (JPY) Jan | 2.07T | 1.81T |
| GMT | Ccy | Events | |
|---|---|---|---|
| 00:30 | AUD | Trade Balance (AUD) Feb | |
| Forecast: 11.50B | Previous: 10.96B | ||
| 03:00 | CNY | Trade Balance (USD) Feb | |
| Forecast: 110.3B | Previous: 75.3B | ||
| 03:00 | CNY | Trade Balance (CNY) Feb | |
| Forecast: 620B | Previous: 541B | ||
| 06:45 | CHF | Unemployment Rate Feb | |
| Forecast: 2.20% | Previous: 2.20% | ||
| 07:00 | EUR | Germany Factory Orders M/M Jan | |
| Forecast: -6.00% | Previous: 8.90% | ||
| 08:00 | CHF | Foreign Currency Reserves (CHF) Feb | |
| Forecast: | Previous: 662B | ||
| 13:15 | EUR | ECB Main Refinancing Rate | |
| Forecast: 4.50% | Previous: 4.50% | ||
| 13:30 | CAD | Trade Balance (CAD) Jan | |
| Forecast: 0.3B | Previous: -0.3B | ||
| 13:30 | CAD | Building Permits M/M Jan | |
| Forecast: 2.10% | Previous: -14% | ||
| 13:30 | USD | Initial Jobless Claims (Mar 1) | |
| Forecast: 212K | Previous: 215K | ||
| 13:30 | USD | Trade Balance (USD) Jan | |
| Forecast: -63.2B | Previous: -62.2B | ||
| 13:30 | USD | Nonfarm Productivity Q4 | |
| Forecast: 3.20% | Previous: 3.20% | ||
| 13:30 | USD | Unit Labor Costs Q4 | |
| Forecast: 0.50% | Previous: 0.50% | ||
| 13:45 | EUR | ECB Press Conference | |
| Forecast: | Previous: | ||
| 15:00 | USD | Fed's Chair Powell testifies | |
| Forecast: | Previous: | ||
| 15:30 | USD | Natural Gas Storage | |
| Forecast: | Previous: -96B | ||
| 23:30 | JPY | Labor Cash Earnings Y/Y Jan | |
| Forecast: | Previous: 1% | ||
| 23:30 | JPY | Overall Household Spending Y/Y Jan | |
| Forecast: -4.30% | Previous: -2.50% | ||
| 23:50 | JPY | Bank Lending Y/Y Feb | |
| Forecast: | Previous: 3.10% | ||
| 23:50 | JPY | Current Account (JPY) Jan | |
| Forecast: 2.07T | Previous: 1.81T | ||
Friday, Mar 8, 2024
| GMT | Ccy | Events | Consensus | Previous |
|---|---|---|---|---|
| 05:00 | JPY | Leading Economic Index Jan P | 110.2 | |
| 05:00 | JPY | Eco Watchers Survey: Current Feb | 50.6 | 50.2 |
| 07:00 | EUR | Germany Industrial Production M/M Jan | 0.50% | -1.60% |
| 07:00 | EUR | Germany PPI M/M Jan | -0.10% | -1.20% |
| 07:00 | EUR | Germany PPI Y/Y Jan | -8.60% | |
| 07:45 | EUR | France Trade Balance (EUR) Jan | -6.5B | -6.8B |
| 10:00 | EUR | Eurozone GDP Q/Q Q4 | 0.00% | 0.00% |
| 13:30 | USD | Nonfarm Payrolls Feb | 200K | 353K |
| 13:30 | USD | Unemployment Rate Feb | 3.70% | 3.70% |
| 13:30 | USD | Average Hourly Earnings M/M Feb | 0.20% | 0.60% |
| 13:30 | CAD | Capacity Utilization Q4 | 79.90% | 79.70% |
| 13:30 | CAD | Net Change in Employment Feb | 20.0K | 37.3K |
| 13:30 | CAD | Unemployment Rate Feb | 5.80% | 5.70% |
| GMT | Ccy | Events | |
|---|---|---|---|
| 05:00 | JPY | Leading Economic Index Jan P | |
| Forecast: | Previous: 110.2 | ||
| 05:00 | JPY | Eco Watchers Survey: Current Feb | |
| Forecast: 50.6 | Previous: 50.2 | ||
| 07:00 | EUR | Germany Industrial Production M/M Jan | |
| Forecast: 0.50% | Previous: -1.60% | ||
| 07:00 | EUR | Germany PPI M/M Jan | |
| Forecast: -0.10% | Previous: -1.20% | ||
| 07:00 | EUR | Germany PPI Y/Y Jan | |
| Forecast: | Previous: -8.60% | ||
| 07:45 | EUR | France Trade Balance (EUR) Jan | |
| Forecast: -6.5B | Previous: -6.8B | ||
| 10:00 | EUR | Eurozone GDP Q/Q Q4 | |
| Forecast: 0.00% | Previous: 0.00% | ||
| 13:30 | USD | Nonfarm Payrolls Feb | |
| Forecast: 200K | Previous: 353K | ||
| 13:30 | USD | Unemployment Rate Feb | |
| Forecast: 3.70% | Previous: 3.70% | ||
| 13:30 | USD | Average Hourly Earnings M/M Feb | |
| Forecast: 0.20% | Previous: 0.60% | ||
| 13:30 | CAD | Capacity Utilization Q4 | |
| Forecast: 79.90% | Previous: 79.70% | ||
| 13:30 | CAD | Net Change in Employment Feb | |
| Forecast: 20.0K | Previous: 37.3K | ||
| 13:30 | CAD | Unemployment Rate Feb | |
| Forecast: 5.80% | Previous: 5.70% | ||
The Weekly Bottom Line: Coming Off the Boil?
U.S. Highlights
- January’s personal and income spending report landed just where it was expected to, with the only surprise coming from a bigger than expected lift from nominal personal income growth.
- The Fed’s preferred measure of inflation, core personal consumption expenditure prices, cooled to 2.8% year-on-year, with near-term trends suggesting it has room to fall.
- A weaker-than-expected ISM manufacturing report helped support the notion that demand is cooling.
Canadian Highlights
- If the Bank of Canada (BoC) needed another signal that its past rate hikes were working, it got it this week with the release of fourth quarter GDP.
- The economy returned to growth, but the pace remained in the doldrums for a country whose population grew by more than 3%.
- This below-trend pace of growth is exactly what the BoC wants to see for it to be convinced that inflation will continue to decelerate toward its 2% target.
U.S. – Coming Off the Boil?
January’s personal and income spending report landed just where it was expected to, with the only surprise coming from a bigger lift from nominal personal income growth. The as-expected print comes on the heels of updated GDP data that showed consumer spending closed out last year at an even better pace than originally thought. Most importantly, an upside inflation surprise was averted in January, allowing markets to let out a sigh of relief. After the data release Treasury yields tumbled and equities rallied. The data showed that price pressures continue to cool off. However, for a cautious Fed more progress will have to be made, leaving the first policy rate cuts a ways away.
First and foremost, this week’s personal income and spending report showed real personal consumption expenditures (PCE) pulled back 0.1% in January after healthy gains in November and December. Not a big surprise after January’s retail sales report showed a significant pullback. With some weather related factors weighing on demand it’s likely that this was more of a one-off than a new trend and February will likely show some bounce back.
Stronger-than- expected growth in personal income was largely a result of a larger cost of living adjustment in social security payments (and other government transfers), and the inflation adjusted real personal disposable income (PDI) measure showed no growth. Looking forward, this is what we’re interested in, as the downbeat month shaved two percentage points off of annual real PDI growth, bringing it down to 2.1% year-on-year. A deceleration in total real income growth is going to be part of the formula that cools the relentless consumer demand we’ve seen from the U.S. since the pandemic.
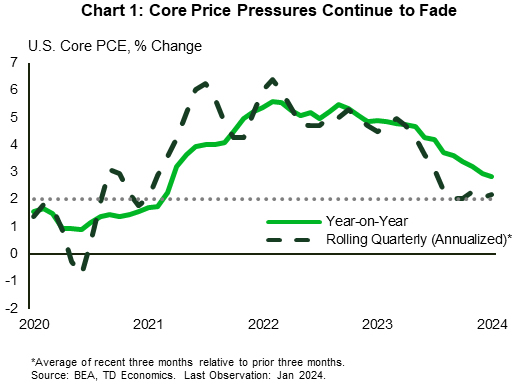
Of course, the Fed isn’t after just slowing the economy, but bringing demand and supply into better balance to tame inflation. On this front, yesterday’s report brought welcome news. The Fed’s preferred measure of inflation (core PCE) cooled to 2.8% year-on-year. Yes, still above the Fed’s target, but this is owing to base-effects from last year. Take a closer look at any near-term metrics and inflation is looking a lot closer to target. The three-month and six-month rates are at 2.6% and 2.5% (annualized), respectively. Smooth out some of the month-to-month noise in the series by taking a rolling quarterly rate of change, and core PCE prices have been advancing between 2% and 2.3% (annualized) since last September (Chart 1).
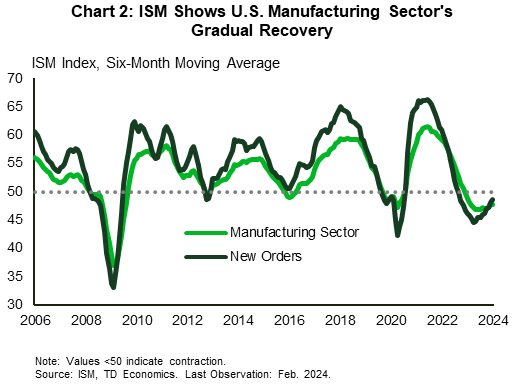
February’s ISM manufacturing report closed out the week, and supported the notion that demand is coming off a boil. With a 47.8 print for the month, the reading fell well short of market expectations and signaled that the recovery in the manufacturing sector is progressing rather slowly (Chart 2). Moreover, new manufacturing orders show that demand remains tepid.
For the Fed, these indicators come as signs that the relentless demand that powered the U.S. economy in late-2023 might be cooling off. Next Tuesday’s February ISM services report should shed light on the much larger services sector, while Fed Chair Jerome Powell’s testimony on Wednesday will hopefully give us a better sense of how the Fed is viewing these latest numbers.
Canada – Another Quarter of Weak Growth
If the Bank of Canada (BoC) needed another signal that its rate hikes were working, it got it this week. Fourth quarter GDP posted yet another quarter of sub-trend economic growth. That makes it three quarters in a row. Can it go for one more? Markets seem to think so, as firmer pricing around a June/July rate cut imply little hope for any forthcoming economic acceleration.
The details of the GDP report left little room for optimism. Yes, real GDP did increase by +1% quarter-on-quarter annualized (q/q) in the fourth quarter, after posting a negative print over the summer of 2023. And yes, this was above the BoC's expectation for no growth. But, the pace of growth is still not much to write home about, coming in well below the trend pace for an economy that saw its population grow by +3% during the quarter.
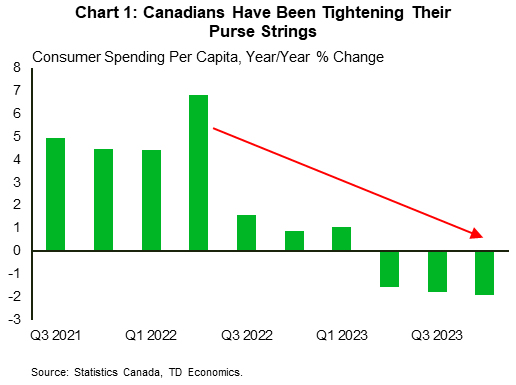
Consumer spending was tepid once again. If it wasn't for the slow loosening of automotive supply chains, which has delayed the delivery of past car purchases, consumer spending would have shown effectively no growth over the last six months. Even worse, spending per capita contracted for the fifth time in the past six quarters, keeping the annual pace of growth firmly in the doldrums (Chart 1).
The only real positive in the report came from exports, which were by far, the biggest contributor to economic growth in the fourth quarter. Canada has benefitted from its trade linkages with the U.S., which has grown three times faster than Canada over 2023. Strong American demand for Canadian exports has provided a nice offset to our domestic economic slowdown. This could have some staying power as well. Energy exports have been in demand, and with new pipelines coming online soon, this new capacity appears to be arriving at just the right time.
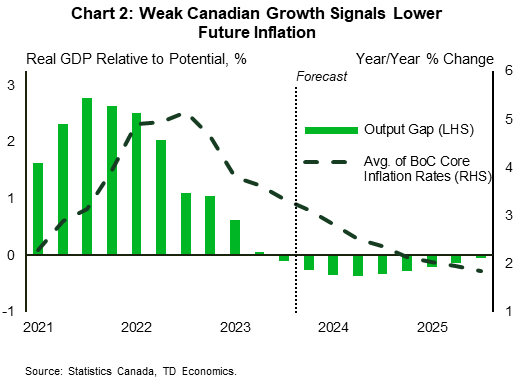
How does all this impact the BoC, which is set to make its next interest rate decision next week? The short answer is, not much. Outside of the one-off surge in spending in early 2023, Canadian economic growth has been abysmal ever since the BoC started raising rates in 2022. This period of below-trend growth is exactly what the BoC was hoping for. The central bank has been able to steer the economy from a state of excess demand – where consumer demand outpaced supply – to a state of greater balance. In economics jargon, the BoC has closed the output gap. Now, economic theory would tell you that when the output gap closes, and goes negative like it did six months ago, inflation will decelerate (Chart 2). From this lens, the wheels are in motion for inflation to move further towards the BoC's 2% target. It is just a matter of time.
Luckily for the BoC, it has been gifted a little more time before it needs to cut rates. The fact that the economy has eked out modest, but still positive gains, means that a soft landing is still the base-case scenario. This allows the BoC to sit back over the next couple of months and ensure that inflation continues to grind lower. We think it will, which will allow the BoC to make its first rate cut in June.
Weekly Economic & Financial Commentary: Economic Growth Continues Despite Downbeat Data
Summary
United States: Economic Growth Continues Despite Downbeat Data
- Economic data were downbeat this week, as downward revisions took some of the shine out of the marquee headline numbers. Durable goods orders declined, consumer confidence took a dip and the PCE deflator accelerated, bringing real personal spending into the red. Despite the somewhat weak start to Q1, economic growth continues to trek along.
- Next week: ISM Services (Tue.), Trade Balance (Thu.), Employment (Fri.)
International: Eurozone Inflation Stays Sticky
- Eurozone disinflation continued in February; however, CPI surprised to the upside last month, leaving markets questioning when the ECB will shift to rate cuts. Sticky inflation and elevated wage growth, in our view, is now likely to keep the ECB on the sidelines until the middle of 2024.
- Next week: Bank of Canada (Wed.), European Central Bank (Thu.), Mexico CPI (Thu.)
Credit Market Insights: Mostly Good in the Neighborhood
- Earlier this month, the Federal Reserve Bank of New York released its Quarterly Report on Household Debt and Credit encompassing the fourth quarter of 2023. The level of household debt outstanding sits $3.4 trillion above where it stood prior to the COVID-19 pandemic, or about 24% higher. Households have by and large been able to service their debt obligations even as the Fed’s tightening cycle has raised interest expenses on households.
Topic of the Week: “Super Core”: The Inflation Measure du Jour
- For much of this cycle, “super core” inflation was the talk of the town. Since its introduction, however, attention on the "super core" from Fed officials, analysts and market participants has seemed to dwindle. Why did “super core” ascend into the limelight and then fade from view? This week, we chronicle the rise and fall of interest in the "super core" and provide an update to its current run-rate.