Sample Category Title
Will GBPJPY Rebound Again?
- GBPJPY breaks below key support area after new high
- Technical signs weaken, but 20-day EMA comes to the rescue again
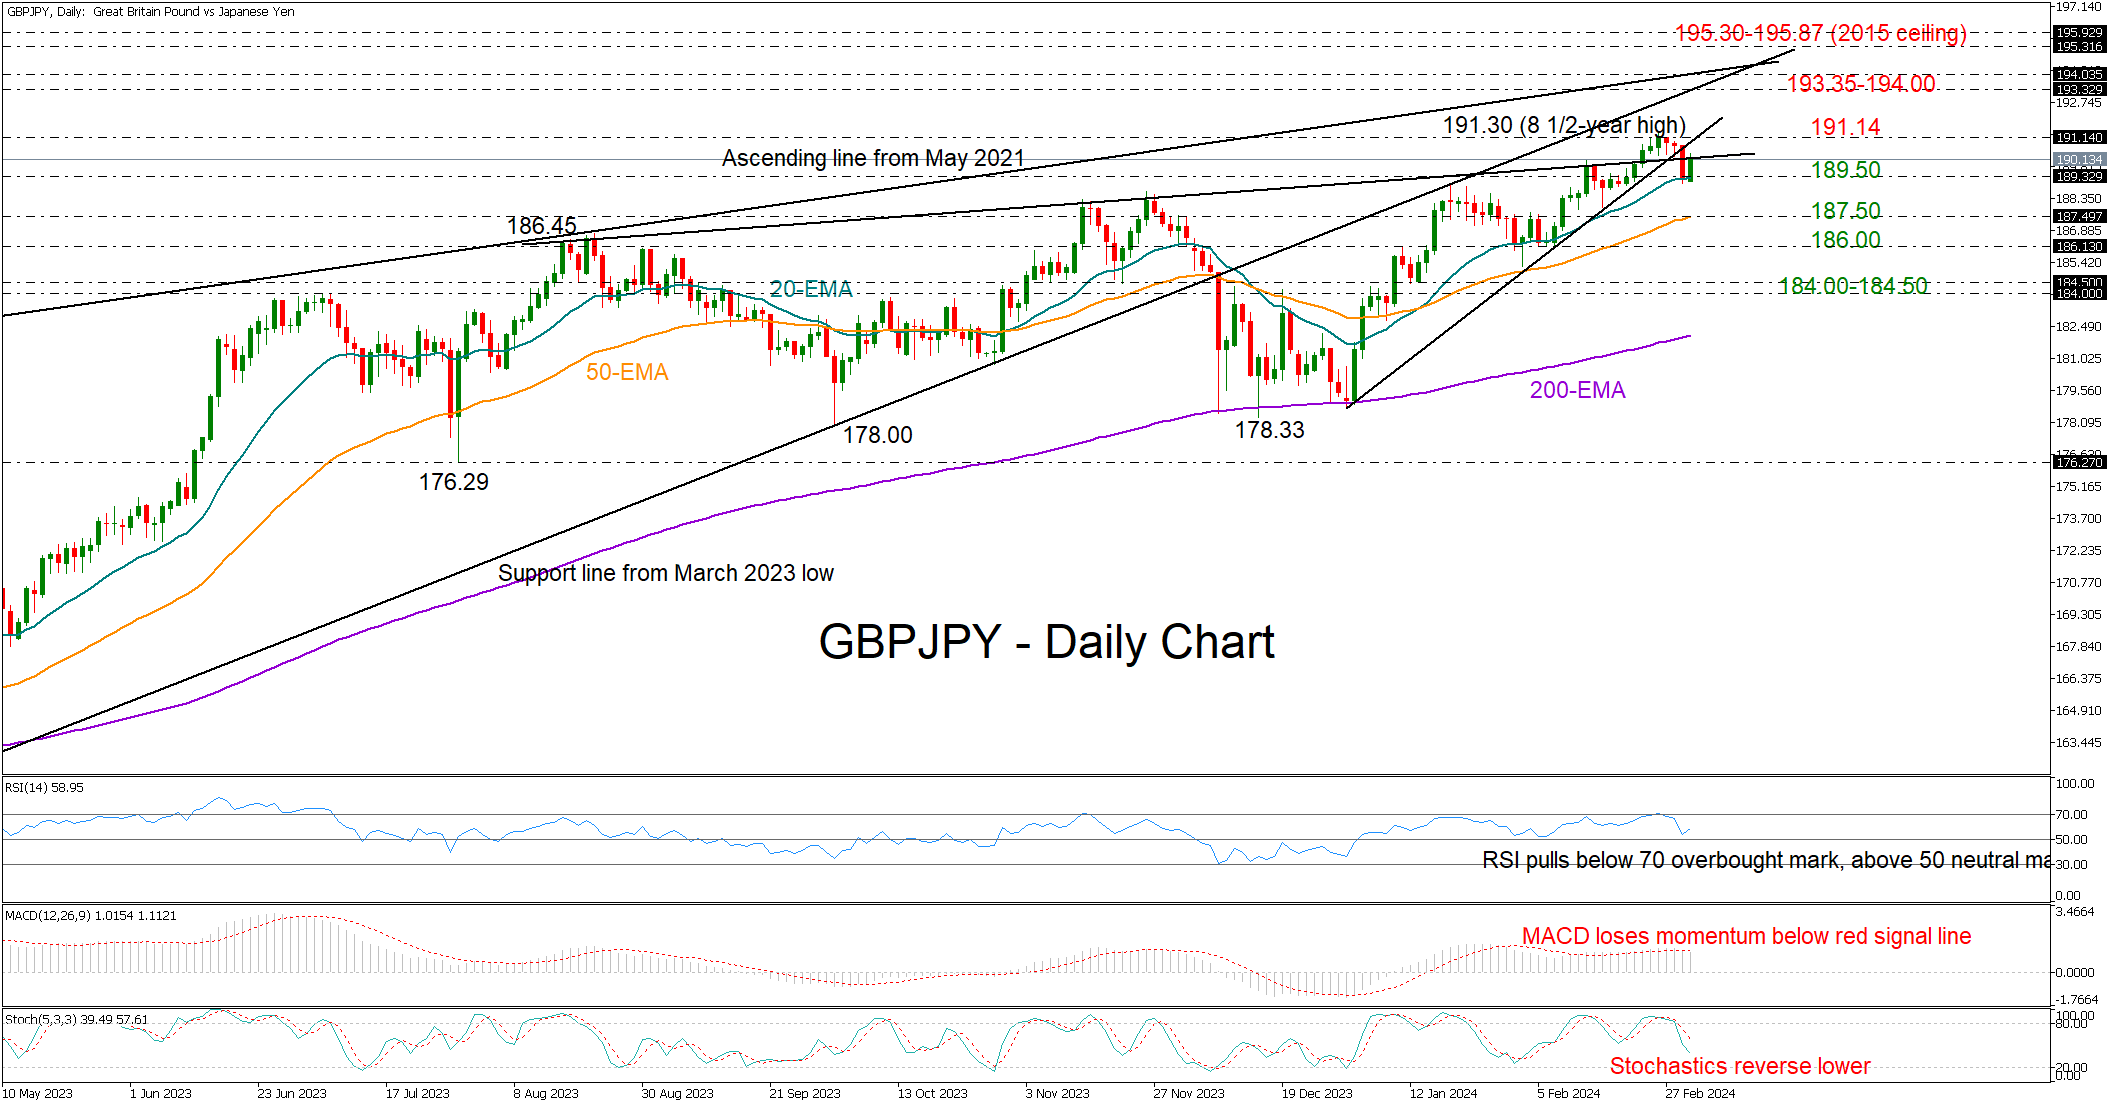
GBPJPY extended its pullback from an eight-and-a-half-year high of 191.30 for the third consecutive day on Thursday to find support around the 20-day exponential moving average (EMA) at 189.50. The line had protected the market at the end of January, though with the pair having crossed below a short-term ascending trendline, the odds for a continuation lower might be larger despite the current bullish action in the price.
The negative reversal in the momentum indicators is a sign that buying interest is fizzling out. A bounce back above the 190.20-191.14 is now required to improve sentiment and trigger an advance towards the 193.32-194.00 zone, where the broken support trendline from March 2023 and the resistance line from May 2021 are positioned. Breaking above that wall, the uptrend could stretch towards the 2015 ceiling of 195.30-195.87.
Otherwise, a step below the 20-day EMA at 189.50 could squeeze the price towards the 50-day EMA at 187.50. Additional losses from there could initially retest the 186.00 base and then the 184.00-184.50 region.
All in all, GBPJPY could experience more downside movements, unless the current recovery mode in the market drives the price successfully back above the 191.14 level.
Japanese Yen Jumpy After BoJ Member Urges Tighter Policy
- Japanese yen falls below 150
- BoJ’s Tanaka urges changes to monetary policy
- US PCE price index falls to 2.4%
BoJ’s Tanaka hints at tighter monetary policy
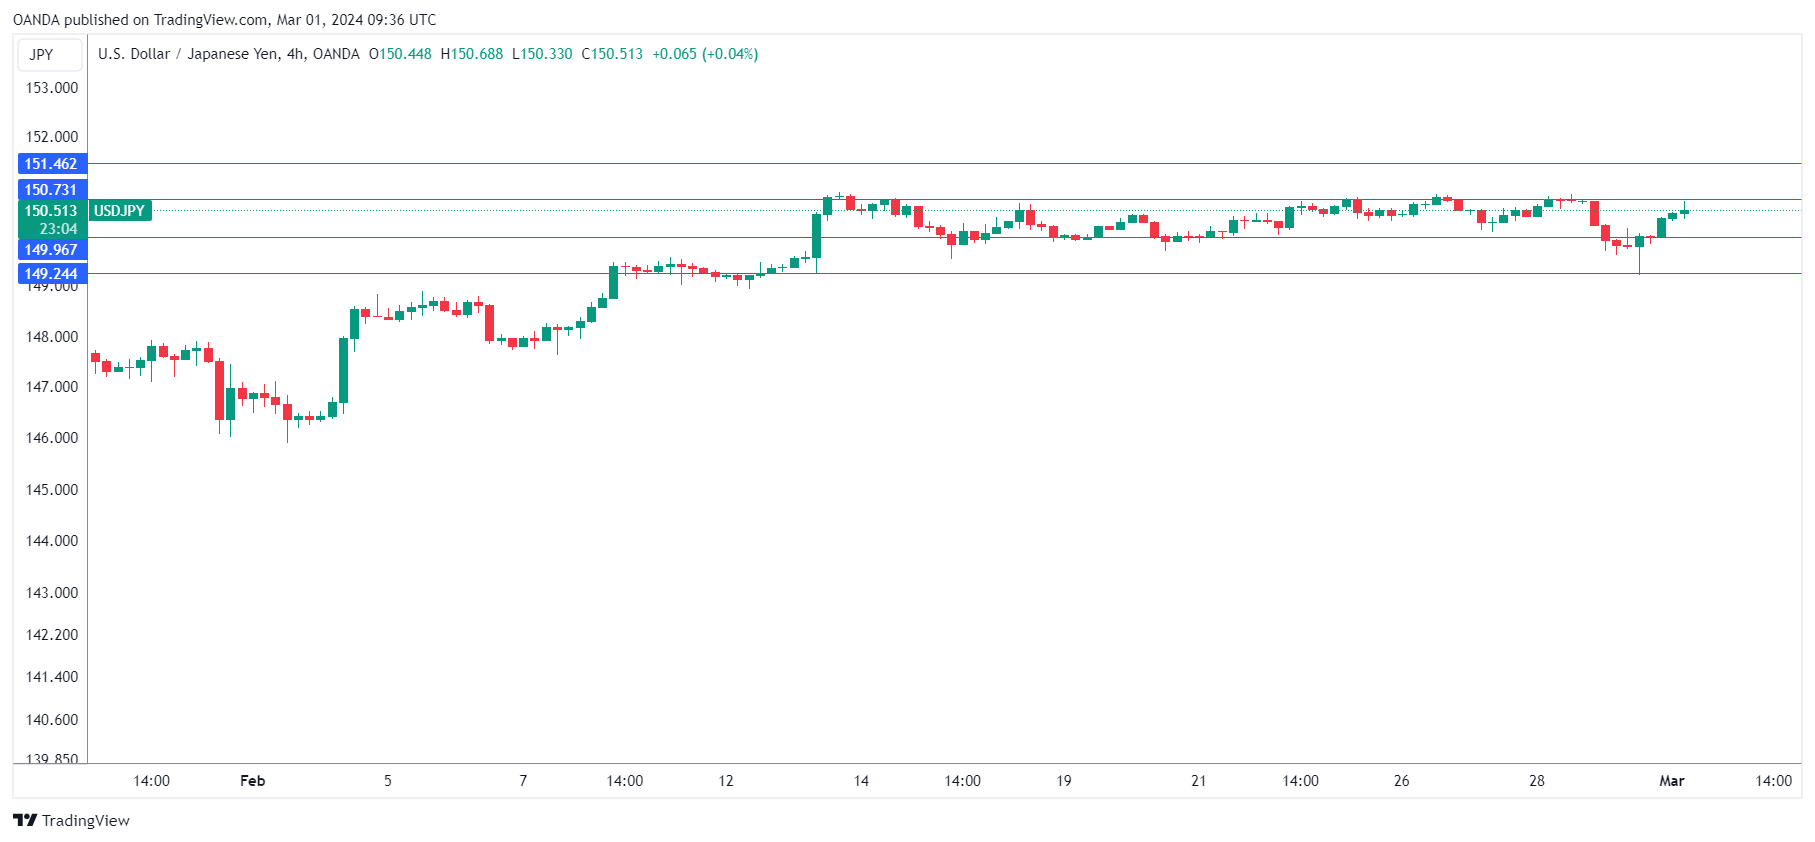
After close to two weeks of little movement, the Japanese yen is showing some volatility. The yen climbed as much as 1% on Thursday before paring much of those gains. USD/JPY has reversed directions on Friday and is trading in Europe at 150.59, up 0.40%.
The yen’s strong movement has come in the aftermath of comments from Bank of Japan board member Hajime Takata on Thursday. Takata said that the BoJ must overhaul is ultra-loose monetary policy, including an end to negative rates and removing bond yield control. Takata added that the BoJ was “seeing prospects of achieving our 2% inflation target”.
Takata’s hawkish comments are the latest sign that the central bank is close to unwinding its ultra-loose policy which could have a massive impact on the currency markets. The BoJ hasn’t provided any timelines for a change in policy, but the markets expect the Bank to lift rates out of negative territory at the April meeting.
Let’s not forget that when the yen trades around the 150 level, there are rumblings out of Tokyo that it may have to intervene to prop up the yen. Sure enough, Japan’s top currency diplomat, Masato Kanda, said on Thursday that policy makers were concerned with recent currency moves and stood “ready to ready to respond appropriately if we see excessively volatile moves.”
In the US, the Federal Reserve’s preferred inflation indicator, the Personal Consumption Expenditures Price index, slowed to 2.4% in January, matching the market estimate. This was down from 2.6% in December and the lowest rate since February 2021, further evidence that inflation continues to fall. Monthly, the PCE price index rose 0.3%, up from a revised 0.1% in December and matching the market estimate. The upswing was a result of higher services prices.
USD/JPY Technical
- USD/JPY is putting pressure on resistance at 150.74. Above, there is resistance at 151.47
- There is support at 149.97 and 149.24
AUDUSD Retreats After Rejection at 200-day SMA
- AUDUSD was recovering from its lowest level since November
- But is on the retreat again as 200-day SMA repels advance
- Momentum indicators are tilted to the downside
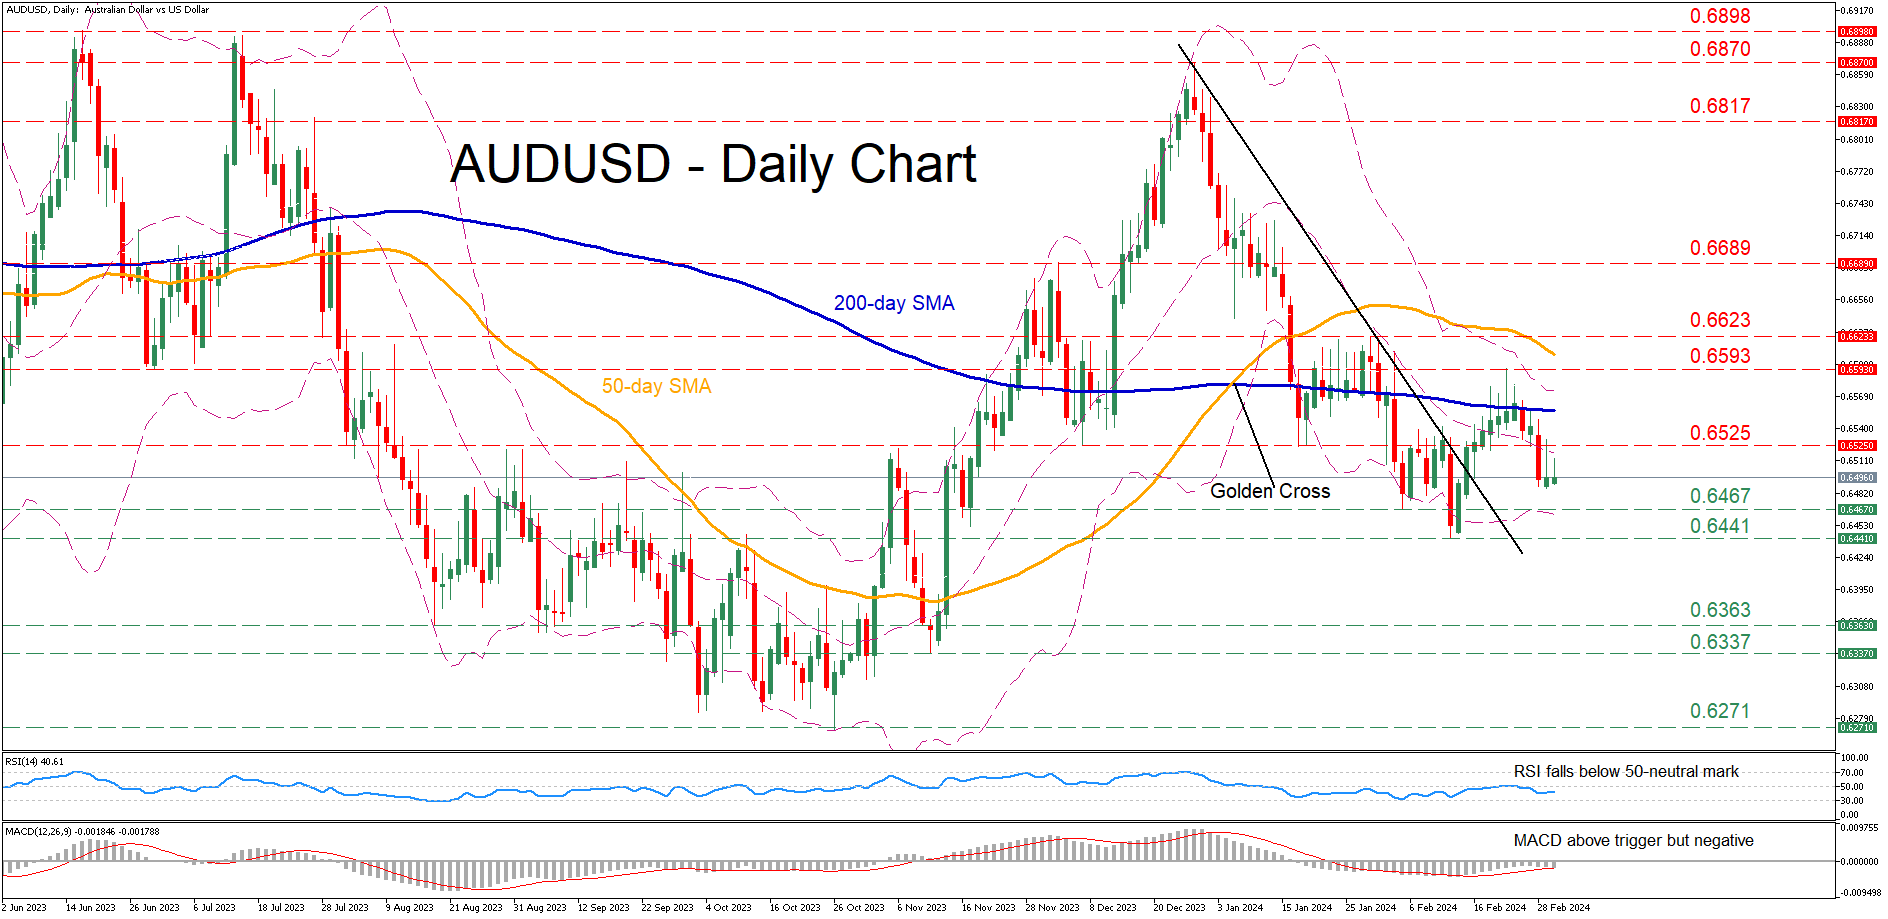
AUDUSD had been in a steady decline after peaking at 0.6870 in December, violating both its 50- and 200-day simple moving averages (SMAs). Although the pair managed to find its feet and rotate back above its descending trendline, it has been losing ground again following its repeated rejection at the 200-day SMA.
Should the pair extend its slide, the February support of 0.6467 could act as the first line of defence. A break below that level might pave the way for the 2024 bottom of 0.6441. Sliding beneath that floor, the pair may descend towards the August low of 0.6363.
On the flipside, bullish actions could propel the price towards 0.6525, a region that provided both support and resistance in recent months. Further advances could then cease at the recent peak of 0.6593 ahead of the January resistance of 0.6623. Even higher, the pair may challenge the 0.6689 hurdle.
In brief, AUDUSD has begun a new round of weakness following its persistent inability to claim the 200-day SMA.
Market Analysis: GBP/USD Struggles While USD/CAD Aims Higher
GBP/USD is attempting a recovery wave from 1.2600. USD/CAD is rising and might aim for a move above the 1.3580 resistance zone.
Important Takeaways for GBP/USD and USD/CAD Analysis Today
- The British Pound started a fresh decline from the 1.2700 resistance zone.
- There is a key bearish trend line forming with resistance near 1.2665 on the hourly chart of GBP/USD at FXOpen.
- USD/CAD is showing positive signs above the 1.3545 support zone.
- There is a contracting triangle forming with resistance near 1.3580 on the hourly chart at FXOpen.
GBP/USD Technical Analysis
On the hourly chart of GBP/USD at FXOpen, the pair started a fresh decline from the 1.2700 zone. The British Pound traded below the 1.2650 support to move into further a bearish zone against the US Dollar, as mentioned in the previous analysis.
The pair even traded below 1.2620 and the 50-hour simple moving average. Finally, the bulls appeared near the 1.2600 level. A low was formed near 1.2612 and the pair is now attempting a short-term recovery wave.
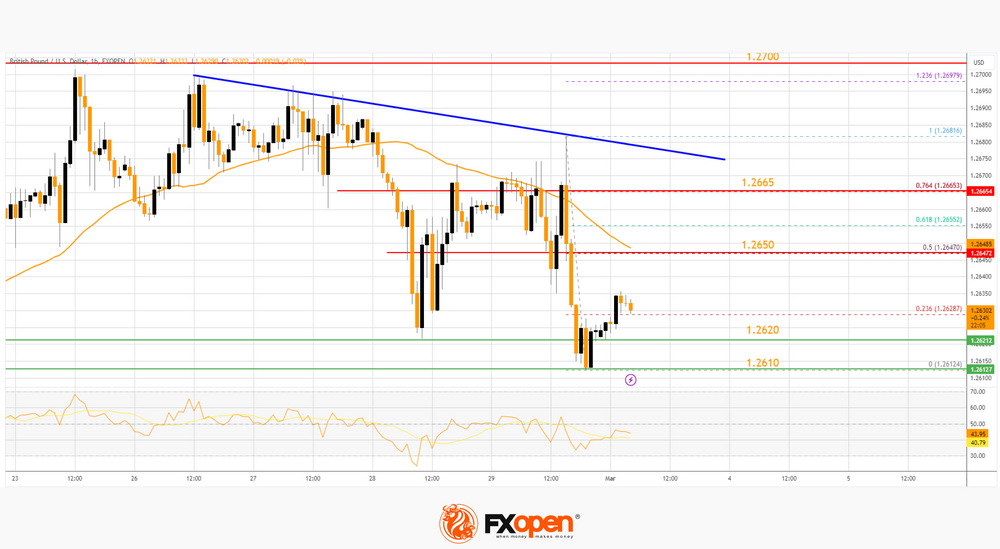
There was a fresh upside above the 1.2620 level. The pair climbed above the 23.6% Fib retracement level of the downward move from the 1.2681 swing high to the 1.2612 low.
Immediate resistance on the upside is near the 50% Fib retracement level of the downward move from the 1.2681 swing high to the 1.2612 low at 1.2650 and the 50-hour simple moving average. The first major resistance on the GBP/USD chart is near the 1.2665 level.
There is also a key bearish trend line forming with resistance near 1.2665. A close above the 1.2665 resistance might spark a decent recovery wave. The next major resistance is near the 1.2700 level. Any more gains could lead the pair toward the 1.2750 resistance in the near term.
Initial support sits near 1.2620. The next major support sits at 1.2610, below which there is a risk of another sharp decline. In the stated case, the pair could drop toward 1.2540.
USD/CAD Technical Analysis
On the hourly chart of USD/CAD at FXOpen, the pair formed a strong support base above the 1.3490 level. The US Dollar started a fresh increase above the 1.3530 resistance against the Canadian Dollar.
The pair cleared the 50-hour simple moving average and climbed above 1.3580. Finally, it tested the 1.3600 zone before there was a downside correction. The pair traded below the 1.3580 support zone.
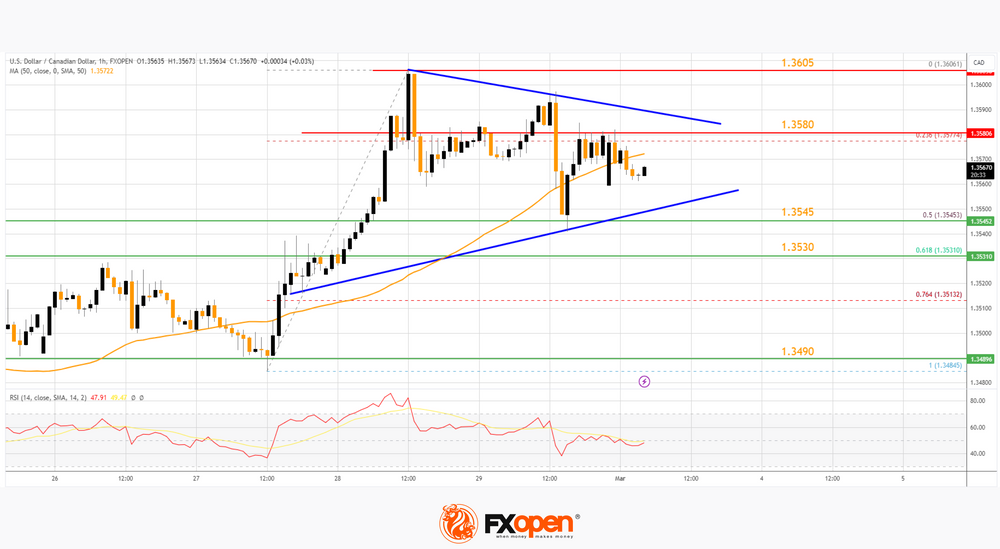
It tested the 1.3545 support zone and the 50% Fib retracement level of the upward move from the 1.3485 swing low to the 1.3605 high.
Initial resistance sits near the 1.3580 level and the 50-hour simple moving average. There is also a contracting triangle forming with resistance near 1.3580. A clear upside break above 1.3580 could start another steady increase.
The next major resistance is the 1.3605 level. A close above the 1.3605 level might send the pair toward the 1.3650 level. Any more gains could open the doors for a test of the 1.3685 level.
Conversely, the pair could start another decline. Initial support is near the 1.3545 level on the same USD/CAD chart. The next major support is near 1.3530. A downside break below the 1.3530 level could push the pair further lower. The next major support is near the 1.3490 support zone, below which the pair might visit 1.3450.
Trade over 50 forex markets 24 hours a day with FXOpen. Take advantage of low commissions, deep liquidity, and spreads from 0.0 pips. Open your FXOpen account now or learn more about trading forex with FXOpen.
This article represents the opinion of the Companies operating under the FXOpen brand only. It is not to be construed as an offer, solicitation, or recommendation with respect to products and services provided by the Companies operating under the FXOpen brand, nor is it to be considered financial advice.
Nasdaq (NQ) Extending Higher in Impulsive Structure
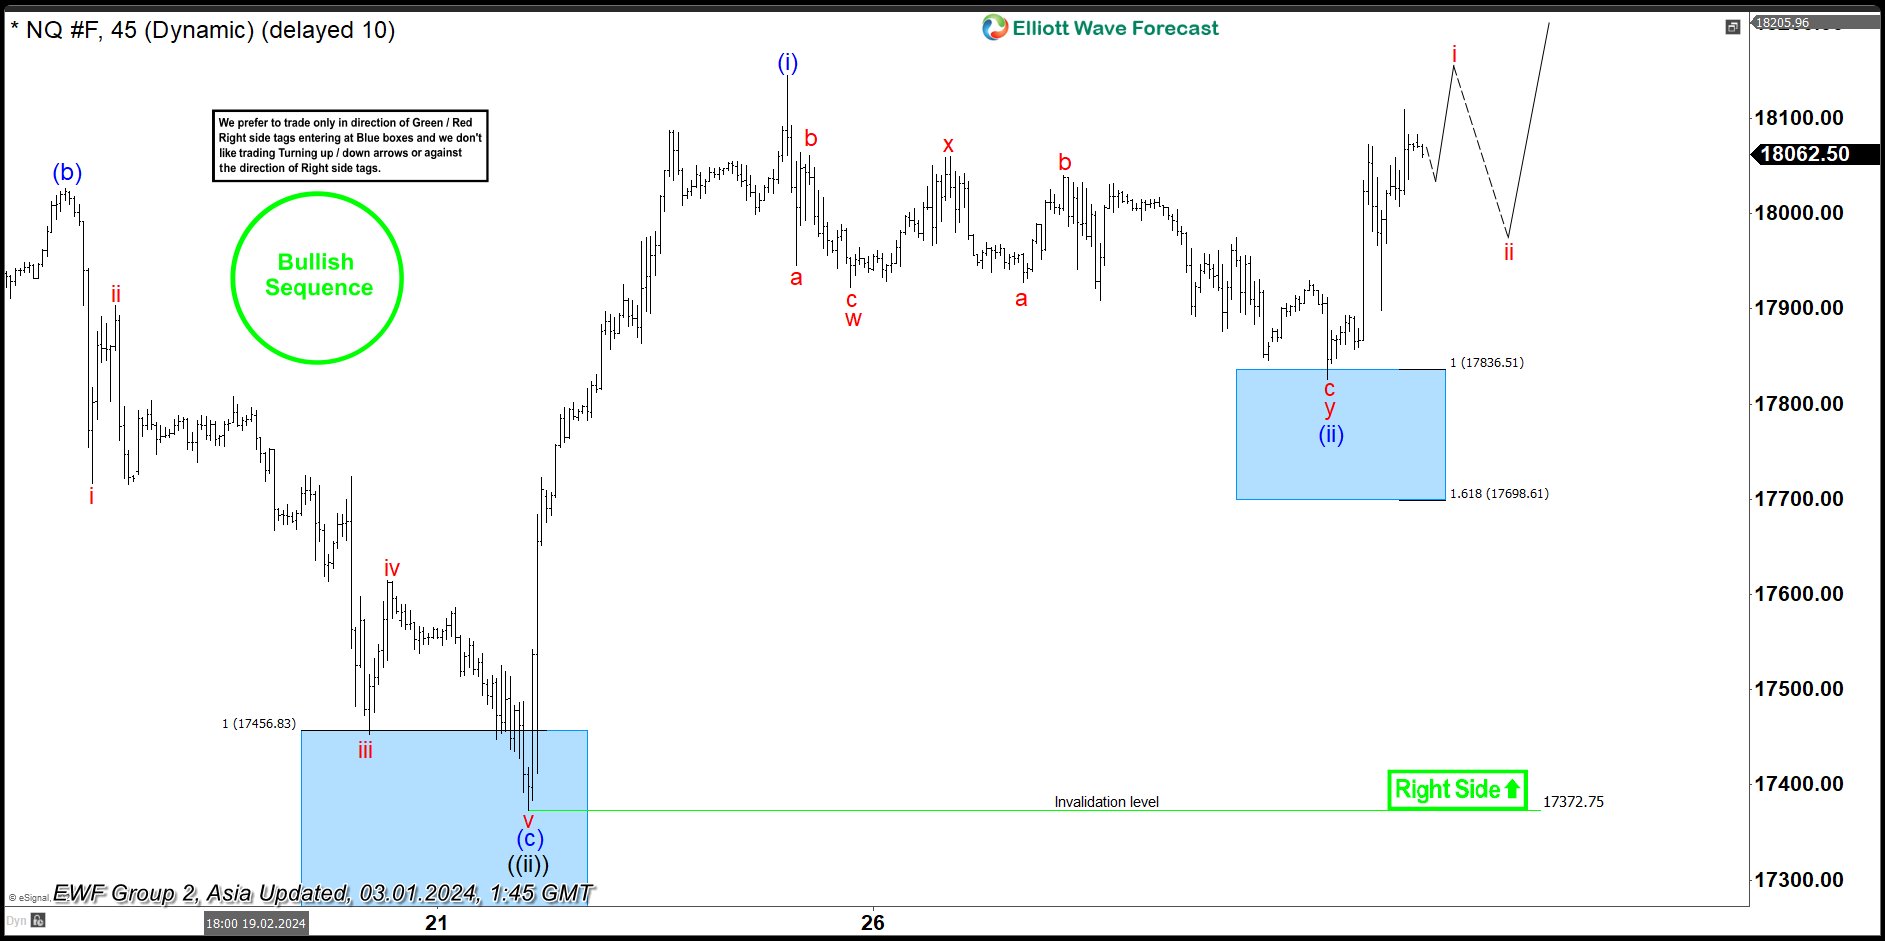
The short-term Elliott Wave View in the Nasdaq (NQ) suggests that rally from 1.5.2024 low is in progress as a nesting 5 waves impulse. Up from 1.5.2024 low, wave ((i)) ended at 18121.5 and pullback in wave ((ii)) ended at 17372.75. Internal subdivision of wave ((ii)) unfolded as a zigzag structure. Down from wave ((i)), wave (a) ended at 17542 and rally in wave (b) ended at 18026. Down from wave (b), wave i ended at 17717 and wave ii ended at 17903.5. The Index extended lower in wave iii towards 17452.5 and wave iv ended at 17614.5. Last leg wave v ended at 17372.75, which also completed wave (c) of ((ii)).
The Index has turned higher in wave ((iii)). Up from wave ((ii)), wave (i) ended at 18144.75. Pullback in wave (ii) unfolded as a double zigzag Elliott Wave structure. Down from wave (i), wave w ended at 17922 and wave x ended at 18059.50. Wave y lower ended at 17826 which completed wave (ii) in higher degree. The Index has turned higher in wave (iii). Near term, as far as pivot at 17372.75 low stays intact, expect Index to extend higher and any dips to find support in 3, 7, or 11 swing for more upside.
Nasdaq (NQ) 45 Minutes Elliott Wave Chart
Nasdaq (NQ) Elliott Wave Video
https://www.youtube.com/watch?v=ljUWQUOP8m4
BoJ Governor Ueda Poured Cold Water on Those Expecting Imminent Shift
Markets
Several Fed central bankers saw confirmation in yesterday’s PCE deflators (headline 0.3% m/m, 2.4% y/y - core 0.4%, 2.8%) that rate cuts would be appropriate later this year. But a bumpy return towards the 2% target and ongoing economic strength mean there’s no urgent need to do so. Narrower inflation gauges including the likes of core services ex housing rising 0.6% m/m underpin such a cautious approach. Cleveland’s Mester said the December dot plot guidance of three cuts “feels about right”. US money markets over the past months have come to adjust accordingly. Such pricing combined with the absence of a topside surprise (similar to the CPI published earlier in February) triggered some short covering, pushing yields at some point as much as 10 bps down. US yields capped the net daily decline to just 1.3-2.6 bps eventually but the sharp intraday swing down delivered a blow to German yields from which they did not recover. They rose about 5 bps after (m/m) HICP data from Germany, France and Spain all suggested still-strong underlying price pressures but closed the day between 1.4-5.1 bps lower in the end. EUR/USD succumbed in late-afternoon European trading. The pair hit an intraday high before sliding more or less in lockstep with US yields bottoming out. EUR/USD finished just north of 1.08, down from 1.0838 at the open. DXY successfully recovered north of 104 again. USD/JPY pared both USD-losses and JPY-gains with the combo leaving an intraday low around 149.2 to finish around 150 before extending gains this morning to 150.4. BoJ governor Ueda poured cold water on those expecting an imminent shift from the central bank. While BoJ member Takata yesterday rekindled such speculation by saying the price target is coming into sight, Ueda sounded less convinced. He needs more confirmation from (wage) data. Chinese PMIs this morning were mixed at best. The (official) non-manufacturing gauge recovered further in expansion territory (51.4) but details are far from flashy. The manufacturing gauge held below 50 for a fifth month straight but contradicts with the private (Caixin) gauge eking out a small gain to 50.9. USD/CNY is revisiting the recent highs at 7.20. This level looks like a red line for the PBOC/Chinese authorities.
Yesterday’s national inflation readings culminate in the European-wide figure today. Having that in mind, surprises to the 0.6% m/m and 2.5% y/Y (2.9% core) should be limited. The US manufacturing ISM has more market moving potential. We see no reason for the recent bottoming out process to have stopped in February. Most regional indicators (New York, Dallas, Philadelphia, Richmond) have improved as well. We do not exclude a reading suggesting expansion again (> 50 from 49.1 and vs 49.5 expected). Renewed activity in this rate-sensitive sector would suggest the US economy has already seen the peak impact from the Fed’s tightening cycle. The bottom below core bond yields, the US in particular, is therefore well protected. If the data further add to the idea of a soft (or no) landing, decent risk sentiment could contain the fall-out for EUR/USD. The leadership reshuffle announced post-market by the troubled commercial real estate lender NYCB over ineffective (loan risk) oversight is a major risk factor though. The spotlights are now back on the slumbering topic. A whole range of Fed speeches are scheduled for today as well.
News & Views
US Congress approved a temporary spending bill to prevent a partial US government shutdown this weekend. US President Biden will now sign off on the agreement which keeps part of the government funded until March 8 and the rest until March 22. The measures buy time to agree on a funding plan for all of fiscal year 2024. Republican house speaker Johnson earlier this week indicated that lawmakers agreed in principle on the substance of half of the 12 full-year bulls. Drafting and reviewing those should be completed by the March 8 deadline while finishing the rest of negotiations is something for the end of March deadline.
South Korean exports rose by 4.8% Y/Y in February, unadjusted for the lunar NY holidays which occurred in that same month this year. It offers part of the explanation of the drop in growth compared to January (+20% Y/Y). Exports nevertheless continue to pick up driven by shipments of semiconductors and machinery. Recovering South Korean exports are seen as a proxy for better global growth and commerce as the country is a key link in global trade. Imports declined by 13.1%Y/Y in February, underlying weaker domestic momentum as witnessed by slowing consumption.
The Inflation Puzzle
Thank God! Yesterday’s inflation report from the US wasn’t worse than expected. The core PCE index showed that, yes, the monthly inflation rose at the highest pace in a year, but that the yearly figure eased from 2.9% to 2.8%. Both figures matched market expectations. As such, yesterday’s data hinted at inflation uptick in January, but the data came as a relief for those who were prepared for the worst. A soft jobless claims figure also helped cooling the hawkish Fed worries. That’s why the S&P500, Nasdaq and Russell 2000 rebounded yesterday.
But the US dollar rebounded, as well, following the PCE print. The services inflation – which excludes housing and energy prices - jumped 0.6% on the month, the highest since March 2022. And US Labor Department sent a group of ‘super data’ users an email saying that the surge in last month’s inflation was due to a shift in underlying calculations, and not necessarily due to the rise in prices. The BLS tried to unsend the email, but you can’t fool the ‘super data’ users, can you? The information was seen, and some of them think that if what they saw is correct, the US rent inflation could remain elevated for a few more months, and that should keep the Federal Reserve (Fed) doves at bay.
Still, the stock markets reacted positively to the latest PCE data, and the US yields eased posterior to yesterday’s PCE data and to the news that BLS is cooking something unusual in its kitchen. The probability given to a June rate cut settled at around 67%.
In Europe, the inflation heatmap was mixed. Inflation in Germany slowed more than expected, Spanish and French figures were slightly higher than expected, but still, French inflation fell to the weakest level since September 2021. Combined with the weak economic outlook in the region, the latest inflation prints revived the expectations that the European Central Bank (ECB) could start cutting its rates before the Fed. The EURUSD slipped below the 100 and 200-DMA, fundamentals back a further depreciation of the euro against the greenback provided the diverging strength of the underlying economies – which by the way is not only due to the fact that the Americans are so strong that they can defy whatever rate hikes the Fed throws at them, but it’s partly because the US government spends at a furious speed, whereas the euro-area economies have a better budget discipline! But whatever it is, the US economy is doing significantly better than the Eurozone’s. That’s why the ECB is expected to cut more than the Fed this year. Although not many see the ECB start cutting rates before the Fed.
In Japan, the policymakers are not in a hurry to hike their rates. A Bank of Japan (BoJ) board member’s words that the BoJ could be approaching the end of the negative rates had sent the USDJPY below the 150 level earlier this week along with a stronger than expected BoJ core PCE report, remember? Well, the Governor Ueda came to spoil the BoJ hawks’ trade by saying that their price target is not yet in sight, and that they will ‘continue to seek confirmation whether the virtuous cycle between wages and price began to turn’. The USDJPY is back above the 150, but can probably not go further up because traders fear a direct FX intervention from the Japanese authorities to prevent the yen from losing too much value. Nikkei 225 hit a fresh record.
Elsewhere, the Chinese PMI figures came in slightly better than expected in February but the manufacturing activity shrank for the 5th straight month and home sales slumped faster despite stimulus measures to throw a floor under China’s falling property market. In numbers, the value of new home sales from the 100 top developers have reportedly slipped by 60% from a year earlier! The latter home data comes as yet another proof that a property crisis has no easy, overnight fix. It took Japan three decades to get out of deflation. But good news is that the Chinese equities are consolidating and extending gains this week. The CSI 300 index recovered to the highest levels in three months.
While China is struggling with a worsening property crisis, aging population and deflation, India posted a 8.4% growth in Q4, higher than analyst expectations. A part of the GDP growth may come from a surge in taxes, but overall the Indian government predicts that the EM giant will reach a whopping 7.6% through the fiscal year to March, higher than 7.3% they predicted earlier. The Indian Nifty 50’s outperformance compared to the Chinese CSI is indisputable since mid-2021. If China can’t remedy to its home crisis, India could finally become the new China.
Regional Prints Reveal Stickiness in Core Inflation
In focus today
In the euro area we will get the HICP print for February. With the regional data we got yesterday (see more below) we will probably see HICP come in at 2.5% y/y or 2.6% y/y, down from 2.8% in January. That is a little higher than the 2.4% we first expected before yesterday's releases. Core inflation showed signs of stickiness, meaning that taking yesterday's releases into account the core inflation print will probably decrease to 2.9% or 3.0% from 3.3% in February.
In the US, today's main data release will be the ISM Manufacturing index for February. Consensus expects a further increase to 49.5 (from 49.1) following a modest uptick in the flash PMIs. We will also have a range of Fed speakers on the wires today, including a Waller, Logan, Bostic, Daly and Kugler. We also get the University of Michigan consumer sentiment indicator.
February PMIs are released in several countries today, including Sweden. The new order-to-inventory spread in Sweden has seen a clear upward shift over the past six months, which at least historically has been a rather reliable go-ahead signal for production to increase. Whether or not this shows up in today's data remains to be seen, but it should not be far off in any case.
Economic and market news
What happened overnight
In China, PMI numbers were released. We continue to see divergence between the NBS survey and the private Caixin survey. According to the NBS survey, the manufacturing industry slowed marginally from 49.2 in January to 49.1 in February, meaning that according to this figure the Chinese manufacturing sector saw slowing activity for the fifth month straight. However, the Caixin survey showed that the manufacturing sector expanded even more than it did in January, from 50.6 to 50.9 in February. The service PMI got a lift from 50.7 in January to 51.4 in February.
In Japan, BoJ governor Ueda said that he thinks it is too early to declare that the 2% inflation target has been met yet. He said that he would await the results of companies' wage negotiations with unions later in March before being able to be say that the goal has been met. Ueda's statement contradicted the statement from BoJ's Takada yesterday, which was hawkish and fuelled speculations over an impending end to negative rates. We believe that this will happen in April.
What happened yesterday
In the US, we got January PCE inflation data. Core inflation (the Fed's preferred measure for underlying inflation) was in line with expectations (+0.4%) but real consumption volumes were on the weaker side (-0.1% m/m) amid a small uptick in savings rate (3.8%; from 3.7%). Following the release, bond yields turned lower, and the broad USD weakened.
We also got jobless claims. The continued claims unexpectedly rose to the highest level since November which sends a signal of a cooling job market as job seekers take longer to find new employment. Initial jobless claims were still moderate at 215,000, which was a little higher than market expectations.
The Fed's Daly said central bank officials are ready to lower interest rates as needed - but emphasized there is no urgent need given the strength of the economy. Bostic reiterated his view that it will probably be appropriate to begin easing policy this summer. Fed's Mester said that PCE inflation data shows that Fed still has work to do, and three rate cuts in 2024 seems about right.
In the euro area we got local inflation data from the euro countries. French inflation was marginally higher than expected. CPI rose to 2.9% y/y in February (cons: 2.8%, prior: 3.1%). In Spain CPI inflation was as expected, but the HICP inflation was marginally higher than expected due to different weighting in the two methods. The monthly increase in seasonally adjusted core inflation was to the high side at 0.33% m/m s.a. German inflation declined in January, but core was unchanged. The monthly change in core inflation was to the high side due to service inflation that increased 0.37% m/m s.a. Hence, both Spain, Germany, and France signal that the most recent underlying momentum in core inflation is to the high side due to services.
ECB's Panetta sounded dovish by saying that inflation is falling faster than expected.
Equities: Global equities rose to a new all-time high yesterday. Cyclicals outperformed as the storm of macro data boosted the "higher-for-longer" environment. Higher-for-longer can both be a demand and an inflation driver, and yesterday it was a bit of both which also meaning the inflation did come in slightly worrisome. Banks, which are in our opinion the biggest winners from the current mix of incoming data did okay yesterday, but we must admit investors prefer growth stocks on days when risk appetite is improving. In US yesterday, Dow +0.1%, S&P 500 +0.5%, Nasdaq +0.9% and Russell 2000 +0.7%. Asian markets are higher this morning with a sharp lift to Japanese equities. European futures have also seen solid gains while US futures are showing more moderate lifts.
FI: A string of strong core inflation prints from Germany, France and Spain drove European yields higher in the first part of yesterday's trading session. However, this trend was offset in the afternoon following the release of weak US consumption figures for January and the slightly higher US claims figures for the past weeks. The German yield curve bull-flattened with 10Y Bund yields down by 5bp throughout the day, while the US Treasury curve was less changed. This highlights the strong impact of US data on long-end EGB yields at present. The Bund ASW-spread continued drifting lower through the session, reaching the lowest level at 35.3 since the summer 2021.
FX: Yesterday's session was characterized by broad USD appreciation in the G10 space except against the JPY. EUR/USD drifted lower towards 1.08. The JPY strengthened yesterday on hawkish remarks from BoJ member Hajime Takata, but this morning, BoJ governor Ueda signalled a more dovish stance, saying that the "stable price target is not yet in sight," sending USD/JPY back above 150.
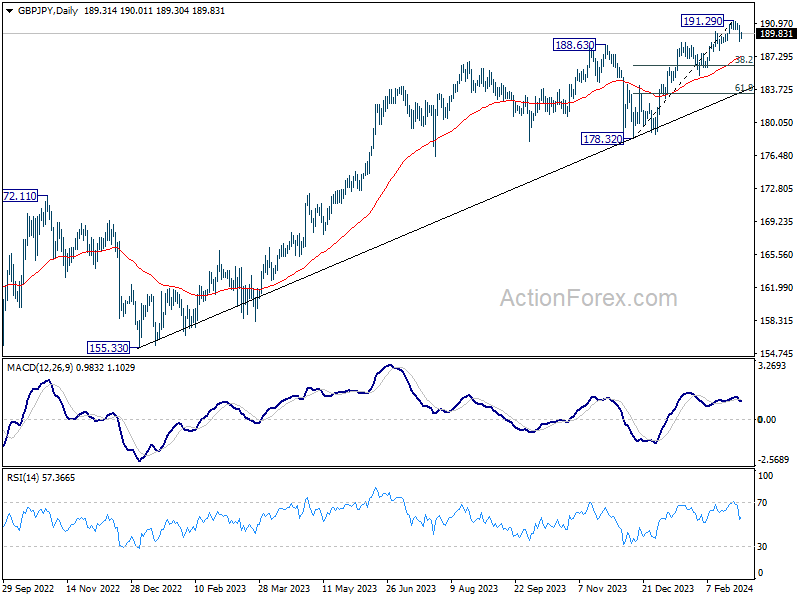
GBP/JPY Daily Outlook
Daily Pivots: (S1) 188.67; (P) 189.75; (R1) 190.44; More....
Risk stays on the downside in GBP/JPY as long as 191.29 short term top holds. Break of 188.90 resistance turned support will extend the decline to 38.2% retracement of 178.32 to 191.29 at 186.33.
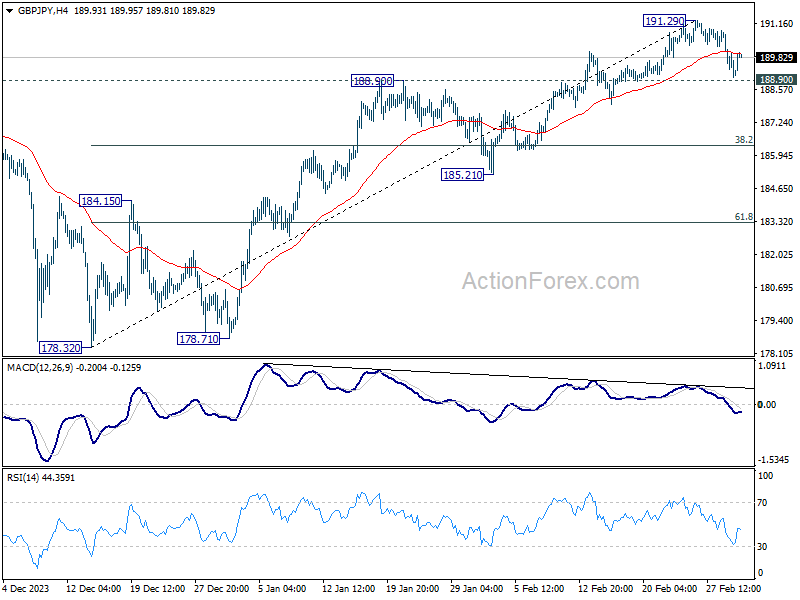
In the bigger picture, up trend from 123.94 (2020 low) is in progress. Medium term outlook will stay bullish as long as 178.32 support holds. Next target is 195.86 long term resistance (2015 high).
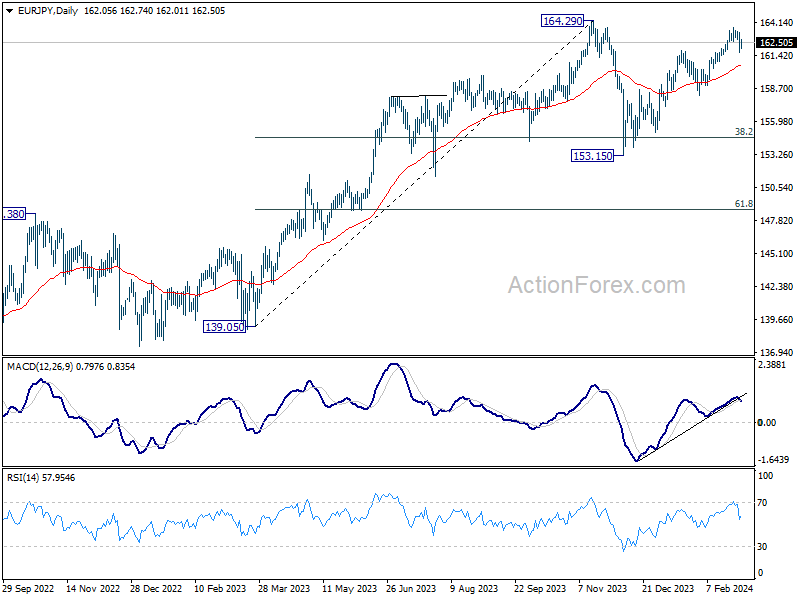
EUR/JPY Daily Outlook
Daily Pivots: (S1) 161.36; (P) 162.40; (R1) 163.11; More...
Risk in EUR/JPY remains on the downside as long as 163.70 short term top holds. Fall from there would extend to channel support (now at 161.06). Firm break there will target 38.2% retracement of 153.15 to 163.70 at 159.66.
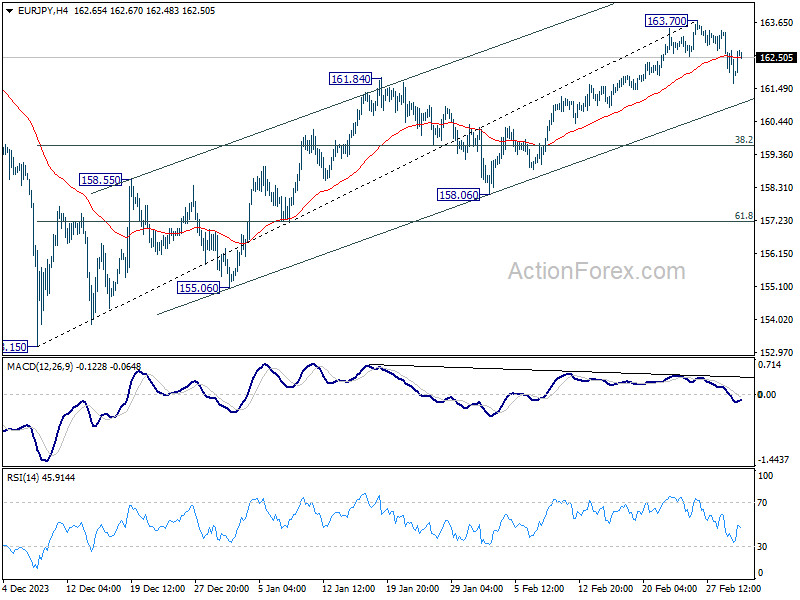
In the bigger picture, price actions from 164.29 medium term top are seen as a correction to rise from 139.05 only. As long as 148.38 resistance turned support holds (2022 high), larger up trend from 114.42 (2020 low) is expected to resume through 164.29 at a later stage. Next target would be 169.96 (2008 high).