
Sample Category Title
USD/CHF Daily Outlook
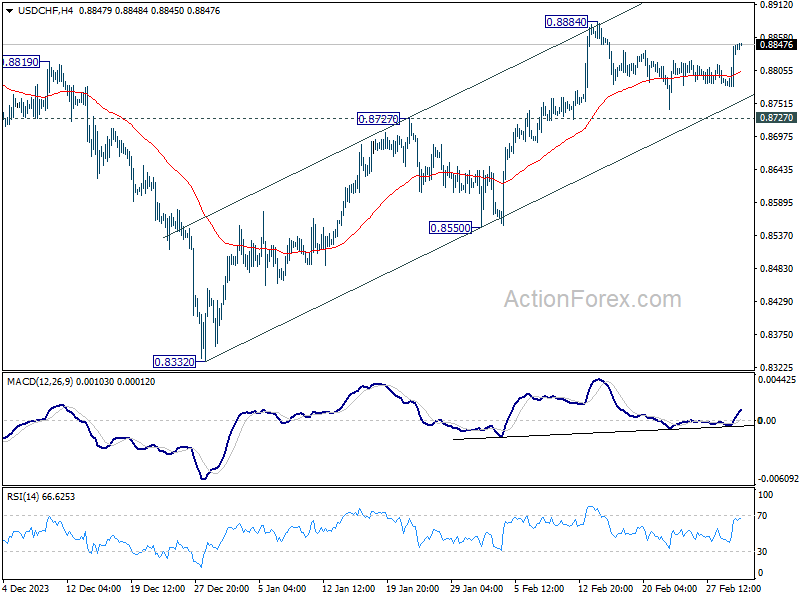
Daily Pivots: (S1) 0.8802; (P) 0.8825; (R1) 0.8870; More....
USD/CHF rebounded notably but stays in range below 0.8884. Intraday bias remains neutral at this point. With 0.8727 resistance turned support intact, further rally is expected. On the upside, above 0.8884 will resume the rise from 0.8332 towards 0.9243 resistance. However, sustained break of 0.8727 will dampen this bullish view, and turn bias back to the downside for 0.8550 support instead.
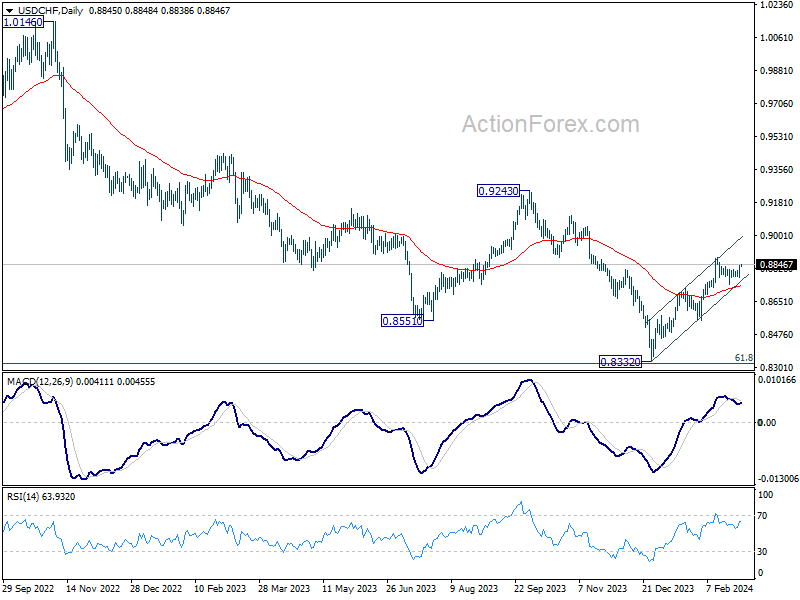
In the bigger picture, a medium term bottom should be formed at 0.8332, on bullish convergence condition in W MACD, just ahead of 0.8317 long term fibonacci support. It's still early to decide if the larger down trend from 1.0146 (2022 high) is reversing. But further rise should be seen to 0.9243 resistance even as a correction.
USD/JPY Daily Outlook
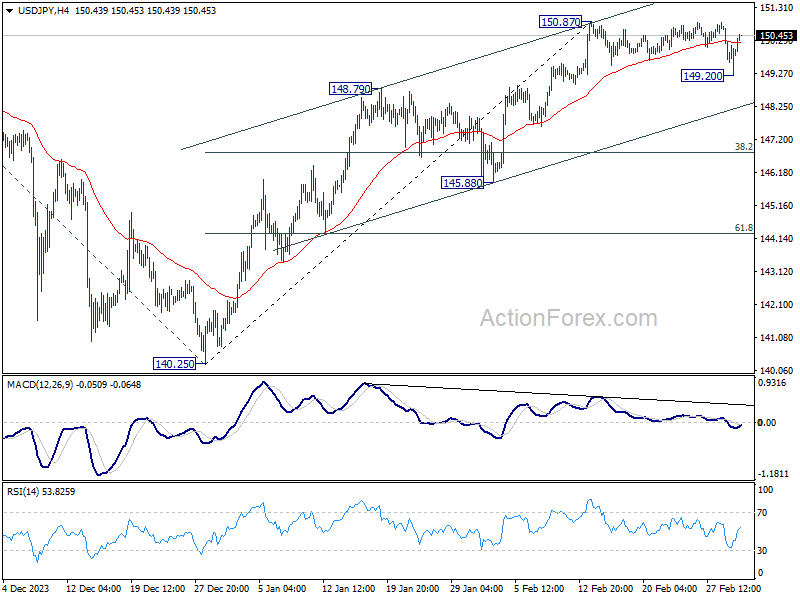
Daily Pivots: (S1) 149.24; (P) 149.97; (R1) 150.74; More...
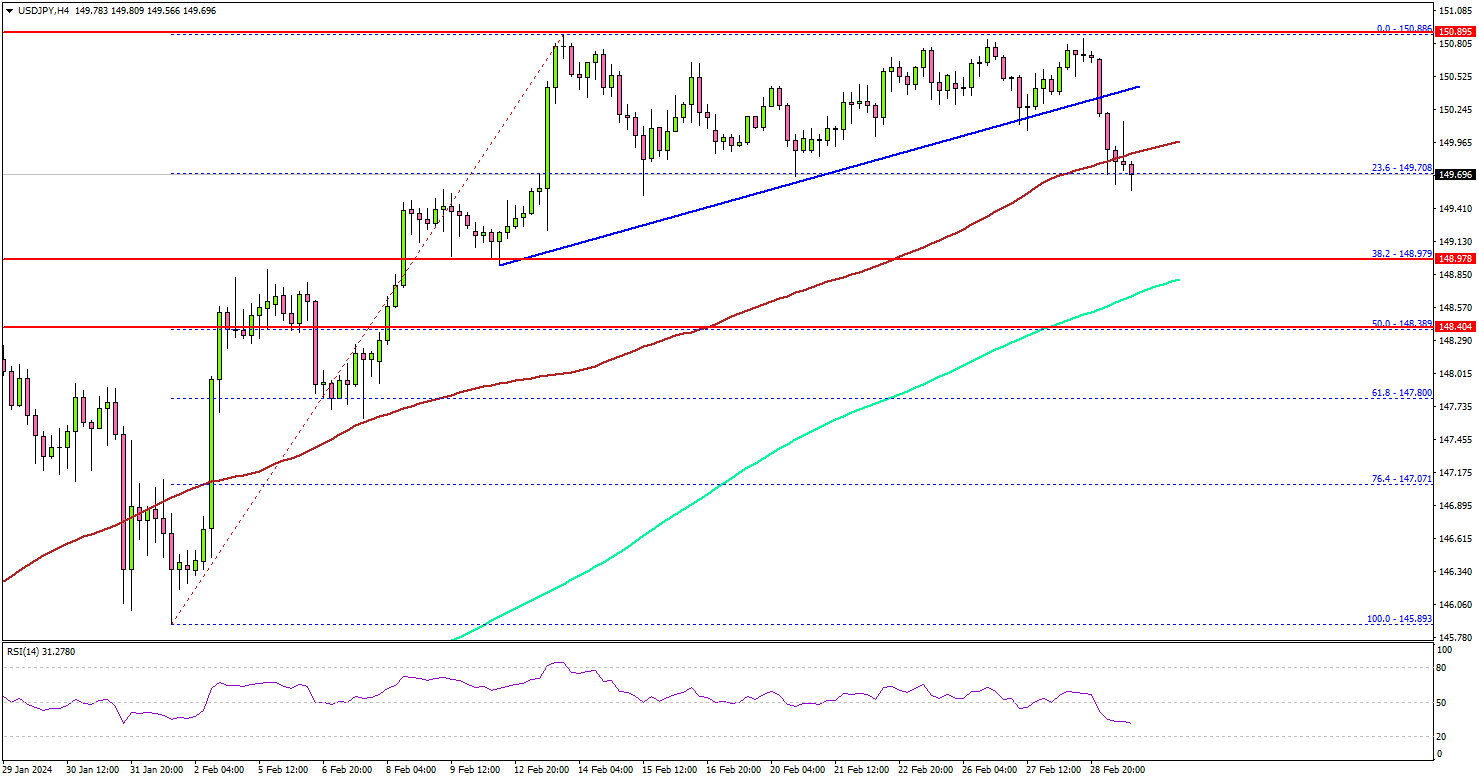
USD/JPY rebounded strongly after brief dip to 149.20 and intraday remains neutral for now. On the upside, decisive break of 150.87 will resume whole rally from 140.25 to retest 151.89/93 key resistance zone. On the other hand, considering bearish divergence condition in 4H MACD, firm break of 149.20 will confirm short term topping at 150.87. Deeper fall would be seen to channel support (now at 148.29), even as a corrective move.
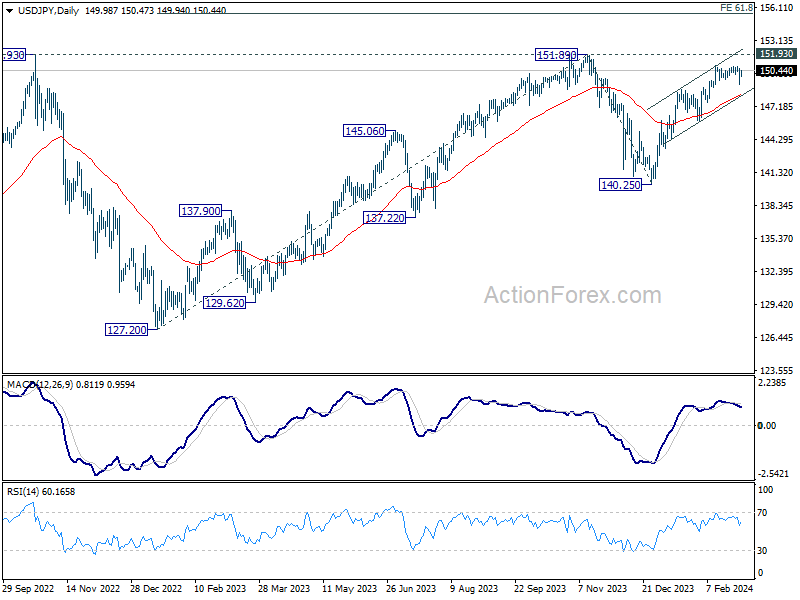
In the bigger picture, rise from 140.25 is seen as resuming the trend from 127.20 (2023 low). Decisive break of 151.89/.93 resistance zone will confirm this bullish case and target 61.8% projection of 127.20 to 151.89 from 140.25 at 155.50. However, break of 148.79 resistance turned support will delay this bullish case, and extend the corrective pattern from 151.89 with another falling leg.
Markets Respond to BoJ’s Dual Tone, Yen Pares Gains While Nikkei Soars
Yen reverses some of yesterday's gains after cautious comments from BoJ Governor Kazuo Ueda, which highlighted that Japan is "not there yet" to reach the long-sought-after sustainable inflation rate of 2%. Ueda's perspective starkly contrasted with the more hawkish tones of Board Member Hajime Takata, who has advocated for beginning discussions on exiting the ultra-loose monetary policy.
While Governor Ueda's role naturally predisposes him to a more guarded stance, his optimistic comments on the ongoing wage negotiations inject a positive note into inflation outlook, potentially signaling confidence in domestic economic strengthening.
At the same time, the rally in Japanese stock continue to look unstoppable. Nikkei makes more records highs today, and it's now tantalizingly close to 40k psychological milestone. sentiment.
In the wider currency market, Yen maintains its position as the week's strongest contender, closely followed by the robust Dollar. On the other end of the spectrum, commodity currencies are facing headwinds, getting scant support from the less-than-stellar PMI data from China. New Zealand Dollar, in particular, lags as the weakest, with the Australian and Canadian Dollars also underperforming.
Euro stands out as the third strongest currency, showing resilience and outpacing both Sterling and Swiss Franc, as market participants await CPI flash data from Eurozone for further direction.
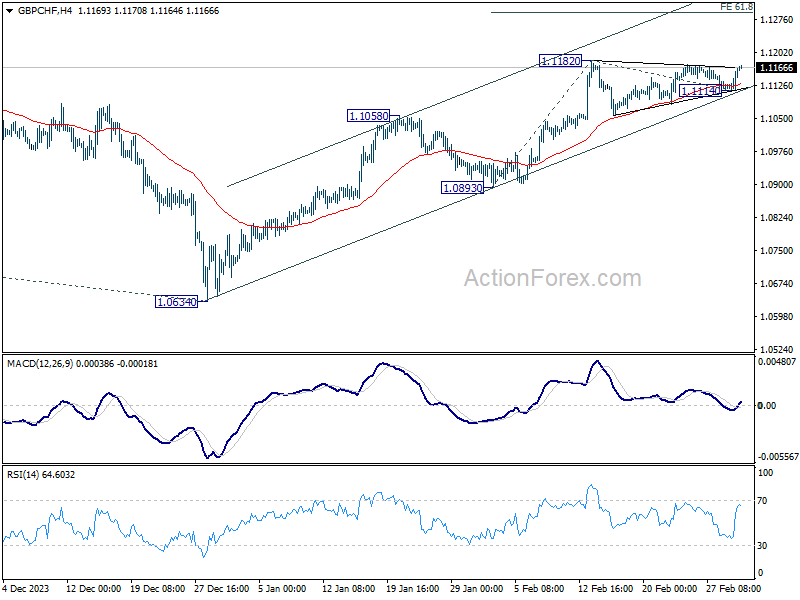
Technically, GBP/CHF would be an interesting one to watch today. Near term consolidation from 1.1182 has possibly completed with three waves to 1.1114, just ahead of short term rising channel support. Firm break of 1.1182 would confirm this bullish case, and resume whole rise from 1.0634. Next target will be 61.8% projection of 1.0893 to 1.1182 from 1.1114 at 1.1293. The move could be accompanied by break of 0.8884 resistance in USD/CHF on broad-based Swiss Franc selloff.
In Asia, at the time of writing, Nikkei is up 1.92%. Hong Kong HSI is up 024%. China Shanghai SSE is up 0.04%. Singapore Strait Times is down -0.09%. Japan 10-year JGB yield is up 0.0030 at 0.717. Overnight, DOW rose 0.12%. S&P 500 rose 0.52%. NASDAQ rose 0.90%. 10-year yield fell -0.022 to 4.252.
BoJ's Ueda stays cautious on achieving sustainable inflation
Bank of Japan Governor Kazuo Ueda reiterated that Japan has not yet achieved sustainable 2% inflation. "I don't think we are there yet," he said after G20 finance ministers' meeting.
A significant focus for BoJ in the near term will be the outcome of upcoming annual wage negotiations between companies and unions. Ueda pointed out the importance of these negotiations in determining the potential for a positive wage-inflation cycle in Japan.
"We need to confirm whether a positive wage-inflation cycle would kick off and strengthen," he noted, acknowledging the rising demands from unions for pay increases exceeding last year's and the apparent willingness among many firms to comply.
However, Ueda also stressed the need for a comprehensive review of the collective results of these wage negotiations, alongside other economic data, to gauge whether wages and inflation will sustainably rise in tandem.
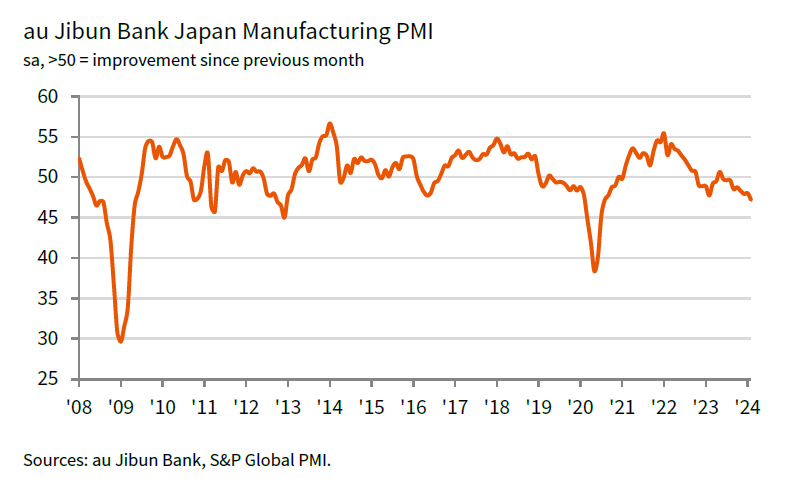
Japan's PMI manufacturing finalized at 47.2, worst since Aug 2020
Japan's PMI Manufacturing was finalized at 47.2 in February, down from January's 48.0. This marks the ninth consecutive month of contraction, presenting the most significant downturn since August 2020.
According to S&P Global, the decline was characterized by sharper falls in both output and new orders. Additionally, the sector experienced the most substantial decline in employment seen in over three years, indicating that the downturn is having a tangible impact on workforce. Furthermore, rate of increase in output prices slowed to the lowest level since June 2011, suggesting that price pressures are easing amid weakened demand.
China's NBS PMI manufacturing falls slightly to 49.1, Caixin manufacturing rises to 50.9
China's manufacturing sector continued its contraction for the fifth consecutive month in February, with official NBS PMI decreasing slightly from 49.2 to 49.1, matched expectations.
New orders subindex remained steady at 49, indicating stagnant demand. New export orders fell further from 47.2 to 46.3, reflecting ongoing pressures on the export front.
NBS PMI Non-Manufacturing rose from 50.7 to 51.4 , surpassing the anticipated 50.8. PMI Composite remained unchanged at 50.9.
In parallel, Caixin PMI Manufacturing, which focuses more on small and medium-sized enterprises, edged up from 50.8 to 50.9 , slightly above expectations of 50.7.
Caixin noted sustained increase in output and new orders, with firms expressing improved business optimism for the second consecutive month. Additionally, input cost inflation declined to a seven-month low, while selling prices fell.
RBNZ's Orr: Restrictive policy to stay, expects normalization next year
RBNZ Governor Adrian Orr affirmed today that the economy is "evolving as anticipated", with inflation expectations declined. However, he reiterated inflation "is still too high".
The governor emphasized the necessity of maintaining a restrictive monetary policy stance "for some time." He added that he expects to "begin normalizing policy in 2025."
Fed's Williams sees rate cut this year, stresses lack of urgency
New York Fed President John William reiterated that he expected rate cuts to start this year, but emphasized there is "no sense of urgency to do that".
"I think that makes sense with inflation coming down, the economy being in better balance, that we're going to move interest rates back to more normal levels," he said at an event overnight.
Williams noted that monetary policy is "in good place", and the focus now is to gain confidence that inflation is on track to 2% target.
Fed's Mester: Inflation fight continues, yet three rate cuts still expected in 2024
Cleveland Fed President Loretta Mester remains steadfast in her view that inflation is on track to Fed's target, despite a month-over-month jump in the preferred inflation gauge.
Nevertheless, "it does show you there is a little more work for the Fed to do," Mester said in a Yahoo Finance interview overnight.
Mester reiterated her December forecast of three rate cuts in 2024, suggesting that this remains a plausible scenario if the economy progresses as she expects. "Right now that feels about right to me if the economy evolves as I anticipate it will," she stated.
Fed's Goolsbee optimistic about US economy's golden path in 2024
Chicago Fed President Austan Goolsbee, at an even overnight, highlighted the scope for the US economy to maintain what he terms the "golden path," a scenario where inflation falls in conjunction with sustained labor market strength and economic growth. This balance, he notes, is historically rare but remains a viable outcome for the current year.
Goolsbee's confidence stems from anticipated improvements in supply chain efficiency and labor supply impacts, which he believes will bolster this optimistic economic scenario.
"I still feel like there is supply benefit coming through the system on both the supply chain, and the impact of labor supply," Goolsbee remarked.
Fed's Daly sees greenshoots yet rate cuts await clearer signals
San Francisco Fed President Mary Daly highlighted the shift towards a more data-dependent approach, a move away from extensive forward guidance. She underscored the importance of being "methodical" in decision-making, emphasizing Fed's intention to "hold on just right" without being locked into predefined commitments.
In a Bloomberg TV interview overnight, Daly articulated the need for "a collage of evidence" to confirm a sustainable downward trend in inflation, relying not just on published economic statistics but also on insights from business contacts. Although she acknowledged the emergence of positive signs, or "green shoots," in the economy, she cautioned, "we're not there yet," indicating that more evidence is needed to confirm that inflation is on a consistent decline.
Furthermore, Daly discussed the implications of adjusting the nominal interest rate as inflation begins to ease. She argued for the necessity of reducing interest rates in a timely manner to prevent overly tightening monetary policy that could inadvertently trigger an economic downturn.
Looking ahead
Eurozone CPI flash is the main focus in European session. Eurozone unemployment rate, PMI manufacturing final; Swiss retail sales and PMI manufacturing; UK PMI manufacturing final will also be released.
Later in the day, US ISM manufacturing is the main focus while Canada will also release PMI manufacturing.
USD/JPY Daily Outlook
Daily Pivots: (S1) 149.24; (P) 149.97; (R1) 150.74; More...
USD/JPY rebounded strongly after brief dip to 149.20 and intraday remains neutral for now. On the upside, decisive break of 150.87 will resume whole rally from 140.25 to retest 151.89/93 key resistance zone. On the other hand, considering bearish divergence condition in 4H MACD, firm break of 149.20 will confirm short term topping at 150.87. Deeper fall would be seen to channel support (now at 148.29), even as a corrective move.
In the bigger picture, rise from 140.25 is seen as resuming the trend from 127.20 (2023 low). Decisive break of 151.89/.93 resistance zone will confirm this bullish case and target 61.8% projection of 127.20 to 151.89 from 140.25 at 155.50. However, break of 148.79 resistance turned support will delay this bullish case, and extend the corrective pattern from 151.89 with another falling leg.
Economic Indicators Update
| GMT | Ccy | Events | Actual | Forecast | Previous | Revised |
|---|---|---|---|---|---|---|
| 21:45 | NZD | Building Permits M/M Jan | -8.80% | 3.70% | 3.60% | |
| 23:30 | JPY | Unemployment Rate Jan | 2.40% | 2.40% | 2.40% | |
| 00:30 | JPY | Manufacturing PMI Feb F | 47.2 | 47.2 | 47.2 | |
| 01:00 | CNY | NBS Manufacturing PMI Feb | 49.1 | 49.1 | 49.2 | |
| 01:00 | CNY | NBS Non-Manufacturing PMI Feb | 51.4 | 50.8 | 50.7 | |
| 01:45 | CNY | Caixin Manufacturing PMI Feb | 50.9 | 50.7 | 50.8 | |
| 05:00 | JPY | Consumer Confidence Index Feb | 39.1 | 38.4 | 38 | |
| 07:30 | CHF | Real Retail Sales Y/Y Jan | 0.40% | -0.80% | ||
| 08:30 | CHF | Manufacturing PMI Feb | 44.6 | 43.1 | ||
| 08:45 | EUR | Italy Manufacturing PMI Feb | 49.5 | 48.5 | ||
| 08:50 | EUR | France Manufacturing PMI Feb F | 46.8 | 46.8 | ||
| 08:55 | EUR | Germany Manufacturing PMI Feb F | 42.3 | 42.3 | ||
| 09:00 | EUR | Italy Unemployment Jan | 7.20% | 7.20% | ||
| 09:00 | EUR | Eurozone Manufacturing PMI Feb F | 46.1 | 46.1 | ||
| 09:30 | GBP | Manufacturing PMI Feb F | 47.1 | 47.1 | ||
| 10:00 | EUR | Eurozone Unemployment Rate Jan | 6.40% | 6.40% | ||
| 10:00 | EUR | CPI Y/Y Feb P | 2.50% | 2.80% | ||
| 10:00 | EUR | CPI Core Y/Y Feb P | 2.90% | 3.30% | ||
| 14:30 | CAD | Manufacturing PMI Feb | 48.3 | |||
| 14:45 | USD | Manufacturing PMI Feb F | 51.5 | 51.5 | ||
| 15:00 | USD | ISM Manufacturing PMI Feb | 49.5 | 49.1 | ||
| 15:00 | USD | ISM Manufacturing Prices Paid Feb | 52 | 52.9 | ||
| 15:00 | USD | ISM Manufacturing Employment Index Feb | 47.1 | |||
| 15:00 | USD | Construction Spending M/M Jan | 0.10% | 0.90% | ||
| 15:00 | USD | Michigan Consumer Sentiment Index Feb F | 79.6 | 79.6 |
Technical Outlook and Review
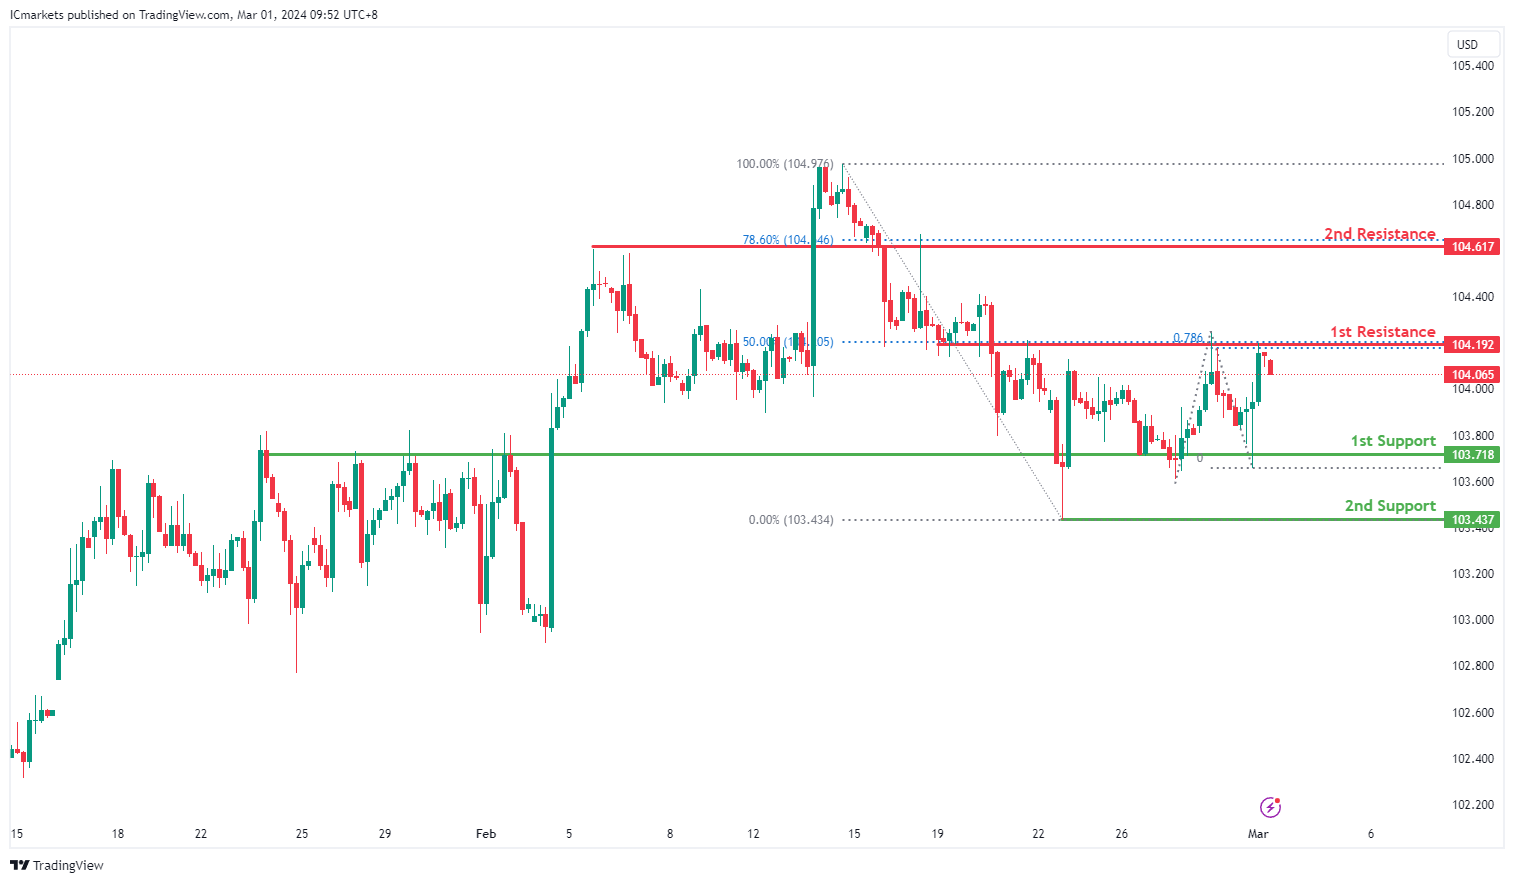
DXY:
The DXY chart maintains a bearish momentum, suggesting a potential continuation of the downtrend towards the 1st support level.
The 1st support at 103.71 is significant as an overlap support, indicating its historical relevance as a level where buying interest has previously emerged, potentially providing a floor for the current downtrend.
Further supporting potential downside movement, the 2nd support at 103.43 corresponds to a swing low support, reinforcing its significance as a level where buyers historically intervened to prevent further decline.
On the resistance side, the 1st resistance level at 104.19 is identified as an overlap resistance, coinciding with the 50% Fibonacci Retracement level. This suggests a notable barrier to upward movement, where selling pressure may intensify.
Additionally, the 2nd resistance at 104.61 represents another overlap resistance and aligns with the 78.60% Fibonacci Retracement level, further reinforcing its significance as a potential area of selling interest.
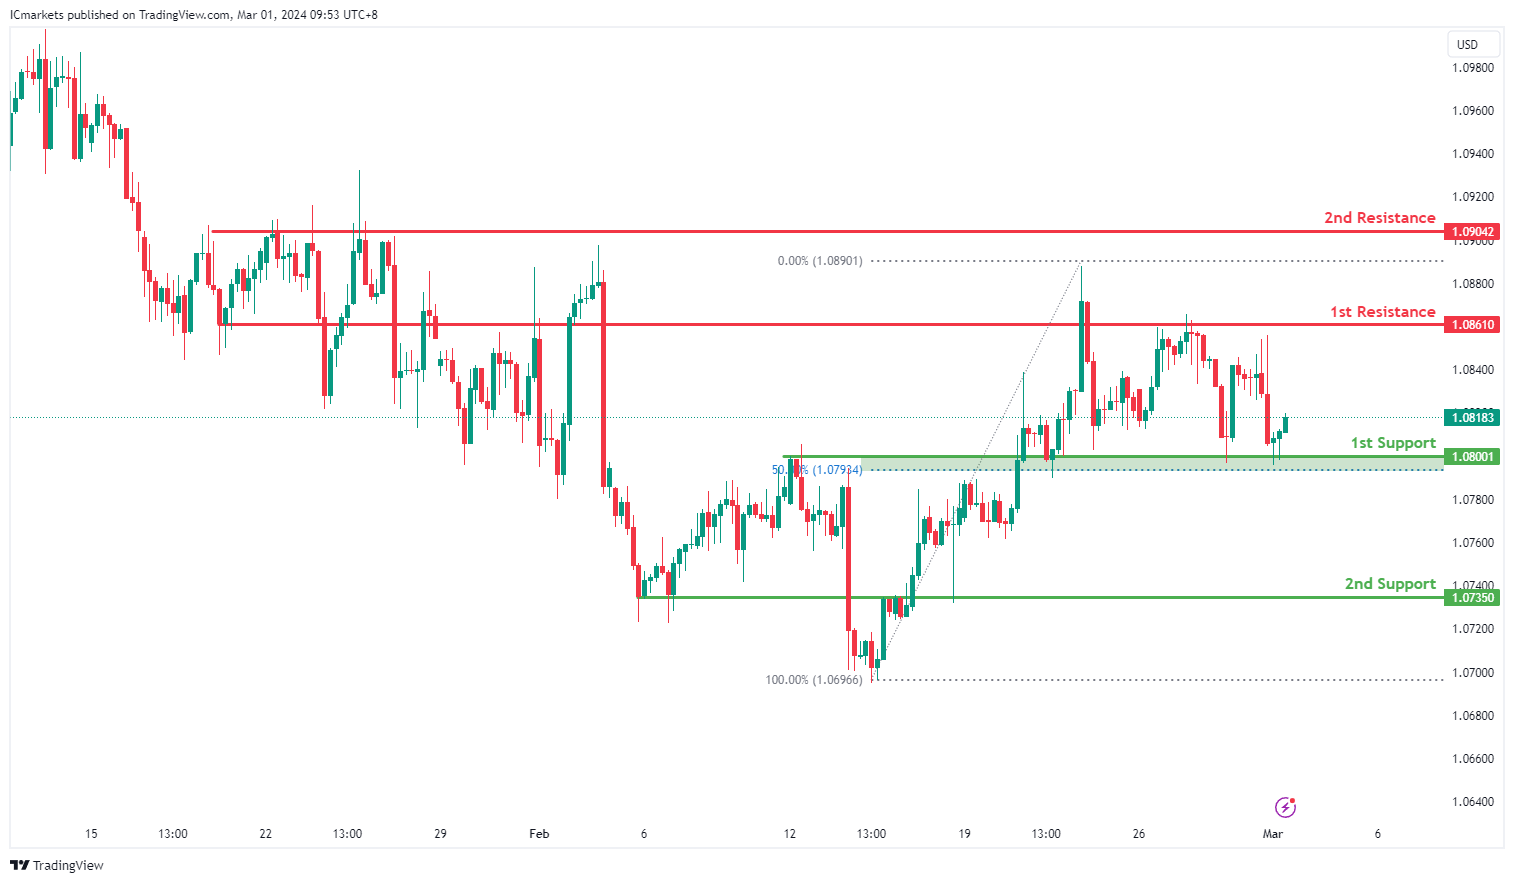
EUR/USD:
The EUR/USD chart exhibits bullish momentum, suggesting a potential bullish bounce off the 1st support level towards the 1st resistance.
The 1st support at 1.0800 is significant as an overlap support, indicating its historical significance as a level where buying interest has previously emerged to support the price. Traders may anticipate a potential rebound from this level given its historical relevance.
Additionally, the 2nd support at 1.0735 is also characterized as an overlap support, further reinforcing its importance as a level where buyers historically intervened to prevent further decline. This level provides additional confirmation of potential support.
On the resistance side, the 1st resistance level at 1.0861 is identified as an overlap resistance, suggesting its historical significance as a barrier where selling pressure may increase, potentially limiting upward movement in the short term.
Furthermore, the 2nd resistance at 1.0904 is noted for its presence as a multi-swing high resistance, further reinforcing its importance as a level where selling interest may intensify, potentially capping the upward movement of prices
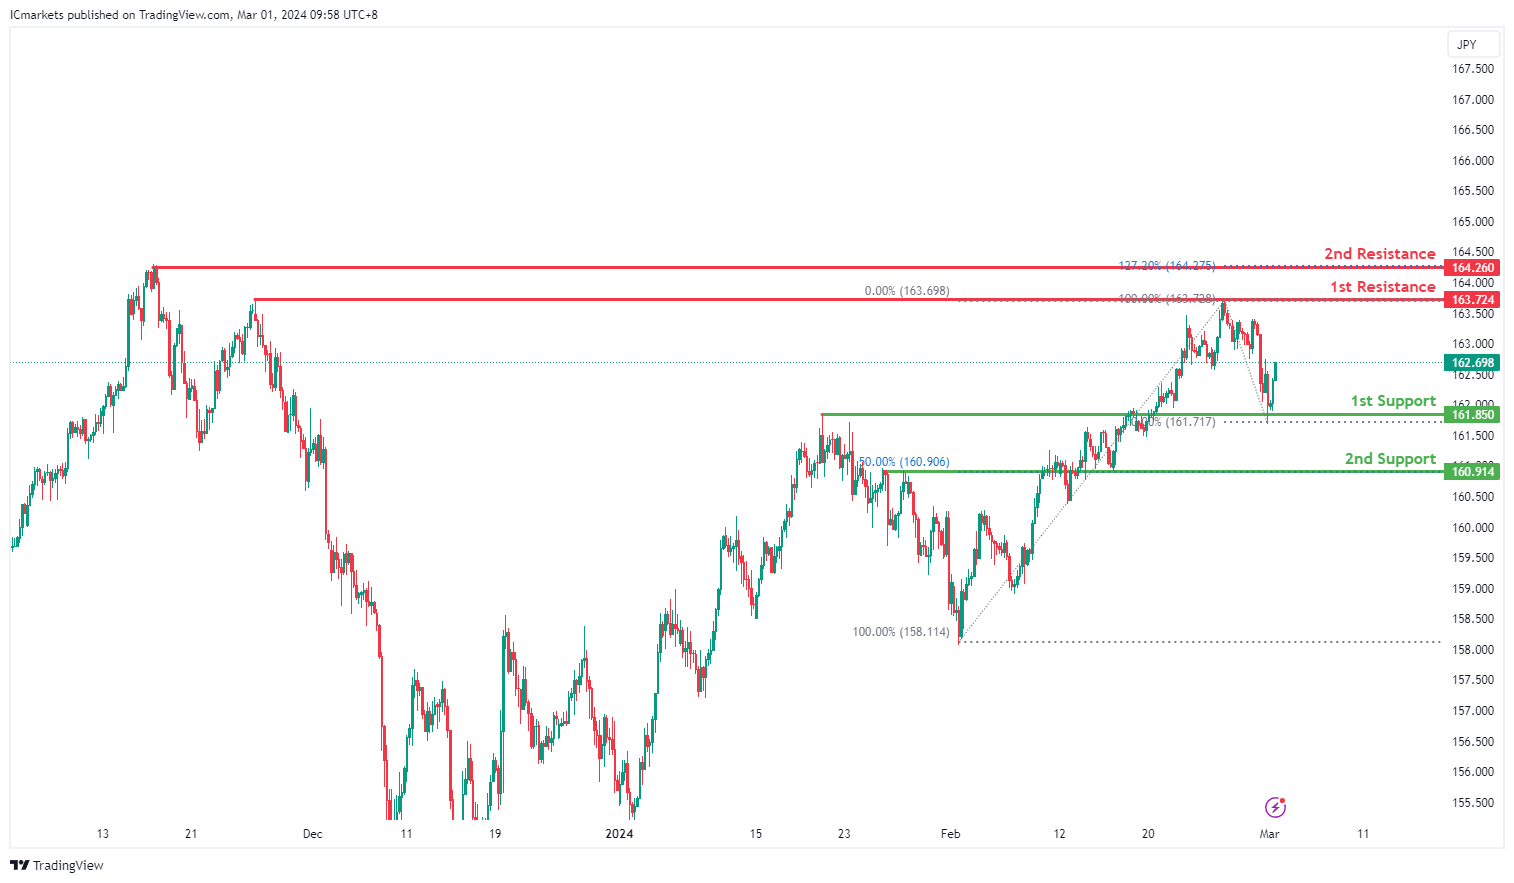
EUR/JPY:
The EUR/JPY chart reflects bullish momentum, suggesting a potential scenario of a bullish bounce off the 1st support level, leading towards the 1st resistance.
The 1st support at 161.85 is identified as an overlap support, indicating its historical significance as a level where buying interest has emerged previously, potentially providing support to the price.
Additionally, the 2nd support at 160.91 is characterized as an overlap support and aligns with the 50% Fibonacci Retracement level. This strengthens its significance as a potential support level where buyers may step in.
On the resistance side, the 1st resistance level at 163.72 is identified as a multi-swing high resistance, suggesting its historical importance as a barrier where selling pressure may increase, potentially limiting upward movement.
Furthermore, the 2nd resistance at 164.26 is noted as a swing high resistance and coincides with the 127.20% Fibonacci Extension level. This adds further weight to its significance as a level where selling interest may intensify.
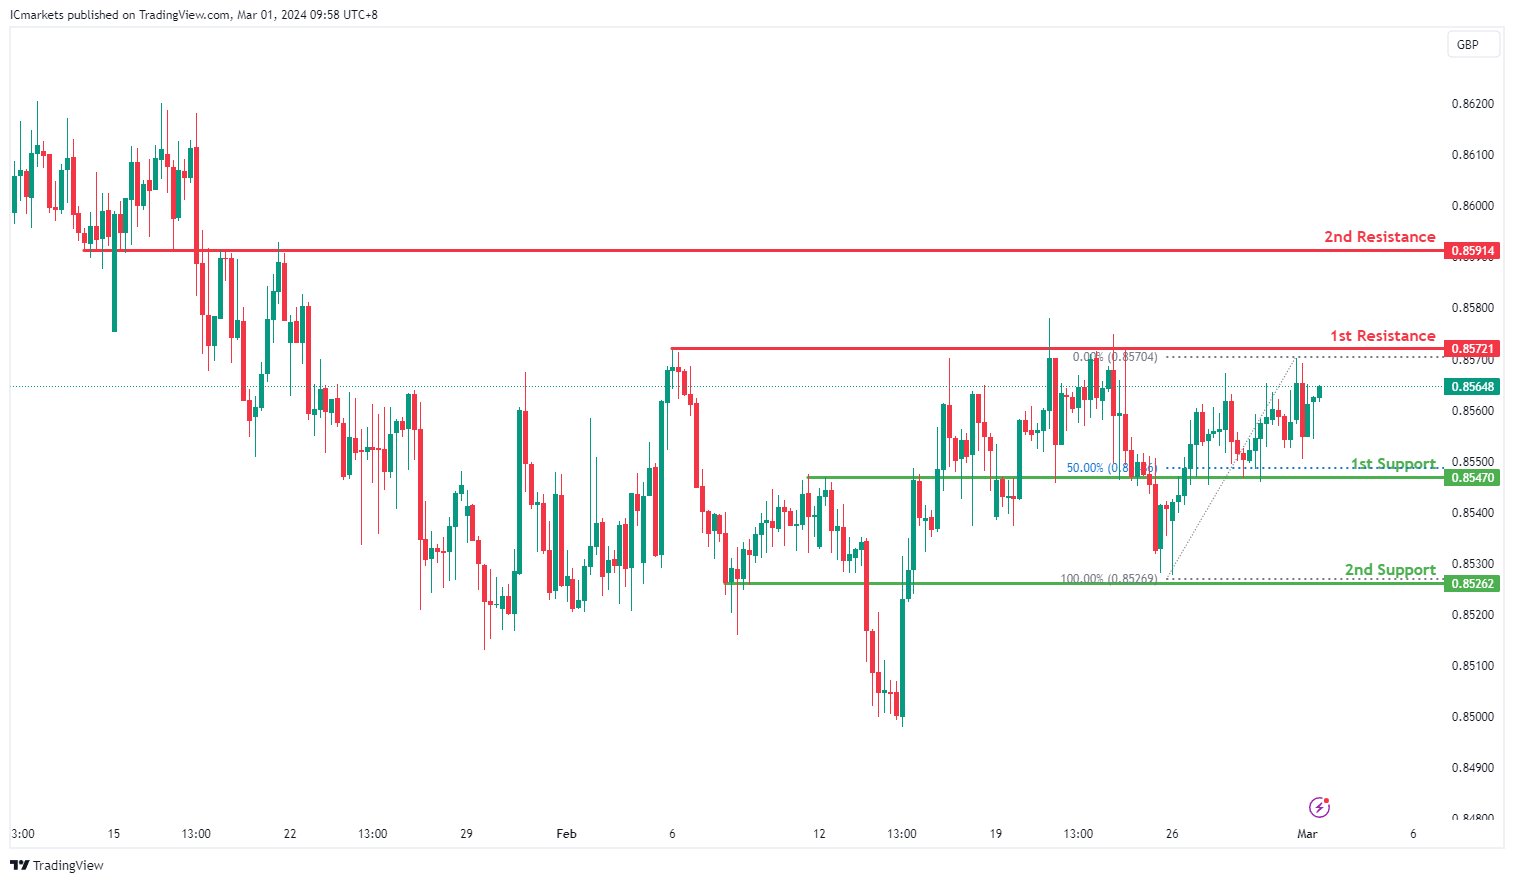
EUR/GBP:
The EUR/GBP chart currently demonstrates bullish momentum, suggesting a potential scenario of a bullish continuation towards the 1st resistance.
The 1st support level at 0.8547 is identified as an overlap support, indicating its historical significance as a level where buying interest has previously emerged, further reinforced by its alignment with the 50% Fibonacci Retracement level.
Moreover, the 2nd support at 0.8526 is also characterized as an overlap support, providing additional confirmation of potential support for the price.
On the resistance side, the 1st resistance level at 0.8572 is identified as a multi-swing high resistance, suggesting its historical importance as a barrier where selling pressure may increase, potentially limiting upward movement.
Additionally, the 2nd resistance at 0.8591 is noted as an overlap resistance, further solidifying its significance as a level where selling interest may intensify.
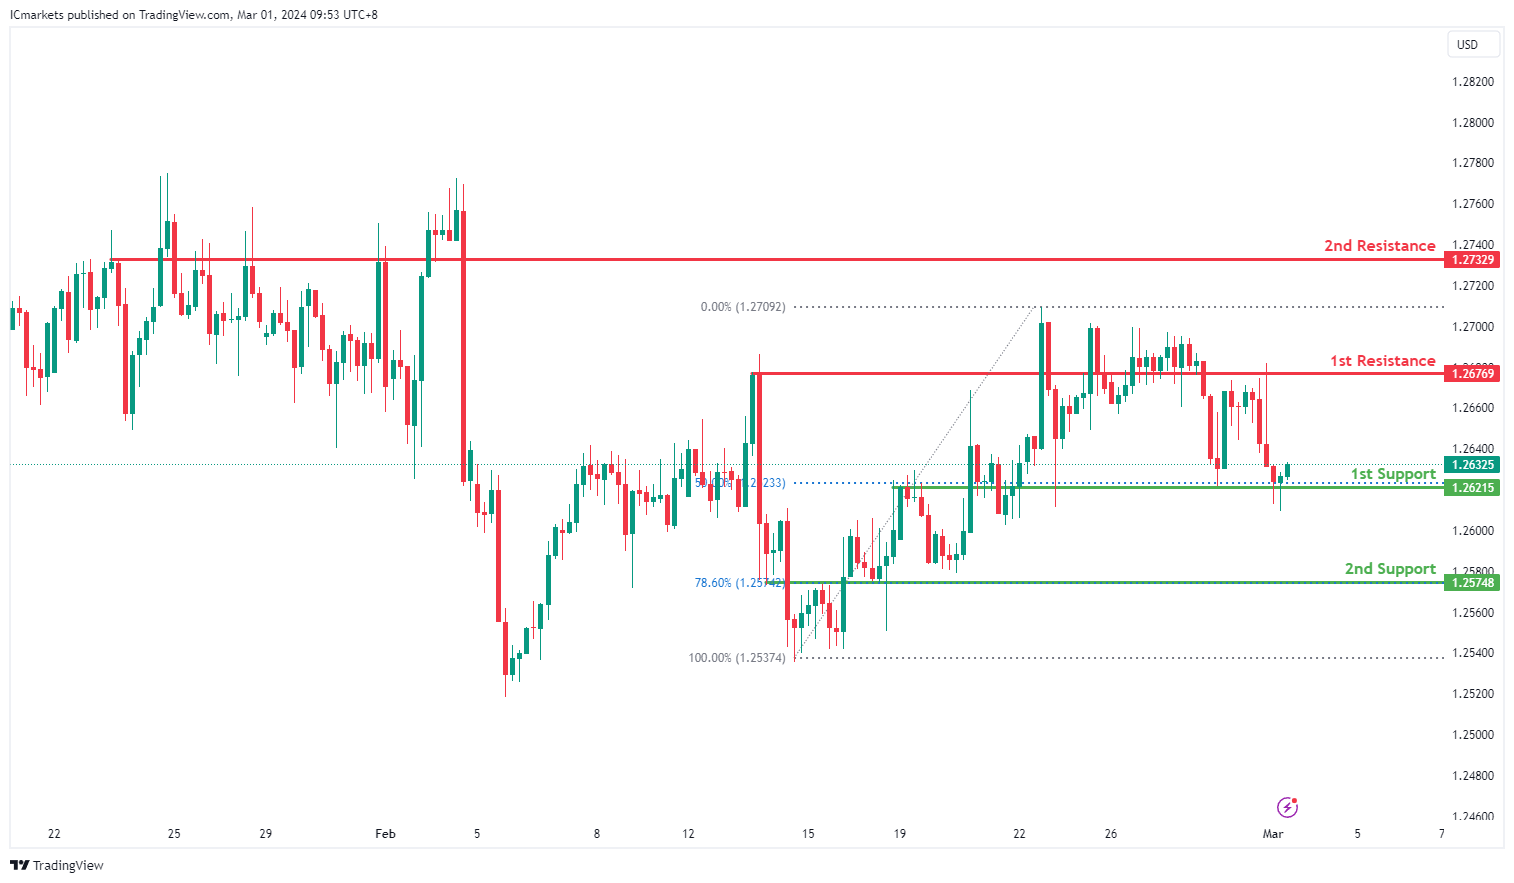
GBP/USD:
The GBP/USD chart indicates bullish momentum, suggesting a potential bullish bounce off the 1st support level towards the 1st resistance.
The 1st support at 1.2621 is significant as an overlap support, indicating its historical relevance as a level where buying interest has previously emerged to support the price. This level may attract buyers looking for opportunities to enter long positions.
Furthermore, the 2nd support at 1.2574 is characterized as an overlap support and coincides with the 78.60% Fibonacci retracement level, adding further significance to this support zone. It reinforces the potential for a bounce as historical buying interest aligns with Fibonacci retracement levels.
On the resistance side, the 1st resistance level at 1.2676 is identified as an overlap resistance, suggesting its historical significance as a barrier where selling pressure may increase, potentially limiting upward movement in the short term.
Additionally, the 2nd resistance at 1.2732 is noted as a pullback resistance, indicating its potential to act as a level where selling pressure may intensify, possibly leading to a temporary halt or reversal in price movement.
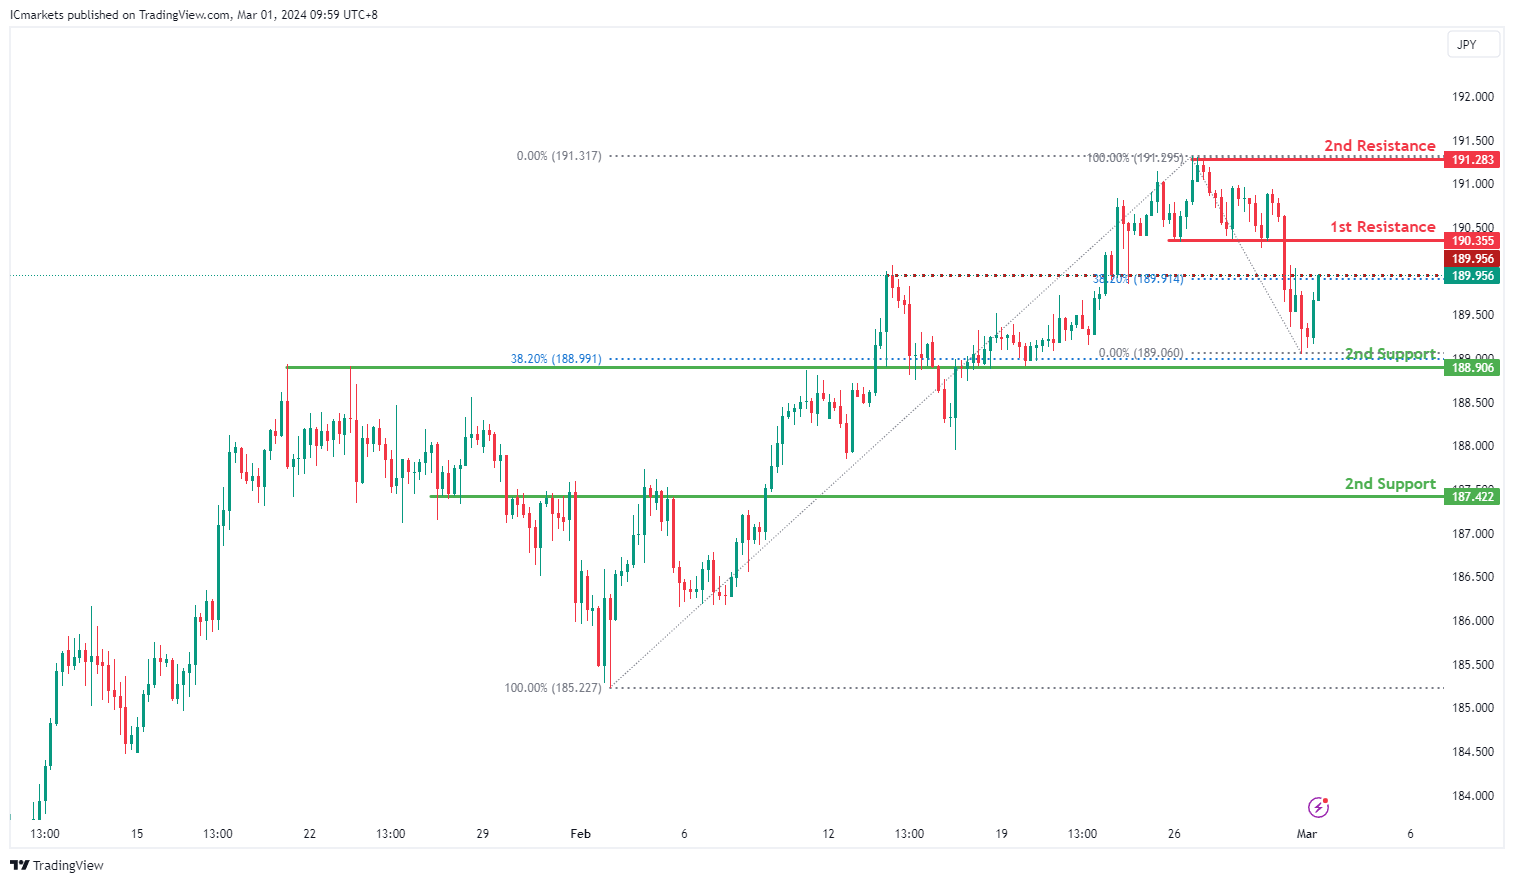
GBP/JPY:
The GBP/JPY chart currently exhibits bearish momentum, suggesting a potential scenario of a rise towards the 1st resistance in the short term before reversing off it and dropping towards the 1st support.
The 1st support level at 188.80 is identified as an overlap support, coinciding with the 38.20% Fibonacci Retracement level, which historically indicates a level where buying interest has emerged, offering potential support for the price.
Furthermore, the 2nd support at 187.42 is characterized as a pullback support, reinforcing its significance as a level where buyers have historically intervened to prevent further decline.
On the resistance side, the 1st resistance level at 190.35 is identified as a pullback resistance, suggesting its historical importance as a barrier where selling pressure may increase, potentially limiting upward movement in the short term.
Additionally, the 2nd resistance at 191.28 is noted as a multi-swing high resistance, further solidifying its significance as a level where selling interest may intensify.
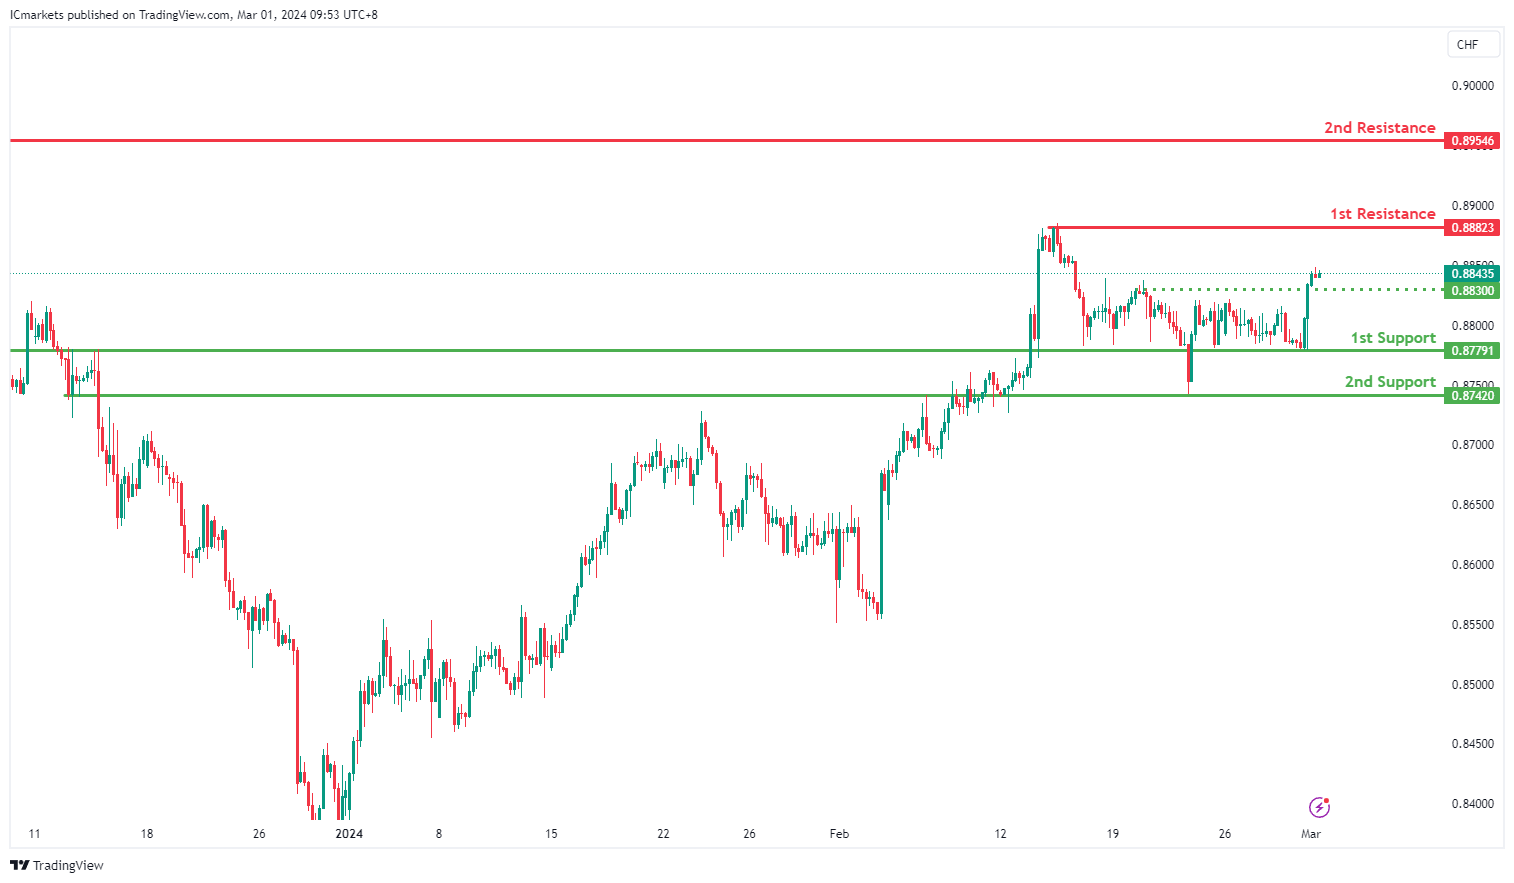
USD/CHF:
The USD/CHF chart indicates bullish momentum, suggesting a potential bullish continuation towards the 1st resistance level.
The 1st support at 0.8779 is significant as an overlap support, indicating its historical relevance as a level where buying interest has previously emerged to support the price. This level may attract buyers looking for opportunities to enter long positions.
Furthermore, the 2nd support at 0.8742 is also characterized as an overlap support, reinforcing its importance as a level where buyers have historically intervened to prevent further decline. This level provides additional confirmation of potential support.
On the resistance side, the 1st resistance level at 0.8823 is identified as a swing high resistance, suggesting its historical significance as a barrier where selling pressure may increase, potentially limiting upward movement in the short term.
Additionally, the 2nd resistance at 0.8954 is noted as a pullback resistance, indicating its potential to act as a level where selling pressure may intensify, possibly leading to a temporary halt or reversal in price movement.
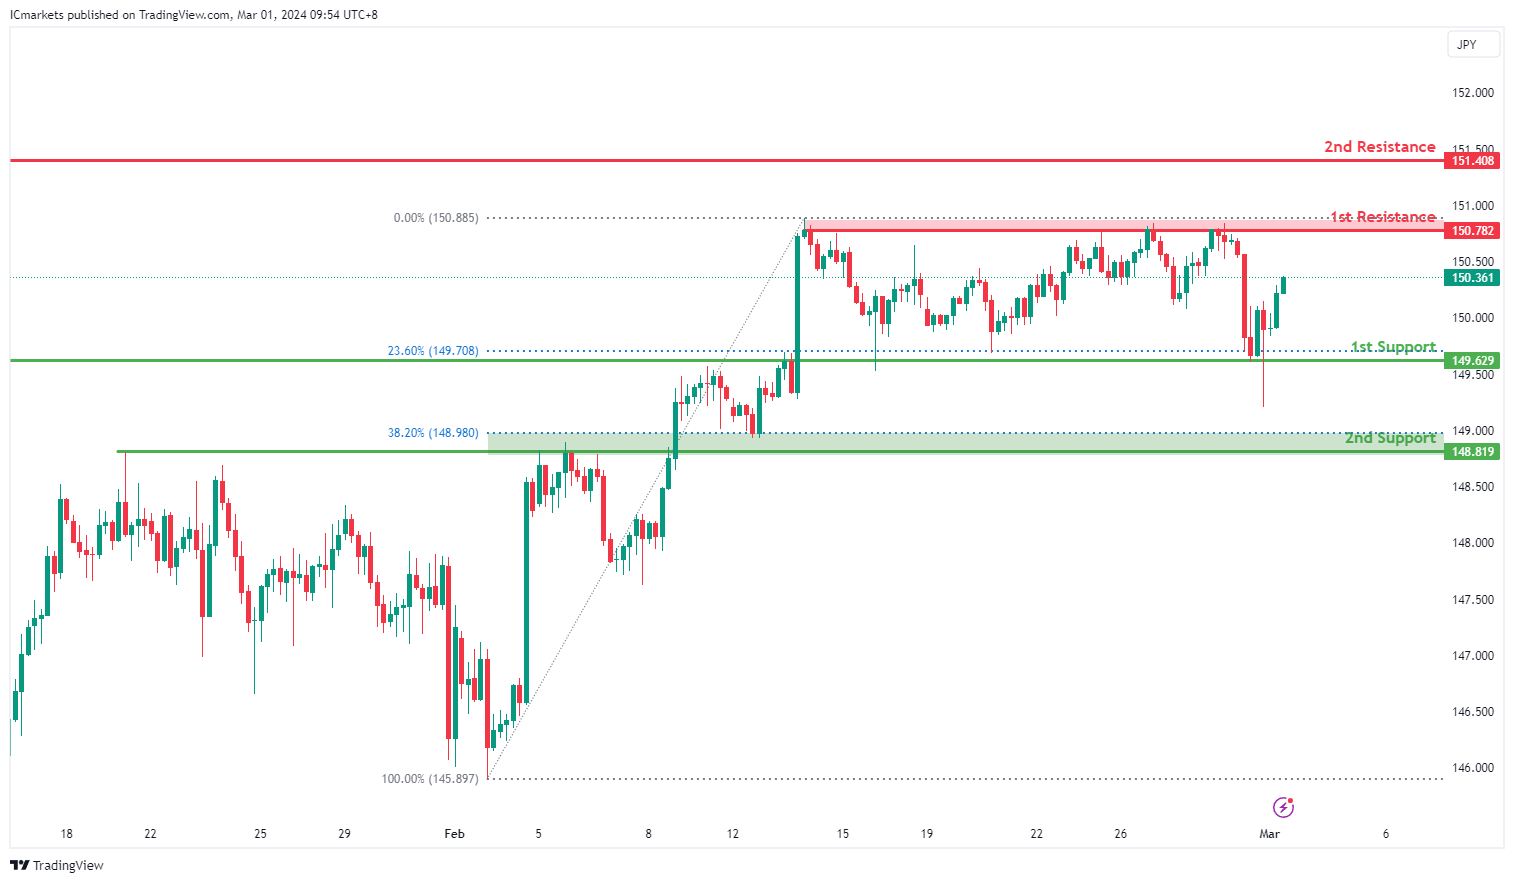
USD/JPY:
The USD/JPY chart reflects bullish momentum, suggesting a potential bullish continuation towards the 1st resistance level.
The 1st support at 149.62 is notable as an overlap support, indicating its historical significance as a level where buying interest has previously emerged, potentially providing support for the price. This level aligns with the 23.60% Fibonacci Retracement, adding to its significance as a potential support area.
Additionally, the 2nd support at 148.81 is identified as an overlap support, further reinforcing its importance as a level where buyers may step in to prevent further decline. This level corresponds to the 38.20% Fibonacci Retracement, providing additional confirmation of potential support.
On the resistance side, the 1st resistance level at 150.78 is characterized as a multi-swing high resistance, suggesting its historical significance as a level where selling pressure may increase, potentially limiting upward movement in the short term.
Furthermore, the 2nd resistance at 151.40 is noted as a swing high resistance, indicating its potential to act as a barrier where selling interest may intensify, possibly leading to a temporary halt or reversal in price movement.
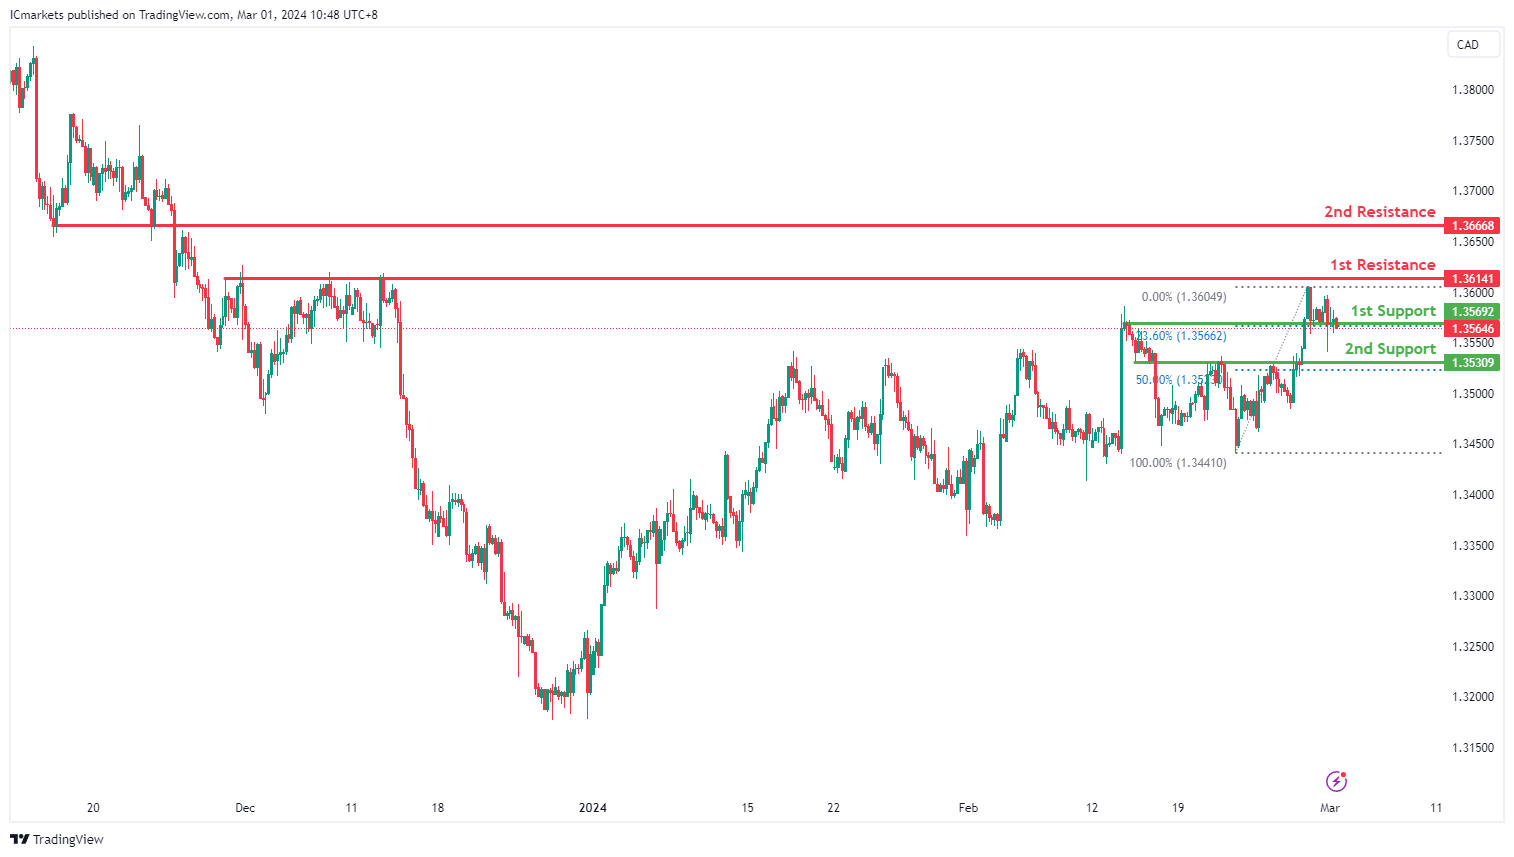
USD/CAD:
The USD/CAD chart currently exhibits an overall bearish momentum. In this context, there is a potential scenario for price to break below the 1st support and drop towards the 2nd support.
The 1st support level at 1.3569 is identified as an overlap support that aligns with the 23.60% Fibonacci retracement level. Further below, the 2nd support level at 1.3530 is also marked as an overlap support that aligns close to the 50.00% Fibonacci retracement level, reinforcing its significance as a key support level.
To the upside, the 1st resistance level at 1.3614 is identified as a pullback resistance. Higher up, the 2nd resistance level at 1.3666 is also marked as a pullback resistance, further highlighting its importance as a potential resistance zone.
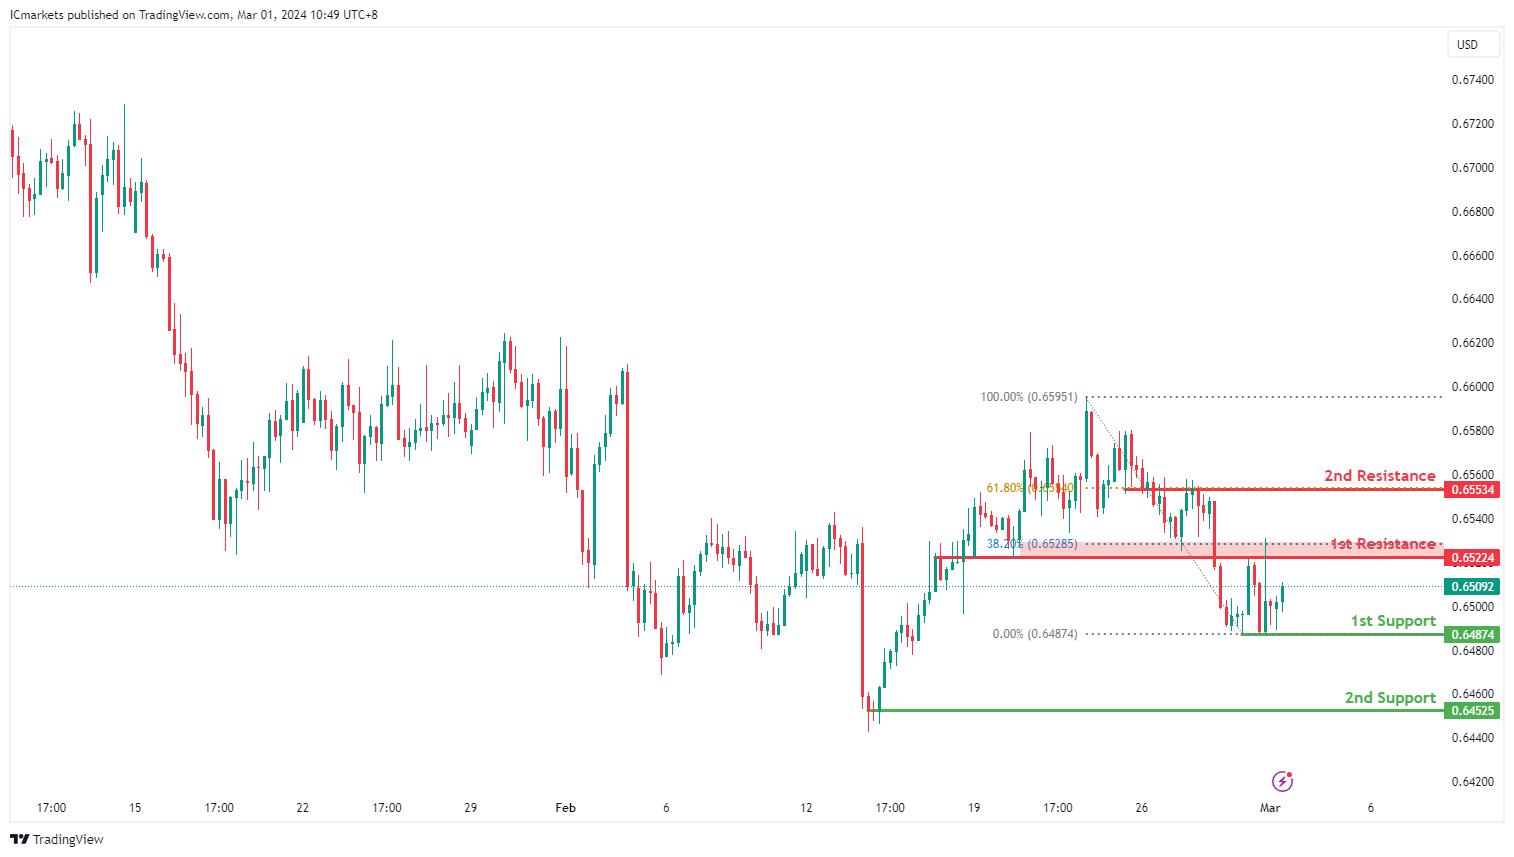
AUD/USD:
The AUD/USD chart currently exhibits an overall bearish momentum. However, there is a potential scenario for price to rise towards the 1st resistance before resuming the downtrend.
The 1st resistance level at 0.6522 is identified as an overlap resistance that aligns close to the 38.20% Fibonacci Retracement level. Higher up, the 2nd resistance level at 0.6553 is also noted as an overlap resistance that aligns with the 61.80% Fibonacci Retracement level, further highlighting its importance as a potential resistance zone.
To the downside, the 1st support level at 0.6487 is identified as a pullback support. Further below, the 2nd support level at 0.6452 is also marked as a pullback support, further emphasizing its importance as a potential support zone.
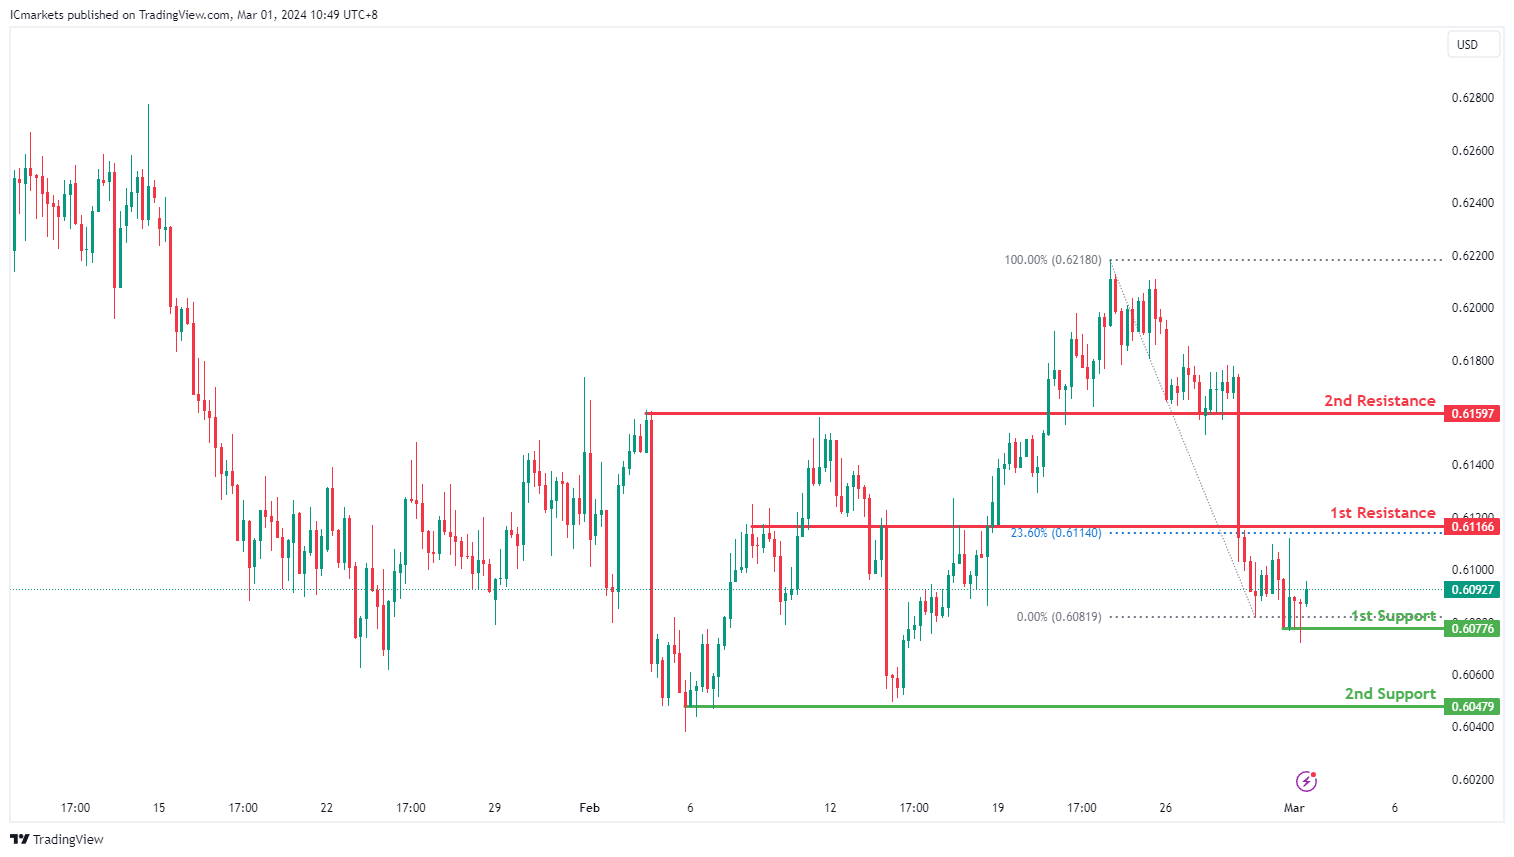
NZD/USD
The NZD/USD chart currently exhibits an overall bearish momentum. However, there is a potential scenario for price to rise towards the 1st resistance before resuming the downtrend.
The 1st resistance level at 0.6116 is identified as an overlap resistance that aligns with the 23.60% Fibonacci Retracement level. Higher up, the 2nd resistance level at 0.6159 is also noted as an overlap resistance, further highlighting its importance as a potential resistance zone.
To the downside, the 1st support level at 0.6077 is identified as a pullback support. Further below, the 2nd support level at 0.6047 is also marked as a pullback support, further emphasizing its importance as a potential support zone.
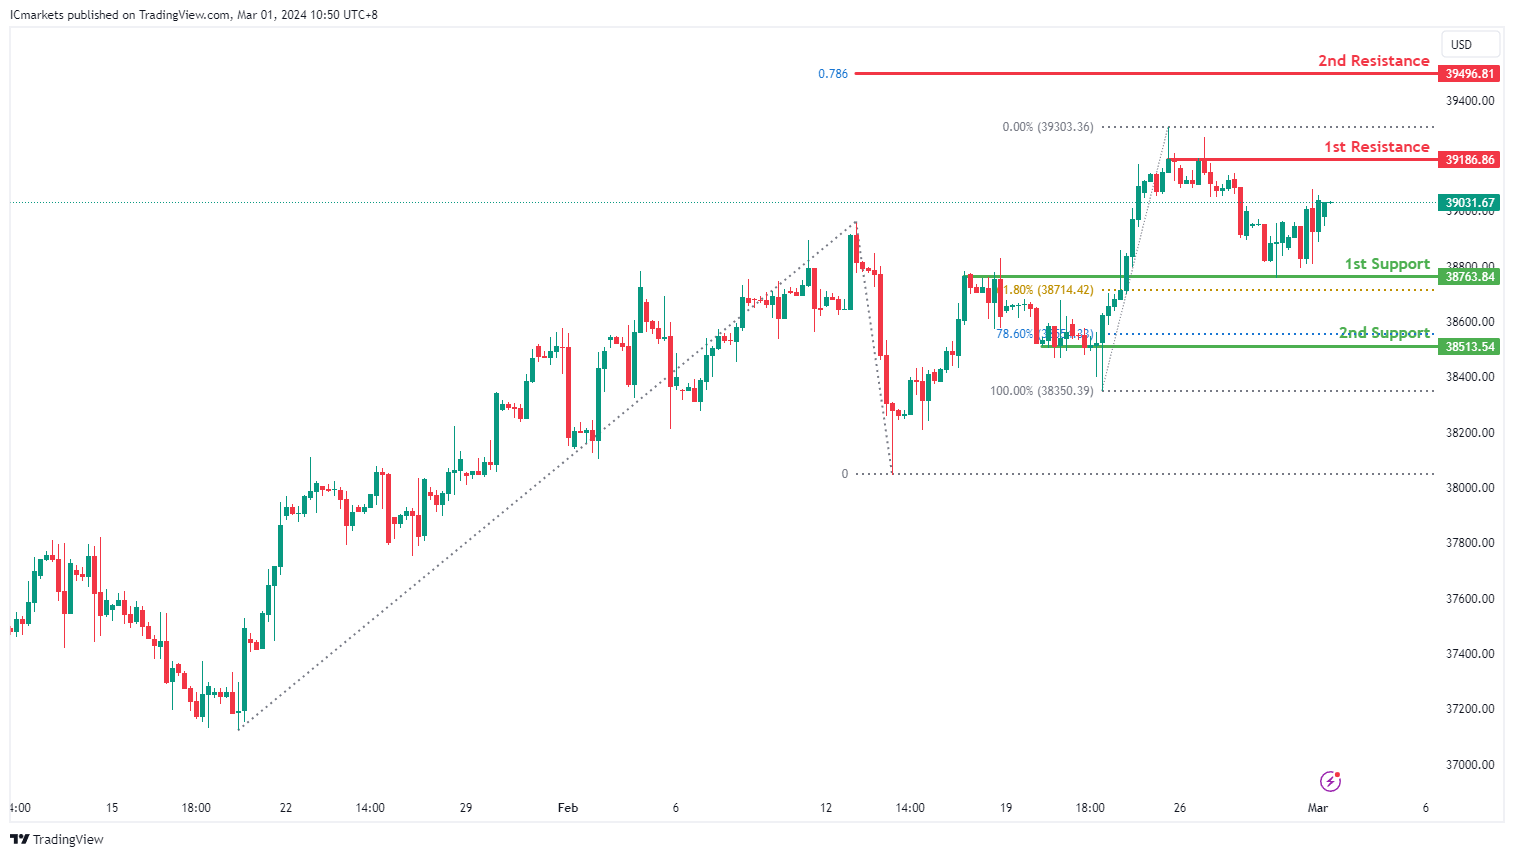
DJ30:
The DJ30 chart currently exhibits an overall bullish momentum. In this context, there is a potential scenario for price to make a bullish continuation towards the 1st resistance.
The 1st resistance level at 39,186.86 is identified as a pullback resistance. Higher up, the 2nd resistance level at 39,496.81 is noted as a resistance that aligns with the 78.60% Fibonacci Projection level, adding to its significance as a potential barrier to further bullish movement.
On the support side, the 1st support level at 38,763.84 is identified as an overlap support that aligns close to the 61.80% Fibonacci Retracement level. Further below, the 2nd support at 38,513.54 is marked as a pullback support that aligns close to the 78.60% Fibonacci Retracement level, further reinforcing its significance as a potential level of support.
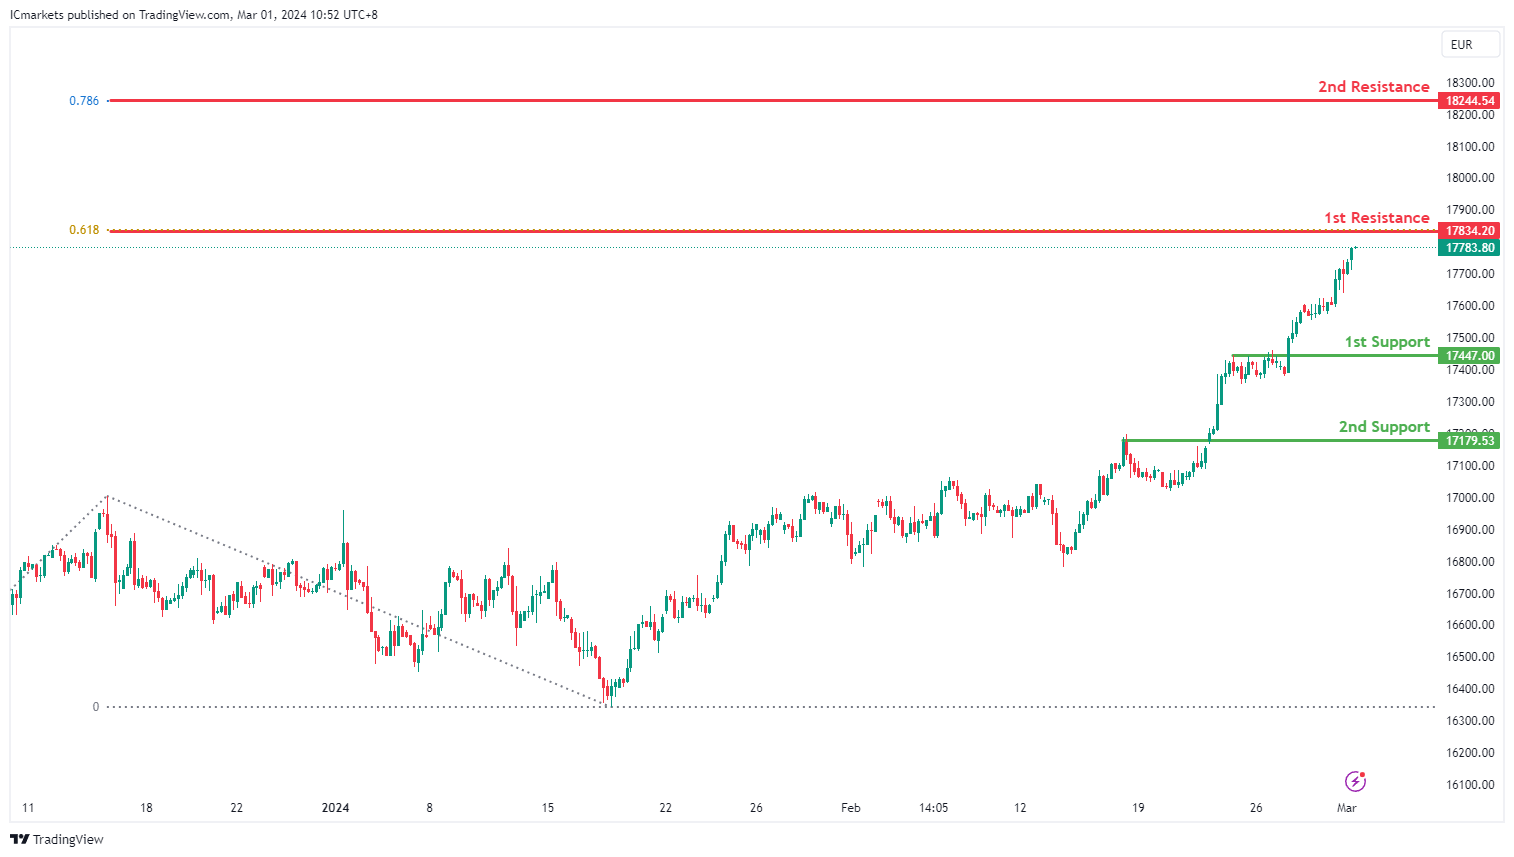
GER40:
The GER40 chart currently demonstrates an overall bullish momentum, suggesting a potential continuation of the upward trend towards the 1st resistance.
The 1st resistance level at 17,834.20 is identified as a resistance that aligns with the 61.80% Fibonacci Projection level. Higher up, the 2nd resistance level at 18,244.54 is marked as a resistance that aligns with the 78.60% Fibonacci Projection level, adding to its significance as a potential barrier to further bullish movement.
On the support side, the 1st support level at 17,447.00 is identified as a pullback support. Additionally, the 2nd support level at 17,179.53 is also noted as a pullback support, further reinforcing its importance as a potential area of support.
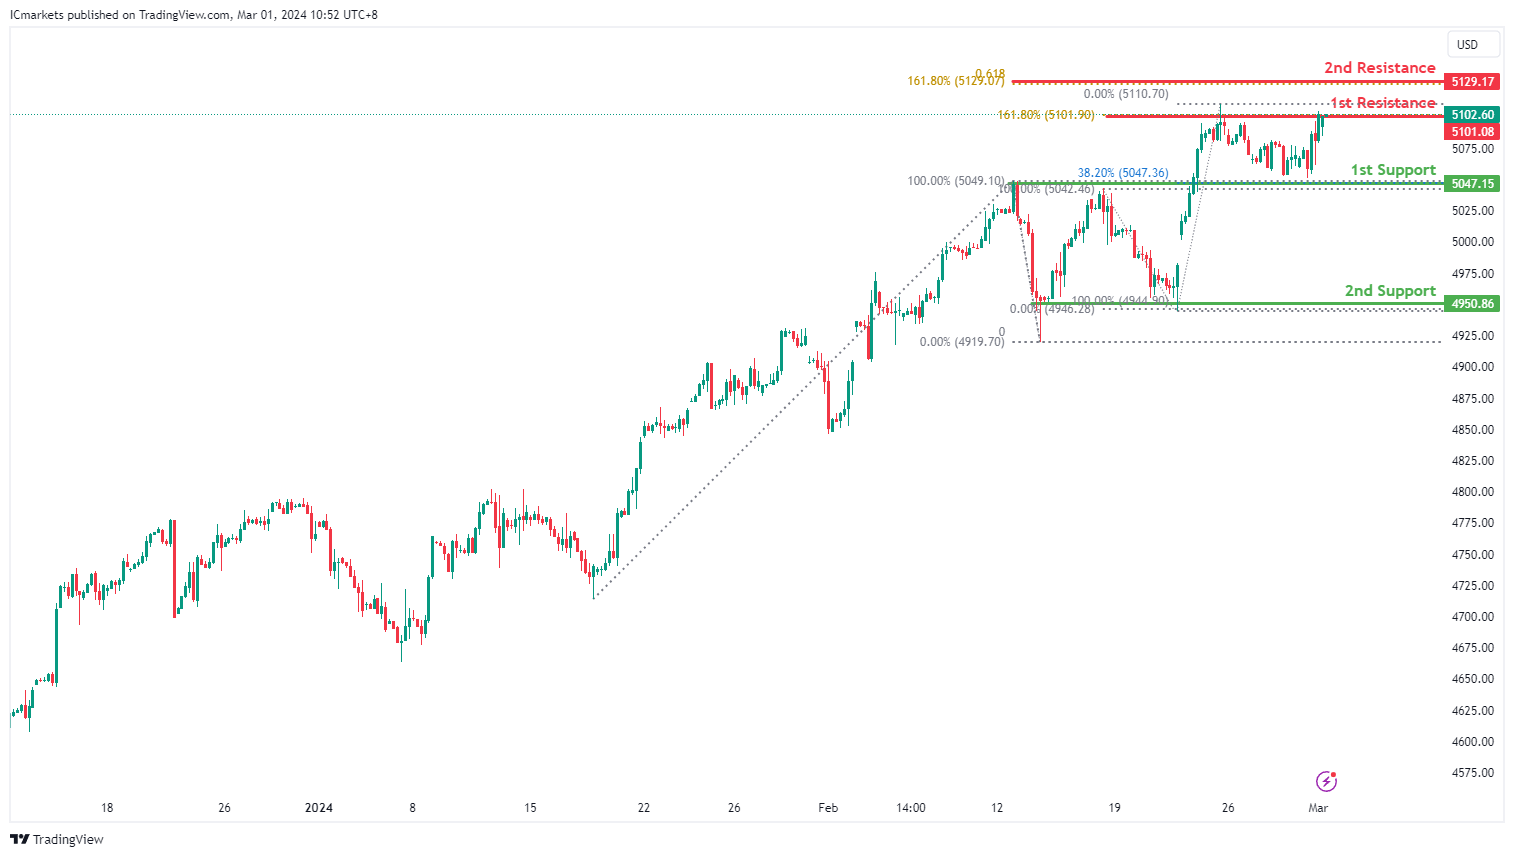
US500:
The US500 chart currently demonstrates an overall bullish momentum. In this context, there is a potential scenario for price to break above the 1st resistance and rise towards the 2nd resistance.
The 1st resistance level at 5,101.08 is identified as a pullback resistance that aligns with the 161.80% Fibonacci Extension level. Higher up, the 2nd resistance level at 5,129.17 is noted as a resistance that aligns with a confluence of Fibonacci levels i.e. the 61.80% Projection and the 161.80% Extension, adding to its significance as a potential barrier to further bullish movement.
On the support side, the 1st support level at 5,047.15 is identified as an overlap support that aligns with the 38.20% Fibonacci Retracement level. Further below, the 2nd support level at 4,950.86 is marked as a pullback support, further reinforcing its significance as a potential area of support.
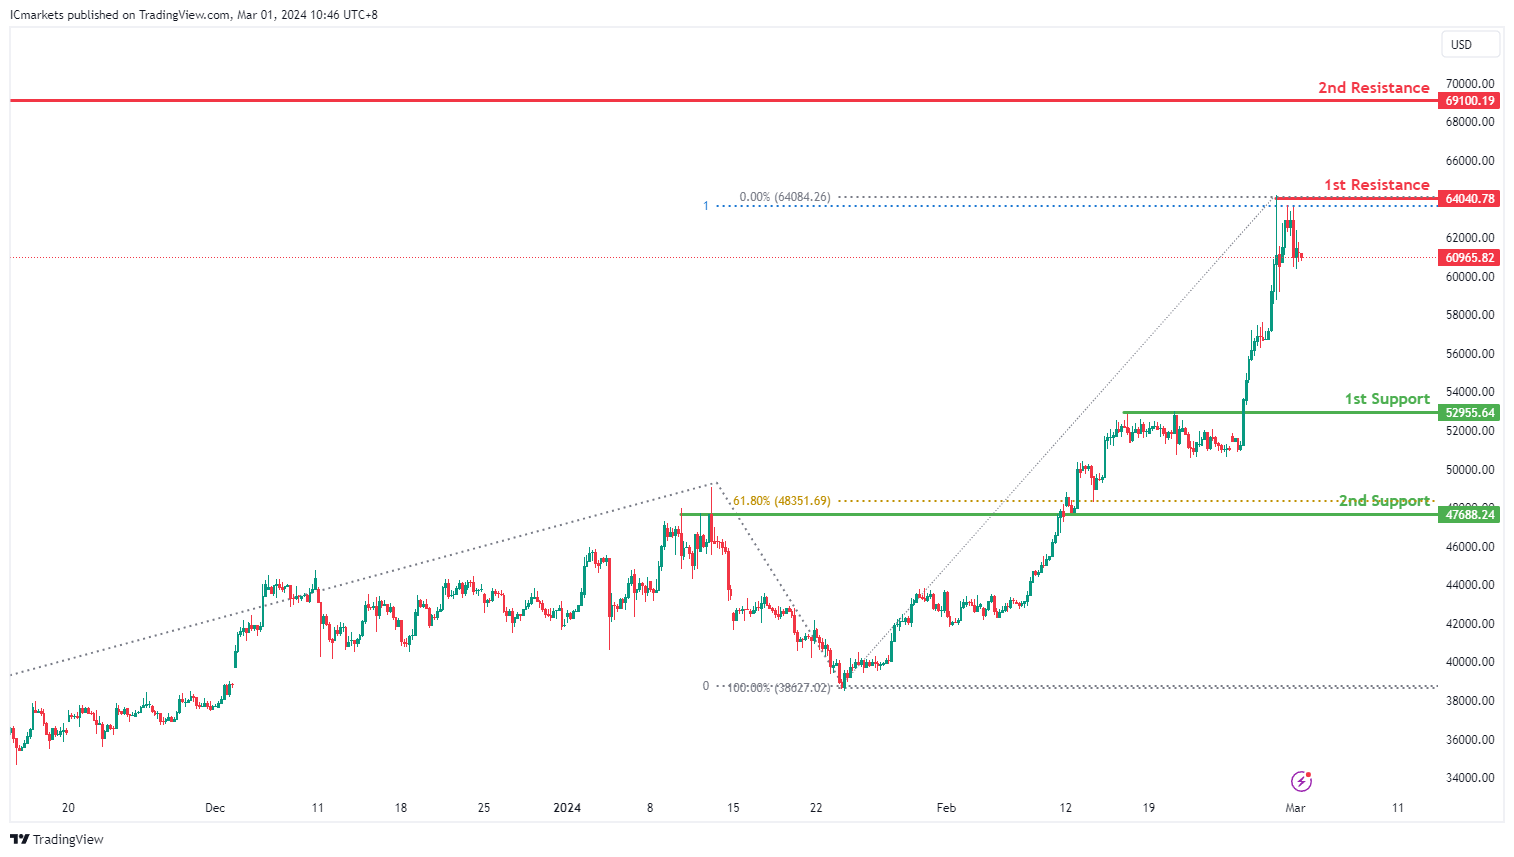
BTC/USD:
The BTC/USD chart currently demonstrates an overall bullish momentum, suggesting a potential continuation of the upward trend towards the 1st resistance.
The 1st resistance level at 64,040.78 is identified as a pullback resistance that aligns with the 100.00% Fibonacci Projection level. Higher up, the 2nd resistance level at 69,100.19 is noted as a swing-high resistance at the all-time high, adding to its significance as a potential barrier to further bullish movement.
On the support side, the 1st support level at 52,955.64 is identified as a pullback support. Further below, the 2nd support level at 47,688.24 is marked as an overlap support that aligns close to the 61.80% Fibonacci Retracement level, further reinforcing its significance as a potential area of support.
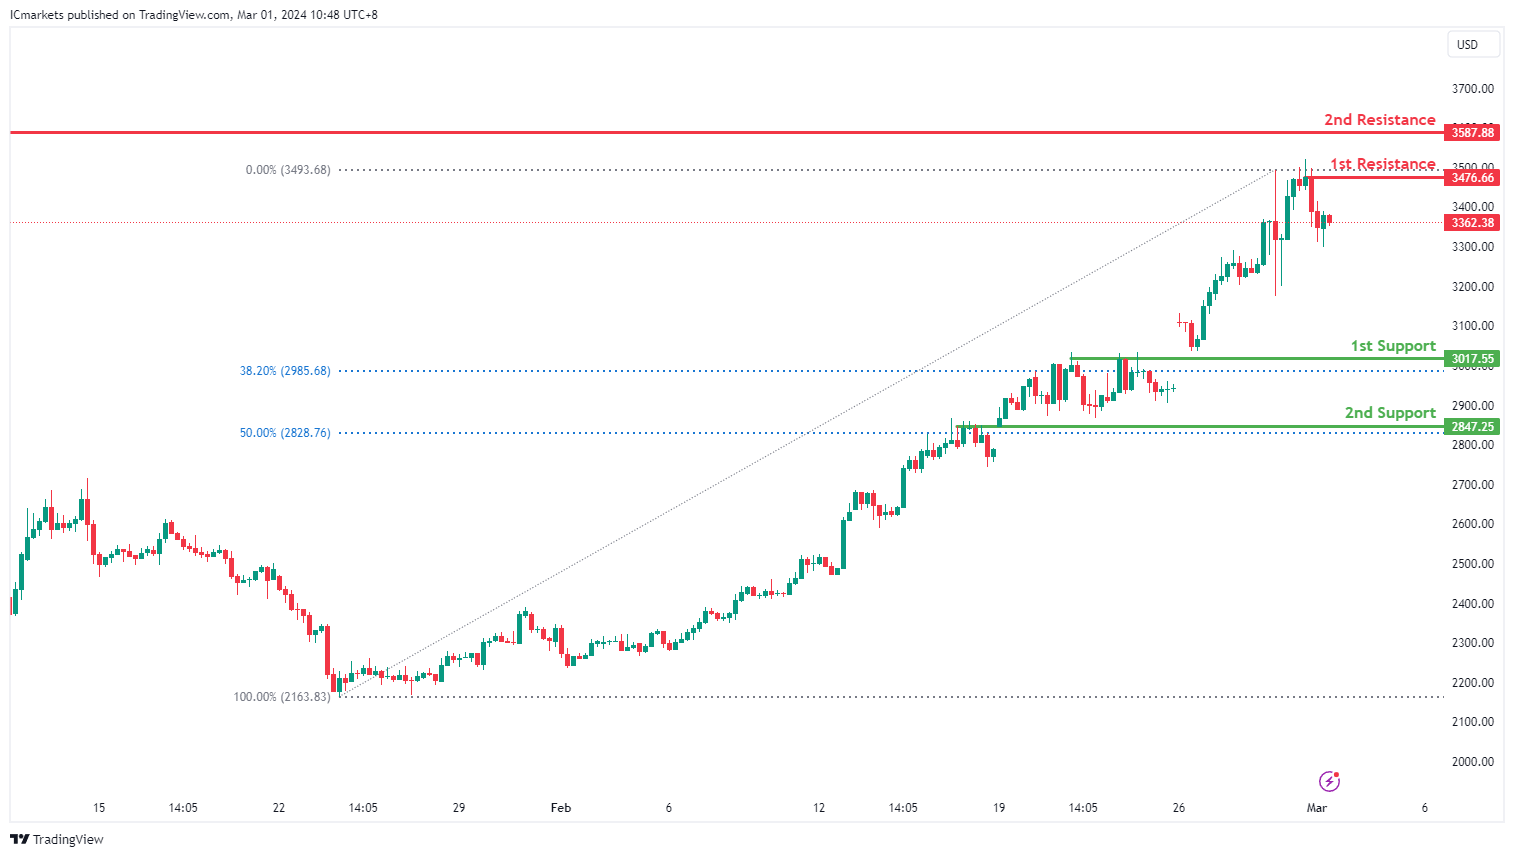
ETH/USD:
The ETH/USD chart currently demonstrates an overall bullish momentum, suggesting a potential continuation of the upward trend towards the 1st resistance.
The 1st resistance level at 3,476.66 is identified as a pullback resistance. Higher up, the 2nd resistance level at 3,587.88 is noted as an overlap resistance, adding to its significance as a potential barrier to further bullish movement.
On the support side, the 1st support level at 3,017.55 is identified as an overlap support that aligns close to the 38.20% Fibonacci Retracement level. Further below, the 2nd support level at 2,847.25 is also marked as an overlap support that aligns with the 50.00% Fibonacci Retracement level, further reinforcing its significance as a potential area of support.
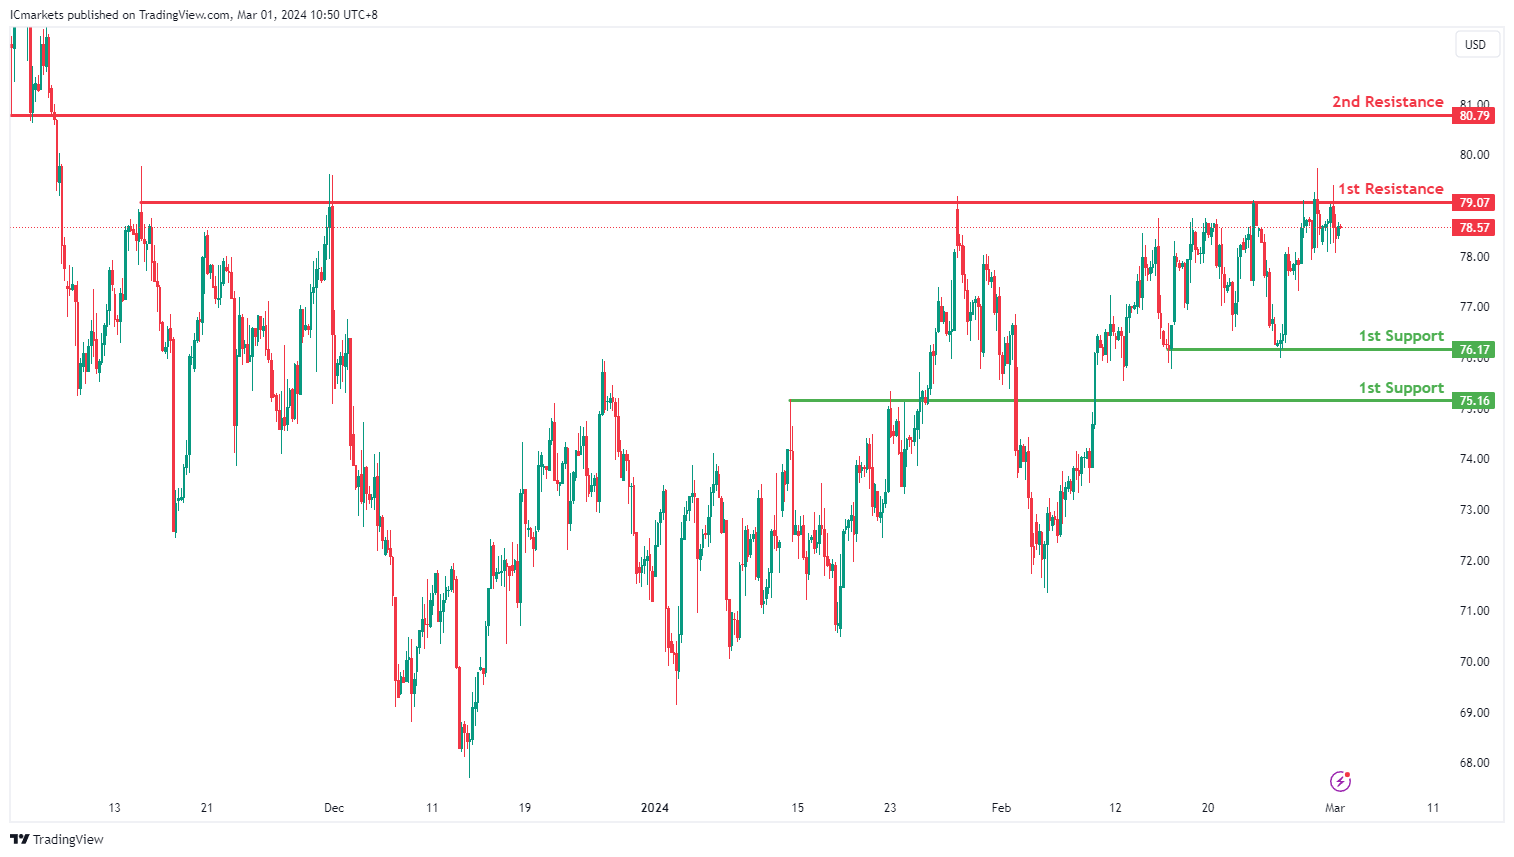
WTI/USD:
The WTI (West Texas Intermediate) chart currently exhibits a neutral bias. In this context, there is a potential scenario for price to fluctuate between the 1st support and the 1st resistance.
The 1st resistance level at 79.07 is identified as a multi-swing-high resistance. Higher up, the 2nd resistance level at 80.79 is marked as a pullback resistance, further highlighting its importance as a potential resistance zone.
To the downside, the 1st support level at 76.17 is identified as a pullback support. Further below, the 2nd support level at 75.16 is also marked as a pullback support, reinforcing its significance as a key support level.
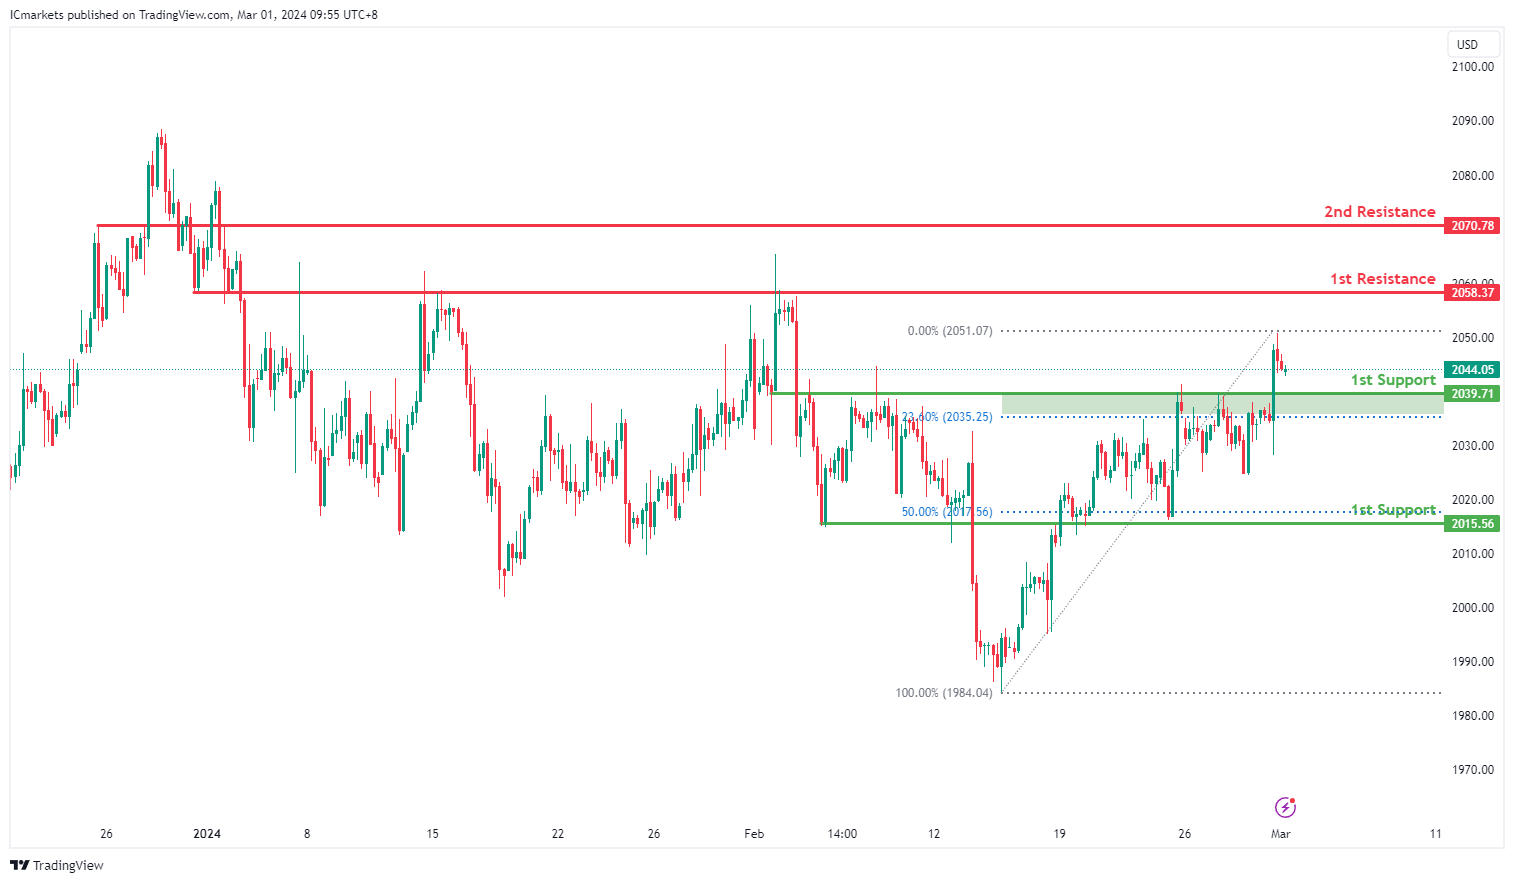
XAU/USD (GOLD):
The XAUUSD chart indicates bullish momentum, with a potential scenario of a short-term drop to the 1st support level before bouncing and rising towards the 1st resistance level.
The 1st support level at 2039.71 is considered a pullback support, aligning with the 23.60% Fibonacci Retracement. This level has historical significance as a point where buyers have previously entered the market, potentially providing support to the price.
Additionally, the 2nd support at 2015.56 is identified as an overlap support and coincides with the 50% Fibonacci Retracement. This further strengthens its potential as a significant level of support where buying interest may emerge.
On the resistance side, the 1st resistance level at 2058.37 is characterized as an overlap resistance, indicating its historical significance as a barrier where selling pressure may increase, potentially limiting upward movement in the short term.
Furthermore, the 2nd resistance at 2070.78 is also identified as an overlap resistance, suggesting its potential to act as a significant level where selling interest may intensify, potentially capping the upward movement of prices.
Cliff Notes: Capacity’s Criticality
Key insights from the week that was.
In Australia, the Monthly CPI Indicator fell 0.3% in January, leaving the annual rate unchanged at 3.4%yr. Goods prices – which constitute the bulk of the new information at this point in the quarter – reportedly fell 0.2% in the month, marking three monthly declines in this category since October. The main driver of the softness in headline inflation, however, was the often-volatile holiday travel and electricity prices. Highlighting the effectiveness of Government rebates in limiting the pass-through of energy inflation to households, electricity prices would have been up 15.3%yr sans rebates versus 0.8%yr. Based on the partial information presented in this update, risks to our Q1 CPI forecast of 0.7% (3.4%yr) look balanced. Next month will provide an update on more services components.
While the disinflationary process will offer more support for households in time, the consumer is currently in a fragile state. In January, retail sales rose 1.1%; but, given weakness in prior months, annual growth is just 1.4%yr, well below the rate of inflation and population growth. The interplay between employment, wage and price growth will be critical for spending over the coming year. Perceptions of wealth and comfort with the liabilities held against housing assets are also critical. For a deep-dive into the prospects for Australia’s housing market and its implications for sentiment, see our latest Housing Pulse.
In the lead-up to next week’s Q4 GDP report, the ABS also released two partial indicators of investment this week. Construction activity lifted 0.7% in Q4, in line with expectations. The easing in the growth pace is consistent with a maturing cycle, as the impetus from pandemic-era disruptions and supportive policy measures, which drove the initial ‘jump’ in project starts, fades. The detail continues to highlight a strong contribution from public works (+4.9%), centred on infrastructure projects. Momentum in the private sector is a stark contrast (–1.0%) due to broad-based weakness in new dwelling construction and renovations, partially offset by continued gains in non-residential building work.
The Q4 Capex survey subsequently reported a 0.8% lift in capital expenditure. While an upside surprise relative to our expectations for the quarter, momentum was clearly lost from H1 2023 to H2 2023. Equipment spending, which feeds into GDP, fell 0.1%, while building and structures rose 1.5%. On spending intentions, the fifth estimate for 2023/24 CAPEX plans remained optimistic, up around 12% compared to the fifth estimate a year ago. In our view, that implies a 10% rise in nominal CAPEX spending over the financial year – though given the strength of inflation in the sector, this likely equates to flat real spending over 2023/24.
Factoring in this partial information and the significant decline in hours worked, we have revised down our Q4 GDP forecast and now anticipate a flat result for the quarter. Our Q4 GDP preview is available at Westpac IQ. Taking a longer-term view, Chief Economist Luci Ellis’ essay this week investigates the lingering effects of the pandemic and evolving structural dynamics for activity and inflation.
Over in the US, the PCE deflator was as expected in January, prices rising 0.3%. Durable goods prices’ contribution was effectively nil in the month, while a further decline in energy prices saw non-durable goods subtract from headline inflation. For both headline and core, revisions to the December outcome (revised down from 0.2% to 0.1%) further eased the path for annual inflation, now 2.4% and 2.8% respectively from 2.6% and 2.9% in December. Overall, PCE inflation remains on track to reach target around mid-year.
The PCE release also reported that consumer incomes jumped 1.0%mth in January. However, this upside surprise was the result of a one-off lift in government transfers, 2.6%mth. Disposable personal income, which nets out taxes and transfers, instead grew 0.3%mth, in line with H2 2023. Real consumer spending meanwhile edged down 0.1%mth driven by a 1.1% decline in goods consumption as services remained robust. From a year ago, spending is now up only 2.1%, a below-trend rate. A low savings rate and soft real income growth point to sub-par momentum hence.
In Asia, Japan’s CPI eased to 2.2%yr in January driven by declining energy prices and easing food prices. Government subsidies alongside easing import prices (Japan imports most of its food) are aiding inflation’s deceleration. The Tokyo CPI, which is released weeks prior to the National CPI, tends to be a good predictor of the National result. However, the gap between the two series has grown in recent months, suggesting a degree of stickiness is emerging outside the capital. As incomes tend to be lower outside capital cities, persistence in inflation there is likely to have a disproportionate effect on spending.
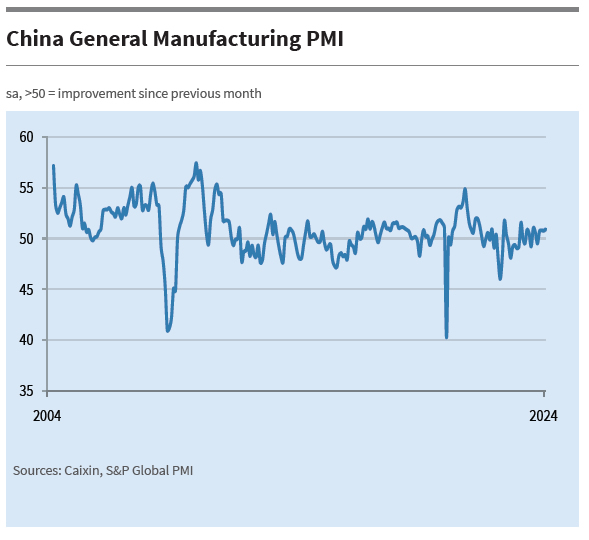
Finally, to the just-released February China NBS PMIs. Both the manufacturing and services variants were broadly in line with expectations and the January outcomes, at 49.1 and 51.4 respectively. For manufacturing, output was down slightly, but new orders and employment were unchanged. Employment was also unchanged for services. Lunar New Year anecdotes point to more consumers being willing to spend; but to see this trend sustained and per capita consumption lift, incomes need to be on a steady uptrend. A little forward-looking optimism over household wealth wouldn’t hurt either. How investment and production begin the new Lunar Year will be of great significance
China’s NBS PMI manufacturing falls slightly to 49.1, Caixin manufacturing rises to 50.9
China's manufacturing sector continued its contraction for the fifth consecutive month in February, with official NBS PMI decreasing slightly from 49.2 to 49.1, matched expectations.
New orders subindex remained steady at 49, indicating stagnant demand. New export orders fell further from 47.2 to 46.3, reflecting ongoing pressures on the export front.
NBS PMI Non-Manufacturing rose from 50.7 to 51.4 , surpassing the anticipated 50.8. PMI Composite remained unchanged at 50.9.
In parallel, Caixin PMI Manufacturing, which focuses more on small and medium-sized enterprises, edged up from 50.8 to 50.9 , slightly above expectations of 50.7.
Caixin noted sustained increase in output and new orders, with firms expressing improved business optimism for the second consecutive month. Additionally, input cost inflation declined to a seven-month low, while selling prices fell.
RBNZ’s Orr: Restrictive policy to stay, expects normalization next year
RBNZ Governor Adrian Orr affirmed today that the economy is "evolving as anticipated", with inflation expectations declined. However, he reiterated inflation "is still too high".
The governor emphasized the necessity of maintaining a restrictive monetary policy stance "for some time." He added that he expects to "begin normalizing policy in 2025."
Japan’s PMI manufacturing finalized at 47.2, worst since Aug 2020
Japan's PMI Manufacturing was finalized at 47.2 in February, down from January's 48.0. This marks the ninth consecutive month of contraction, presenting the most significant downturn since August 2020.
According to S&P Global, the decline was characterized by sharper falls in both output and new orders. Additionally, the sector experienced the most substantial decline in employment seen in over three years, indicating that the downturn is having a tangible impact on workforce. Furthermore, rate of increase in output prices slowed to the lowest level since June 2011, suggesting that price pressures are easing amid weakened demand.
USD/JPY Retreats Lower As Dollar Bulls Take Back Seat
Key Highlights
- USD/JPY failed to clear the 150.85 resistance zone.
- It traded below a connecting bullish trend line with support at 150.30 on the 4-hour chart.
- Gold prices are moving higher above the $2,035 resistance.
- The US ISM Manufacturing Index could increase from 49.1 to 49.5 in Feb 2024.
USD/JPY Technical Analysis
The US Dollar remained well-bid above the 148.50 level against the Japanese Yen. USD/JPY climbed above 150.00 but struggled to continue higher above 150.85.
Looking at the 4-hour chart, the pair formed a high at 150.88 before there was a bearish reaction. The pair declined below the 150.25 support. It also traded below a connecting bullish trend line with support at 150.30.
The pair spiked below the 100 simple moving average (red, 4-hour) and the 23.6% Fib retracement level of the upward move from the 145.89 swing low to the 150.88 high.
Immediate support is near the 149.50 level. The next major support is at 148.80 or the 200 simple moving average (green, 4-hour). If there is a downside break below the 148.80 support, the pair could decline toward the 50% Fib retracement level of the upward move from the 145.89 swing low to the 150.88 high.
Any more gains might send USD/JPY toward 147.00. On the upside, the pair is facing resistance near the 150.25 level. The main resistance is near 150.85. A close above the 150.85 zone could open the doors for more upsides. The next stop for the bulls might be 152.00.
Looking at Gold, there was a decent increase above the $2,035 resistance and the bulls might aim for a move toward $2,065.
Economic Releases
- Euro Zone Manufacturing PMI for Feb 2024 – Forecast 46.1, versus 46.1 previous.
- UK Manufacturing PMI for Feb 2024 – Forecast 47.1, versus 47.1 previous.
- US Manufacturing PMI for Feb 2024 – Forecast 51.5, versus 51.5 previous.
- US ISM Manufacturing Index for Feb 2024 – Forecast 49.5, versus 49.1 previous.
BoJ’s Ueda stays cautious on achieving sustainable inflation
BoJ Governor Kazuo Ueda reiterated that Japan has not yet achieved sustainable 2% inflation. "I don't think we are there yet," he said after G20 finance ministers' meeting.
A significant focus for BoJ in the near term will be the outcome of upcoming annual wage negotiations between companies and unions. Ueda pointed out the importance of these negotiations in determining the potential for a positive wage-inflation cycle in Japan.
"We need to confirm whether a positive wage-inflation cycle would kick off and strengthen," he noted, acknowledging the rising demands from unions for pay increases exceeding last year's and the apparent willingness among many firms to comply.
However, Ueda also stressed the need for a comprehensive review of the collective results of these wage negotiations, alongside other economic data, to gauge whether wages and inflation will sustainably rise in tandem.