Sample Category Title
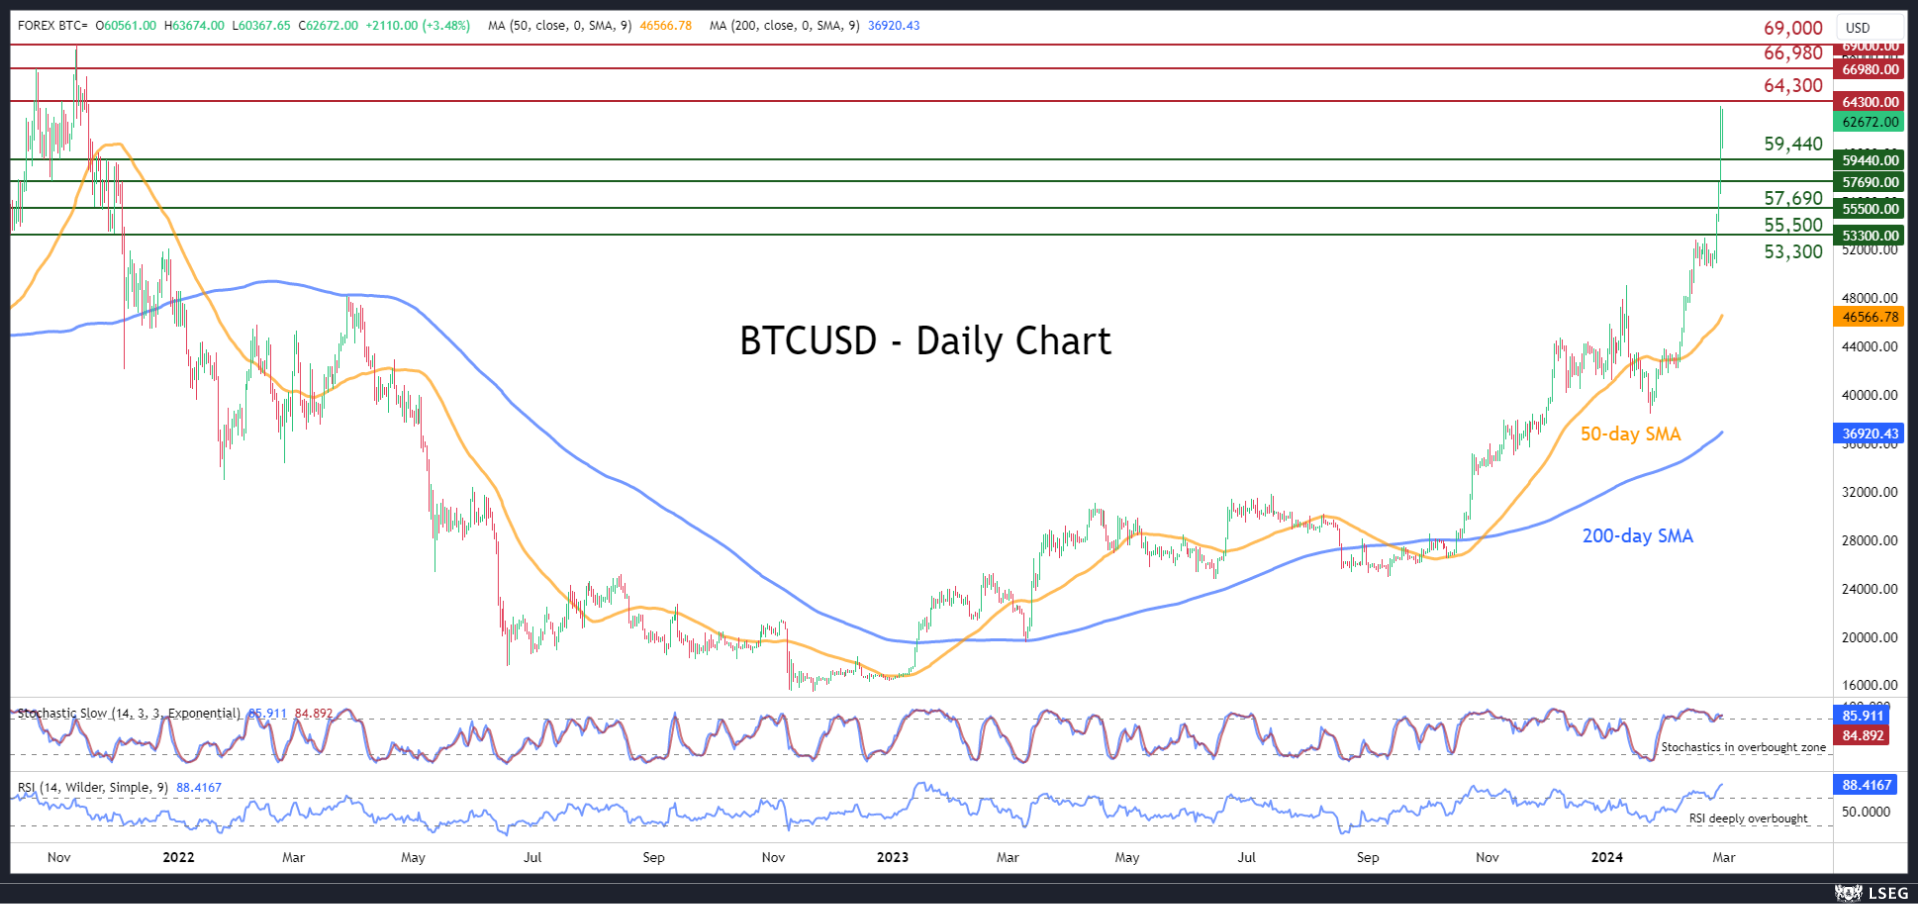
BTCUSD Skyrockets Towards Record Highs
- BTCUSD goes parabolic, gaining around 20% since Monday
- Jumps above 60,000 and is on track to test all-time highs
- Momentum indicators look extremely overbought
BTCUSD (Bitcoin) has experienced an exponential rally since the beginning of the week, which has sent the price within breathing distance from its all-time highs. However, the momentum indicators are currently deep in their overbought zones, increasing the odds for an impending pullback.
If Bitcoin storms to fresh highs, the December 2021 resistance of 64,300 might curb initial upside attempts. Breaking above that zone, the price may challenge the October 2021 peak of 66,980. A violation of that hurdle could open the door for the all-time high of 69,000 registered in November 2021.
On the flipside, should the price undergo a pullback, the bears could attack 59,440, which served as both support and resistance in the November-December 2021 period. Further declines could then come to a halt at the October 2021 support of 57,690. Even lower, the November 2021 support of 55,500 could provide downside protection.
In brief, BTCUSD has exploded since the beginning of the week, eyeing all-time highs. Nevertheless, traders should not rule out a correction as the advance seems immensely overstretched.
Early Flight to the Moon
Market picture
In an impressive surge of more than 7.3% in 24 hours, the crypto market capitalisation reached $2.32 trillion. The crypto market hasn’t been worth this much since late 2021. Back then, it took two months to get from current valuations to a peak of $3 trillion. But it’s worth remembering that the rally then started from a higher point of around $1.9 trillion versus the current $1.5 trillion. This means that we’re likely to see some profit-taking before the all-time highs are reached.
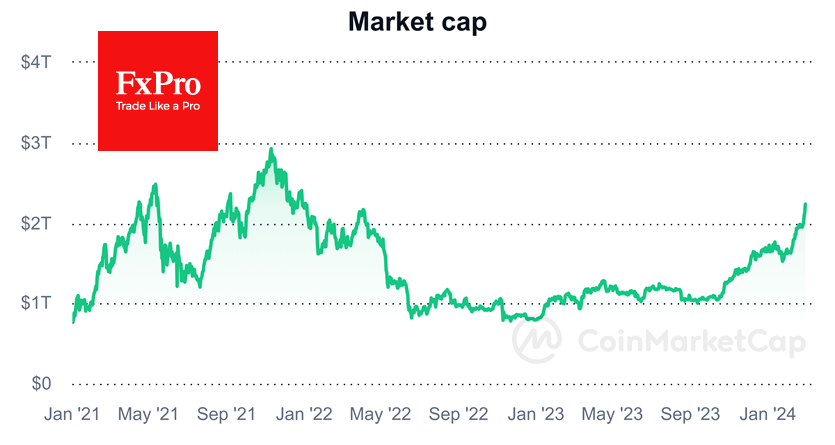
Yesterday, Bitcoin broke above $64.25K, followed by a sharp but short-lived pullback to $59K. In the early hours of Thursday morning, the price moved back up and was again at $63K by Thursday morning.
The main catalysts for Bitcoin’s rise above $60K were the influx of big money into spot ETFs and the multiplied liquidation of short positions. BTC has already hit all-time highs against local currencies in many countries. Now, investors are waiting for the milestone to happen with the US dollar.
Ethereum is showing smoother growth, adding 5.9% for the day against Bitcoin’s 8%. On the chart, however, the rise is smooth and reminiscent of the period when professional players were accumulating coins. We attribute this behaviour to the ongoing speculation around the launch of Ethereum ETFs, given the success of Bitcoin.
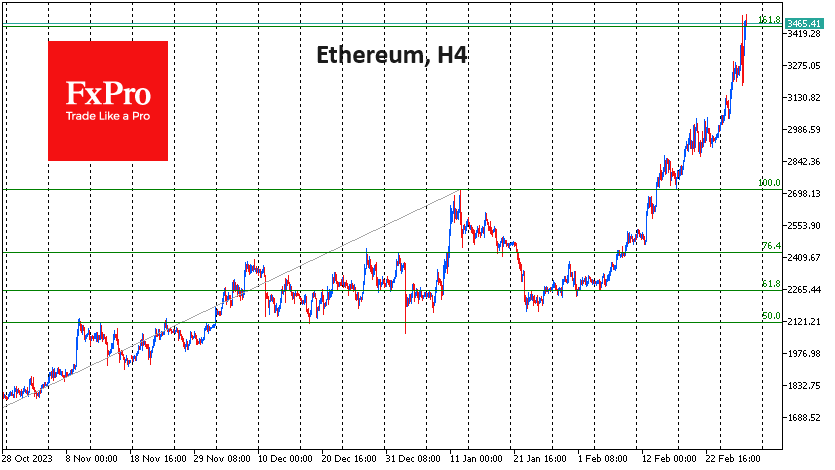
Meanwhile, the second cryptocurrency’s exchange rate approached $3500, close to Wednesday’s intraday high and a return to the April 2022 peak.
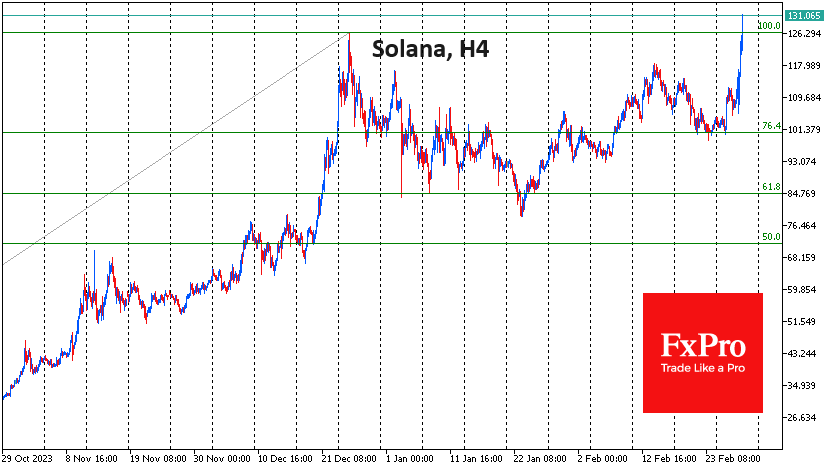
Solana, the market favourite at the end of last year, is showing double-digit growth overnight, rewriting December’s highs. Here, we see a classic Fibonacci pattern at work: the September-December growth momentum ended with a 38.2% pullback, and on Wednesday evening, the price retraced the highs. Now, the growth target for this pattern is $194 (161.8%).
News background
Dogecoin (DOGE) soared 30% in two days. DOGE developers reported that they are ready for the new Dogecoin Core 1.14.7 update, which includes security improvements.
Toncoin (TON) jumped 30% after the announcement of payments for Telegram channel owners to display ads. From March, the Telegram Ads platform will be open to all advertisers in nearly one hundred new countries. Users will receive 50% of the revenue that the messenger earns from displaying ads on their channels.
The dynamics of capital flows, exchange activity, leverage and institutional demand all point to a surge in risk appetite among bitcoin investors, Glassnode said. The current situation is reminiscent of the 2020-2021 boom.
The introduction of digital currencies in the countries of Oceania can solve many problems, but do not resort to the use of “unsecured private crypto assets” for this purpose, the IMF experts warned in their report.
Kraken Exchange announced the launch of Kraken Institutional, a new service offering comprehensive solutions for institutional clients.
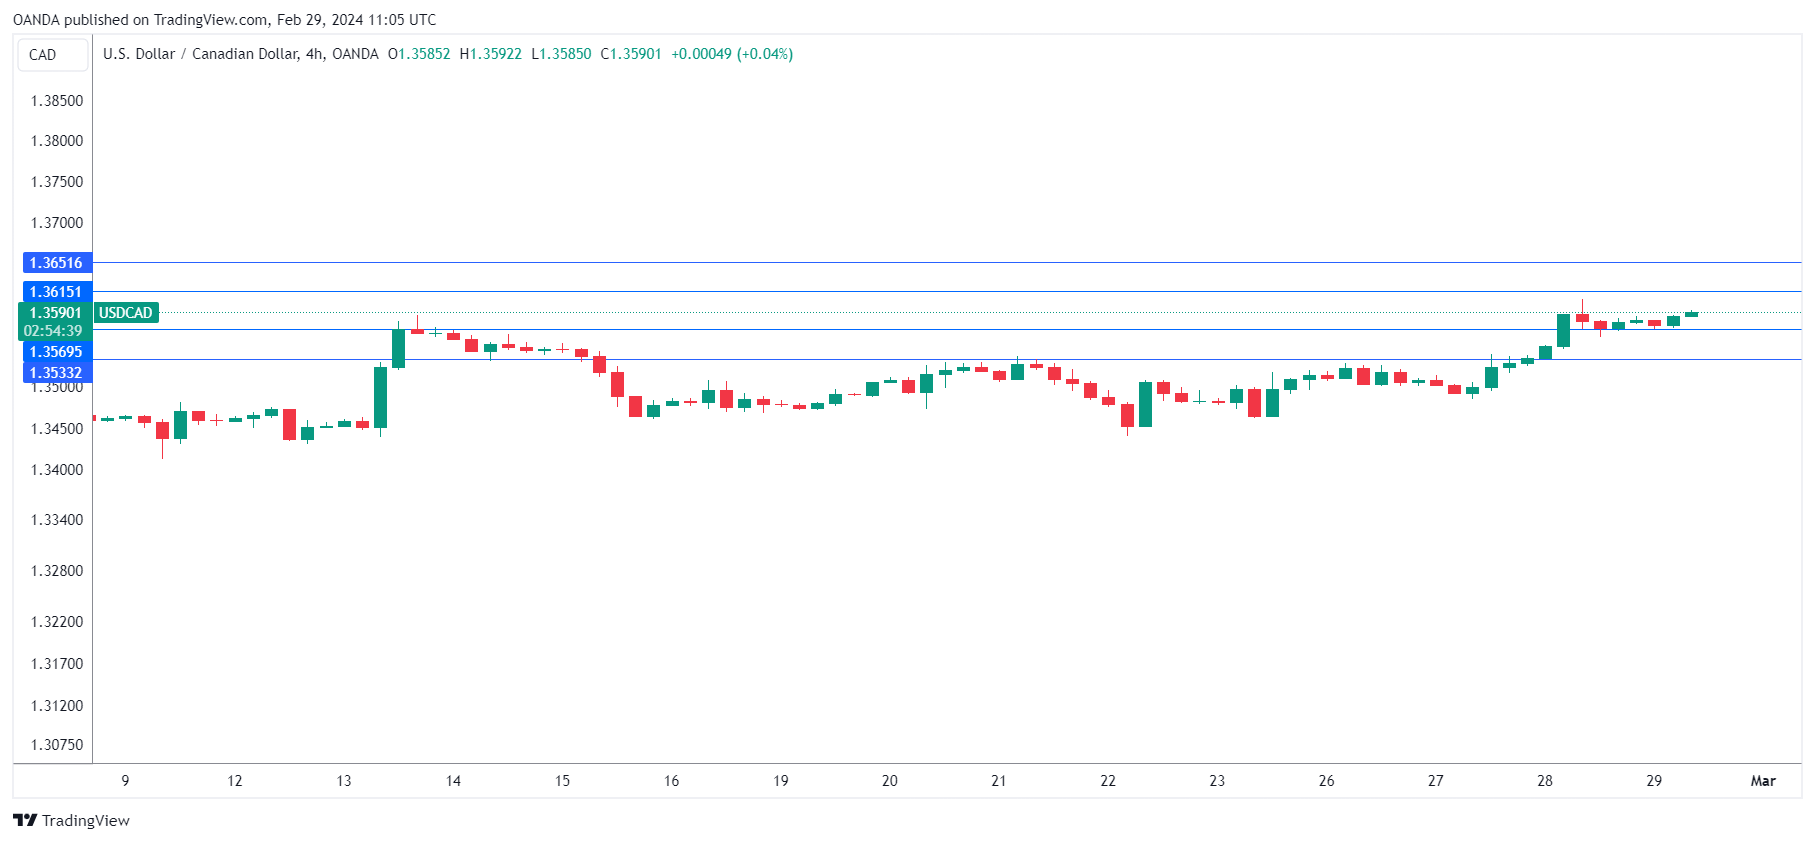
Canadian Dollar Hits 10-Week Low Ahead of GDP
The Canadian dollar is drifting on Thursday. In the European session, USD/CAD is trading at 1.3585, down 0.06%. A day earlier, the Canadian dollar dropped below 1.3600 for the first time since March 13.
Canada’s GDP expected to expand by 0.8%
Canada releases the fourth quarter GDP report later today with a market estimate of 0.8% y/y. This would mark a strong turnaround after a weak reading in Q3 of -1.1% . The US economy showed surprising strength in the fourth quarter and this is expected to have boosted Canada’s economy.
The Bank of Canada, which has stressed that its rate policy will be dependent on key data, will be keeping a close eye on the GDP release, which is the last tier-1 event before the policy meeting on March 6. If GDP matches or beats the market estimate, it would point to stronger economic growth and would support the BoC continuing its “higher for longer stance”.
The BoC last raised interest rates in July, bringing the cash rate to 5.0%. Governor Tiff Macklem hasn’t pushed back hard against rate cut expectations but has cautioned that the BoC will need to see a number of months of deceleration in inflation before it considers lowering rates.
In the US, the markets have priced in three rate cuts this year. In December, when the Fed signaled it expected to lower rates three times this year, market optimism rocketed and investors priced in up to six rate cuts in 2024. The Fed’s strong pushback against these expectations and the robust US economy have forced the markets to slash rate cut expectations, which are currently in line with the Fed projection of three rates cuts this year, with a first cut likely in June or September.
USD/CAD Technical
- USD/CAD is putting pressure on support at 1.3569 . Below, there is support at 1.3533
- 1.3615 and 1.3651 are the next resistance lines
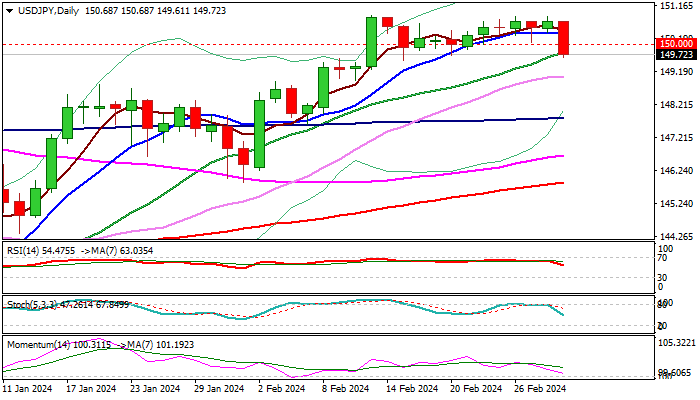
USD/JPY: Eases After Hawkish Comments on BoJ Interest Rates
USDJPY dips below 150 mark in early Thursday’s trading, as yen received fresh boost from BOJ policymaker’s hawkish comments regarding interest rates and month-end position adjustments.
Economic data from Japan, released overnight were mixed, as retail sales remained solid in January, but industrial production fell below expectations, causing limited impact.
Fresh bears cracked the floor of near-term consolidation range at 149.60 zone (reinforced by rising 20DMA and Fibo 23.6% of 145.89/150.88 upleg), with sustained break lower needed to generate bearish signal for deeper correction.
Fading bullish momentum on daily chart and south-heading RSI support the action, though traders await release of US inflation report (PCE, due later today) which is expected to provide more details about inflation trajectory and contribute to Fed’s interest rate outlook.
Extended pullback to target supports at 147.97 (Fibo 38.2% of 145.89/150.88) and 148.38 pivot (50% retracement / daily Kijun-sen).
Conversely, failure to clear 150.00 and 149.60 supports would signal that fresh bears lack strength and keep the price within extended range, but biased higher, as the pair is on track for the second consecutive monthly gain and eyeing key barriers at 151.90/94 (2022/2023 peaks).
Res: 150.00; 150.32; 150.88; 151.43.
Sup: 148.97; 148.38; 147.80; 147.07.
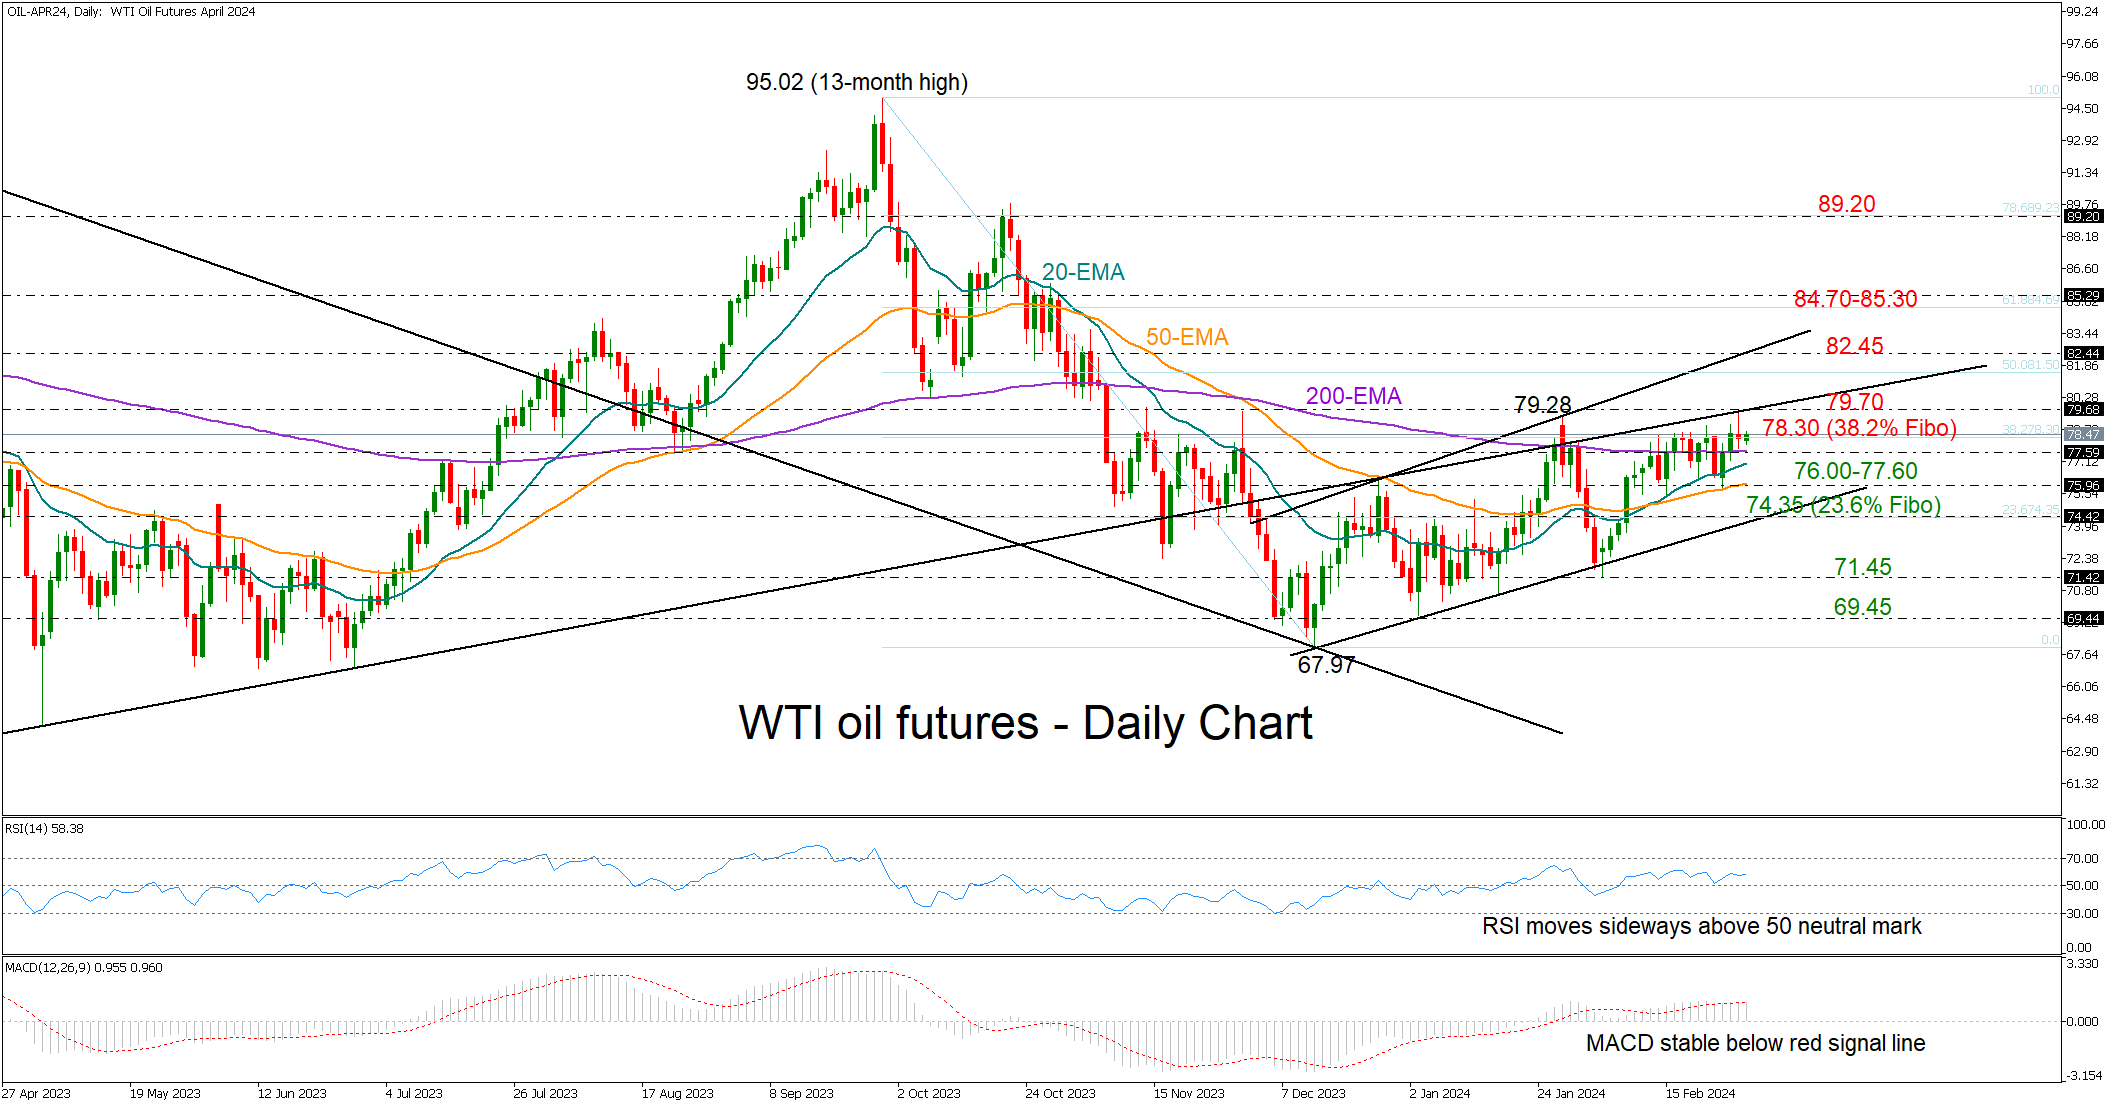
WTI Oil Futures Restricted in a Bullish Trend
- WTI oil futures keep facing constraints on the upside
- Trend signals endorse the positive trajectory
WTI oil futures only marginally surpassed January’s high of 79.28, before closing back within the 78.00 territory and around the 38.2% Fibonacci retracement of the September-December downleg, which has been restricting upside movements for more than a week.
The sideways trajectory in the RSI and the flattening MACD cannot guarantee additional price increases, although the indicators are within positive territory.
On the other hand, the trend signals are more encouraging as the bullish cross between the 20- and 50-day exponential moving averages (EMAs) and the narrowing gap between the 20- and 200-day EMAs are promoting the positive short-term trajectory in the market.
On the upside, the support-turned-resistance trendline from the pandemic lows seen at 79.70 has been constraining upside movements since the end of December. Hence, the bulls will have to clear that border in order to access the upper band of the bullish channel at 82.45. The next barrier could occur somewhere between the 61.8% Fibonacci level of 84.70 and the 85.30 resistance zone, a break of which could then clear the way towards October’s bar of 89.20.
On the downside, the exponential moving averages currently within the 76.00-77.60 zone could delay any extensions towards the channel’s lower band and the 23.6% Fibonacci of 74.35. If the bears continue lower, the price might seek shelter near the 71.45 region and then around 69.45.
In brief, WTI oil futures cannot confirm a bullish bias despite their positive trajectory. For that to happen, the price will have to overcome the 78.40-79.68 area.
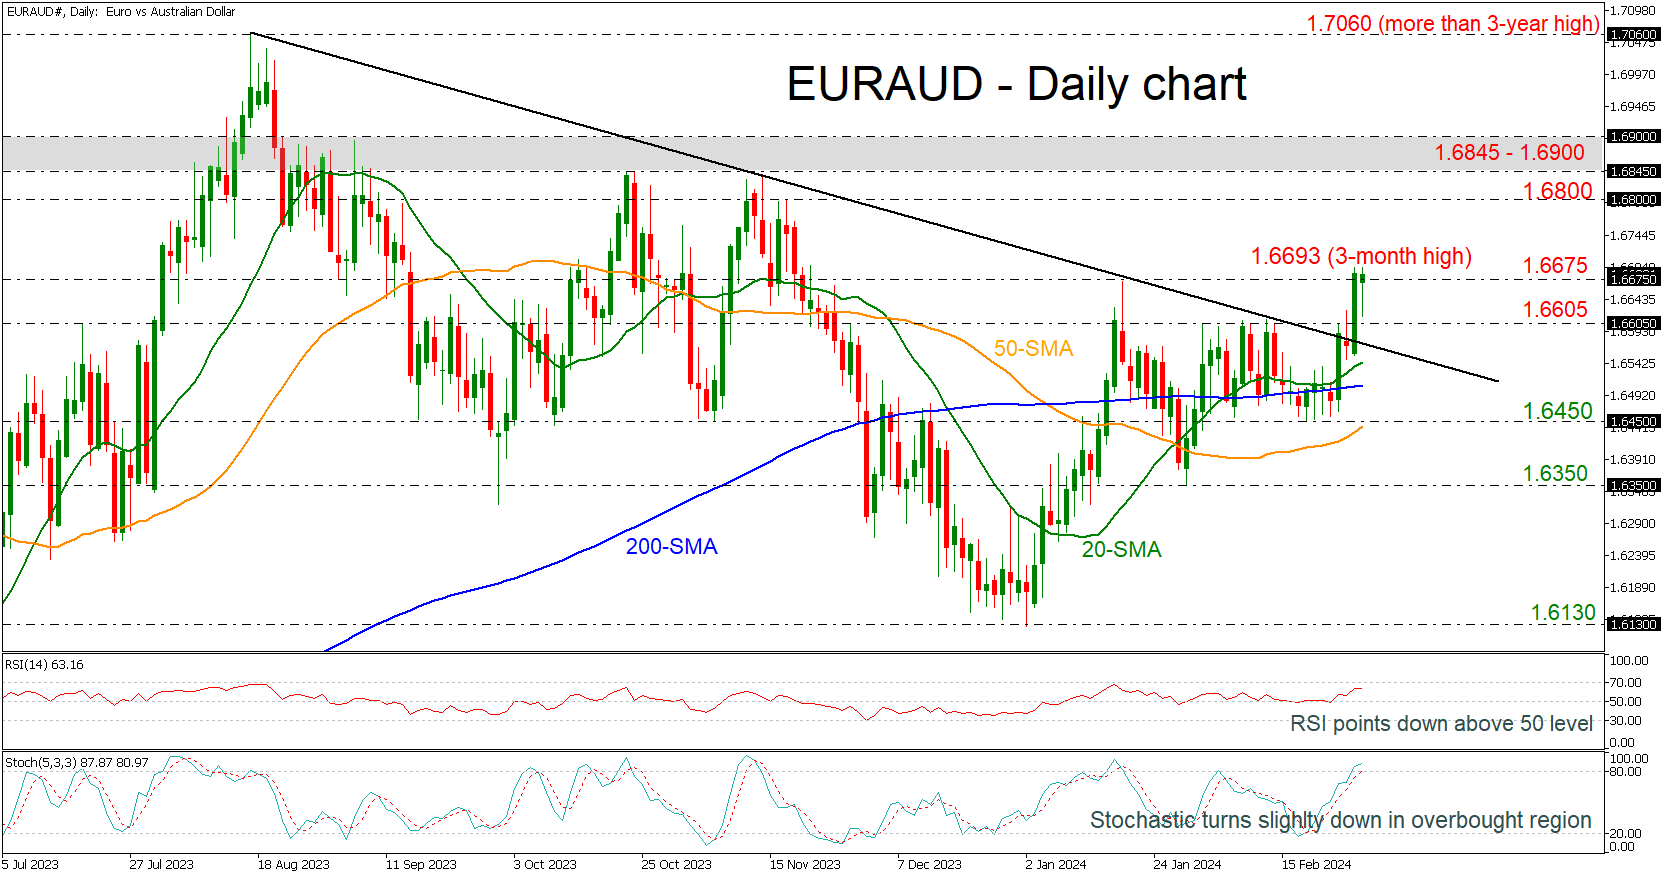
EURAUD Flies to 3-Month High
- EURAUD penetrates the downtrend line
- RSI and stochastic suggest bearish correction
EURAUD skyrocketed to a new three-month high of 1.6693 during yesterday’s session, penetrating the long-term descending trend line to the upside. Currently, the pair is weakening its momentum and something reflected in the technical oscillators as well. The RSI is pointing down above the 50 level, while the stochastic is holding above the 80 level, indicating an overstretched market.
If the market remains above the downtrend line, the next resistance could come from the 1.6800 round number and the restrictive region of 1.6845-1.6900.
On the other hand, a tumble below the 1.6605 barrier could retest the descending trend line and the 20- and the 200-day simple moving averages (SMAs) at 1.6545 and 1.6507 respectively. Steeper decreases could open the door for the bears to test the 1.6450 hurdle around the 50-day SMA.
All in all, EURAUD is making an attempt to change the bearish outlook to a bullish one but traders need to be cautious for a potential downside retracement.
USD/JPY Technical Analysis: Yen Strengthens after Comments from Japanese Officials
This week has raised alarm bells for USD/JPY market participants who are trading the bullish momentum that has been going on since early 2024 (shown in the blue curved lines on the USD/JPY chart):
→ Vice Finance Minister Masato Kanda warned against “excessive volatility” in currency markets, hinting that the yen had weakened too much.
→ Bank of Japan board member Hajime Takata said that, in his opinion, there are prospects for achieving the inflation target of 2%, which opens the way to abandoning negative rates. Note that today there was news on inflation in Japan, which showed that it is slowing down. Thus, BOJ Core CPI in annual terms was 2.6%, a month ago = 2.6%, 2 months ago = 2.7%, 3 months ago = 3.0%.
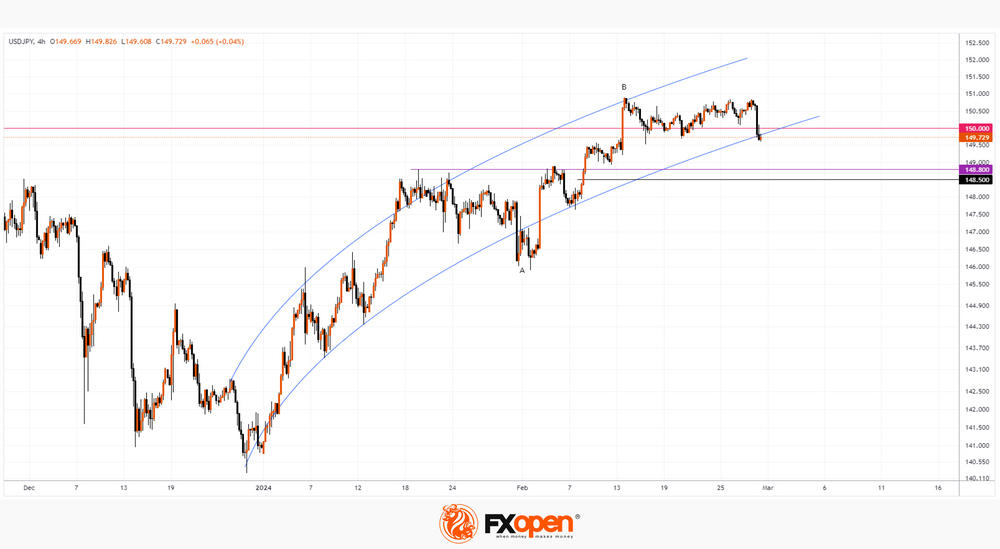
Statements from officials should increase the likelihood of a rate hike at the Bank of Japan's March meeting, thereby changing the prevailing sentiment.
Reuters writes that positions against the yen are at a record high, and their collapse could lead to the fact that the 2-month bullish trajectory of the USD/JPY price will be broken.
Wherein:
→ the psychological level factor of 150 yen per US dollar operates in the market — history shows that the fall of the yen below this level leads to a reaction from the Japanese financial authorities.
→ The USD/JPY price may fall to the support zone, which is formed by the level 148.50 (50% of the A→B impulse) and the level 148.8 (former resistance).
Trade over 50 forex markets 24 hours a day with FXOpen. Take advantage of low commissions, deep liquidity, and spreads from 0.0 pips. Open your FXOpen account now or learn more about trading forex with FXOpen.
This article represents the opinion of the Companies operating under the FXOpen brand only. It is not to be construed as an offer, solicitation, or recommendation with respect to products and services provided by the Companies operating under the FXOpen brand, nor is it to be considered financial advice.
BTC/USD Price Exceeds $60,000 Per Coin
Several factors contributed to this:
→ Effect associated with the approval of Bitcoin ETF. The media writes that investments in these financial instruments amount to about 9k bitcoins per day, and miners produce only 900 bitcoins per day. The total investment in the Bitcoin ETF after approval on January 11 is approaching USD 50 billion. By comparison, just over USD 90 billion is invested in the 19 largest gold ETFs.
→ Expectations that Ethereum ETFs will be approved in the future, simplifying access to investments in the second largest cryptocurrency by capitalization.
→ Expectations for the Fed to cut interest rates. Cheaper credit means greater appetite for investment in higher-risk assets.
→ Expectations for the halving (scheduled for April), after which a bull market usually begins.
In mid-February, we wrote that the price of Bitcoin did not show bullish progress after exceeding the psychological level of USD 50k per Bitcoin. Technical analysis of the Bitcoin chart shows that this was due to resistance (shown by the arrow) from the median line of the green ascending channel, within which the market has been developing since the fall of 2023. Yesterday's rise, which followed the breakdown of the psychological level of 60k US dollars per bitcoin, marked the upper limit of this channel just above 64k US dollars per bitcoin and made it possible to update its contours.
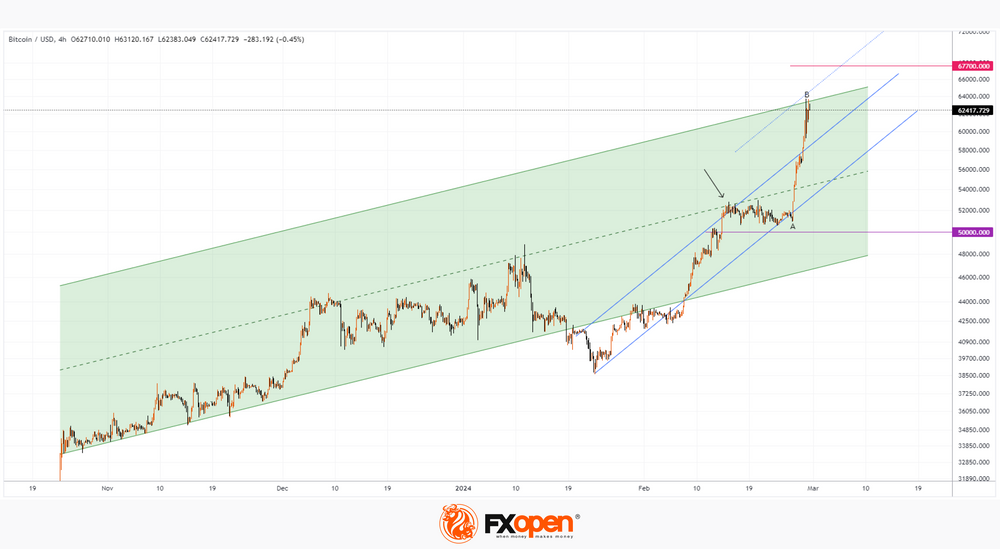
Now the upper limit of the green channel acts as resistance, it is possible that after an increase of +25% in 2.5 days from point A to point B, buyers will want to take profits — this confirms the fact of yesterday's bearish impulse, in which the price of Bitcoin dropped from USD 64k to USD 59k.
So it is safe to assume that the market is ready for consolidation. But if the extremely optimistic growth rate shown by the blue lines continues, the price of Bitcoin could reach an all-time high of USD 67.7k as soon as spring arrives.
FXOpen offers the world's most popular cryptocurrency CFDs*, including Bitcoin and Ethereum. Floating spreads, 1:2 leverage — at your service. Open your trading account now or learn more about crypto CFD trading with FXOpen.
*At FXOpen UK and FXOpen AU, Cryptocurrency CFDs are only available for trading by those clients categorised as Professional clients under FCA Rules and Professional clients under ASIC Rules respectively. They are not available for trading by Retail clients.
This article represents the opinion of the Companies operating under the FXOpen brand only. It is not to be construed as an offer, solicitation, or recommendation with respect to products and services provided by the Companies operating under the FXOpen brand, nor is it to be considered financial advice.
Technical Outlook and Review
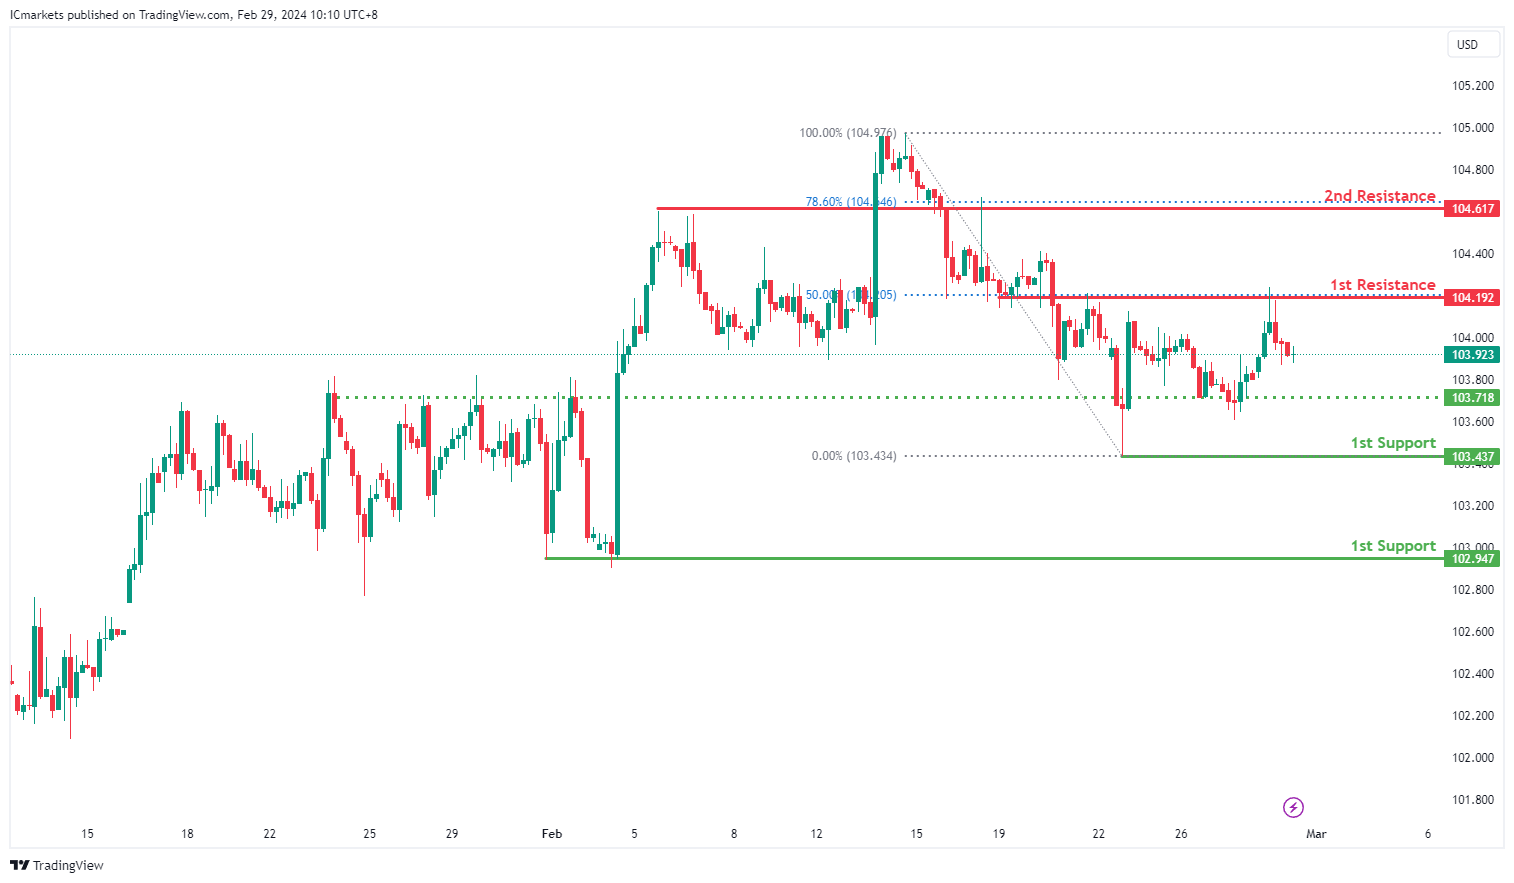
DXY:
The DXY (Dollar Index) chart currently indicates a bearish momentum, suggesting a potential continuation towards the 1st support level.
The 1st support at 103.43 is identified as a swing low support, indicating its significance as a level where buying interest may emerge to support the price. This level aligns with previous price action, reinforcing its potential as a support area.
Additionally, the 2nd support at 102.94 is characterized as a multi-swing low support, further strengthening its importance as a level where buyers have historically intervened to prevent further decline. This level provides additional confirmation of potential support.
On the resistance side, the 1st resistance level at 104.19 is noted for its presence as an overlap resistance and aligns with the 50% Fibonacci Retracement level. This suggests its historical significance as a barrier where selling pressure may increase, potentially limiting upward movement.
Moreover, the 2nd resistance at 104.61 is highlighted for its presence as an overlap resistance and coincides with the 78.60% Fibonacci Retracement level. This reinforces its potential as a significant resistance area, where selling interest may intensify.
Additionally, the intermediate support at 103.71 is identified as an overlap support, providing further reinforcement to the potential support area.
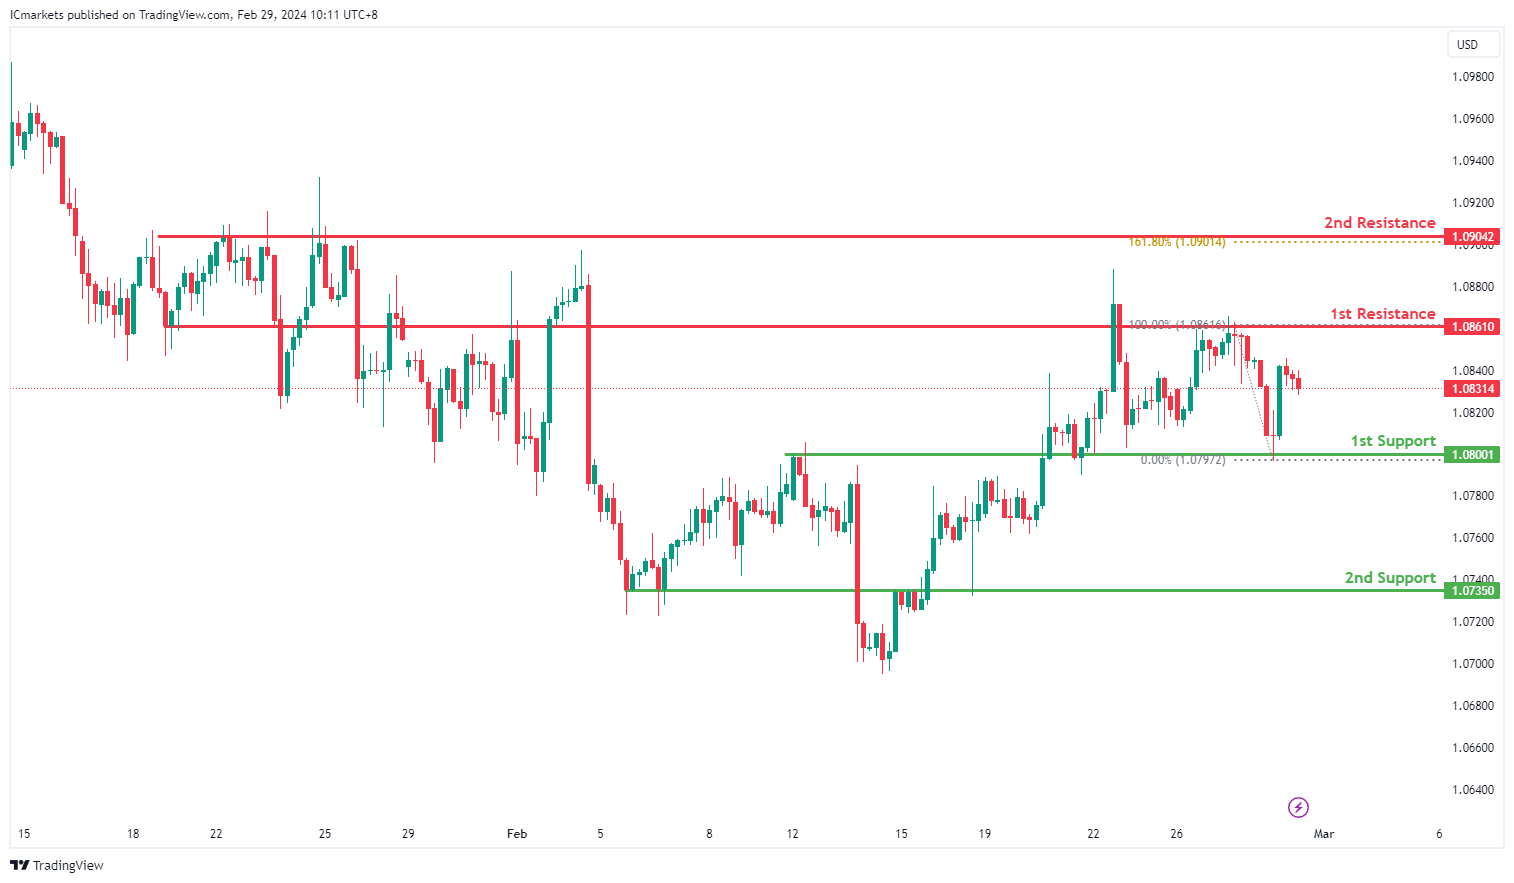
EUR/USD:
The EUR/USD chart currently exhibits bullish momentum, although short-term price action suggests a potential drop to the 1st support before rebounding towards the 1st resistance.
The 1st support level at 1.0800 is identified as an overlap support, indicating its historical significance as a level where buying interest has previously emerged to support the price. Traders may look to this level as a potential area for price to find support in the short term.
Furthermore, the 2nd support at 1.0735 is also characterized as an overlap support, reinforcing its importance as a level where buyers have historically intervened to prevent further decline. This level provides additional confirmation of potential support.
On the resistance side, the 1st resistance level at 1.0861 is identified as an overlap resistance, suggesting its historical significance as a barrier where selling pressure may increase, potentially limiting upward movement in the short term.
Additionally, the 2nd resistance at 1.0904 is noted for its presence as a multi-swing high resistance, further reinforcing its importance as a level where selling interest may intensify, potentially capping the upward movement of prices.
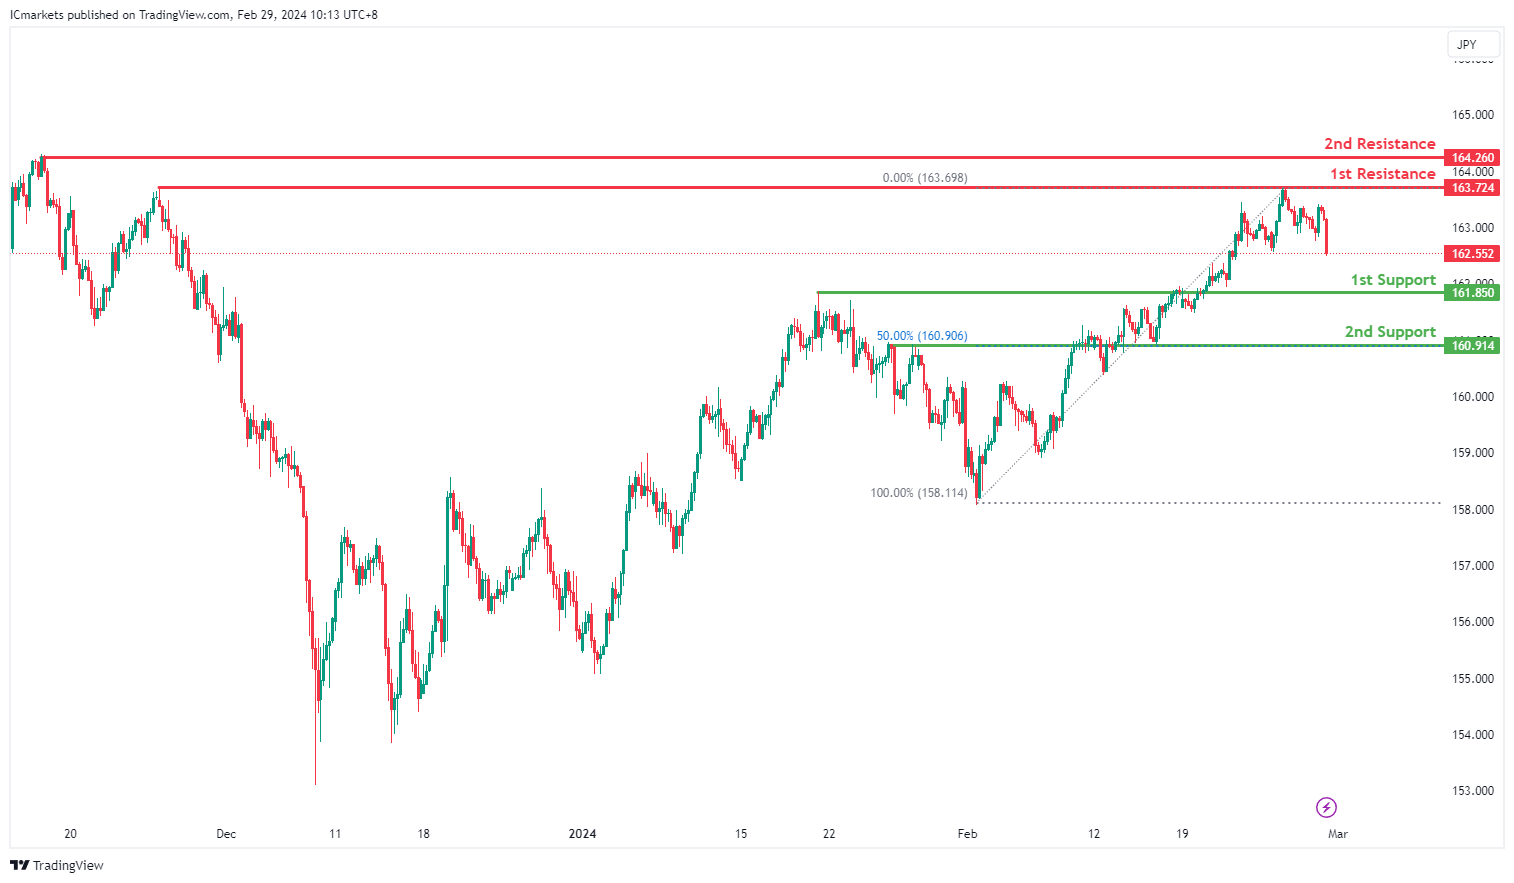
EUR/JPY:
The EUR/JPY chart indicates a bearish momentum, suggesting a potential continuation towards the 1st support level.
At 161.85, the 1st support level presents an overlap support, indicating historical significance as a level where buying interest has emerged, potentially providing support for the price.
Further reinforcing potential support, the 2nd support at 160.91 aligns with an overlap support and the 50% Fibonacci Retracement level, strengthening its significance as a level where buyers may intervene to prevent further decline.
On the resistance side, the 1st resistance at 163.72 signifies a multi-swing high resistance, suggesting a notable barrier to upward movement. Traders may observe increased selling pressure around this level.
Additionally, the 2nd resistance at 164.26 is characterized by a swing high resistance, further validating its importance as a level where selling interest may intensify.
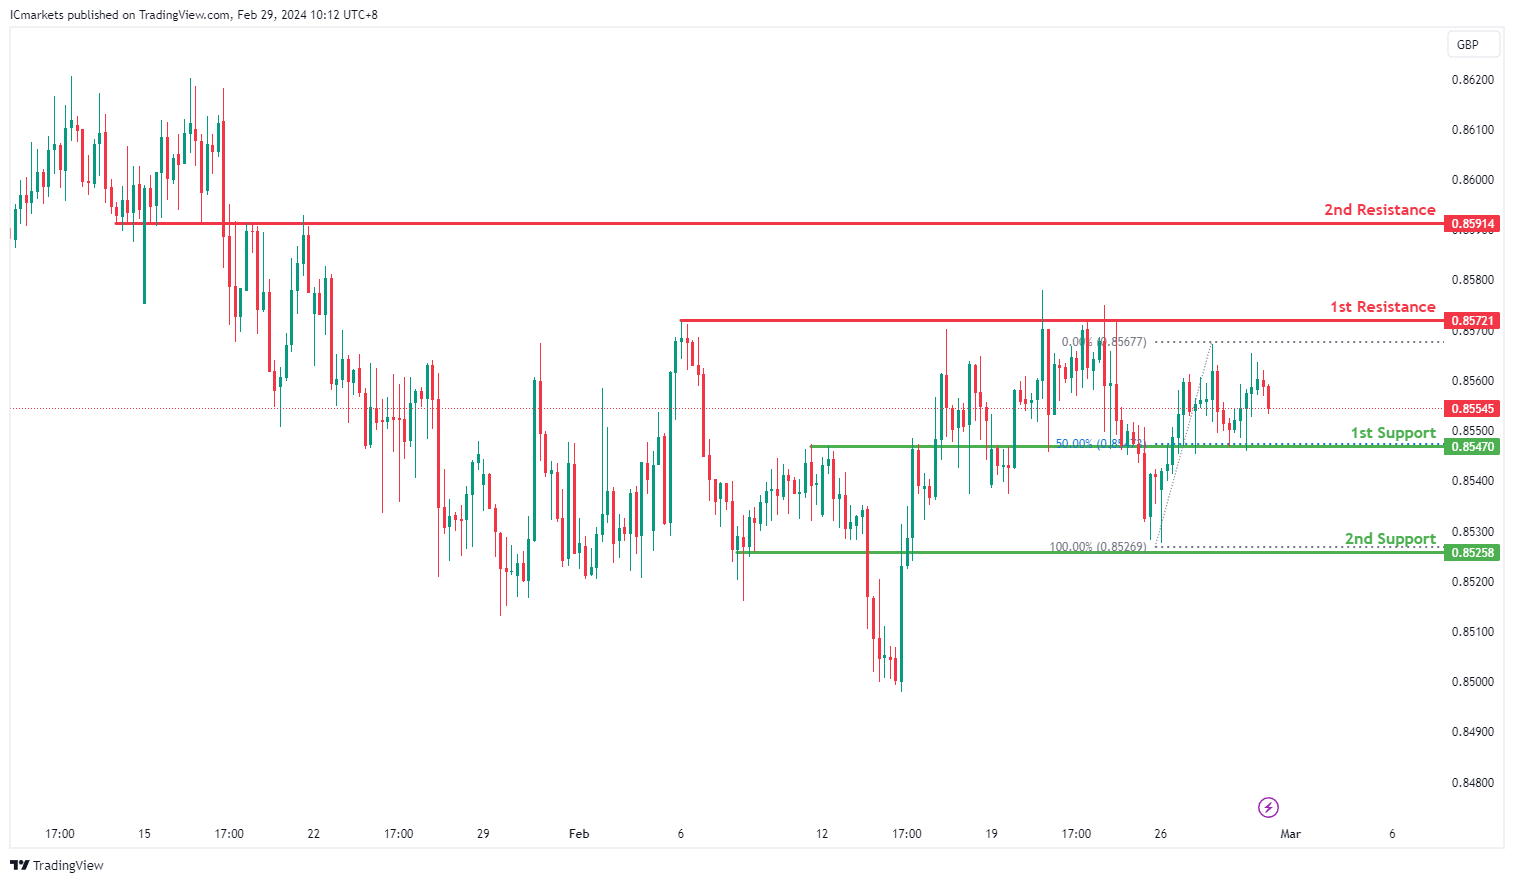
EUR/GBP:
The EUR/GBP chart currently reflects neutral momentum, suggesting a potential fluctuation between the 1st resistance and 1st support levels.
The 1st support at 0.8547 is notable as it aligns with an overlap support and the 50% Fibonacci Retracement level, indicating its historical significance as a level where buying interest has emerged and providing potential support for the price.
Further reinforcing potential support, the 2nd support at 0.8525 represents an overlap support, adding to its significance as a level where buyers may intervene to prevent further decline.
On the resistance side, the 1st resistance at 0.8572 signifies a multi-swing high resistance, suggesting a significant barrier to upward movement. Traders may observe increased selling pressure around this level.
Additionally, the 2nd resistance at 0.8591 is characterized by an overlap resistance, further validating its importance as a level where selling interest may intensify.
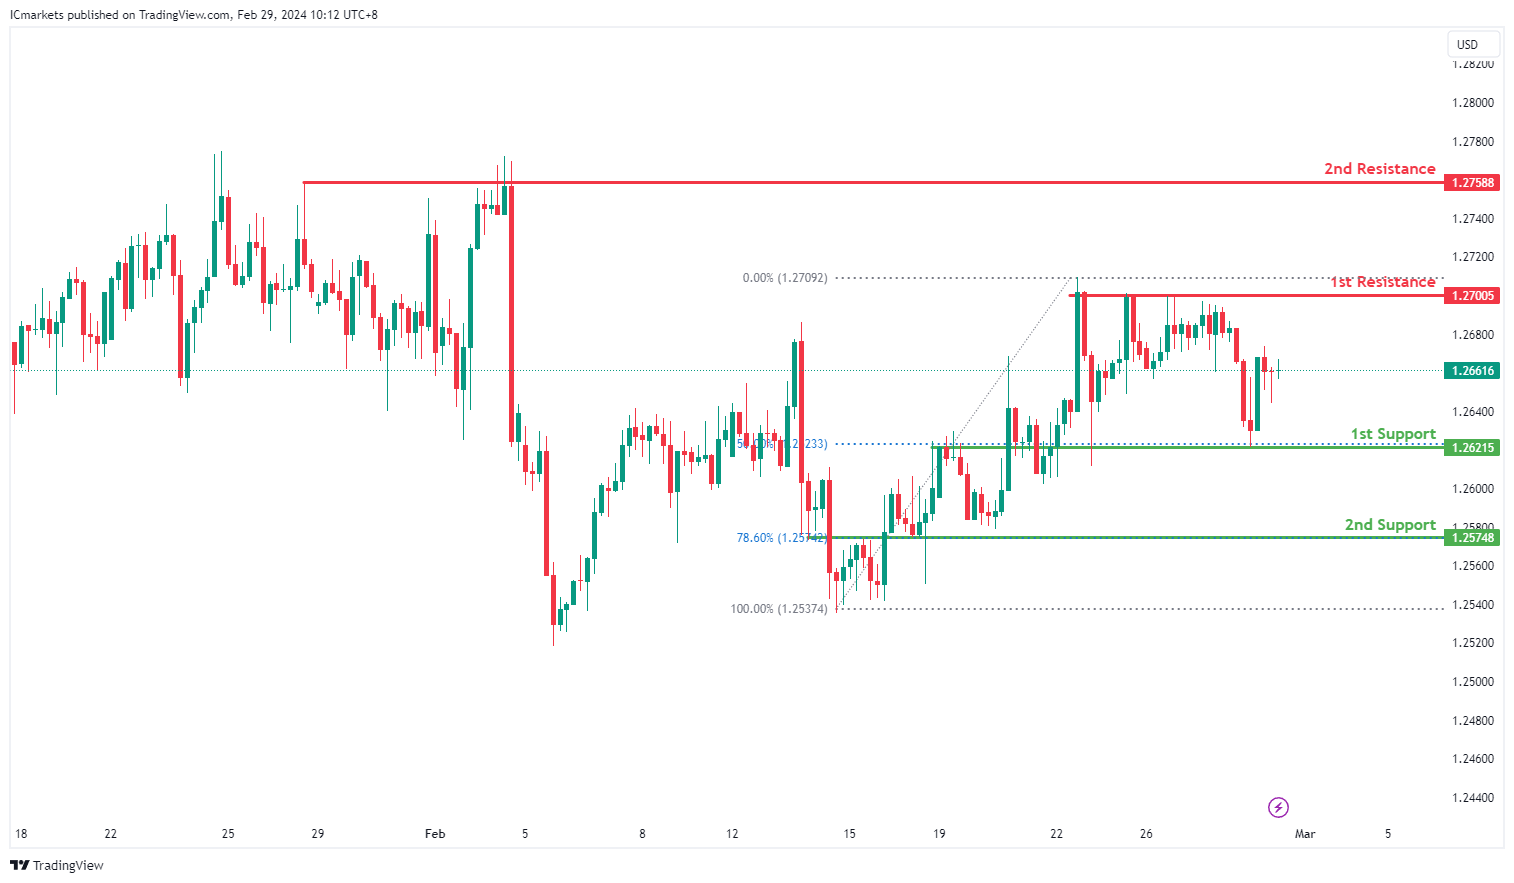
GBP/USD:
The GBP/USD chart indicates a bullish trend, although there’s a possibility of a short-term decline towards the 1st support before rebounding towards the 1st resistance.
The 1st support level at 1.2621 is significant as it aligns with an overlap support, suggesting historical buying interest at this level, particularly marked by the 50% Fibonacci Retracement.
Further reinforcing potential support, the 2nd support at 1.2574 also corresponds to an overlap support, accentuated by the presence of the 78.60% Fibonacci Retracement, indicating a historically strong area where buyers intervened.
On the resistance side, the 1st resistance at 1.2700 represents a multi-swing high resistance, historically acting as a barrier to upward movement due to increased selling pressure.
Likewise, the 2nd resistance at 1.2758 also serves as a multi-swing high resistance, signaling another significant level where selling interest may intensify, potentially hindering further upward momentum.
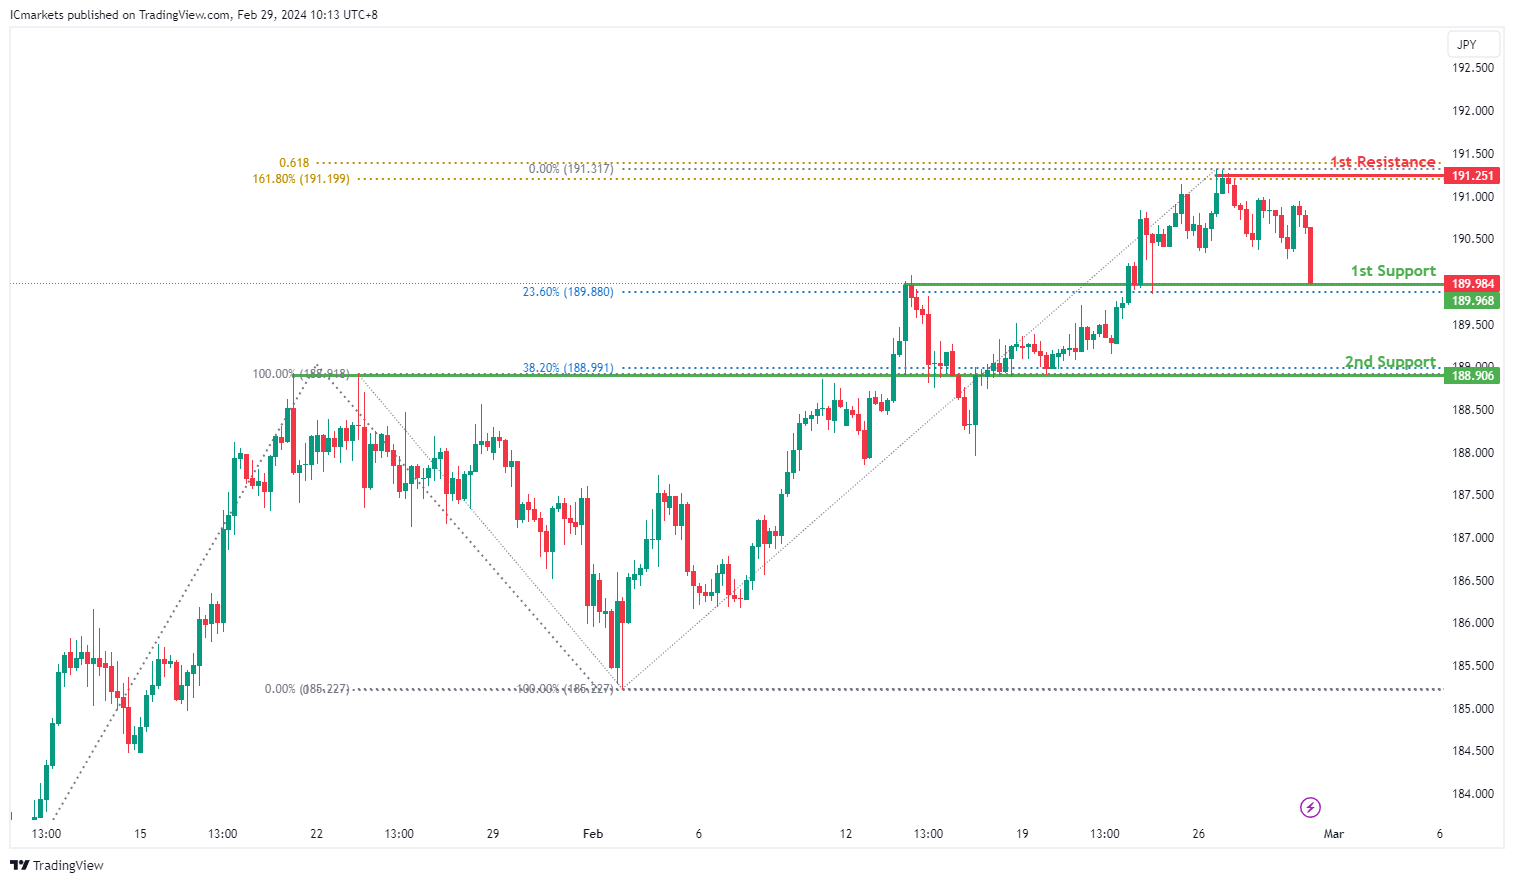
GBP/JPY:
The GBP/JPY chart currently exhibits bearish momentum, suggesting a potential bearish break off the 1st support level and a subsequent drop towards the 2nd support.
The 1st support at 189.96 is significant as it aligns with an overlap support and the 23.60% Fibonacci Retracement level, indicating historical buying interest and potential support for the price.
Further reinforcing potential support, the 2nd support at 188.90 coincides with an overlap support and the 38.20% Fibonacci Retracement level, adding to its significance as a level where buyers may intervene to prevent further decline.
On the resistance side, the 1st resistance at 191.25 represents a multi-swing high resistance, indicating a significant barrier to upward movement. This level is further validated by the presence of the 61.80% Fibonacci Projection and the 161.80% Fibonacci Extension, suggesting Fibonacci confluence and reinforcing its importance as a resistance level.
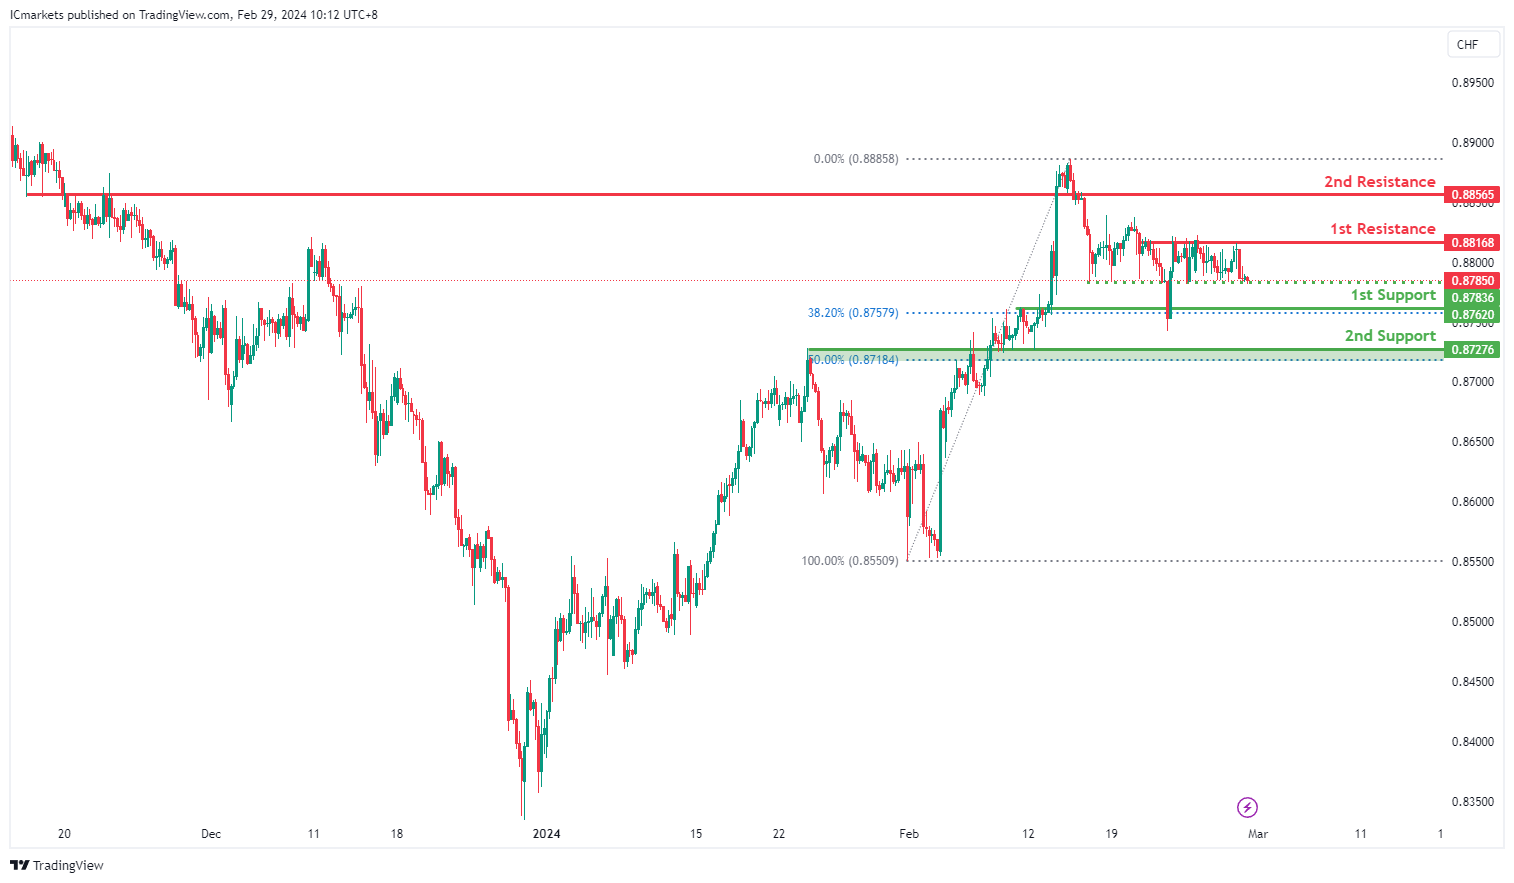
USD/CHF:
The USD/CHF chart is displaying bearish momentum, suggesting a potential continuation towards the 1st support.
The 1st support level at 0.8783 is notable as it aligns with an overlap support, indicating historical significance as a level where buying interest has emerged in the past.
Further reinforcing potential support, the 2nd support at 0.8727 corresponds to an overlap support and is also marked by the 50% Fibonacci Retracement, adding to its significance as a level where buyers may intervene.
On the resistance side, the 1st resistance at 0.8816 represents a multi-swing high resistance, historically impeding upward movement due to increased selling pressure.
Additionally, the 2nd resistance at 0.8856 acts as an overlap resistance, signaling another significant level where selling interest may intensify, potentially limiting further upward momentum.
The intermediate support at 0.8783 provides additional confirmation as an overlap support, potentially strengthening its role as a level where buying interest could reemerge.
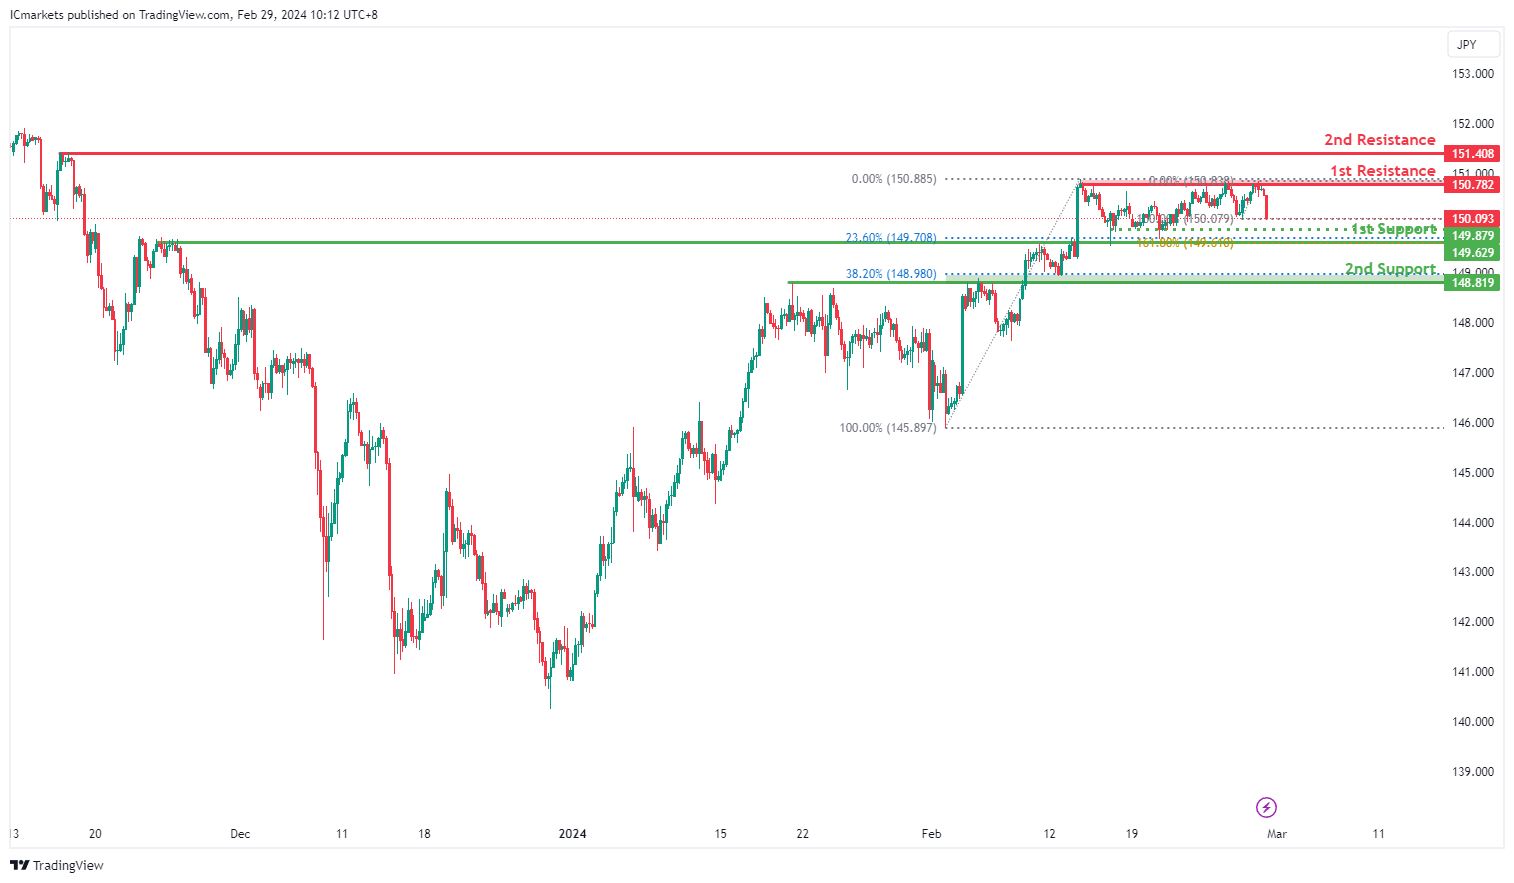
USD/JPY:
The USD/JPY chart currently indicates bearish momentum, suggesting a potential continuation towards the 1st support level.
The 1st support at 147.62 is notable for its alignment with an overlap support and the 23.60% Fibonacci Retracement, indicating its historical significance as a level where buying interest has emerged and providing potential support for the price.
Further reinforcing potential support, the 2nd support at 148.81 corresponds to an overlap support and the 38.20% Fibonacci Retracement, adding to its significance as a level where buyers may intervene to support the price.
On the resistance side, the 1st resistance at 150.78 represents a multi-swing high resistance, historically impeding upward movement due to increased selling pressure.
Additionally, the 2nd resistance at 151.40 acts as a swing high resistance, suggesting another significant level where selling interest may intensify, potentially limiting further upward momentum.
The intermediate support at 149.87 further strengthens potential support, aligning with a multi-swing low support, indicating a level where buying interest could reemerge to support the price.
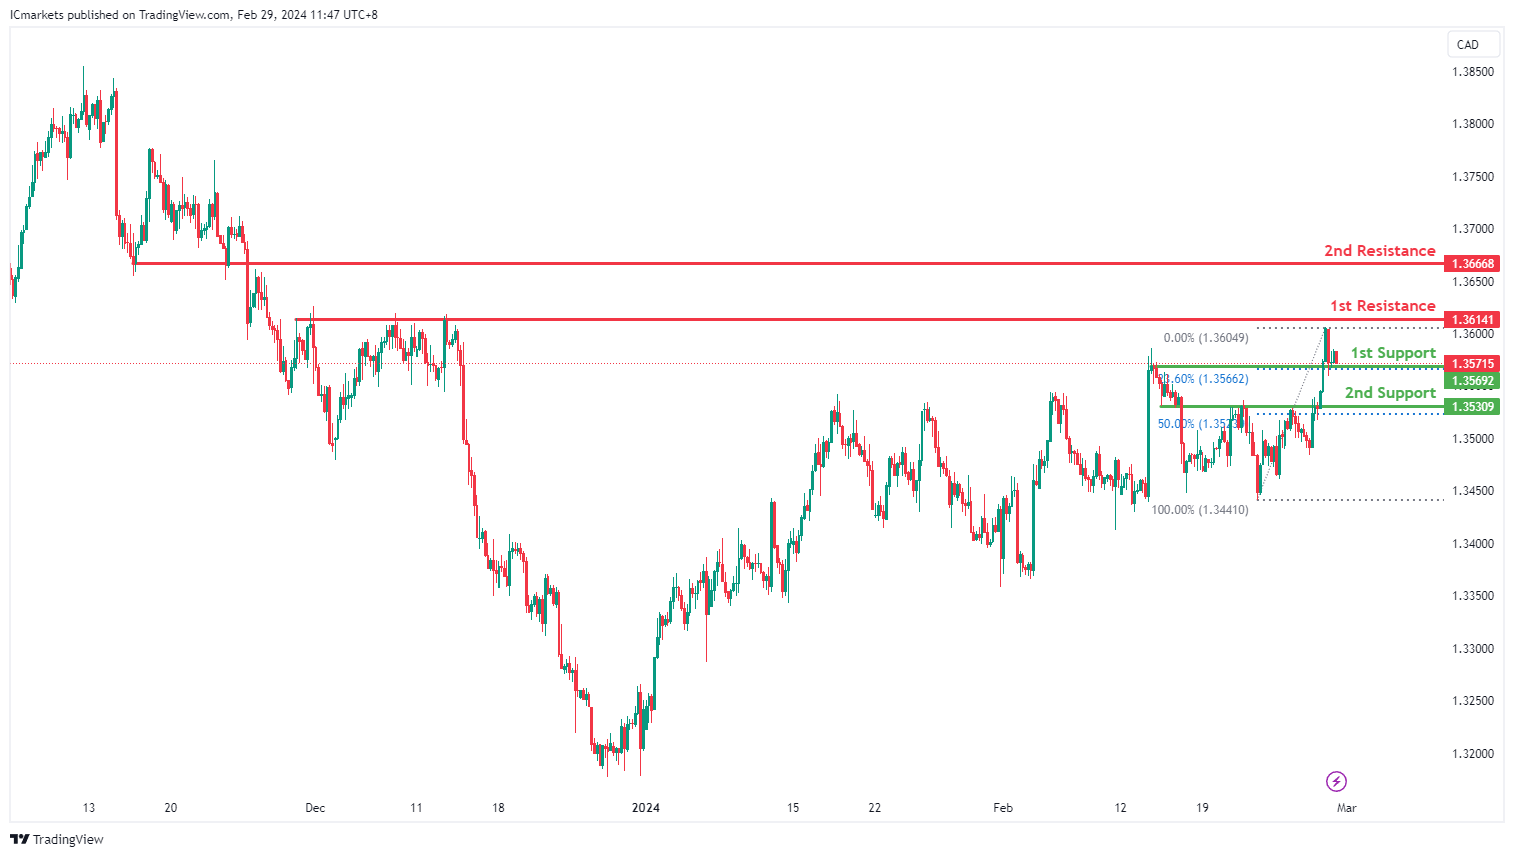
USD/CAD:
The USD/CAD chart currently exhibits an overall bullish momentum. In this context, there is a potential scenario for price to fall towards the 1st support before resuming the uptrend.
The 1st support level at 1.3569 is identified as an overlap support that aligns with the 23.60% Fibonacci retracement level. Further below, the 2nd support level at 1.3530 is also marked as an overlap support that aligns close to the 50.00% Fibonacci retracement level, reinforcing its significance as a key support level.
To the upside, the 1st resistance level at 1.3614 is identified as a pullback resistance. Higher up, the 2nd resistance level at 1.3666 is also marked as a pullback resistance, further highlighting its importance as a potential resistance zone.
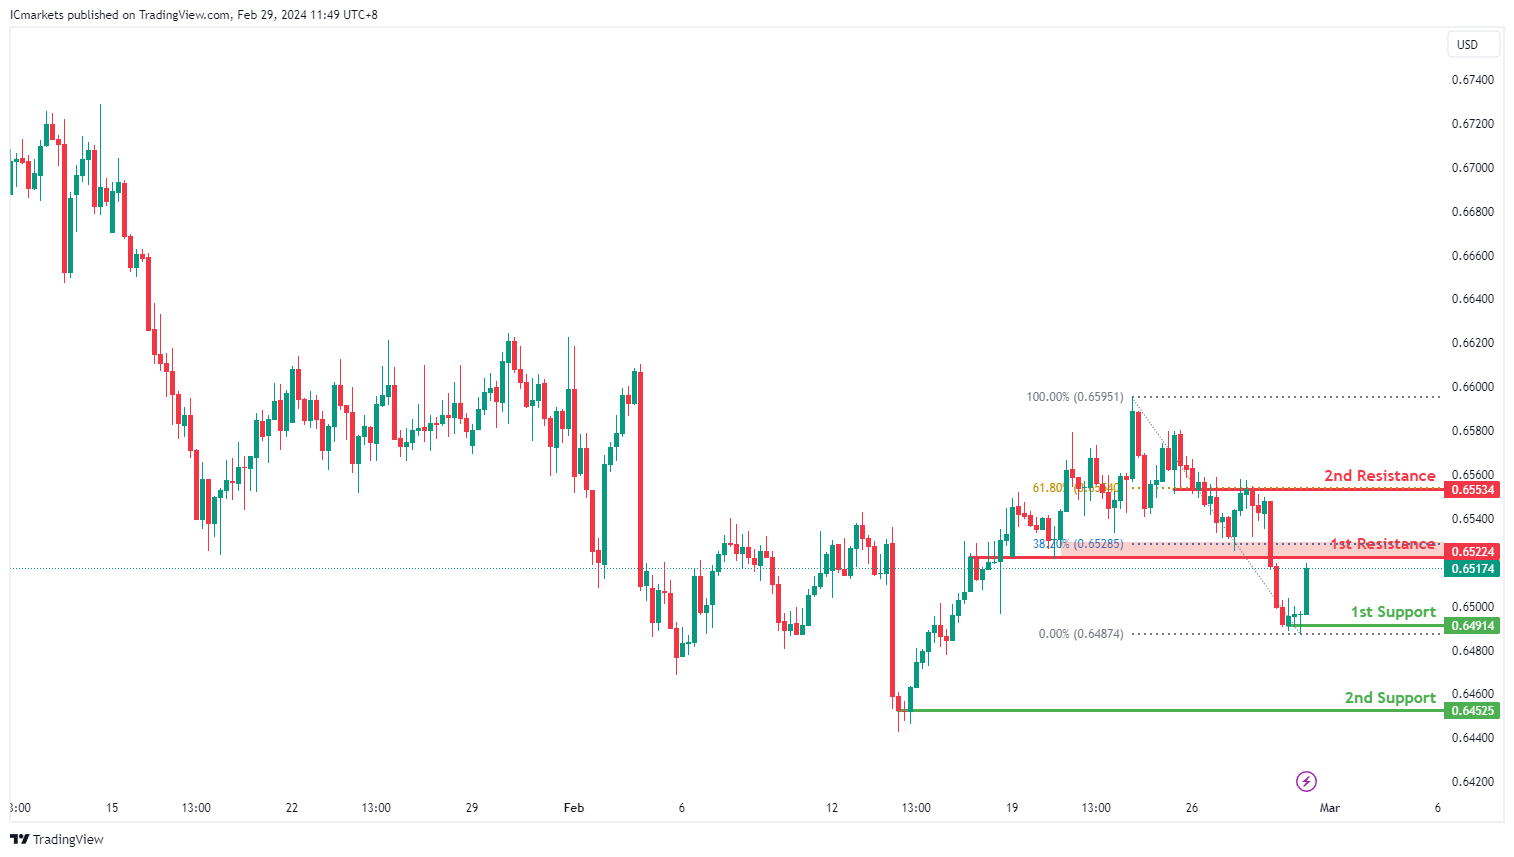
AUD/USD:
The AUD/USD chart currently exhibits an overall bearish momentum. However, there is a potential scenario for price to rise towards the 1st resistance before resuming the downtrend.
The 1st resistance level at 0.6522 is identified as an overlap resistance that aligns close to the 38.20% Fibonacci Retracement level. Higher up, the 2nd resistance level at 0.6553 is also noted as an overlap resistance that aligns with the 61.80% Fibonacci Retracement level, further highlighting its importance as a potential resistance zone.
To the downside, the 1st support level at 0.6491 is identified as a pullback support. Further below, the 2nd support level at 0.6452 is also marked as a pullback support, further emphasizing its importance as a potential support zone.
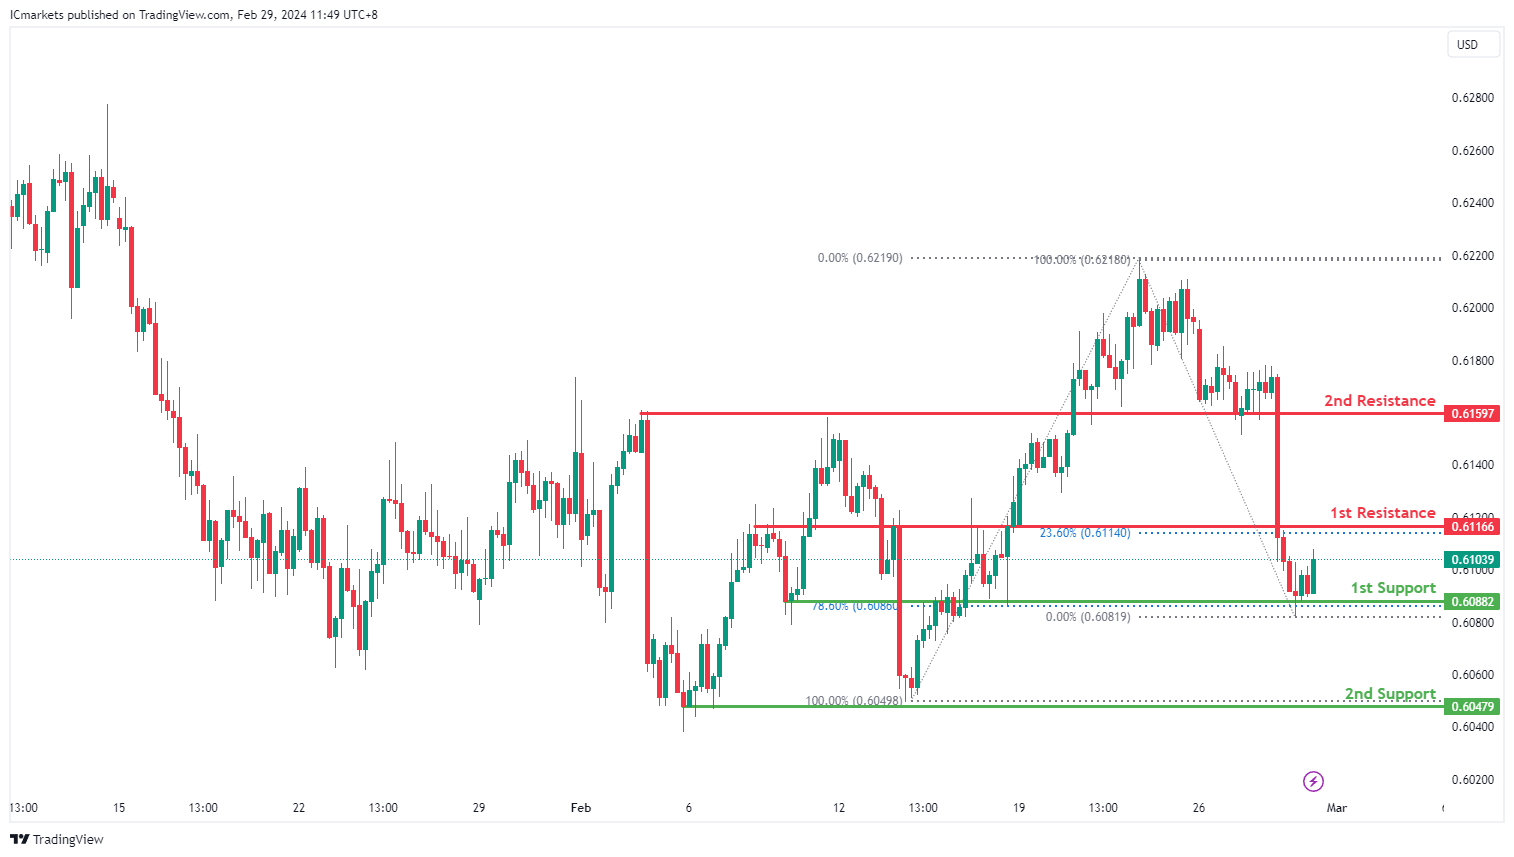
NZD/USD
The NZD/USD chart currently exhibits an overall bearish momentum. However, there is a potential scenario for price to rise towards the 1st resistance before resuming the downtrend.
The 1st resistance level at 0.6116 is identified as an overlap resistance that aligns with the 23.60% Fibonacci Retracement level. Higher up, the 2nd resistance level at 0.6159 is also noted as an overlap resistance, further highlighting its importance as a potential resistance zone.
To the downside, the 1st support level at 0.6088 is identified as an overlap support that aligns with the 78.60% Fibonacci Retracement level. Further below, the 2nd support level at 0.6047 is marked as a pullback support, further emphasizing its importance as a potential support zone.
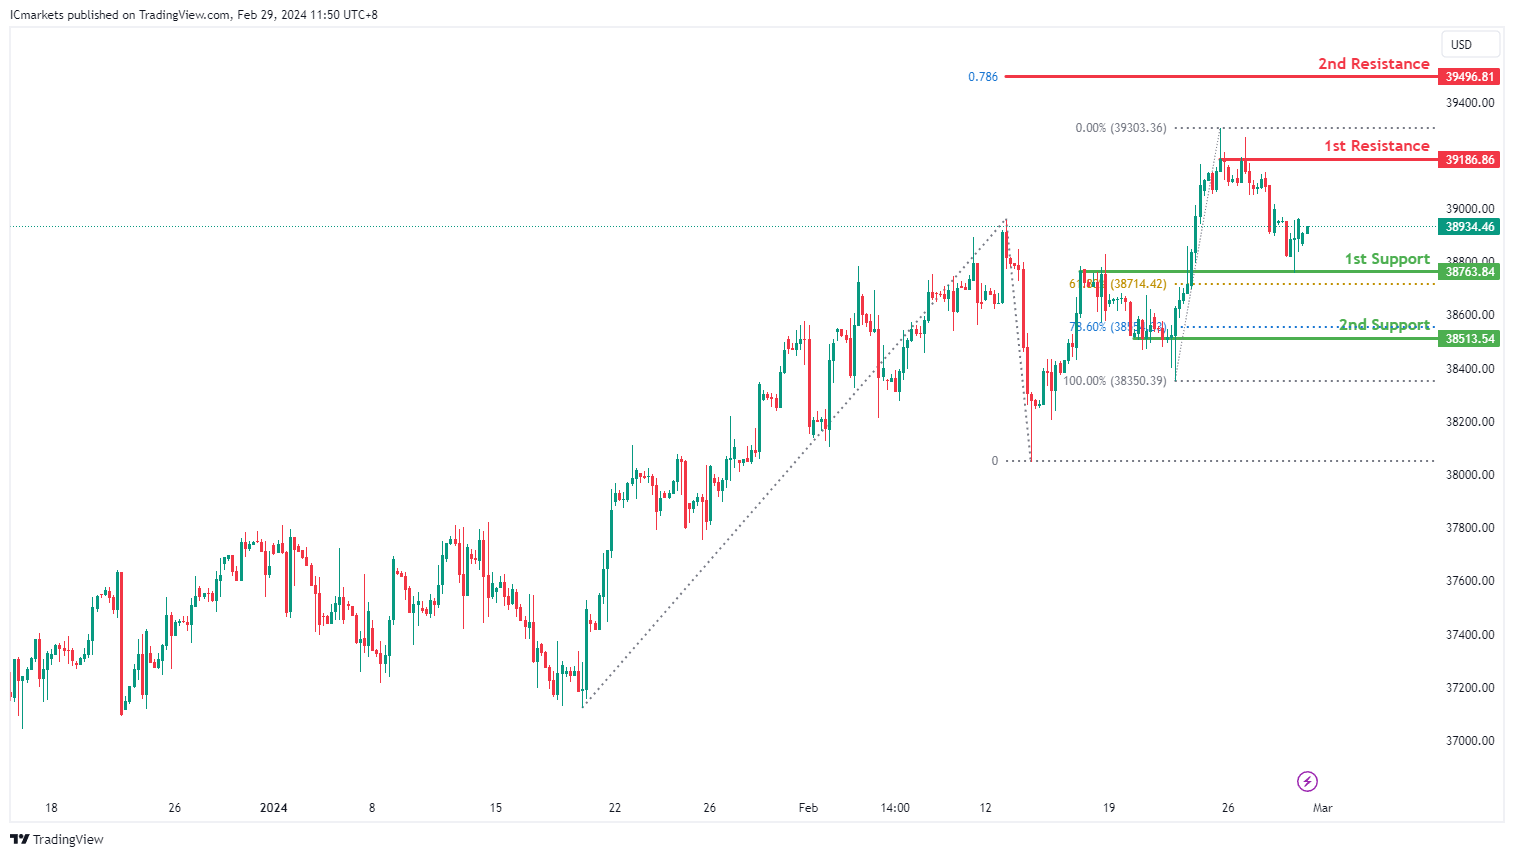
DJ30:
The DJ30 chart currently exhibits an overall bullish momentum. In this context, there is a potential scenario for price to make a bullish continuation towards the 1st resistance.
The 1st resistance level at 39,186.86 is identified as a pullback resistance. Higher up, the 2nd resistance level at 39,496.81 is noted as a resistance that aligns with the 78.60% Fibonacci Projection level, adding to its significance as a potential barrier to further bullish movement.
On the support side, the 1st support level at 38,763.84 is identified as an overlap support that aligns close to the 61.80% Fibonacci Retracement level. Further below, the 2nd support at 38,513.54 is marked as a pullback support that aligns close to the 78.60% Fibonacci Retracement level, further reinforcing its significance as a potential level of support.
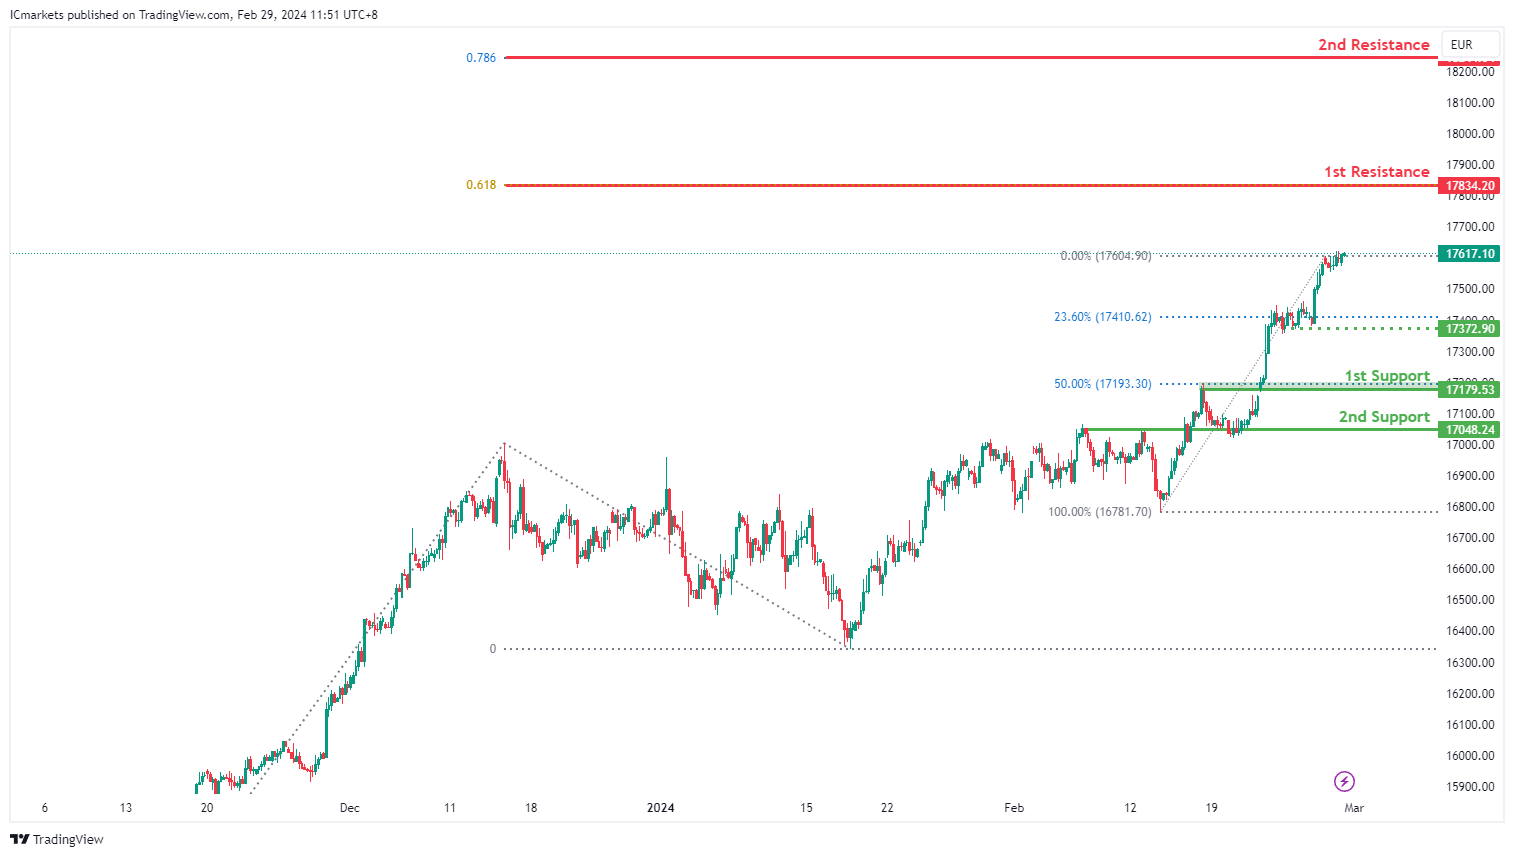
GER40:
The GER40 chart currently demonstrates an overall bullish momentum, suggesting a potential continuation of the upward trend towards the 1st resistance.
The 1st resistance level at 17,834.20 is identified as a resistance that aligns with the 61.80% Fibonacci Projection level. Higher up, the 2nd resistance level at 18,244.54 is marked as a resistance that aligns with the 78.60% Fibonacci Projection level, adding to its significance as a potential barrier to further bullish movement.
On the support side, the intermediate support level at 17,372.90 is identified as a pullback support that aligns with the 23.60% Fibonacci Retracement level while the 1st support level at 17,179.53 is also marked as a pullback support that aligns with the 50.00% Fibonacci Retracement level. Additionally, the 2nd support level at 17,048.24 is noted as an overlap support, further reinforcing its importance as a potential area of support.
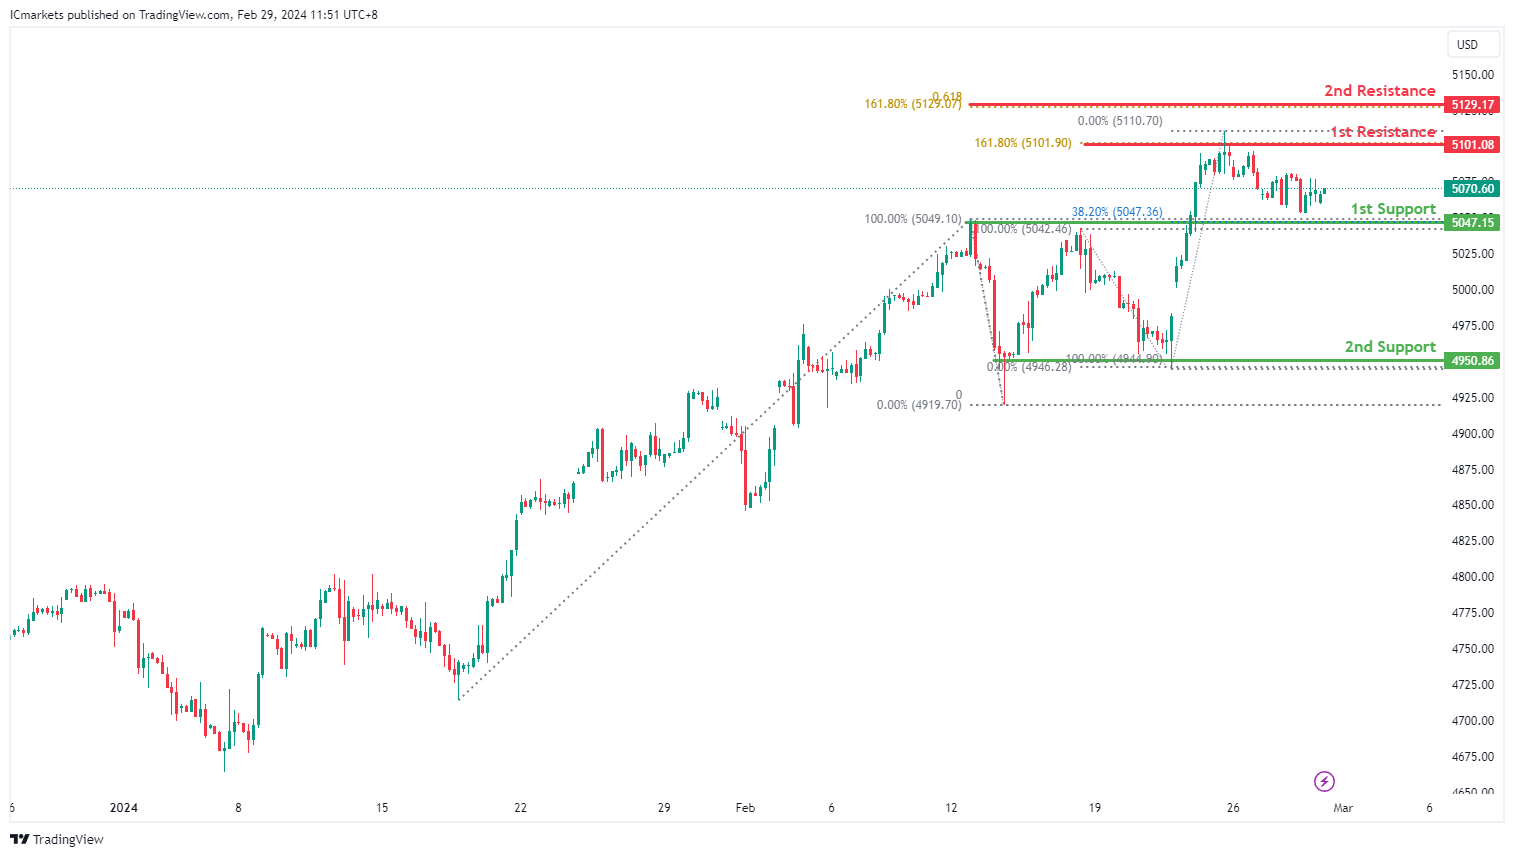
US500:
The US500 chart currently demonstrates an overall bullish momentum, suggesting a potential continuation of the upward trend towards the 1st resistance.
The 1st resistance level at 5,101.08 is identified as a pullback resistance that aligns with the 161.80% Fibonacci Extension level. Higher up, the 2nd resistance level at 5,129.17 is noted as a resistance that aligns with a confluence of Fibonacci levels i.e. the 61.80% Projection and the 161.80% Extension, adding to its significance as a potential barrier to further bullish movement.
On the support side, the 1st support level at 5,047.15 is identified as a pullback support that aligns with the 38.20% Fibonacci Retracement level. Further below, the 2nd support level at 4,950.86 is also marked as a pullback support, further reinforcing its significance as a potential area of support.
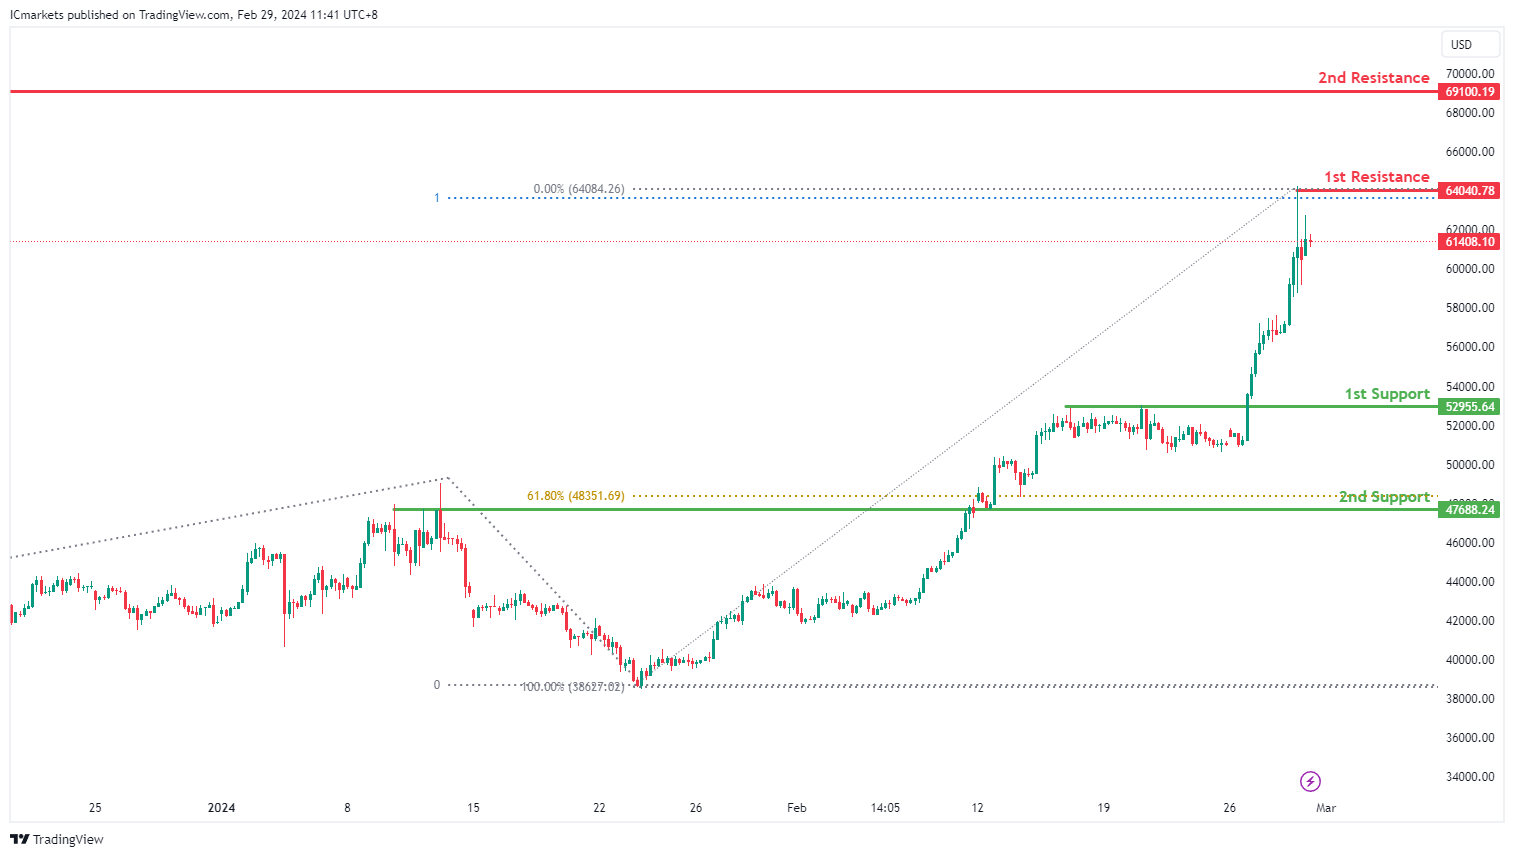
BTC/USD:
The BTC/USD chart currently demonstrates an overall bullish momentum, suggesting a potential continuation of the upward trend towards the 1st resistance.
The 1st resistance level at 64,040.78 is identified as a pullback resistance that aligns with the 100.00% Fibonacci Projection level. Higher up, the 2nd resistance level at 69,100.19 is noted as a swing-high resistance at the all-time high, adding to its significance as a potential barrier to further bullish movement.
On the support side, the 1st support level at 52,955.64 is identified as a pullback support. Further below, the 2nd support level at 47,688.24 is marked as an overlap support that aligns with the 61.80% Fibonacci Retracement level, further reinforcing its significance as a potential area of support.
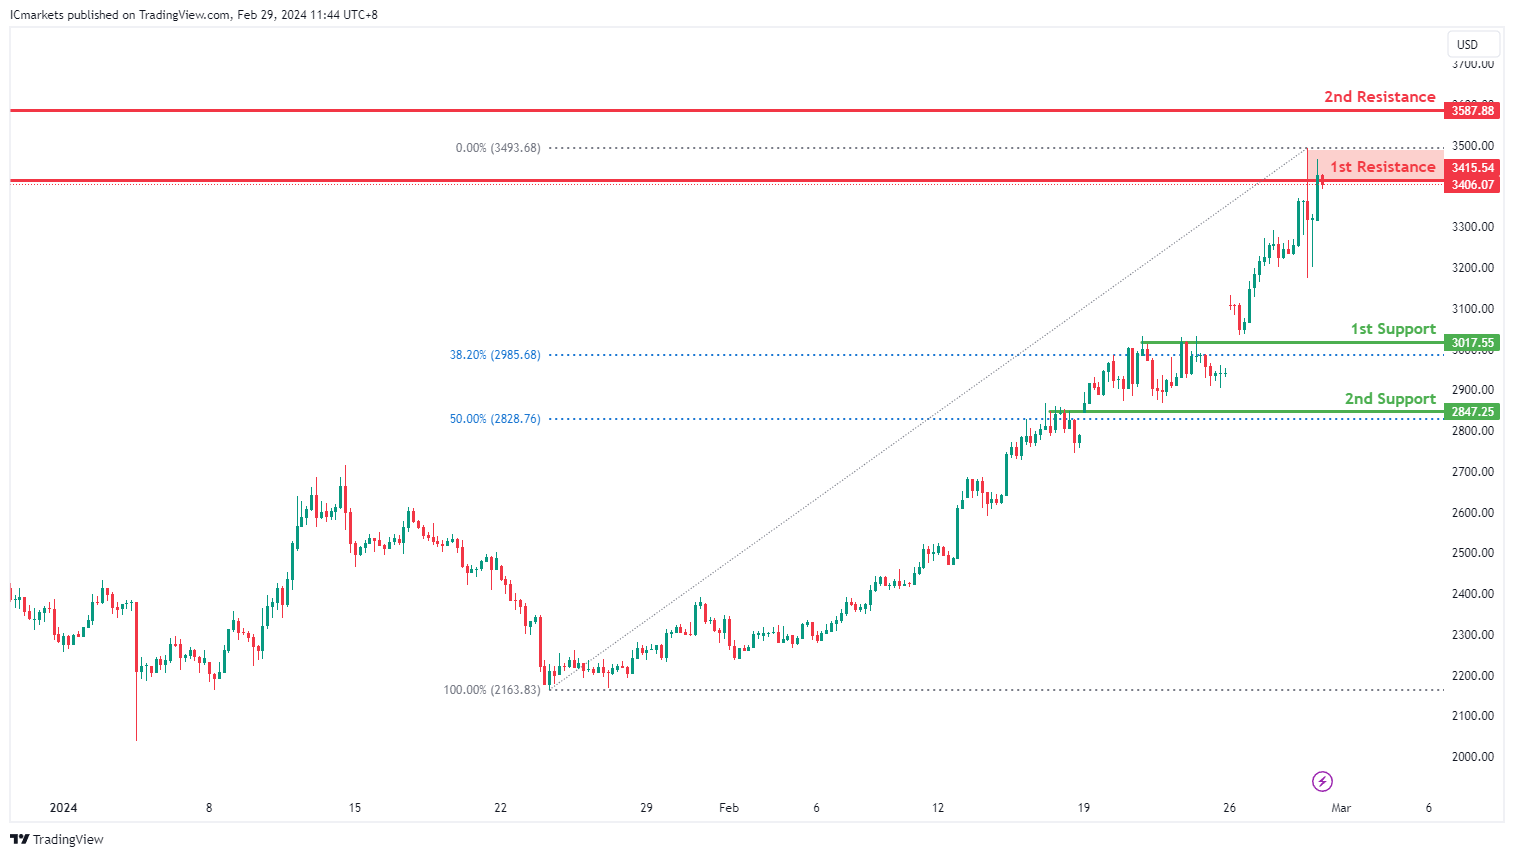
ETH/USD:
The ETH/USD chart currently demonstrates an overall bullish momentum. However, there is a potential scenario for price to make a bearish reaction off the 1st resistance.
The 1st resistance level at 3,415.54 is identified as an overlap resistance. Higher up, the 2nd resistance level at 3,587.88 is also noted as an overlap resistance, adding to its significance as a potential barrier to further bullish movement.
On the support side, the 1st support level at 3,017.55 is identified as an overlap support that aligns with the 38.20% Fibonacci Retracement level. Further below, the 2nd support level at 2,847.25 is also marked as an overlap support that aligns with the 50.00% Fibonacci Retracement level, further reinforcing its significance as a potential area of support.
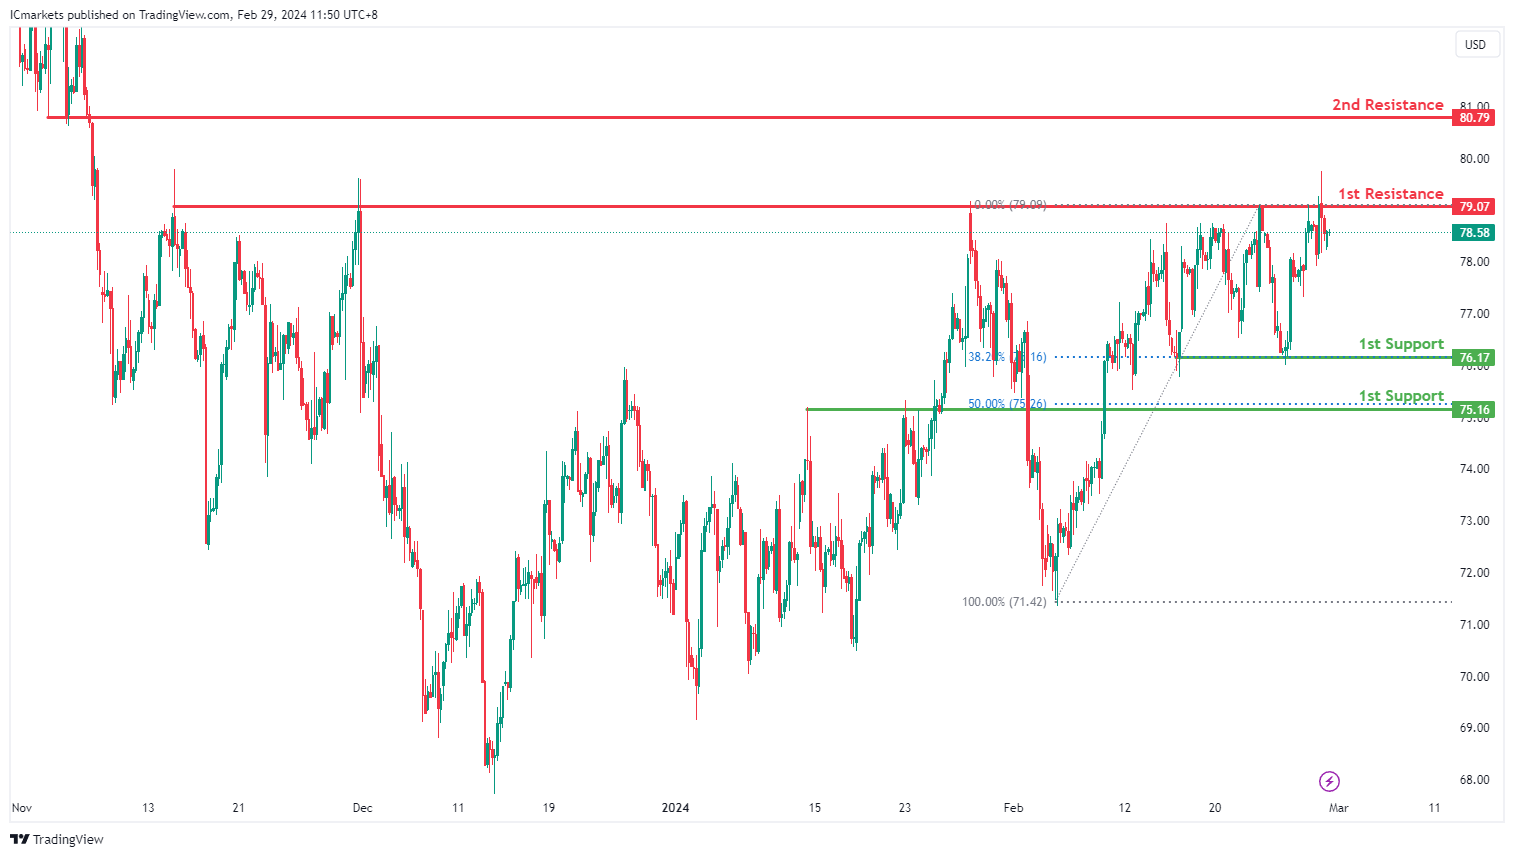
WTI/USD:
The WTI (West Texas Intermediate) chart currently exhibits a neutral bias. In this context, there is a potential scenario for price to fluctuate between the 1st support and the 1st resistance.
The 1st resistance level at 79.07 is identified as a multi-swing-high resistance. Higher up, the 2nd resistance level at 80.79 is marked as a pullback resistance, further highlighting its importance as a potential resistance zone.
To the downside, the 1st support level at 76.17 is identified as a pullback support that aligns with the 38.20% Fibonacci Retracement level. Further below, the 2nd support level at 75.16 is also marked as a pullback support that aligns with the 50.00% Fibonacci Retracement level, reinforcing its significance as a key support level.
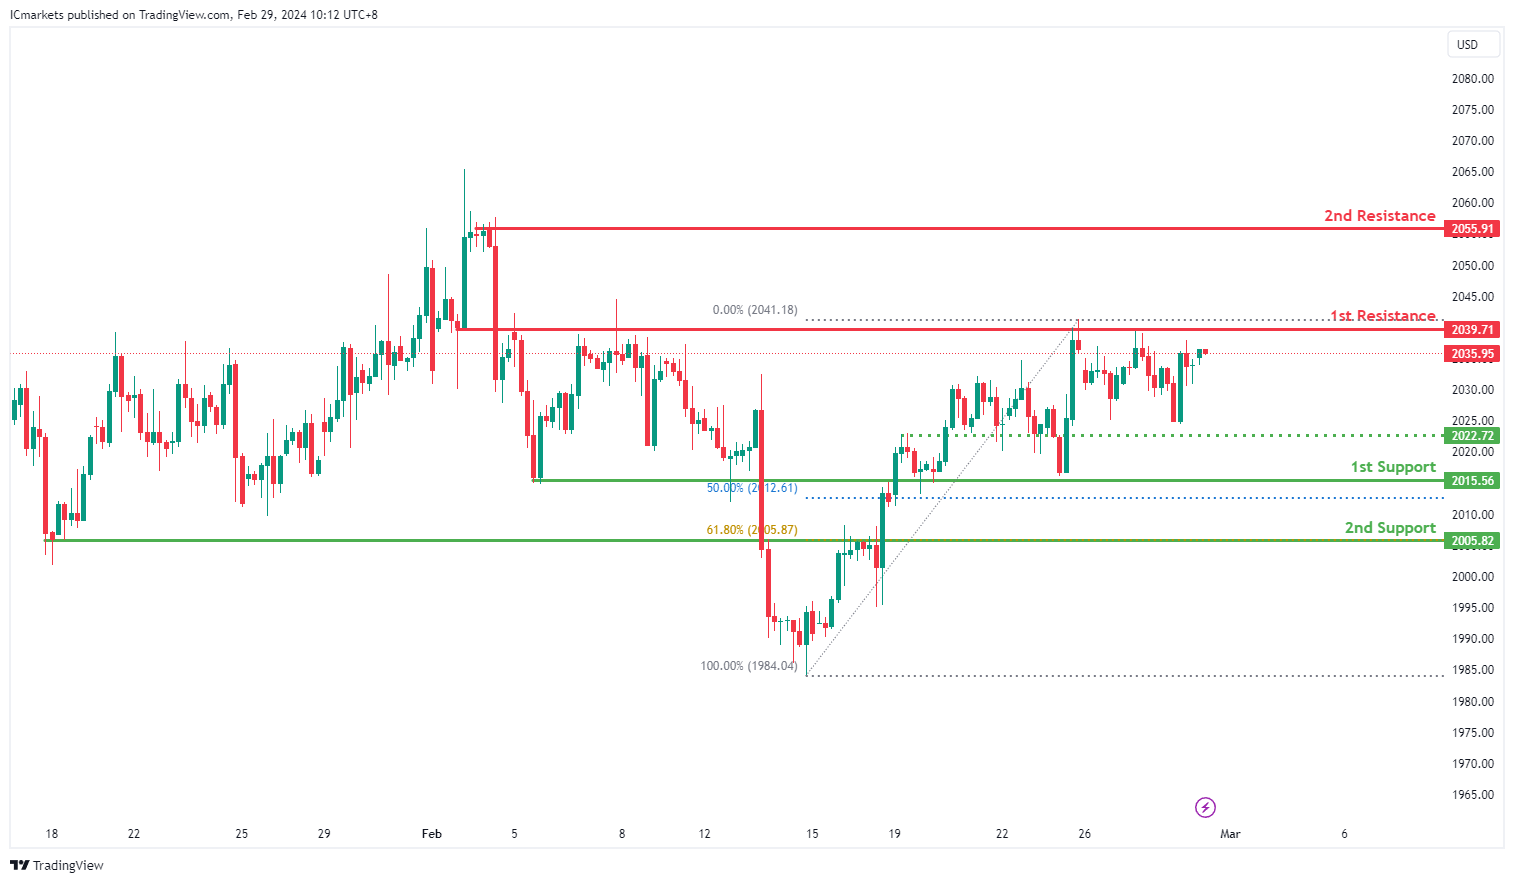
XAU/USD (GOLD):
The XAUUSD chart currently demonstrates neutral momentum, indicating a potential fluctuation between the 1st resistance and 1st support levels.
The 1st support at 2015.56 is significant due to its alignment with an overlap support and the 50% Fibonacci Retracement level, suggesting historical buying interest and potential support for the price.
Further reinforcing potential support, the 2nd support at 2005.82 coincides with an overlap support and the 61.80% Fibonacci Retracement level, adding to its significance as a level where buyers may intervene to support the price.
On the resistance side, the 1st resistance at 2039.71 represents an overlap resistance, historically acting as a barrier to upward movement.
Additionally, the 2nd resistance at 2055.91 denotes a multi-swing high resistance, indicating another significant level where selling interest may intensify, potentially limiting further upward momentum.
The intermediate support at 2022.72 further supports potential price stability, aligning with a pullback support level, where buying interest may reemerge to support the price.
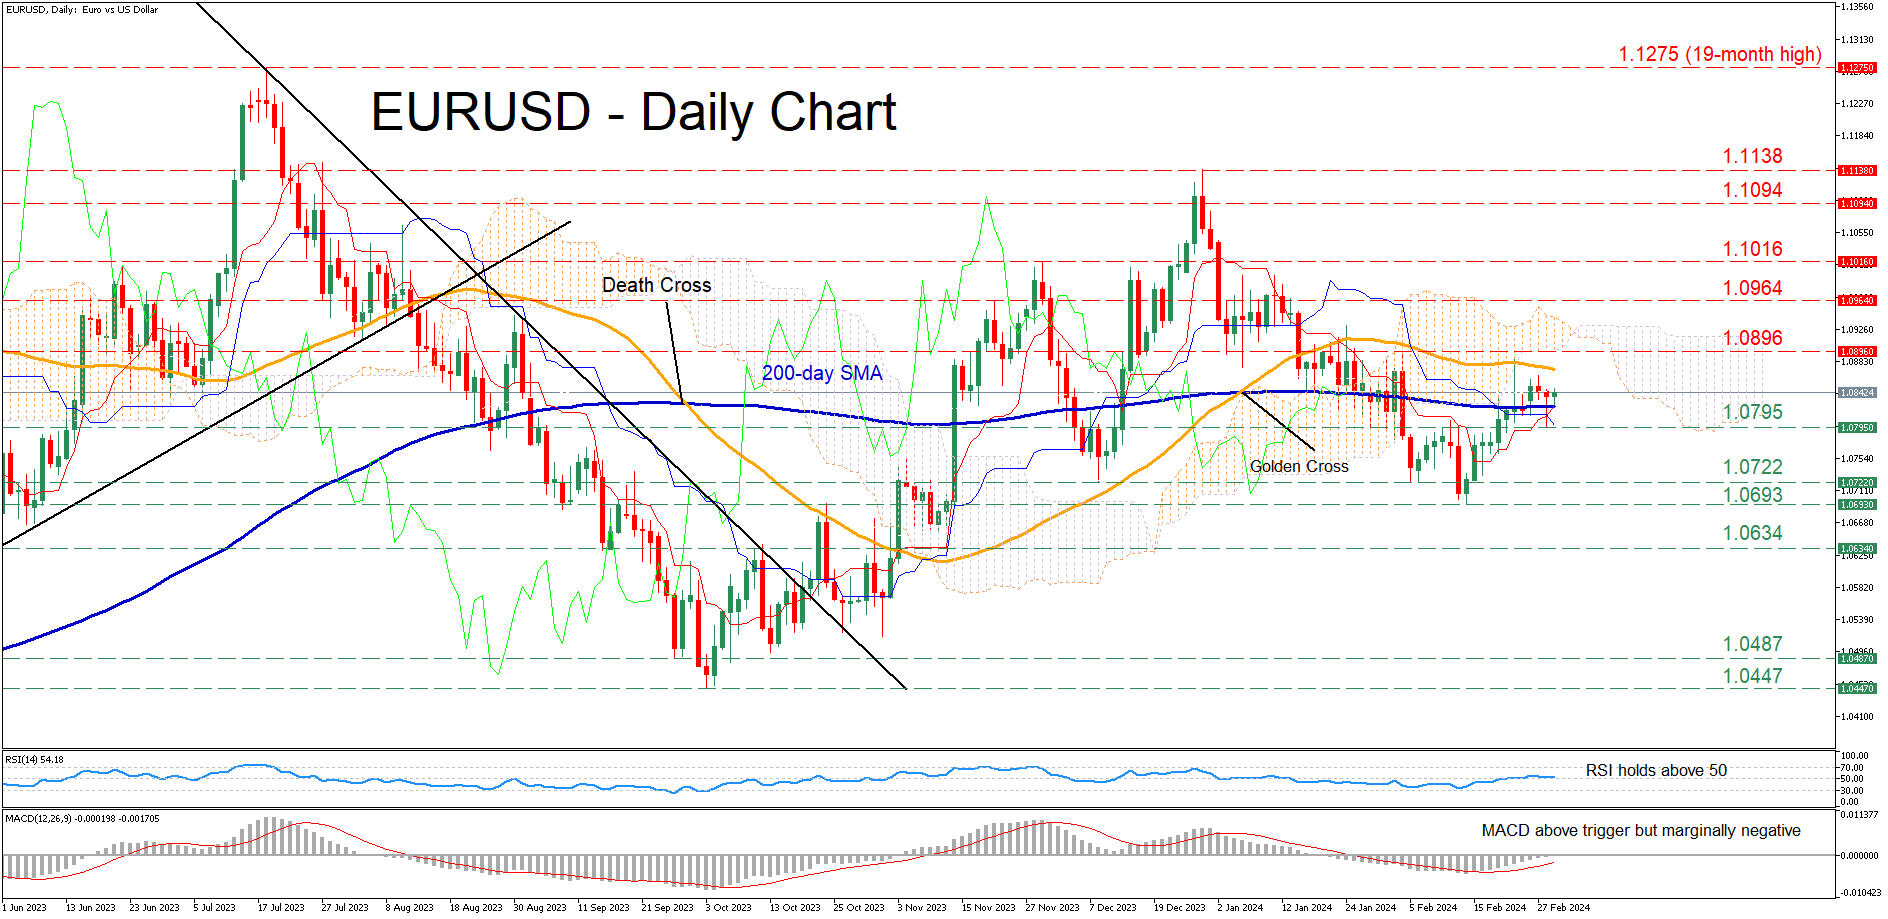
EURUSD Remains Stuck Between SMAs
- EURUSD trades in a range defined by 50- and 200-day SMAs
- Momentum indicators are marginally tilted to the upside
EURUSD has posted a mild recovery following its pullback from the December high of 1.1138 to the 2024 bottom of 1.0693. However, the pair’s rebound has stalled at the congested region that includes the 50-day simple moving average (SMA) and Ichimoku cloud, with the price consolidating between the 50- and 200-day SMAs.
Considering that both the RSI and MACD are providing cautiously positive signals, the pair might claim the 50-day SMA and test the January-February resistance of 1.0896. Higher, the November resistance of 1.0964 could prove to be the next barrier for the bulls to overcome. A violation of that territory could pave the way for the November high of 1.1016.
Alternatively, should the pair fall back below the 200-day SMA, immediate support could be found at the 1.0795 hurdle. Sliding beneath that floor, the price may challenge the December bottom of 1.0722. Even lower, the 1.0634 barricade could provide downside protection.
In brief, even though EURUSD’s rebound has come to a halt, the 200-day SMA has prevented further declines. Therefore, a break above or below the recent range defined by the pair's SMAs is likely to be followed by an aggressive move in the same direction.