Sample Category Title
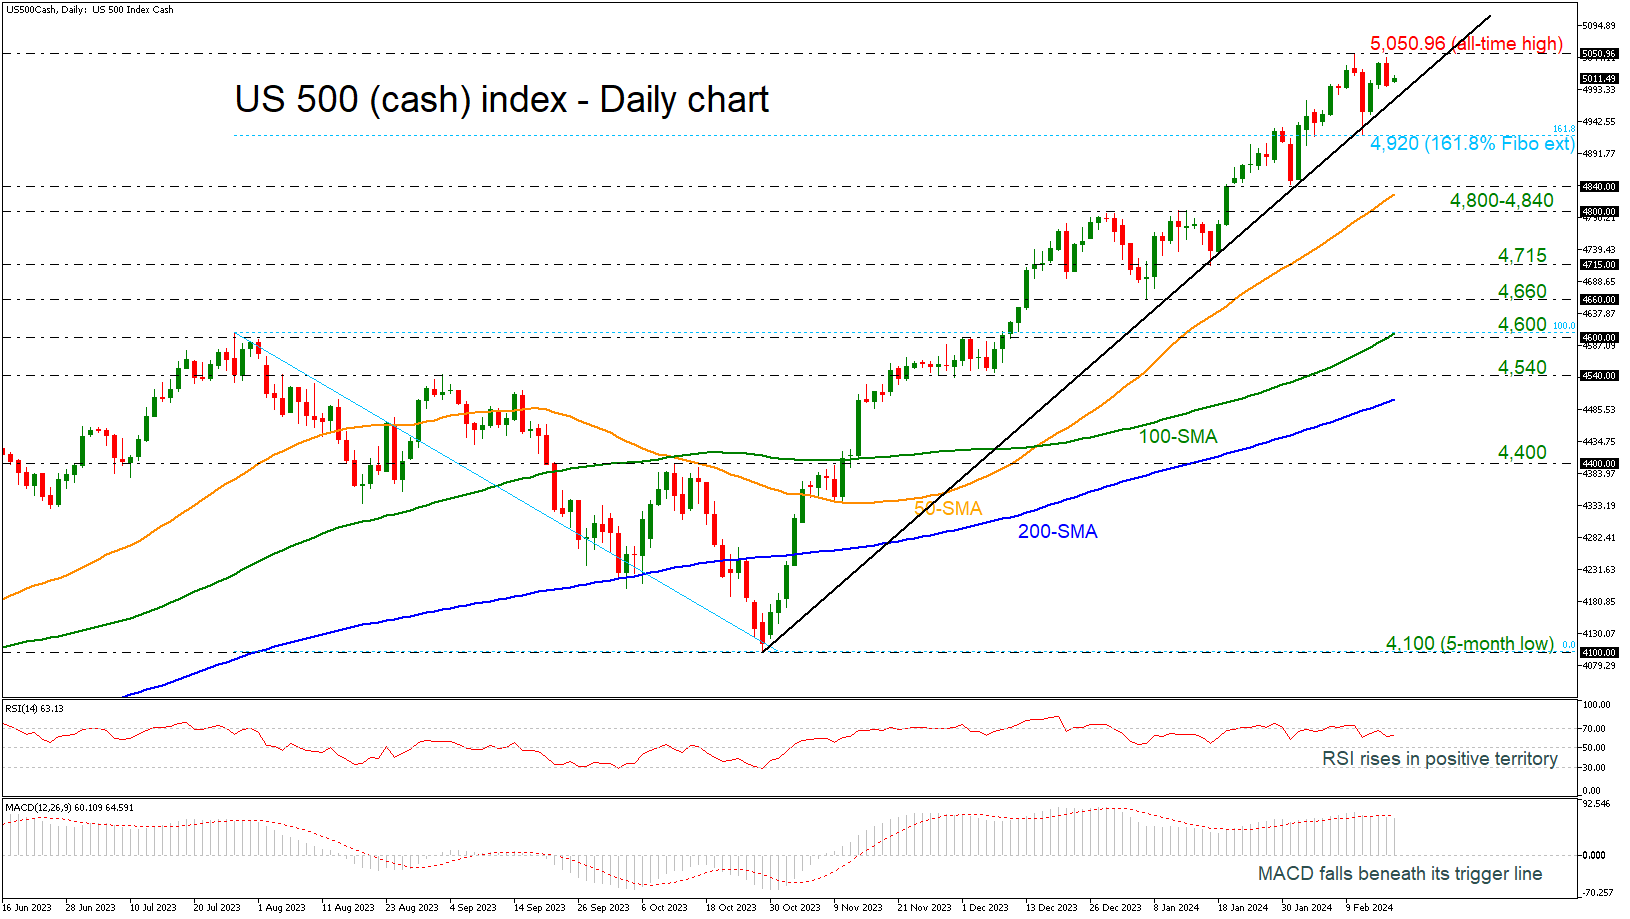
US 500 Index Gets Assistance After Rejection from All-time High
- US 500 holds above ascending trend line
- But technical oscillators losing some ground
The US 500 (cash) index was challenging the all-time high of 5,050.96 in the previous sessions, before pulling lower near the 5,000 round number. The market is holding slightly above the steep ascending trend line, which has been drawn from October 27.
Technically, the bulls might still be in town as the RSI is still clearly above its 50 neutral mark despite losing some ground. But any gains could be short-lived as the MACD seems to have peaked in the positive territory and is heading south beneath its trigger line.
In the event the price stays resilient above the 5,000 critical level and the rising trend line, the bulls might push for a close above the record peak of 5,050.96, heading towards the next psychological marks, such as 5,100 and 5,200.
However, if downside pressures resume, the index will remain attractive unless it exits the bullish formation below the 161.8% Fibonacci extension level of the down leg from 4,100 to 4,600 at 4,920. If that bearish scenario is unveiled, selling forces could intensify towards the 4,800-4,840 support area, which encapsulates the 50-day simple moving average (SMA). Then, additional losses from there could retest 4,715 barricade.
In a nutshell, the US 500 index may remain supported in the coming sessions, though room for improvement could be limited before the next bearish round takes place, probably beneath the uptrend line.
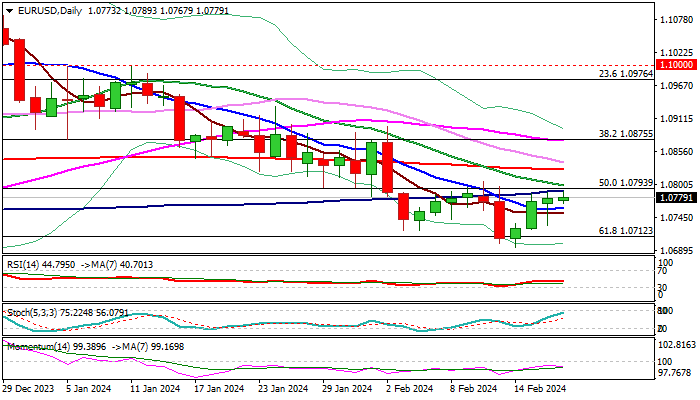
EUR/USD: Larger Bears Likely to Resume After Limited Correction
The Euro narrowed range in holiday-thinned Monday trading, as bounce from last Wednesday’s 13-week low (1.0695) started to lose traction after being repeatedly capped by 100DMA (1.0790).
Formation of bear-trap below Fibo 61.8% support on Friday was bullish signal, but positive impact was offset by weak daily studies (negative momentum/MA’s in bearish setup), with increased risk of recovery stall expected while the price action stays below important barriers at 1.0790/1.0830 zone (converging 100/20DMA’s/Fibo 23.6% of 1.1139/1.0695 / daily cloud base).
Such scenario could also be boosted by extended hawkishness from the Fed (FOMC minutes of the last policy meeting will be released late Wednesday), which would further inflate dollar on extended period of unchanged interest rates and delay of rate cuts.
Return and close below 10DMA (1.0762) will generate initial bearish signal and make the downside more vulnerable of renewed probe through cracked 1.0712 Fibo support, loss of which to signal continuation of larger downtrend from 1.1139 (Dec 28 top)
Res: 1.0800; 1.0830; 1.0864; 1.0875.
Sup: 1.0762; 1.0712; 1.0695; 1.0611.
Bitcoin and Ether in Area of Light Resistance
Market picture
The crypto market capitalisation reached $1.99 trillion, according to CoinMarketCap estimates, an increase of over 10% in one week. Forbes estimates that the $2 trillion mark was reached last week. Either way, the growth momentum is clear and very strong. Over the last 24 hours, Bitcoin gained 1.4%, overtaken by Ethereum (+4.4%) and Solana (+3.5%). BNB (-0.6%) and XRP (+0.9%) could not keep up with the current market.
Bitcoin is approaching $52.5K, having quickly found buyers after Saturday’s drawdown. Monday starts with active buying, bringing the price back to the range highs of the last five days, which are the highs since November 2021. Technically, bitcoin has no meaningful resistance levels until the area approaches $64K.
Active building of call option positions with strikes of $60K to $80K, as well as fierce demand for ETFs, could push Bitcoin to an all-time high as early as March, according to QCP Capital.
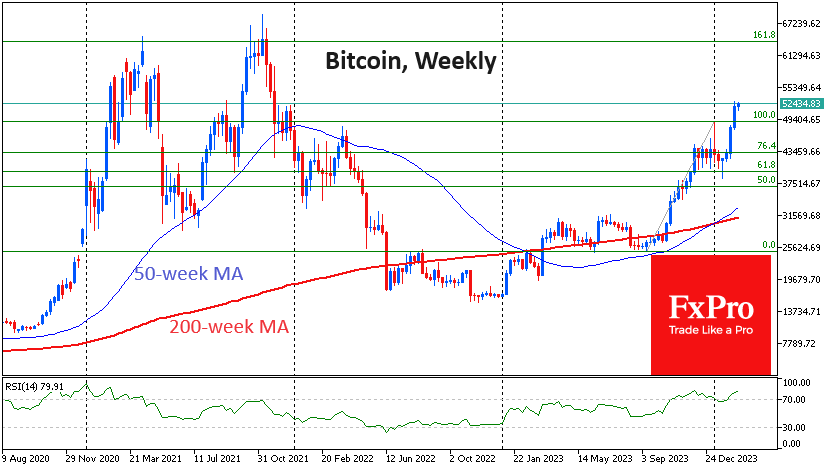
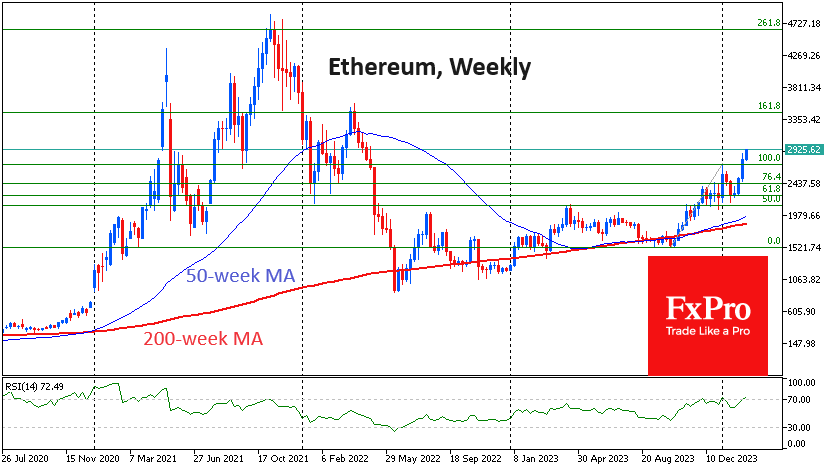
Ethereum is also trading in weak resistance territory after breaching the $2900 level. In April 2022, it plunged from levels near $3500 to $2000, with a complete capitulation at levels below $900. A recovery from $2000 to $3500 could be just as quick. This level is also close to 161.8% of the October to early December rally, which is a Fibonacci pattern.
News background
The Coinbase exchange posted a net profit of $273 million in the fourth quarter. For the year, the figure was $95 million on total revenue of $3.1 billion, the company said in a letter to investors. Coinbase acted as custodian for nearly all the spot bitcoin ETFs that received SEC approval in January.
MicroStrategy, the largest corporate holder of bitcoin, told shareholders that the company’s capitalisation would grow significantly in 2023 and that it was ready for inclusion in the S&P 500 index.
Bankrupt cryptocurrency lender Celsius said that $2 billion worth of crypto assets have already been transferred to lenders, including 20,255 BTC and 301,338 ETH.
Investment firm VanEck has filed a revised proposal with the SEC to launch a spot Ethereum-ETF. VanEck joins Franklin Templeton, Grayscale, BlackRock and Invesco in the race for Ethereum-based exchange-traded products. Some experts believe the regulator will register the products in May.
Galaxy Digital estimates that about 15-20% of the total computing power of the Bitcoin network will be unprofitable after the halving in April. The calculations are based on a BTC price of $45,000 and a 15% transaction fee.
The attractiveness of Tether’s USDT compared to other stablecoins is likely to diminish as future regulations in the US will require greater transparency and compliance with new KYC/AML standards, JPMorgan said. The bank believes that regulations for stablecoins will be coordinated globally through the Financial Stability Board within the G20.
Christopher Waller, a member of the Federal Reserve Board of Governors, believes that the popularity of stablecoins pegged to the US dollar will help maintain the dollar’s status as the world’s reserve currency.
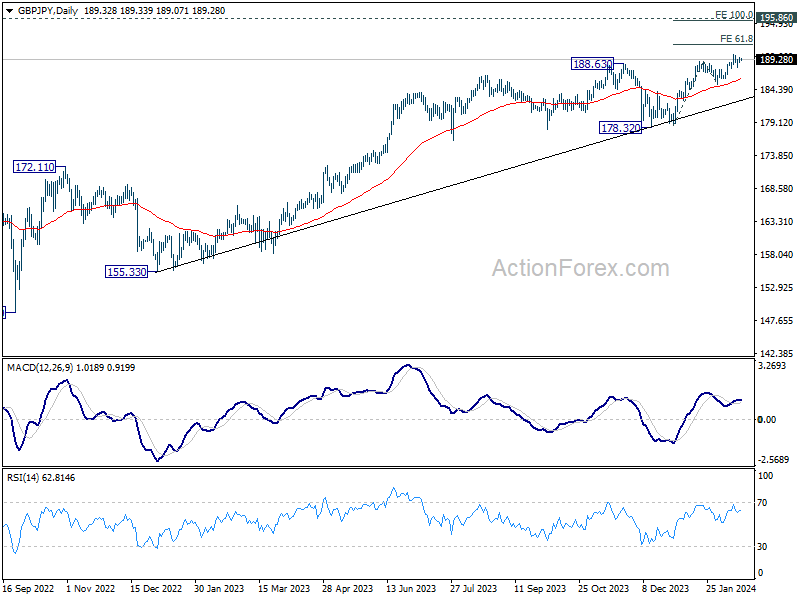
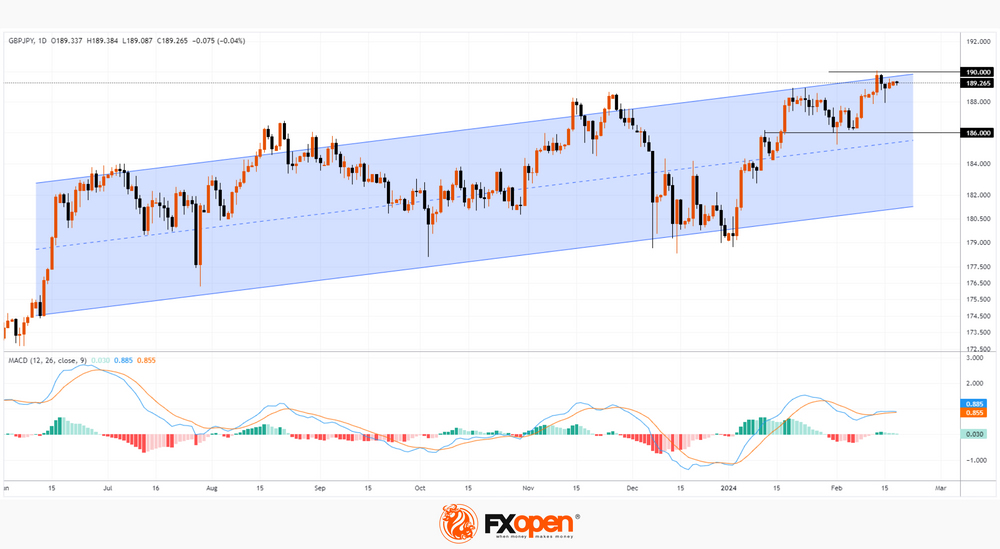
GBP/JPY: Price Corrects from 8.5 Year High
According to CNN, the economies of the UK and Japan entered a technical recession last week as data showed a second consecutive quarterly decline in gross domestic product. And if in the UK the economic downturn can be associated with high inflation and the strict policies of the Bank of England, then in Japan the reason may be the population decline (which has been going on for 14 years in a row).
At the same time, the GBP/JPY chart shows that last week the rate exceeded 190 yen per pound for the first time since August 2015.
However:
→ the price is at the upper border of the ascending channel (shown in blue);
→ at the beginning of this week, the price of GBP/JPY is below the 190 yen level – and a false bullish breakout of the psychological level should be regarded as a bearish sign;
→ the MACD indicator indicates that demand forces are fading.
Perhaps market participants are inclined to take profits from longs. Since it is possible that the Japanese authorities are able to announce some decisions aimed at supporting the yen. In this case, one of the immediate targets for the bears may be the level of 186 yen per pound – where the support level (formerly the resistance level) is located, reinforced by the median line of the long-term channel.
Trade over 50 forex markets 24 hours a day with FXOpen. Take advantage of low commissions, deep liquidity, and spreads from 0.0 pips. Open your FXOpen account now or learn more about trading forex with FXOpen.
This article represents the opinion of the Companies operating under the FXOpen brand only. It is not to be construed as an offer, solicitation, or recommendation with respect to products and services provided by the Companies operating under the FXOpen brand, nor is it to be considered financial advice.
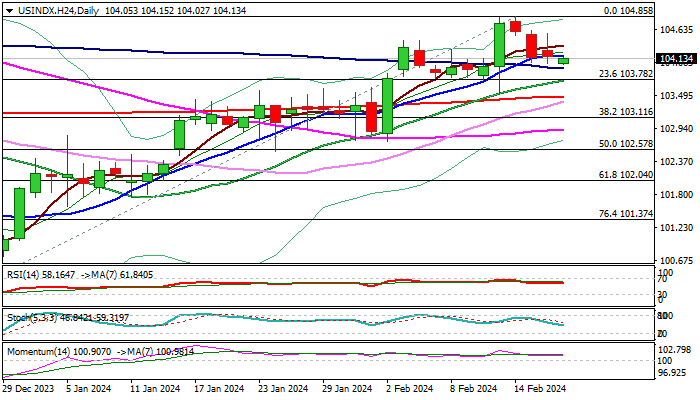
Dollar Index – Bulls Start to Regain Traction After Shallow Pullback
The dollar index edged higher in early Monday after last week’s pullback from three-month high (104.85) was repeatedly rejected just above 100DMA (103.96), generating initial signal that correction might be over.
The dollar continues to benefit from signals that sticky inflation may delay widely expected Fed rate cuts, with focus on FOMC minutes (due on Wednesday).
The greenback will receive fresh boost if the minutes maintain hawkish tone and point to decision to keep interest rates on hold in March.
Fresh bulls look for renewed attack at Fibo level at 104.42 (61.8% of 106.96/100.29), break of which to neutralize negative signal from bull-trap pattern formed on weekly chart and expose next target at 105.39 (Fibo 76.4%).
Technical picture on daily chart is also supportive as momentum remains positive and MA’s are predominantly in bullish configuration, with bullish near-term bias while the price stays above 100DMA.
Caution on violation of 100DMA which would risk test of lower pivots at 103.78 (20DMA (Fibo 23.6% of 100.29/104.85) and 103.48 (200DMA).
Res: 104.42; 104.56; 104.85; 105.39
Sup: 103.96; 103.78; 103.48; 103.11
Could Eurozone PMI Surveys Open the Door to a March ECB Rate Cut?
- All eyes are on growth as PMI and IFO surveys are released this week
- The market could be looking for dovish hints at the ECB minutes
- Euro remains on the back foot against the pound
- Euro area PMI surveys will be published on Thursday 09:00 GMT
Strong US data releases help the ECB hawks
The upside surprises recorded by the recent US labour market statistics and the US inflation report have forced the market to reconsider its monetary policy expectations for 2024. Apart from the Fed now being expected to cut by around 90bps this year, with the first rate cut priced in by the June meeting, the market has also reevaluated its ECB expectations with 100bps of rate cuts currently on the cards.
This is somewhat surprising as the euro area economic outlook remains bleak. December’s ECB staff projections are already out of date as the German budget shenanigans have almost doomed this year’s growth prospects, especially as the Chinese economic situation remains fluid. Even the modestly optimistic EU commission revised its 2024 forecasts lower last Thursday with the respectable 1.2% growth rate for the euro area cut to just 0.8%. Germany is expected to barely grow, thus removing a possible headwind for the ECB doves.
In this context, the final GDP print for the fourth quarter for 2023 will be published on Friday and it will most likely confirm that Germany did not grow last year. More importantly, on the same day, the forward-looking Germany IFO survey for February will be released. The ECB hawks would love a sizeable upside surprise, but market expectations point to a marginal pickup.
Euro area PMIs could set the tone until the March ECB meeting
At the January ECB gathering president Lagarde stated that “the recent PMI numbers are actually a little indication that things are coming in place for recovery in 2024”. On Thursday morning the preliminary release of the February PMI surveys will be published, and the market will have the chance to gauge if president Lagarde’s statement has been accurate.
The euro area PMI surveys remain comfortably below the 50-threshold as both the German and French sub-indicators remain subdued. While the latter can be partially explained by the repeated workers’ strikes and the recent farmers protests reacting to the updated Common Agricultural Policy, the German figures are a cause for concern for the ECB hawks. The evident reason is the growth slowdown seen across the euro area but also the ongoing economic developments in China.
Efforts by the Chinese authorities to stimulate the economy have not yet produced fruit possibly because the measures up to now have been below par. The recent set of announcements aiming to prop up the Chinese stock markets are not really expected to impact the real economy but, at the moment, it appears cheaper for the Chinese administration to boost the financial markets’ morale than engineer some economic momentum.
ECB minutes to show how patient ECB members really are
Also on Thursday, the minutes from the January ECB meeting will be published. Despite certain investment houses expecting a dovish show, in January president Lagarde et al repeated the data dependent approach and highlighted the need for patience in order to examine more data, particularly on wages.
The minutes are probably not going to hold many surprises, but it will be interesting to see the discussion that took place during the two-day gathering. More specifically, the comments made by the dovish camp, which seems to be fighting tooth and nail to get going with the rate cuts. As the March 7 meeting approaches, the market is itching for further information that the ECB is ready to signal the start of rate cuts.
Euro is trying to recover lost ground against the pound
Since the start of 2024, the euro has been on the back foot against the pound with the pair recently recording a new five-month low. Last week’s mixed UK data allowed the euro bulls to recoup part of their recent losses, but they probably need growth-positive data to reverse the current bearish trend.
A positive set of figures this week could push the euro/pound pair higher with the busy 0.8615-0.8635 area likely being the initial target. On the flip side, another weak set of PMI surveys would reinvigorate the dovish ECB expectations, transform the March ECB meeting into a live one, and possibly help the euro bears retest the recent low of 0.8497.
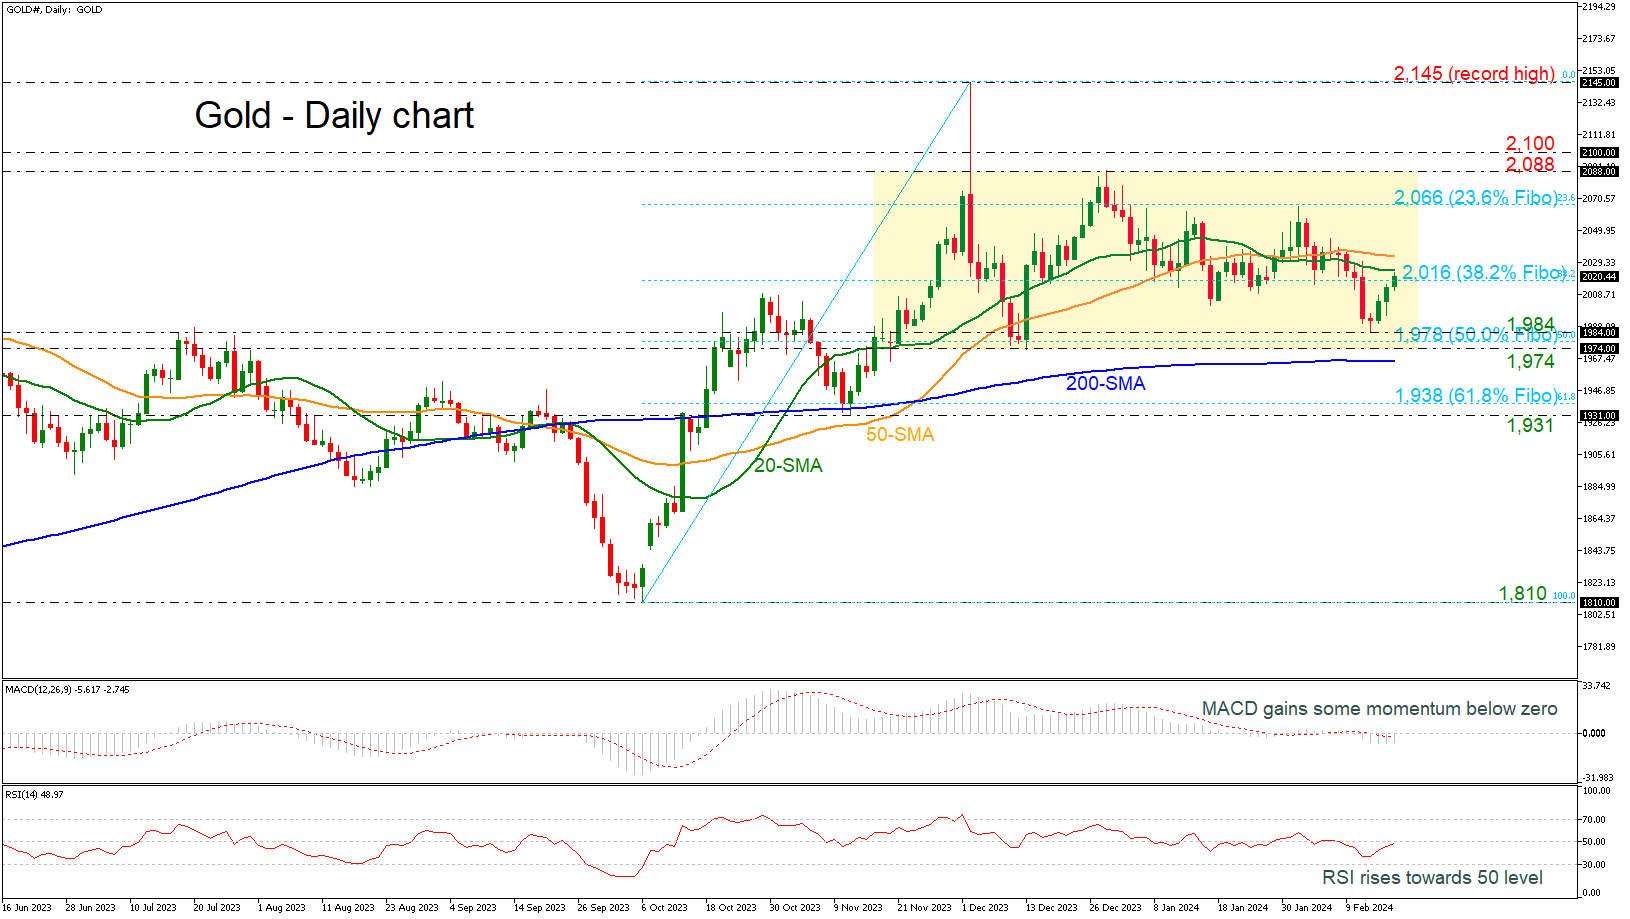
Gold Tests Tricky Area Within 38.2% Fibonacci
- Gold remains in trading range in short-term
- Price rebounds off 1,984
- MACD and RSI suggest buying interest
Gold is moving higher again today, recording its third consecutive green candle after bouncing off the 1,984 support level. It is currently testing the 38.2% Fibonacci retracement level of the up leg from 1,810 to 2,145 at 2,016 and the 20-day simple moving average (SMA) at 2,024.
The market has been developing within a consolidation area over the last three months and continues to do so, with the technical oscillators suggesting an upside recovery. The MACD is gaining some momentum beneath its trigger and zero lines, while the RSI is moving higher towards the neutral threshold of 50.
In the event the pair re-activates its upward move above the 20- and the 50-day SMAs, the next target will be the 23.6% Fibonacci of 2,066. Even higher, the bulls might head for the 2,088-2,100 restrictive region, which is also the upper boundary of the trading range. A successful break above this zone could endorse the bullish movement until the record peak of 2,145.
On the downside, the 1,984 support level has been guarding selling forces over the past two days. Hence, a step beneath that line at the 50.0% Fibonacci of 1,978 and the 1,974 barrier might produce fresh negative volatility, likely squeezing the price towards the 200-day SMA at 1,965. Another defeat there could add more fuel to the bearish wave, bringing the 61.8% Fibonacci of 1,938 immediately under the spotlight.
Overall, gold is sustaining an upward move but in order to attract new buyers, the commodity will need to pierce through the 2,088-2,100 bar.
News Flow is Thin and Will Stay So for the Remainder of the Day
Markets
US Treasuries tested sell-off lows on Friday after January producer price inflation delivered the third upset of the week when it comes to price developments. CPI inflation and import/export prices earlier on the week showed signs of sticky (services) inflation as well. The trio triggered a new big repricing in Fed policy rate expectations. The preferred market scenario for a first 25 bps rate cut switched from May to June after having been pushed from March to May earlier on the month following a stellar payrolls report. By the time of the May Fed policy meeting, the US central bank will only have two additional CPI reports (3 PCE deflators) at its disposal which is almost impossible to bring the longed-for confirmation that inflation is sustainably on a path towards the 2% inflation goal. More and more Fed members stick to their December views on the total amount of 2024 rate cuts as well. Fed Chair Powell was the first to do so prominently in the 60 Minutes interview with SF Fed Daly on Friday also confirming that three policy rate cuts for this year seems reasonable. Atlanta Fed Bostic is in the two rate cut camp with a first one expected only by July. US money markets continue shifting in the Fed’s direction with currently “only” 4 policy rate cuts discounted over the course of the year compared to six just a month ago. Daily changes on the US yield curve eventually ranged between +2.7 bps (30-yr) and +6.8 bps (2-yr). German yields followed the upward trajectory, ending 1.3 bps (30-yr) to 6.1 bps (2-yr) higher. European stock markets closed the final session of last week with small gains resulting from a good start (catch-up with WS on Thursday evening) whereas the unpleasant PPI release saddled US benchmarks with losses of up to 0.82% for Nasdaq. The dollar initially rallied from EUR/USD 1.0770 to 1.0730, but the move didn’t last despite the more fragile risk climate. EUR/USD is currently approaching resistance coming from the upper bound of the YTD downward trend channel around 1.0790.
Chinese markets reopen following Lunar NY celebrations, but they don’t leave much traces on trading. Stock markets are slightly higher while CNY fixes almost bang in line with one week ago (USD/CNY 7.20 area). News flow is thin and that will stay so for the remainder of the day. Volumes are further reduced by the US public holiday (President’s Day), suggesting some sentiment-driven trading within existing technical ranges. Later this week, attention shifts to an ECB tracker of negotiated wages (tomorrow), Minutes of previous Fed (Wednesday) and ECB (Thursday) meetings and global February PMI’s (Thursday).
News & Views
Rating agency Fitch affirmed Belgium’s AA- rating with a negative outlook. The negative outlook reflects the risk that fiscal consolidation might be insufficient to achieve debt stabilization over the medium term. The country’s budget deficit should narrow gradually to 3.5% of GDP from 4.3% in 2023 as Fitch expects structural fiscal adjustments of 0.5% of GDP per year. However, this is counterbalanced by rising age-related budgetary costs and rising interest rate expenditures. Belgium is likely to be placed under the EU’s Excessive deficit procedure this year. Fitch sees the Belgian debt to GDP ratio at 107.5% in 2027 from 105.3% end 2023. The rating agency also mentions political uncertainty related to the outcome of the June 9 2024 elections. The risk of a prolonged political standstill could push back the budget preparation and progress on consolidation. Belgium’s 2024 growth is expected at 0.8% in 2024 down from 1.5% in 2023, with especially a negative contribution from net exports weighing on growth.
French Finance Minister Le Maire downwardly revised the country’s growth forecast to 1% from 1.4%. Geopolitical tensions (Ukraine, Middle East) and poor economic growth in China and Germany are mentioned as reasons for the downgrade. The government also announced plans to cut spending by €10bn. The actions should keep the country on track to reduce the budget deficit to 4.4% of GDP this year (from 4.9%). Le Maire vowed that the measures would not result in increasing taxes. The government is keeping open the option of implementing a supplementary budget in summer, depending on the economic circumstances and the political situation.
Swedish Inflation Data Kicks Off the Week
In focus today
This morning we will get Swedish inflation data for January. We expect an increase in CPIF inflation to 3.2% y/y, while core inflation (CPIF excl. Energy) should fall to 4.4% y/y.
This week's calendar contains several important releases to watch. Both the Fed and ECB will publish minutes from their latest meetings, while February PMI data for Japan, Europe and the US will be in focus. Overnight, we may see a cut in the Chinese Loan Prime rate as the economy and China's markets needs more fuel.
Note that today it is Presidents' Day and US equities and bond exchanges will be closed.
Economic and market news
What happened over the weekend and on Friday
US producer prices rose more than expected in January, with Friday's release showing a 0.3% m/m increase (cons. 0.1%). The beat echoes the stronger-than-expected CPI release for January. In both cases services costs were the main culprit, although there could be a one-off January effect with higher-than-normal price adjustments to make up for past cost increases. Additionally, the University of Michigan consumer survey showed an increase in short-term inflation expectations to 3.0% (prev. 2.9%), while 5-10-year expectations remained unchanged at 2.9%. In response, markets dialled down slightly the expectations for a June rate cut, while the USD initially gained but finished the session close to flat.
We heard hawkish tones from ECB's Schnabel in a speech on Friday, when she said that weak Eurozone productivity growth may postpone the return to the 2% inflation target. As firms are facing rising unit labour costs, low productivity growth increases the risk that the bulk of these costs are being passed on to consumer prices. Schnabel concluded that the low productivity growth is a strong argument for not adjusting the policy stance too early. Our base case is still that the ECB will deliver its first rate cut in June.
Equities: Global equities were marginally lower Friday as US markets dropped while other regions were higher. Equities were still higher for the week despite the short end of the yield curve pushing higher. Main takeaways last week were the return of inflation fear and in that perspective, it was interesting to note the resilience in equities. With yields higher it was not surprising to see the value outperforming and growth underperforming including the US. Small caps had a very volatile week, but they still managed to outperform large cap by 1%. Asian countries are mostly higher this morning with all markets trading again after the Lunar New Year. European futures are lower this morning while US futures are slightly higher.
FI: The stronger than expected US producer prices sent US Treasury yields rising on Friday as the market continues to reprice monetary policy expectations. We have now priced out two rate hikes in 2024 from the Federal Reserve since early February. This is also confirmed by recent comments from various Federal Reserve Officials. We have seen much the same picture for the European rates, where we have also priced out almost two hikes in 2024.
FX: Last week's price action in FX markets failed to deliver any major inter-week moves in a set of sessions primarily characterised by volatility surrounding the US CPI print and a subsequent reversal of those moves. EUR/USD traded as low as 1.07 but ended the week at close to unchanged levels just south of 1.08. The CHF traded somewhat softer on the back of lower-than-expected CHF-inflation while both SEK and NOK posted modest gains.
GBP/JPY Daily Outlook
Daily Pivots: (S1) 188.89; (P) 189.21; (R1) 189.59; More...
Intraday bias in GBP/JPY remains neutral and some more consolidation could be seen below 190.05. Further rally is expected with 187.83 minor support intact. Break of 190.05 will target 61.8% projection of 178.71 to 188.90 from 185.21 at 191.50. However, break of 187.83 will turn bias to the downside for deeper correction back to 185.21 support instead.
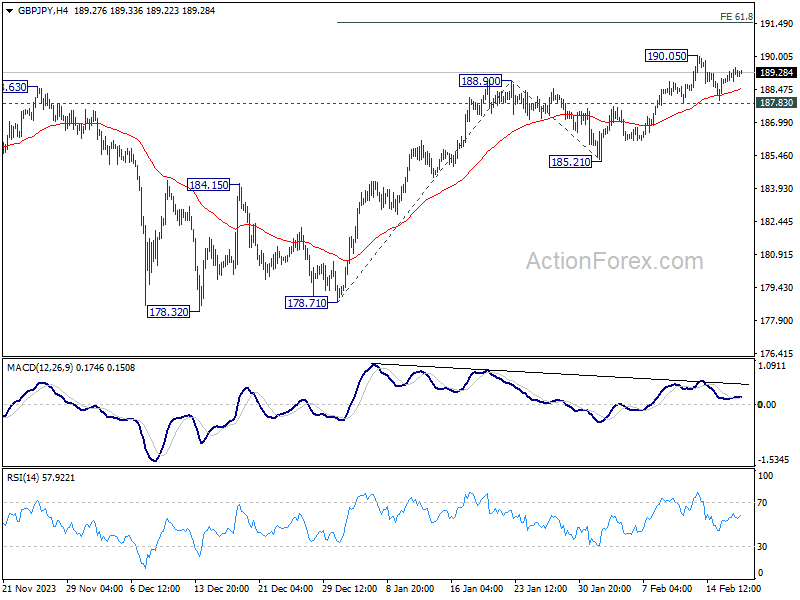
In the bigger picture, up trend from 123.94 (2020 low) in in progress. Medium term outlook will stay bullish as long as 178.32 support holds. Next target is 195.86 long term resistance (2015 high).