
Sample Category Title
GBP/USD: Limited Recovery Warns of Prolonged Sideways Mode
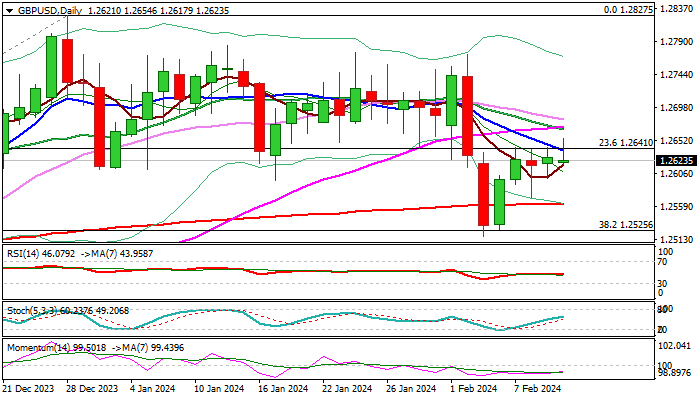
Cable ticked higher and hit new highest since Feb 2 in early Monday but was so far unable to sustain gains, keeping the price within congestion which extends into fourth straight day.
A double Doji (Fri/Thu) signal indecision as daily studies are mixed and keep near-term price action between 200DMA (1.2564) and falling 10DMA (1.2638).
Break of either side to generate initial direction signal, although more work at the upside will be required. Breach of sideways-moving and converged daily Tenkan-Kijun-sen (1.2645/51 respectively) to revive bulls, with lift and close above daily cloud top (1.2691) to confirm continuation of recovery leg from 1.2518 (Feb 5 low).
Conversely, break below 200DMA support to weaken near-term structure for renewed attack at 1.2525 pivot (Fibo 38.2% of 1.2037/1.2827 rally), violation of which to open way for deeper correction.
Res: 1.2651; 1.2670; 1.2691; 1.2755.
Sup: 1.2599; 1.2566; 1.2525; 1.2481.
EUR/USD: Recovery Likely to Stall Under the Base of Thick Daily Cloud
Recovery leg from 1.0723 double bottom (Feb 5/6) started to face increased headwinds on approach to daily Tenkan-sen (1.0810), with the base of thick daily cloud (spanned between 1.0828 and 1.0969) laying just above and adding pressure.
Initial signals of recovery stall are developing on daily chart as technical studies remain bearish (daily Tenkan / Kijun-sen are in bearish setup / 14-d momentum indicator remains in negative territory and 20/200 DMA death-cross is forming) suggesting selling upticks under cloud base for fresh attempt at 1.0712 Fibo support (61.8% of 1.0448/1.1139 ascend), violation of which to spark deeper drop towards 1.0600 zone.
Daily Kijun-sen (1.0860) marks an upper pivot, break of which to neutralize shorts.
Res: 1.0810; 1.0828; 1.0860; 1.0881.
Sup: 1.0741; 1.0723; 1.0712; 1.0660.

Bitcoin Pushes Cryptos Upwards
Market picture
The crypto market reached a capitalisation of $1.82 trillion in the early hours of trading on Monday. By the early European session, it had corrected to $1.8 trillion, but this is still more than 10% above the levels of a week earlier.
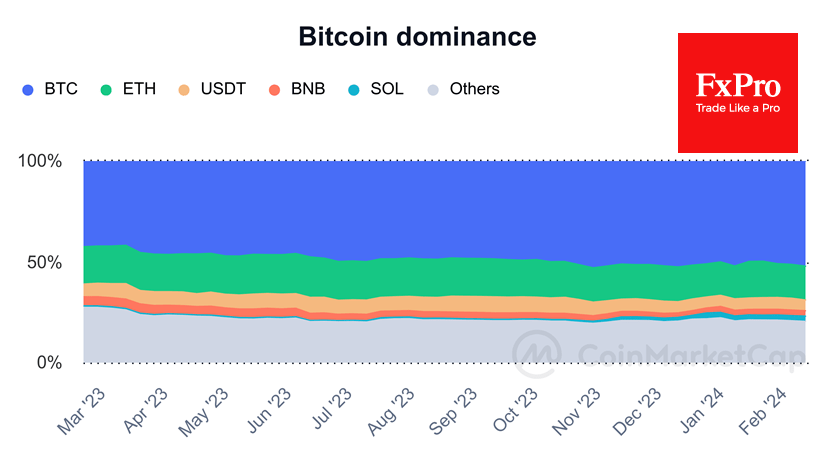
Bitcoin remains the most crucial growth driver, adding 12% in 7 days against about 8% for Ethereum, Solana, and Cardano – important drivers of the current cycle. Bitcoin now accounts for 52.6% of the entire crypto market, adding more than ten percentage points over the year and 1.5p. p. over the month.
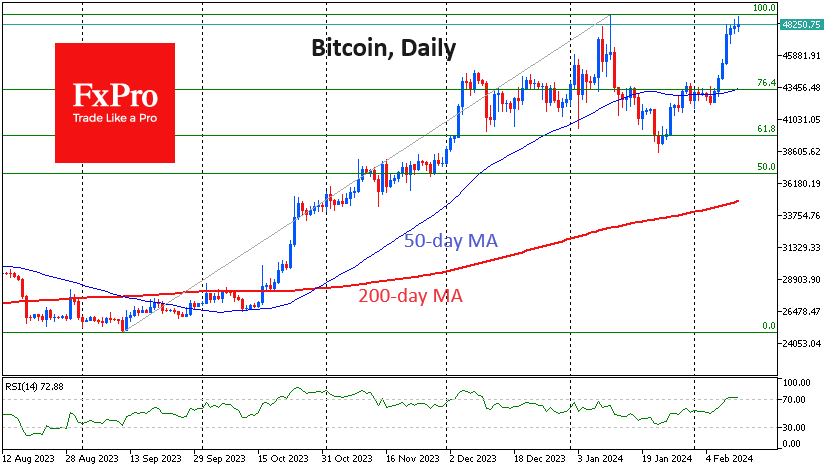
Bitcoin posted its seventh consecutive day of gains, but the strengthening slowed over the weekend. It also coincided with a move above 70 on the RSI on the daily timeframes, which could increase players’ appetite for short-term profit-taking. Caution is also building as we approach the January peak. Bulls have clearly become more cautious, closing the week at the highest since December 2021.
News background
According to The Block, a month after launch, assets in the top nine spot bitcoin-ETFs exceeded 200,000 BTC ($9.5bn). The new bitcoin ETFs climbed to second place in the ranking of commodity exchange-traded funds in the US by assets, becoming a more popular investment vehicle than silver ETFs.
At the same time, the assets of Grayscale’s GBTC fund have declined by 25% since 11 January, and in terms of trading volume, it has lost the lead to BlackRock’s bitcoin ETF.
BlackRock, one of the largest investment companies in the US, plans to add more bitcoins to its investment portfolio. BlackRock now has 82,515 BTC on its balance sheet, worth about $4 billion. Interest in Bitcoin among investors remains high, according to the investment company’s management.
Bankrupt cryptocurrency lender Genesis Global Trading has settled a lawsuit filed against it by the New York State Attorney General. Genesis will submit a plan of liquidation on 14 February.
The New York Attorney General’s office has expanded its lawsuit against Digital Currency Group. The amount of fraud was three times the original estimate, exceeding $3bn.
According to a study by the Coinbase exchange, US residents could save at least $74 million (or $600 per household) in 2022 if they used cryptocurrencies rather than credit cards for payments. That includes businesses that paid $126 billion to process credit card transactions.
Nikkei 225 Index Price Sets 34-year High
The price of the Nikkei 225 index is fixed above the level of 37,000 points. The last time this happened was after the index reached its all-time high in 1989.
The bullish behavior of the Japanese stock market has the following reasons:
→ Strong corporate reporting. In particular, SoftBank shares rose 11% due to increased sales of its subsidiary Arm, which develops chips for the development of artificial intelligence.
→ Dovish view of the Bank of Japan's monetary policy. Thus, Bank of Japan Vice Governor Shinichi Uchida said that the central bank will not aggressively tighten its monetary policy even if it ultimately decides to end negative interest rates.
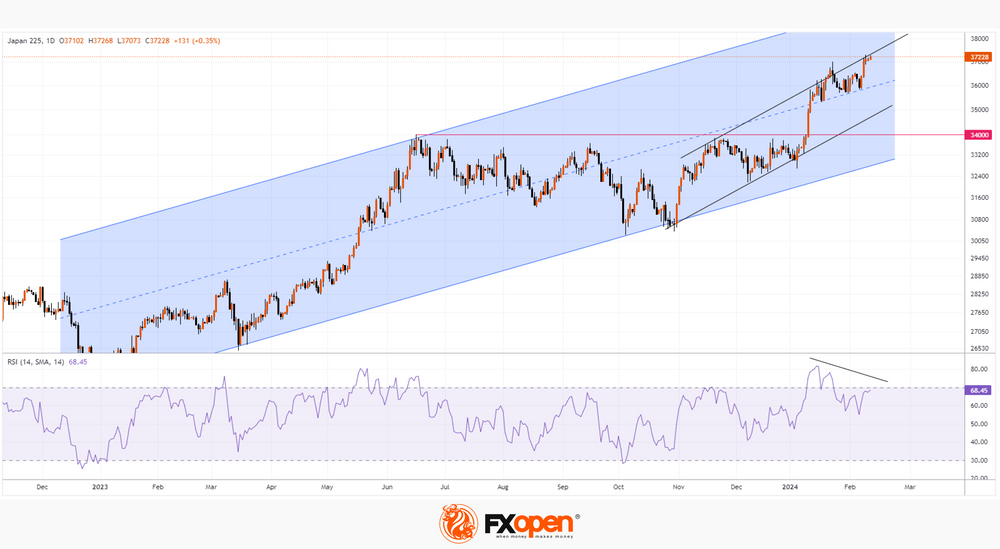
The Nikkei 225 index chart shows that:
→ the price moves within a large-scale ascending channel (shown in blue), which covers the entire year 2023;
→ in 2024, the price rises within the channel shown in black;
→ the 34,000 level was broken with an acceleration in the rally on January 10 - evidence that the bulls held a landslide victory here — so the area above 34,000 could serve as an area of support;
→ the median line of the blue channel and the lower border of the black channel can also serve as support for the price of the Nikkei 225 index in the event of a correction.
And a correction is very likely, given that the RSI indicator indicates a bearish divergence (a sign of depleted demand forces) — perhaps investors are busy taking profits after the price of the Nikkei 225 index has risen by more than 12% since the beginning of 2024.
Trade global index CFDs with zero commission and tight spreads. Open your FXOpen account now or learn more about trading index CFDs with FXOpen.
This article represents the opinion of the Companies operating under the FXOpen brand only. It is not to be construed as an offer, solicitation, or recommendation with respect to products and services provided by the Companies operating under the FXOpen brand, nor is it to be considered financial advice.
Are EURCHF Bulls Ready for a Breakout?
- EURCHF trades higher, tests key resistance trendline
- Strong upmove in place since late January
- Momentum indicators support the current upleg
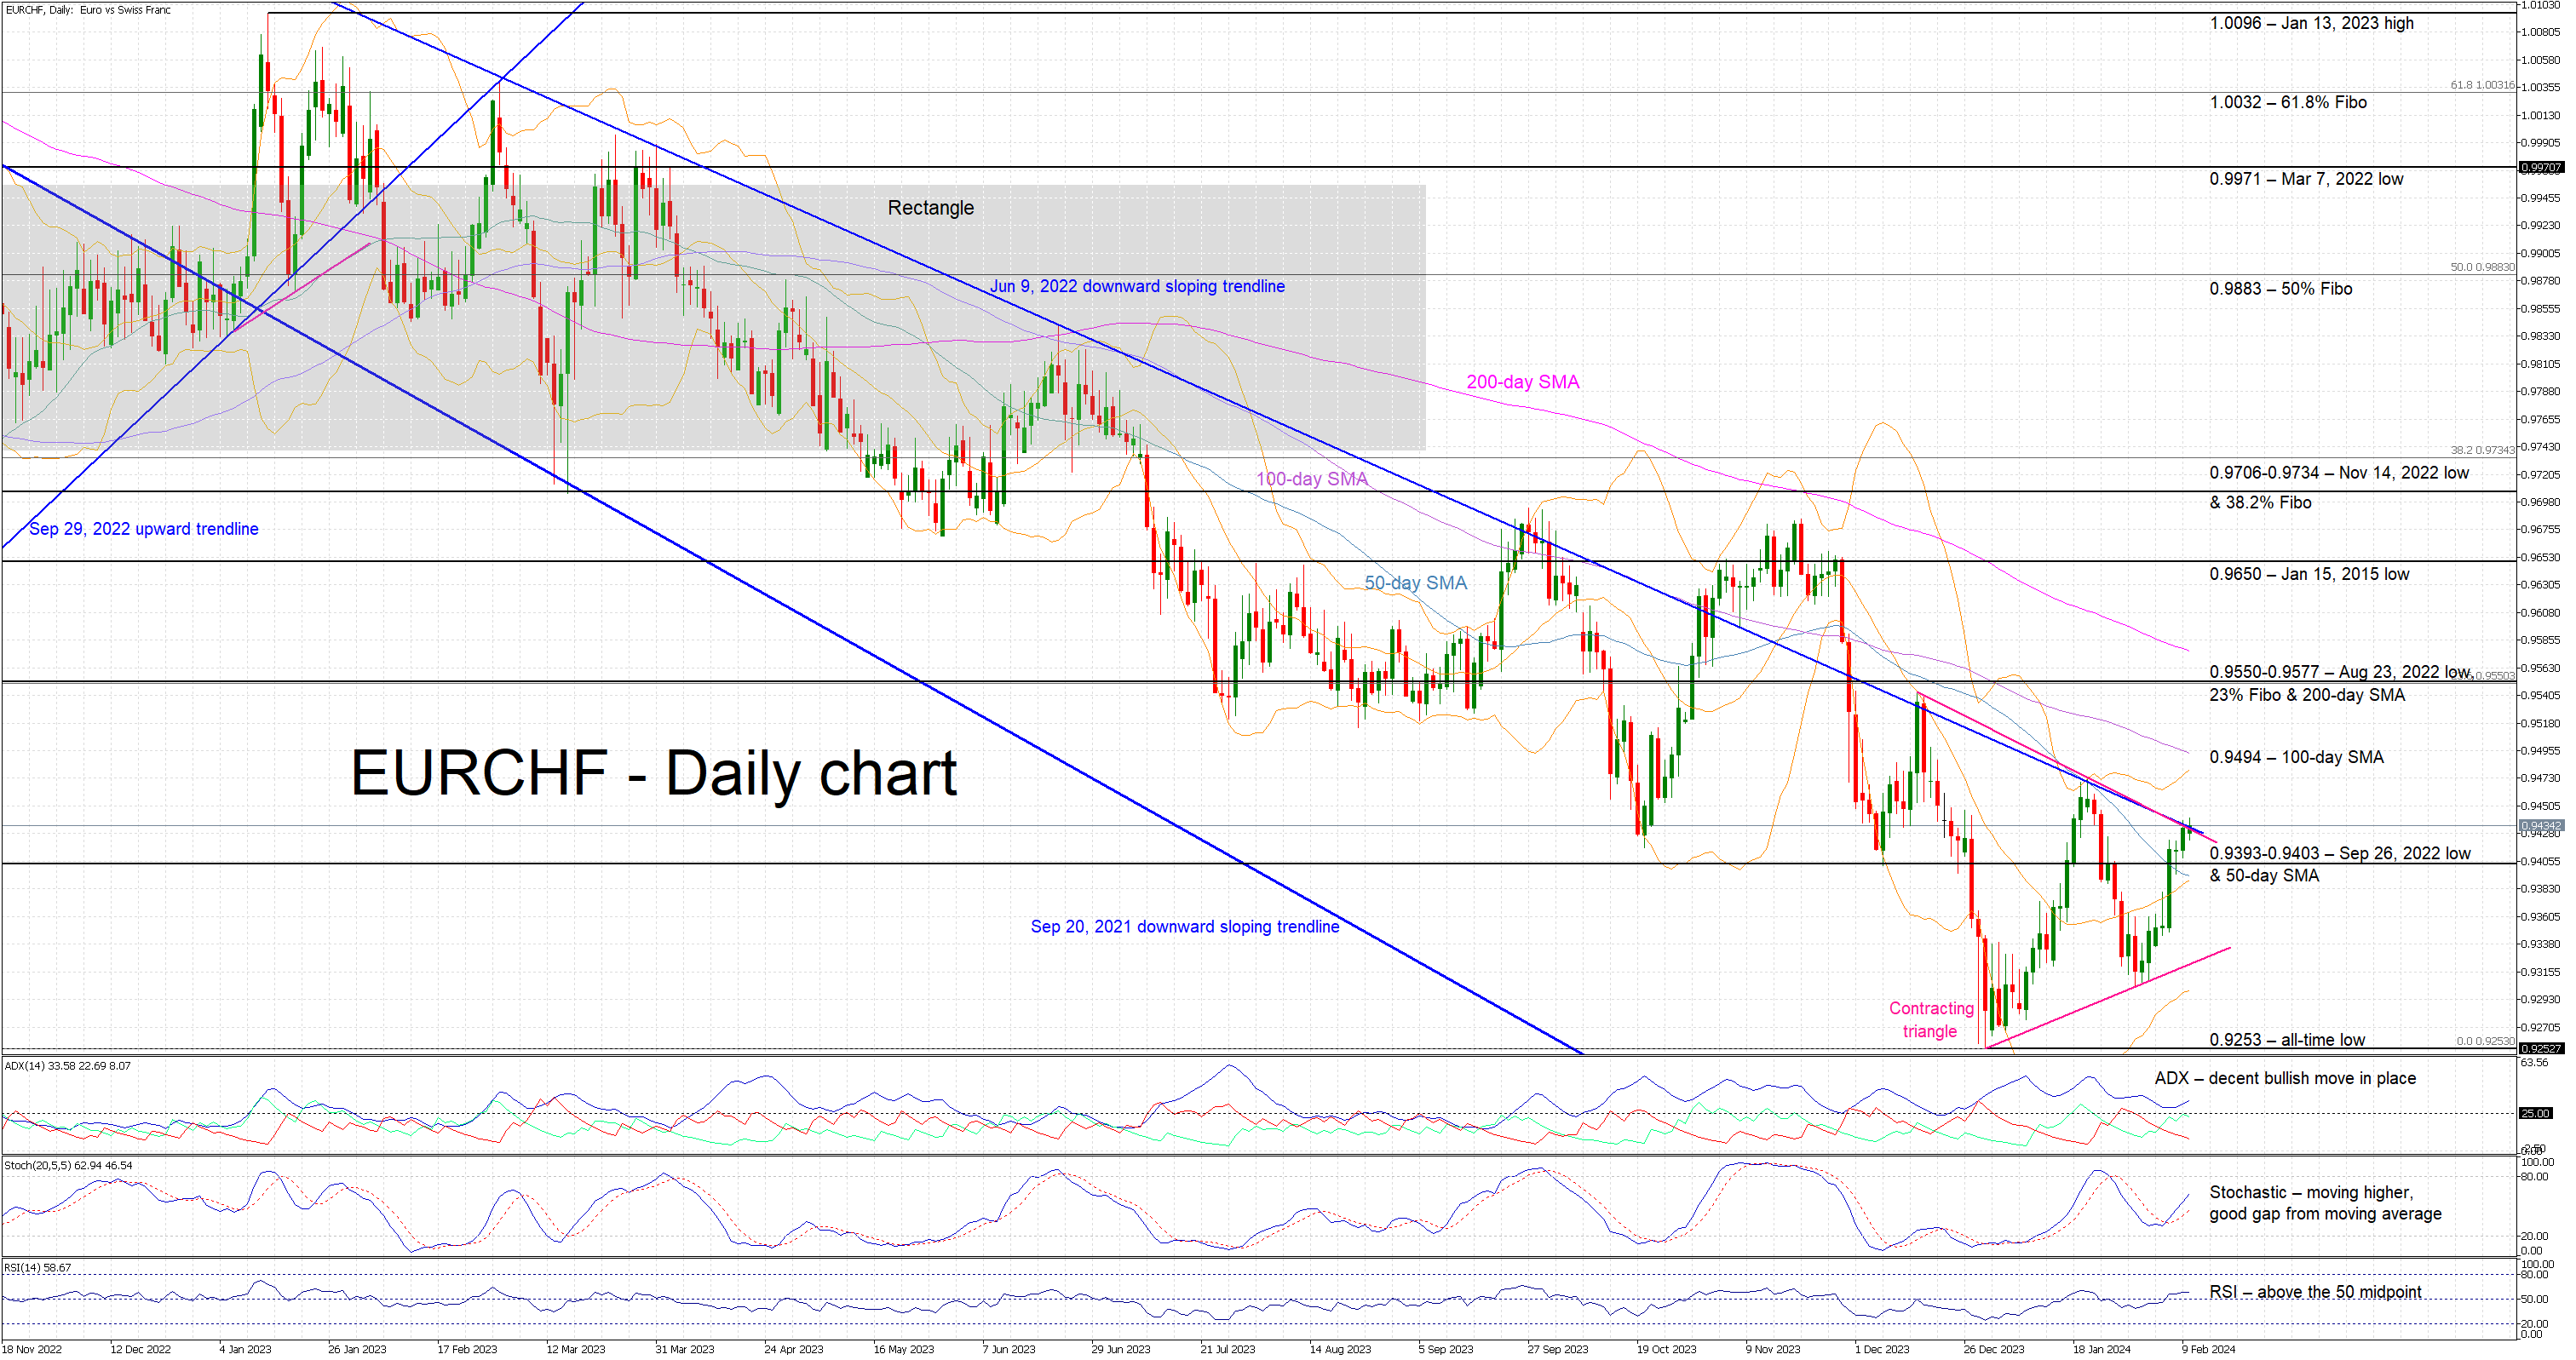
EURCHF is trying to record its eighth consecutive green candle since the January 31 trough. It is now testing the resistance set by the June 9, 2022 downward sloping trendline and the upper boundary of a contracting triangle developing since mid-December 2023. This structure is the result of a series of lower highs and higher lows, and declining volatility.
In the meantime, the momentum indicators are supporting the current upleg. In more detail, the Average Directional Movement Index (ADX) is trying to edge higher in order to signal a strong bullish trend, but the D+ indicator remains stuck below its 25-midpoint. Similarly, the RSI has climbed above its 50-midpoint but appears unable to record a stronger move higher. Interestingly, the stochastic oscillator is also trading higher, towards its overbought (OB) territory, and clearly deviating from its moving average.
If the bulls remain confident, they could try to lead EURCHF above the June 9, 2022 trendline and the upper boundary of the contracting triangle. The next target appears to be the busy 0.9550-0.9577 area, provided the bulls manage to quickly overcome the resistance set by the 100-day simple moving average (SMA) at 0.9494
On the flip side, the bears will probably try to regain market control and push EURCHF below the 0.9393-0.9403 area, which is populated by the September 26, 2002 low and the 50-day SMA. The lower boundary of the contracting triangle could then trouble the bears as they would probably set their mind on the crucial all-time low at 0.9253.
To sum up, the recent strong bullish in EURCHF move remains in place, but the bulls need to deliver a bullish breakout in order to confirm that they hold the market reins.
Gold Slides Below 50-day SMA, Hitting Ascending Trendline
- Gold trades sideways in the past week
- Closes profoundly below the 50-day SMA on Friday
- Momentum indicators turn negative
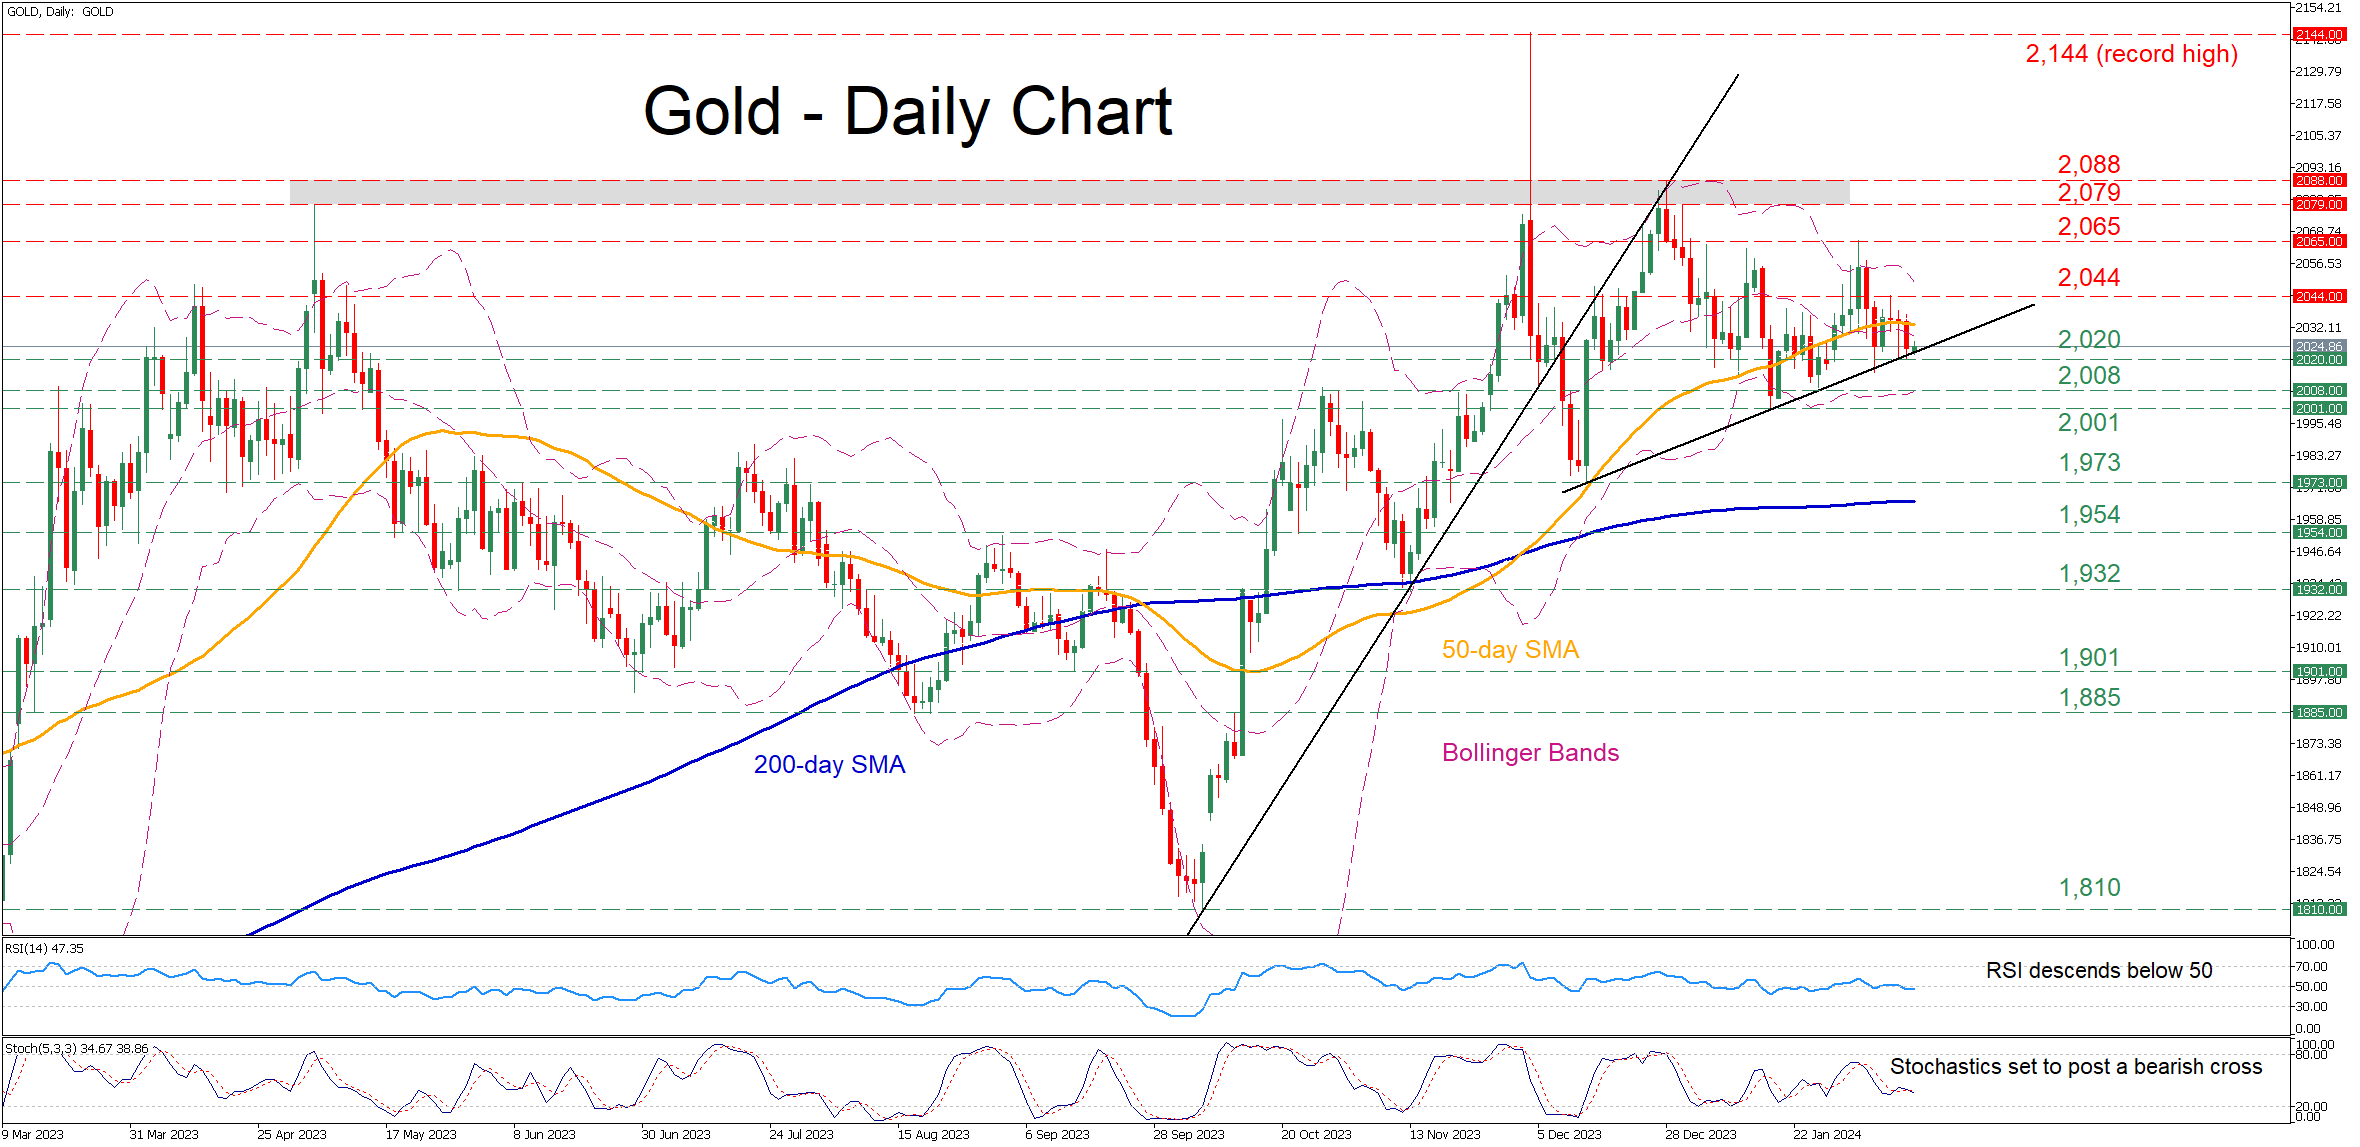
Gold has been rangebound in the past few trading sessions, following its rejection at the 2,065 mark on February 1. However, on Friday, the price dived beneath the 50-day simple moving average (SMA) before finding its feet at the ascending trendline that connects higher lows since December.
If bearish pressures persist, the price could initially test the recent support of 2,020. Breaking below that zone, bullion may descend towards 2,008 ahead of the January low of 2,001. Even lower, the December bottom of 1,973 could provide downside protection.
Alternatively, should the bulls re-emerge and attempt to push the price higher, the recent resistance of 2,044 could be the first barrier in their way. Failing to halt there, the price may challenge the February high of 2,065. An upside violation of that zone could open the door for the crucial 2,079-2,088 range.
In brief, gold retreated below the 50-day SMA as the short-term oscillators dropped to their negative regions. However, a steep decline has been avoided so far as the upward sloping trendline drawn from December has been holding its ground.
Forex and Cryptocurrencies Forecast
EUR/USD: Dollar Dips but Promises a Rebound
Last week saw a scarcity of significant macroeconomic data. In anticipation of new drivers, market participants analysed the state of the US labour market and statements from Federal Reserve officials.
Data released on February 2 revealed that the number of new jobs in the US non-farm sector (Non-Farm Payrolls) increased by 353,000 in January, against the expected 180,000. This figure followed a December increase of 333,000. Unemployment remained stable at 3.7%, although experts had forecast a rise to 3.8%. Meanwhile, wage inflation grew to 4.5% on an annual basis, significantly exceeding market expectations of 4.1%. The report, issued on Thursday, February 8, was also robust, showing that the number of US citizens applying for unemployment benefits was 218K, down from 227K previously.
Thus, Federal Reserve Chair Jerome Powell's concerns proved unfounded. Recall that he recently suggested that if the labour market were to cool sharply, easing of monetary policy could occur quite rapidly. However, no cooling has occurred, so the FOMC members may not rush to a dovish pivot until they see convincing evidence of inflation dropping below the 2.0% target.
Subsequent comments from Fed representatives confirmed the low likelihood of an easing of national monetary policy in the near term. For instance, Susan Collins, President of the Federal Reserve Bank of Boston, stated that due to a strong labour market and economic growth, a rate cut is currently not advisable. Her colleague from the Federal Reserve Bank of Richmond, Thomas Barkin, expressed serious doubts about the sustainability of the inflation reduction pace, as price growth continues in the services and rental sectors. As the figures above indicate, wage inflation is also rising.
Against this backdrop of the regulator's representatives' hawkish stance, the probability of a rate cut in March has decreased, and according to the FedWatch Tool, it currently stands at only 15.5%, with May at 54.1%. In such conditions, bulls on the Dollar Index (DXY) feel significantly more confident than bears.
Regarding the euro, the common European currency has been significantly impacted by recent dovish statements from European Central Bank (ECB) officials. Weak statistics from the Eurozone also support the case for an earlier start to monetary policy easing. A comparison of macroeconomic indicators between the Old and New Worlds suffices to illustrate this. Unemployment in the Eurozone stands at 6.4% compared to 3.7% in the US. European GDP in Q4 barely moved from a recessionary level of -0.1% to 0% (in contrast to the US, which saw a +3.3% increase). The service sector activity index dropped from 48.8 to 48.4 points, while the composite indicator, which includes both services and manufacturing, is at 47.9 points. Hence, both these indicators remain in the stagnation zone (below 50.0). In Germany, exports of goods decreased by 4.6% in December, and imports by 6.7%.
On the other hand, the Consumer Price Index (CPI), a crucial inflation indicator, showed a slight increase in consumer prices in Germany from 0.1% to 0.2% month-on-month, offering the euro some support by giving investors hope that the ECB may not be the first to cut rates. As a result, EUR/USD ended the week at 1.0785.
A number of experts believe that the dollar's weakening last week was a corrective pullback, and the fundamental backdrop continues to favor the American currency. As of the writing of this review, on the evening of Friday, February 9, 70% of experts voted for a strengthening of the dollar in the near future and a further decline of the pair. 15% sided with the euro, and an equal percentage adopted a neutral position. Oscillators on D1 share a similar view: 65% are coloured red, indicating a bearish outlook, 10% green, showing a bullish outlook, and 25% in neutral grey. Among trend indicators, the distribution of forces between red (bearish) and green (bullish) stands at 65% to 35%. The nearest support for the pair is located in the zone of 1.0725-1.0740, followed by 1.0680, 1.0620, 1.0495-1.0515, and 1.0450. Bulls will encounter resistance at levels 1.0800-1.0820, 1.0865, 1.0925, 1.0985-1.1015, 1.1110-1.1140, and 1.1230-1.1275.
The upcoming week's noteworthy events include the publication of the US Consumer Price Index (CPI) data on Tuesday, February 13. Market participants will analyse the latest Eurozone GDP data on February 14, the same day Valentine's Day is celebrated. American statistics on manufacturing activity, unemployment, and retail sales volume will be highlighted on Thursday, February 15. The week will conclude with the release of the US Producer Price Index (PPI) for January on Friday.
GBP/USD: Factors Supporting and Weighing on the Pound
On Friday, February 2, strong data from the US labour market strengthened the dollar and pushed GBP/USD from the upper boundary of the sideways channel at 1.2600-1.2800 to the lower end. The decline continued over the past week, with the pair finding a local bottom at 1.2518 on February 5. It is to the credit of the British currency that it managed to recover its losses and returned to the 1.2600 zone, which shifted from support to resistance.
Analysts believe that the British currency continues to be supported by expectations that the Bank of England (BoE) may be among the last to cut rates this year. It's worth noting that on February 1, the BoE held its meeting and kept the key rate at the previous level of 5.25%. However, the pound received support because two members of the BoE's Monetary Policy Committee continued to vote for a rate hike of 25 basis points (bps). The following day, Catherine Mann explained that she voted for a rate increase because she is not confident that the decline in core inflation will continue in the near term. Another Committee member, Jonathan Haskel, acknowledged that inflationary pressures might be easing but noted that he would need additional evidence of this process before changing his stance on rate hike prospects.
Furthermore, GBP/USD is significantly influenced by market participants' risk appetite, which has been increasing, as evidenced by the quotations of stock indices such as the S&P 500, Dow Jones, and Nasdaq. Consequently, hawkish remarks from Bank of England representatives and improved sentiment regarding risk have helped the pair offset its losses.
Working against the British currency is the fact that inflationary pressures are indeed starting to ease. According to the KPMG and the Recruitment & Employment Confederation's UK Report on Jobs, the wage inflation index decreased from 56.5 points to 55.8 points in January, indicating that wage growth in the country was at its slowest pace since March 2021. Thus, signs of cooling inflation serve as an argument for the Bank of England to begin cutting interest rates. At the regulator's last meeting, as mentioned, two members of the Committee voted for an increase in borrowing costs, eight for keeping the rate unchanged, and only one member voted for a reduction. However, if at the next meeting on March 21, the doves gain not just one but two or three votes, this could trigger active selling of the GBP/USD pair.
The pair concluded the past five-day period at the mark of 1.2630. Regarding the median forecast of analysts for the coming days, 50% voted for the pair's decline, 15% for its rise, and the remaining 35% abstained from commenting. Among the oscillators on D1, 50% indicate a downward direction, the remaining 50% look eastward, with none showing a preference for moving north. The situation with trend indicators is different, where a slight majority favors the British currency – 60% pointing north and the remaining 40% south. Should the pair move southward, it will encounter support levels and zones at 1.2595, 1.2570, 1.2495-1.2515, 1.2450, 1.2330, 1.2210, 1.2070-1.2085. In case of an upward movement, resistance will be met at levels 1.2695-1.2725, 1.2785-1.2820, 1.2940, 1.3000, and 1.3140-1.3150.
Regarding the UK economy, the upcoming week's calendar highlights include a speech by Bank of England Governor Andrew Bailey on Monday, February 12. A significant amount of statistics from the British labour market will be released on Tuesday, February 14. On Wednesday, February 15, the Consumer Price Index (CPI) values will be announced, followed by the country's GDP indicators on February 16. The week's stream of statistics will conclude on Friday, February 16, with the publication of data on retail sales in the UK.
USD/JPY: The Pair's Flight to the Moon Continues
Thanks to the hawkish rhetoric from Federal Reserve representatives, USD/JPY continued to rise last week, coming close to the psychological resistance level of 150.00. It likely would have breached this level, but market participants are exercising caution ahead of the January Consumer Price Index (CPI) data release in the US, which is scheduled for February 13.
The yen continues to be under pressure due to the Bank of Japan's (BoJ) persistent dovish stance. Investors observe that the regulator still has no intention of raising interest rates. On Thursday, February 8, BoJ Deputy Governor Shinichi Uchida stated that "the future course of rates depends on economic and price developments" and that monetary policy conditions in the Japanese economy are on a deeply negative trajectory, with no expectations of aggressive inflation. The following day, BoJ Governor Kazuo Ueda traditionally spoke, stating that "the chances of maintaining accommodative conditions are high even if negative rates are abandoned."
From this, the market concluded that if any changes are to be made to the central bank's monetary policy, they will occur very slowly and it's uncertain when. The investors' reaction is evident in the USD/JPY chart: a local maximum was recorded at 149.57, with the week's final note hitting at 149.25.
Regarding the near-term outlook for USD/JPY, experts' opinions are evenly divided: a third anticipate further growth, another third expect a decline, and the remaining third have chosen to remain neutral. Trend indicators and oscillators on D1 unanimously point north, indicating bullish sentiment, but 25% of the oscillators are in the overbought zone. The nearest support level is located in the zone of 148.25-148.40, followed by 147.65, 146.85-147.15, 145.90-146.10, 144.90-145.30, 143.50, 142.20, and 140.25-140.60. Resistance levels are found at 149.65-150.00, 150.75, and 151.70-151.90.
Among the significant events related to the Japanese economy, the publication of the country's GDP data on Thursday, February 15, stands out. Traders should also be aware that Monday, February 12, is a public holiday in Japan: the country observes National Foundation Day.
CRYPTOCURRENCIES: Why Bitcoin Is Rising
"Halving: Grief or Joy?" was the question we posed in the title of our previous review. The debate on this matter does not subside but, on the contrary, becomes more intense as April approaches.
The process of profit-taking after the approval of bitcoin spot ETFs on January 10 has ended. However, a new threat looms over the market now. And this threat is the miners. Scott Melker, a renowned trader, investor, and host of the podcast "The Wolf of All Streets," writes the following: "The bitcoin halving will occur when the number of mined blocks reaches 840,000 in April 2024, at which point the block reward will decrease from 6.25 to 3.125 BTC. Essentially, this means that the issuance of new coins will be halved. It will become twice as hard for miners to earn money from mining bitcoin."
The halving is tentatively scheduled for April 19, meaning there are roughly two months left. If the price of digital gold does not show significant growth in this period, the majority of miners will face a sharp liquidity shortage. Therefore, to replenish their liquidity, they may start actively selling their BTC holdings, which would exert significant pressure on the market.
According to estimates, bitcoin miners still had about 1.8 million BTC worth approximately $85 billion (at current prices). And now, CryptoQuant has announced that the reserves of these companies have fallen to their lowest level since July 2021. Currently, the wallets of mining pools hold the lowest volume of cryptocurrency since the so-called "Great Migration" of miners from China to other countries in Eurasia and North America. Coins have moved from miners' autonomous wallets to exchanges.
Bitfinex also observes an influx of bitcoins to exchange addresses associated with mining companies. Analysts believe that at some point, a large-scale coin dump could occur, which is concerning. However, miners are holding onto their reserves for the time being, despite reduced transaction fee revenues. According to CryptoQuant, their daily sales have dropped and are now less than 300 BTC.
The situation of mining companies is also complicated by the decline in the production volumes of new coins. According to TheMinerMag, BTC mining by U.S. miners dropped to historical lows in January due to a 29-50% increase in electricity tariffs. High electricity costs are expected to persist until the end of Q1 2024. Therefore, if the trend continues, a certain bitcoin supply deficit will be observed before the halving amid growing demand. And the fact that demand is increasing is confirmed by analysts at Santiment, who note a sharp increase in the number of "whales" owning more than 1,000 BTC. Naturally, this pushes BTC/USD upwards.
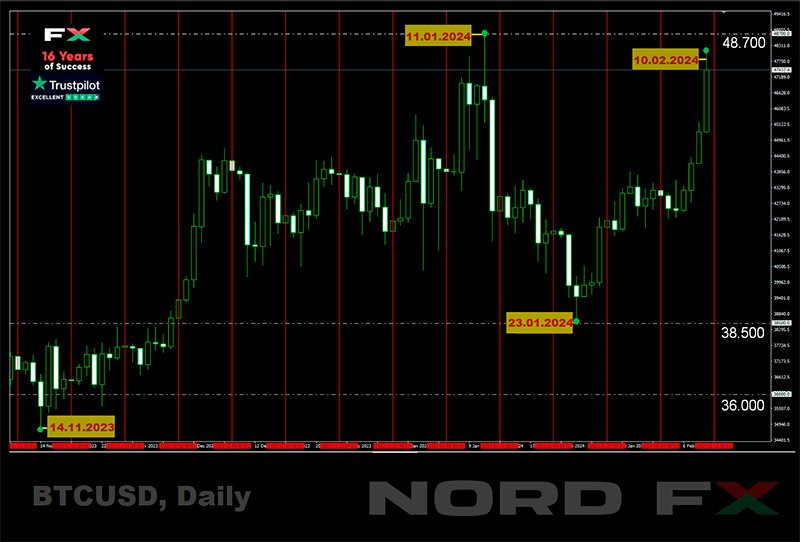
From February 7 to 9, bitcoin's price showed a sharp surge, reaching a peak of $48,145. In this rally, in addition to the reasons mentioned, the global increase in risk appetites of major investors likely played the most significant role. The inflow of capital into stock markets also benefited the crypto market. According to IntoTheBlock, the correlation between bitcoin and the S&P 500 index was negative at the end of January but has since returned. Another reason some experts cite for the digital gold's price increase is the approach of the New Year according to the Chinese calendar. It is noted that the price of cryptocurrency always rises in anticipation of this date.
Overall, most forecasts for the entirety of 2024 look quite optimistic, with some being very optimistic. Scott Melker, for instance, believes that the halving could lead to a rise in bitcoin's price to $240,000. "After the previous halving, the BTC price updated its maximum from $20,000 to $69,000, which is a 250% increase," he writes. "Thus, if the situation repeats this time, the next maximum after $69,000 will be $240,000." "I know it might seem like an exaggeration," Melker continues. "This cycle has worked in the past. But until I see it fail [this time], I'm willing to bet that bitcoin will exceed $200,000."
According to ARK Invest CEO Cathy Wood, investors have begun shifting from gold to bitcoin following the launch of spot Bitcoin ETFs. "Bitcoin is growing relative to gold. The substitution of gold with bitcoin is in full swing. And we think this will continue...," she stated.
Echoing Cathy Wood's sentiment is the popular blogger and analyst PlanB. "After the upcoming halving, bitcoin will become scarcer than gold and real estate," he writes. "This implies that the cryptocurrency could reach a price of around $500,000." Based on his Stock-to-Flow model, the expert suggested that the market capitalization of the digital asset might not surpass that of gold – over $10 trillion. However, approaching this mark and a supply limit of 20 million coins would lead to the stated price. PlanB did not specify a timeframe for reaching this price, but he did mention a minimum price level that, in his opinion, the primary cryptocurrency will not fall below. According to PlanB, the BTC price has historically never dropped below the 200-week moving average. (At the time of writing the review, the 200WMA is around $32,000). Another analyst, known by the nickname ali_charts, believes that the critical support level is now $42,560.
Renowned trader, investor, and founder of MN Trading, Michael Van De Poppe, like PlanB, believes that the value of bitcoin could reach $500,000. The expert highlighted that there are numerous factors that will cause explosive growth in the flagship coin's rate. Among these are the current state of the market, the launch of BTC ETFs, inflow of funds from institutional investors, among others. The halving is considered a significant factor, after which a bullish growth of the cryptocurrency market is expected. Van De Poppe suggests that the current cycle might be slightly longer than previous ones, due to the entry of institutional players into the market and changes in the overall direction of industry development.
Van De Poppe believes that a scenario where the value of bitcoin soon reaches the key resistance level of $48,000 is quite plausible. This would be followed by another correction, resulting in a 20% price drop to $38,400. After the halving, the value of BTC will begin to rise again and reach a local peak by the autumn.
Elon Musk's company xAI developed Artificial Intelligence Grok, which has made two predictions regarding Ethereum, the main competitor to the leading cryptocurrency: 1) by the end of 2024, the price of ETH will range from $4,000 to $5,000; 2) within the year, the value of ETH could peak at $6,500. Grok highly values Ethereum's prospects due to the development of this altcoin's ecosystem and the Dencun update. This upgrade will increase the ETH blockchain's scalability level and significantly reduce transaction processing costs. The Dencun deployment took place in the Goerli test network on January 17th, and in the Sepolia test network on January 30th. The launch of Dencun in the main network is scheduled for March 13th. (It's worth noting that this update has already become one of the reasons why large ETH coin holders have started moving their assets from long-inactive wallets. Recently, such a "whale" moved 492 ETH worth over $1.1 million from a wallet that had been dormant for more than eight years).
Grok also considers the potential approval of spot Ethereum ETFs by the end of May as a catalyst for the altcoin's price growth. Six major American companies have submitted applications for these derivatives to the U.S. Securities and Exchange Commission (SEC).
However, the situation is not so straightforward. We have previously quoted SEC Chairman Gary Gensler's statement that positive decisions regarding spot ETFs exclusively concern bitcoin-based exchange products. According to Gensler, this decision "in no way signals a readiness to approve listing standards for crypto assets that are securities." Recall that the regulator still refers to bitcoin as a commodity, while "the vast majority of crypto assets, in his view, are investment contracts (i.e., securities)."
Last week, it was revealed that the SEC had postponed its decision on applications from Invesco and Galaxy. The agency had previously postponed the review date for other applications. "The only date that matters for spot ETH-ETFs at the moment is May 23. This is the deadline for the VanEck application," Bloomberg notes.
Analysts at investment bank TD Cowen believe it is unlikely that the SEC will make any decision before the second half of 2024. "Before approving an ETH-ETF, the SEC will want to gain practical experience with similar investment instruments in bitcoins," commented Jaret Seiberg, head of the TD Cowen Washington Research Group. TD Cowen believes the SEC will return to the discussion of Ethereum ETFs only after the U.S. presidential elections in November 2024.
Senior JP Morgan analyst Nikolaos Panagirtzoglou also does not expect the prompt approval of spot ETH-ETFs. For the SEC to make a decision, it needs to classify Ethereum as a commodity, not a security. However, JP Morgan considers this event unlikely in the near future.
The cryptocurrency market has shown impressive growth over the past week. As of the evening of February 9, BTC/USD is trading in the $47,500 zone, and ETH/USD at $2,500. The total market capitalization of cryptocurrencies is $1.78 trillion (up from $1.65 trillion a week ago). The Crypto Fear & Greed Index has risen to 72 points (from 63 a week ago) and remains in the Greed zone.
Central Bankers Advocated Cautious Wait-and-See Bias
Markets
Except for the (strong) US services ISM on Monday last week’s eco calendar was light. Friday’s US CPI revision in this respect didn’t change the picture. US auctions (3-y, 10-Y, 30-y) all met solid investor demand. Even so, yields on both sides of the Atlantic are setting/near new YTD peak levels, testing important technical resistance. The US 2-y yield nears the 4.50% area. The 10-y is closing in on 4.20%/4.25% (38% retracement October/December decline). Despite a weak cyclical picture in Europe, EMU yields also are testing comparable upside levels (EMU 2-y swap 3.07%/3.15%; EMU 10-y swap 2.75%/2.77%). Central bankers advocated a cautious wait-and-see bias, pushing back against a too aggressive start of the easing cycle. Still they were not specific on the timing of the inaugural rate cut, leaving the market room for interpretation. Upcoming data now will decide to which side of the above-mentioned levels the interest rate domino’s will fall. In a daily perspective on Friday, US yields added 2 bps across the curve. The German yield curve inverted further with the 2-y adding 5.6 bps and the 30-y closing unchanged. Yields volatility apparently remains low enough not to derail a constructive risk sentiment. The S&P (+0.57%) again touched an all-time record. The Nasdaq also continues to perform strongly (+1.25%). A mild risk sentiment and maybe some ‘support’ from the short-term interest rate differential helped EUR/USD drifting higher in the 1.08 big figure (close 1.0784). The rise in USD/JPY stalled as the psychological 150-level came on the radar (close 149.29).
This morning, many Asian markets are closed for the Lunar New Year holiday. In an interview, ECB governing Council member de Cos said that the ECB March projections will be key to assessing first whether the ECB can be sufficiently confident that to 2.0% target can be achieved and, second, the rath path that is compatible with reaching the target. Of course, this doesn’t provide concrete guidance on the specific timing of a first rate cut. Today, we keep an eye at the NY Fed 1-y inflation expectations. There are again plenty of CB speakers (ECB’s de Cos & Lane, Fed Barkin and Kashkari and BoE governor Bailey) but we doubt the will bring market-moving stories. From tomorrow on the data again can fully play their role, with the US January CPI. On Thursday the US Empire manufacturing, the Philly Fed business outlook and retail sales will give some insight on the resilience of the US economy. We will also get an extenso update on the US economy with labour data (Tue), inflation (Wed), and production/GDP (Thu) and finally retail sales on Friday. More signs of resilience of the UK economy might push EUR/GBP to go for a challenge of the 0.8493 key support.
News & Views
EU officials from the Commission, Parliament and Council late yesterday reached an agreement on the new fiscal framework. They replace the strict 3% (deficit) – 60% (debt-to-GDP) rules that have been suspended ever since the pandemic. The reformed pact is a less tight one allowing for debt reduction over a period of four to seven years. Frugal states including Germany, however, called for annual targets for cutting public debt and limits for public spending while the likes of Italy and France sought some exemptions to create enough room for public investments in the greening sector, defense and technology. The compromise that was found means that Spain would probably have to do the most extra fiscal tightening, i.e. reducing its structural primary deficit by the maximum of an additional 1% point of GDP. Germany, facing harsh spending limits following the constitutional court ruling last year, would not be impacted by the new rules.
Germany’s ruling coalition suffered losses in yesterday’s partial repeat in Berlin of the 2021 federal election. The repeat was ordered by the constitutional court end last year over voting irregularities amid long queues, result announcements while polling stations were still open and the Berlin marathon hampering the access in and around the city. While the defeat does not change the balance of power in the lower house of parliament, it is a sign of the time with Scholz’s government rating plummeting to record lows in recent months. Benefiting from this are the main opposition party CDU/CSU and the far-right AfD. This year’s June European Parliament elections and three important regional ballots in September in easter Germany could spell similar trouble for the traffic light coalition. The next general election in Germany is due in the fall of 2025.
Decoupling S&P 500
Last Friday’s inflation revisions in the US were insignificant and hinted that inflation in the US was about the same by the end of last year. Consumer prices rose 3.3% in the final 3 months of the year in the US – the latter was good news for everyone craving to see the Federal Reserve (Fed) eventually start cutting interest rates sometime in the H1 of this year. But alas, the US 2-year yield – which best reacts to the rate expectations – rose on Friday and is gently drilling above the October-to-now descending channel’s top, and the 10-year yield is back flirting with the 4.20% level despite strong bond auctions of last week in the US. Activity on Fed funds futures gives less than a 20% chance for the first rate cut in March, while the probability of a May cut has fallen to around 63%, from above 90% before the blockbuster jobs report released for January.
In theory, when yields go down, equity valuations go up. But the S&P 500 valuations – which are heavily influenced by the Big Technology stocks - have decoupled from the yields a few weeks ago. The 2-year yield bottomed by mid-January on realization that the Fed cut expectations had gone ahead of themselves, but the S&P500 kept running from record to record and rose for the 14th week over the past 15 weeks – a thing that has not happened since 1972, apparently. The index closed last week above the 5000 psychological mark. Nasdaq 100, on the other hand, recorded its 11th ATH this year. The strong economic data from the US that keeps defying the theory that the economy should slow when you hike rates, the strong earnings from big US companies (especially the tech companies that continue to surf on the AI optimism), and the slowing inflation are the major drivers of the optimism. The decoupling is also valid from the small cap stocks. But the more the S&P500 stocks extend their gains to fresh highs, the more it becomes difficult to find new buyers, as many investors are already on board, perhaps waiting for a dip to extend their position, in a market that forgot the formation of a dip.
On the other hand, the CFTC data shows that the net speculative positions are building against the S&P500. It could mean two things. One: there is an increasing number of investors betting for a correction at the current levels. And two: if correction doesn’t come, these bets against the S&P500 could turn around and help the S&P500 extend gains. The more reasonable scenario is a correction – but hey, the rally could stretch as long as investors are willing to buy.
This week, the attention will be on the latest CPI updates. The headline inflation is expected to fall below 3% from 3.4% printed a month earlier and core inflation is seen easing from 3.9% to 3.8%. If there are no major surprises in these inflation figures, there is no reason to think that the Fed will spoil the market mood. If that’s the case, the US dollar should continue to see resistance near its 100-DMA and allow its peers to regain some field. The EURUSD could retest its 200-DMA, that stands near 1.0830, the yen could remain offered into the 150 level, and Cable consolidate above 1.26 until Wednesday’s inflation data in Britain. Remember, inflation in Britain had surprised to the upside in the latest meeting. The BoE reminded investors that their fight against inflation was not over just yet and some MPC members even voted to hike the rates at the latest meeting. So the market sees only 75bp cut this year from the Bank of England (BoE), less than half of what was expected at the beginning of this year.
Waiting for the monthly Oil reports
The positive trend of crude oil since the start of this year is becoming clearer, although the topside remains hard to drill near the $80pb level. Still, the barrel of US crude extended gains above the $77pb on Friday and is upbeat this morning – in a very slow Asian session with many Asian markets closed for Chinese New Year holiday. Israel refusing the ceasefire call from Hamas supported the latest upside move last week.
This week, OPEC and IEA will release their monthly report on Tuesday and Thursday, respectively. Attention will be paid to how they will revise their demand outlook in reaction to the global developments. In one hand, the strong US economy and Chinese stimulus measures are positive for the demand dynamics and should support oil prices beyond the geopolitical tensions. On the other hand, the significant retreat in global interest rate cut expectations weighs on global demand outlook. One thing is sure, OPEC will keep fighting to maintain oil prices sustained until the last drop. The problem is, Biden’s US is pumping a record amount of oil to counterweigh the price increases that OPEC needs so badly.
Light Macro Data to Kick Off the Week
In focus today
Today is a quiet day on the data front. Market focus will be on the string of Fed/ECB speakers making public remarks.
In Denmark, CPI inflation is released for January. We expect that inflation increased to 1.0% in January from 0.7% in December. Importantly, it should be kept in mind, that the January inflation print is notoriously uncertain with many businesses adjusting prices at new year, and clothing sales affecting inflation significantly.
In the US, the highlight this week is the CPI inflation release tomorrow. The January US CPI print will be key in determining whether the recent upside surprises in US macro translates into higher price pressures. Recently, markets have dampened rate cut expectations for 2024 as most US data points have surprised to the upside.
Economic and market news
What happened overnight?
In the Middle East, Israeli special forces conducted an operation which freed two Israeli hostages in Rafah. Local health officials report that many were wounded, while 37 people were killed.
What happened over the weekend and on Friday?
In the US, the annual revisions to CPI seasonal adjustment factors painted a mixed picture. December CPI was somewhat lower, while November and October data were revised up slightly. Dallas Fed's Logan (hawk) stated that the Fed still needs to see more benign data prints and is in no rush to initiate rate cuts. The market sentiment was overall positive, with the S&P 500 concluding Friday above the record-breaking 5,000 level.
On the political front, Donald Trump warned NATO that if any allies fail to meet defence spending targets, he will encourage Russia to do "whatever the hell they want". The statement has faced a lot of criticism, with NATO's secretary-general, Jens Stoltenberg, portending that the alliance is ready and able to defend all allies in case of any military threats.
In Europe, Banca d'Italias's Panetta (dove) was on the wire, emphasizing that inflation in the euro area is falling faster than expected and that "the time for a reversal in monetary policy stance is fast approaching". Panetta's statement stands in contrast to ECB governor Schnabel's call for a cautious approach in her interview with FT last week. We expect to see first rate cut in June, though we acknowledge that risks are tilted for an earlier timing.
Finland found their new president on Sunday. Former prime minister, Alex Stubb, has been elected as the next Finnish president, and will take up office on 1 March.
In Norway, January core inflation was in line with consensus at 5.3% y/y, while Norges Bank projected 5.4% y/y. Decomposing the print reveals a significant slowdown in imported inflation, while it increased sharply in January. Disinflation is still in place, albeit marginally slower than anticipated.
Chinese credit growth on Friday showed the strongest monthly reading ever at CNY 6.500bn. Despite month-to-month changes being quite volatile, the overall trend indicates that stimulus indeed is going on and has been stepped up. That said, this also illustrates that the Chinese economy remains highly dependent on stimulus.
Equities: Global equities rose Friday in a US, cyclical and growth led rally with materials underperforming again. This has been the dominating narrative lately and represents investors' view of how sentiment around the world's two biggest economies is diverging. More interestingly, last week we saw both equities and yields firmly higher at the same time and both VIX and MOVE index lower. This underscores how good news is good news and higher for longer is not an issue as longs as it is due to a stronger growth outlook. In the US on Friday; Dow -0.1%, S&P 500 +0.6%, Nasdaq +1.3% and Russell 2000 +1.5%. All major markets in Asia are closed this morning for Lunar New Year holiday. European futures are higher while US futures are marginally lower.
FI: European curves bear flattened again on Friday, thereby continuing to take out some central bank easing expectations. ECB pricing for this year was up 4bp to now stands at 117bp of rate cuts. During the weekend, Bank of Italy's ECB governor Panetta said that the time for policy reversal is fast approaching.
FX: Last week was relatively calm in FX markets with few headlines and macro news to trade on. That said, the cyclically sensitive currencies in the likes of NZD, NOK, SEK and AUD all did (surprisingly) well despite the move higher in global yields. This could reflect recent growth optimism and signs of a stabilisation in the global manufacturing cycle. This is something we will monitor closely in the coming weeks. The CZK was last week's biggest underperformer following dovish signals from the CNB while also the CHF traded poorly with EUR/CHF moving back above the 0.94 level.