
Sample Category Title
Technical Outlook and Review
DXY:
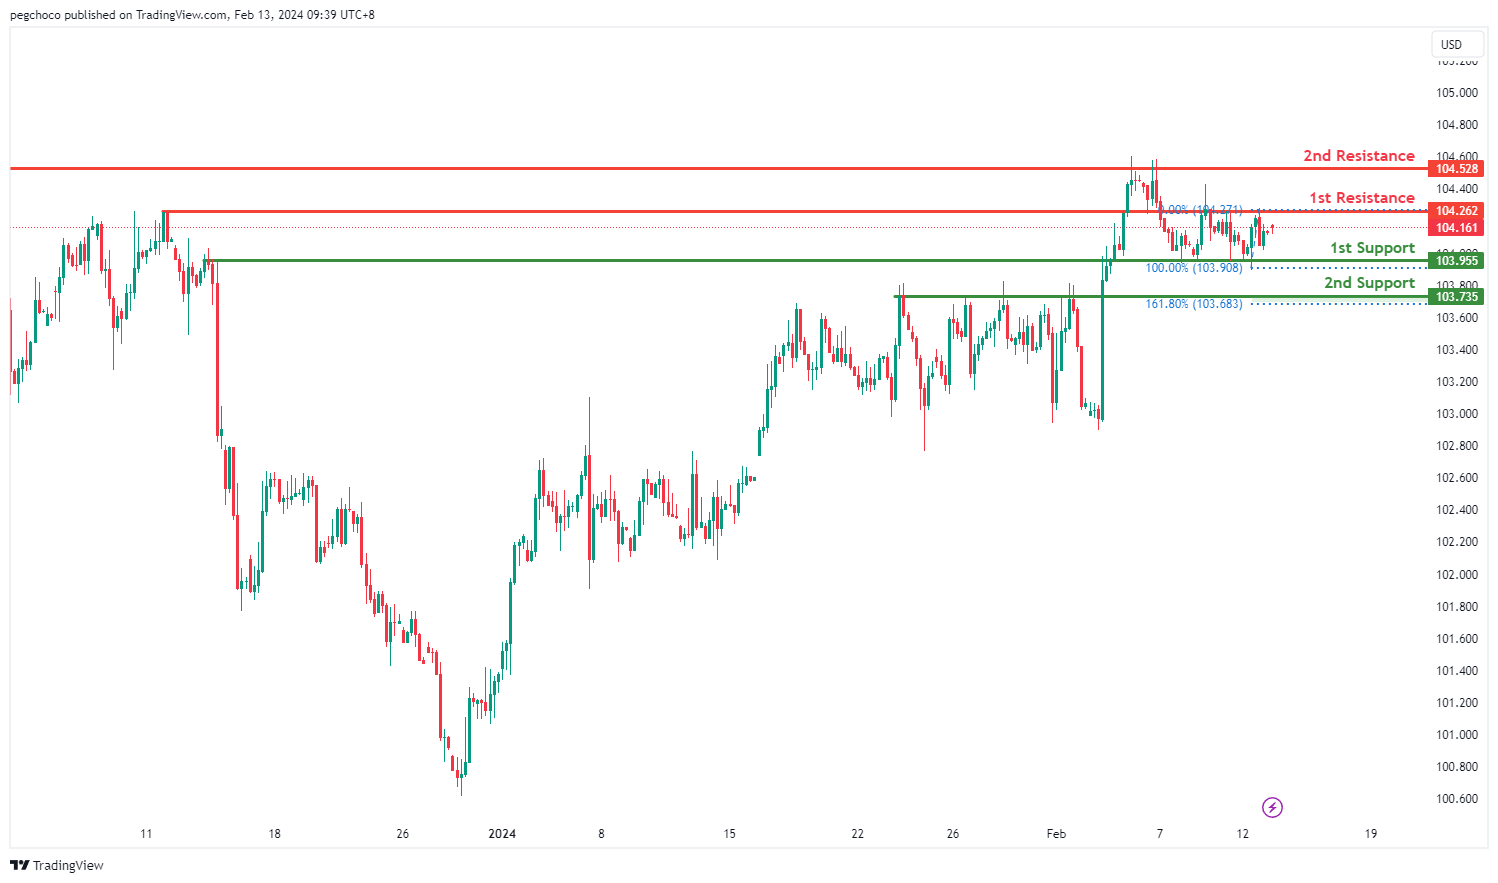
The DXY chart currently reflects a neutral momentum, suggesting a lack of clear direction in the market. There’s a possibility of price fluctuating between the 1st resistance and 1st support levels.
The 1st support level at 103.95 is identified as an overlap support, indicating its historical significance as a level where buying interest has emerged.
Similarly, the 2nd support at 103.73 is characterized as a pullback support, further reinforcing its potential role as a level where buyers may step in.
On the resistance side, the 1st resistance level at 104.26 is categorized as an overlap resistance, suggesting its historical significance as a level where selling pressure has been observed.
Likewise, the 2nd resistance at 104.52 is identified as another overlap resistance, adding to its importance as a potential barrier for further upside movement.
EUR/USD:
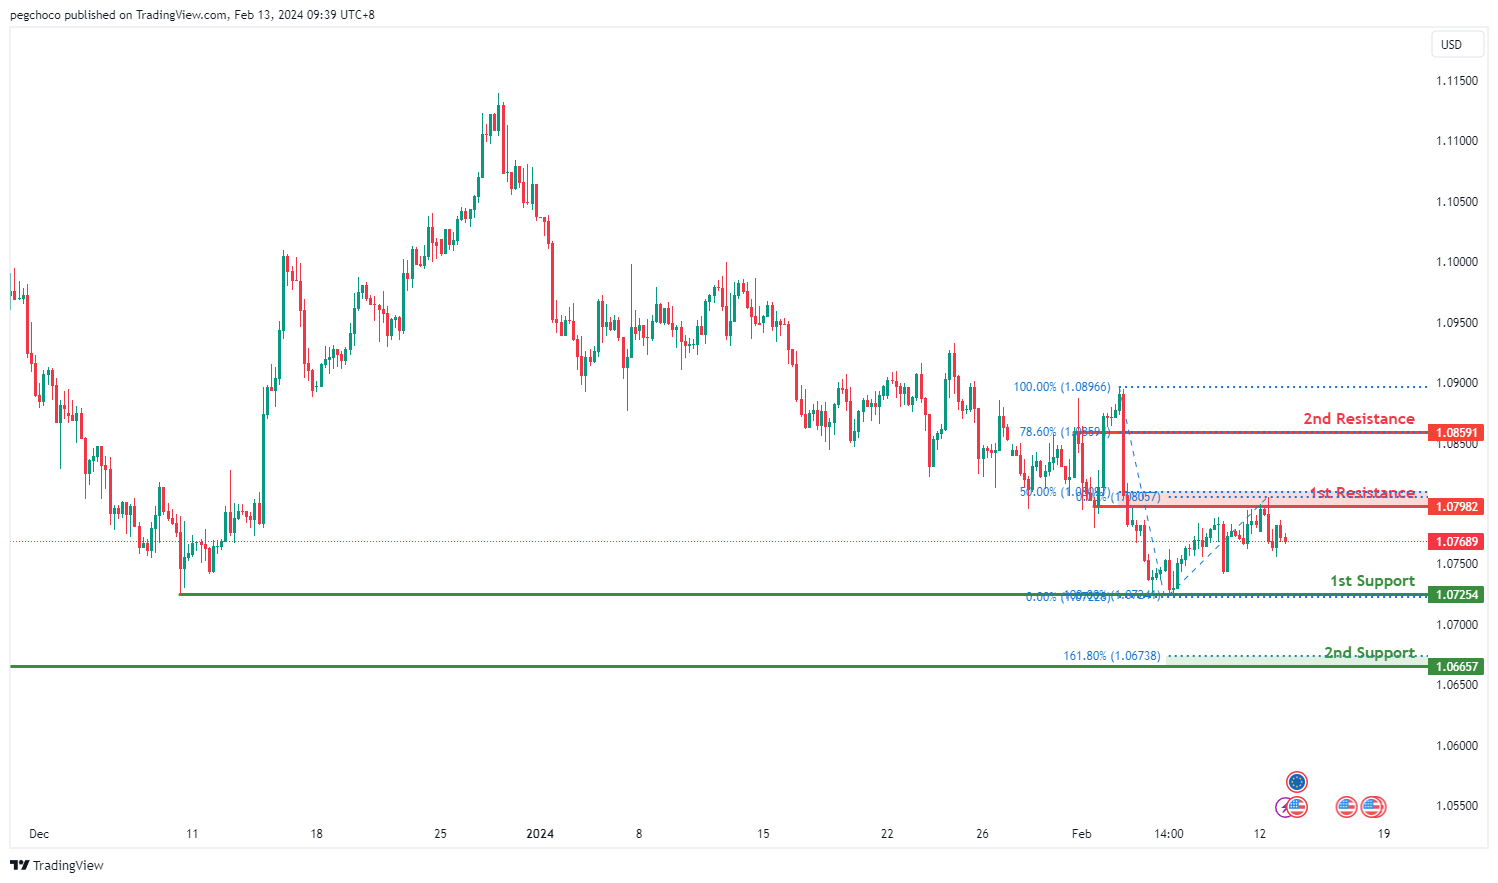
The EUR/USD chart currently exhibits a bearish overall momentum, indicating a downward trend. There’s a possibility that the price could continue this bearish movement towards the 1st support level.
The 1st support level at 1.0725 is considered a multi-swing low support, suggesting its historical significance as a strong level where buying interest has previously emerged.
Additionally, the 2nd support at 1.0665 is identified as an overlap support, further reinforcing its potential role as a significant level of support. The presence of the 161.80% Fibonacci Extension adds to its strength as a potential support zone.
On the resistance side, the 1st resistance level at 1.0798 is categorized as an overlap resistance, indicating its historical significance as a point of potential resistance where selling pressure has been observed.
Similarly, the 2nd resistance at 1.0859 is identified as a pullback resistance, with the presence of the 78.60% Fibonacci Retracement, further emphasizing its importance as a potential barrier for further upside movement.
EUR/JPY:
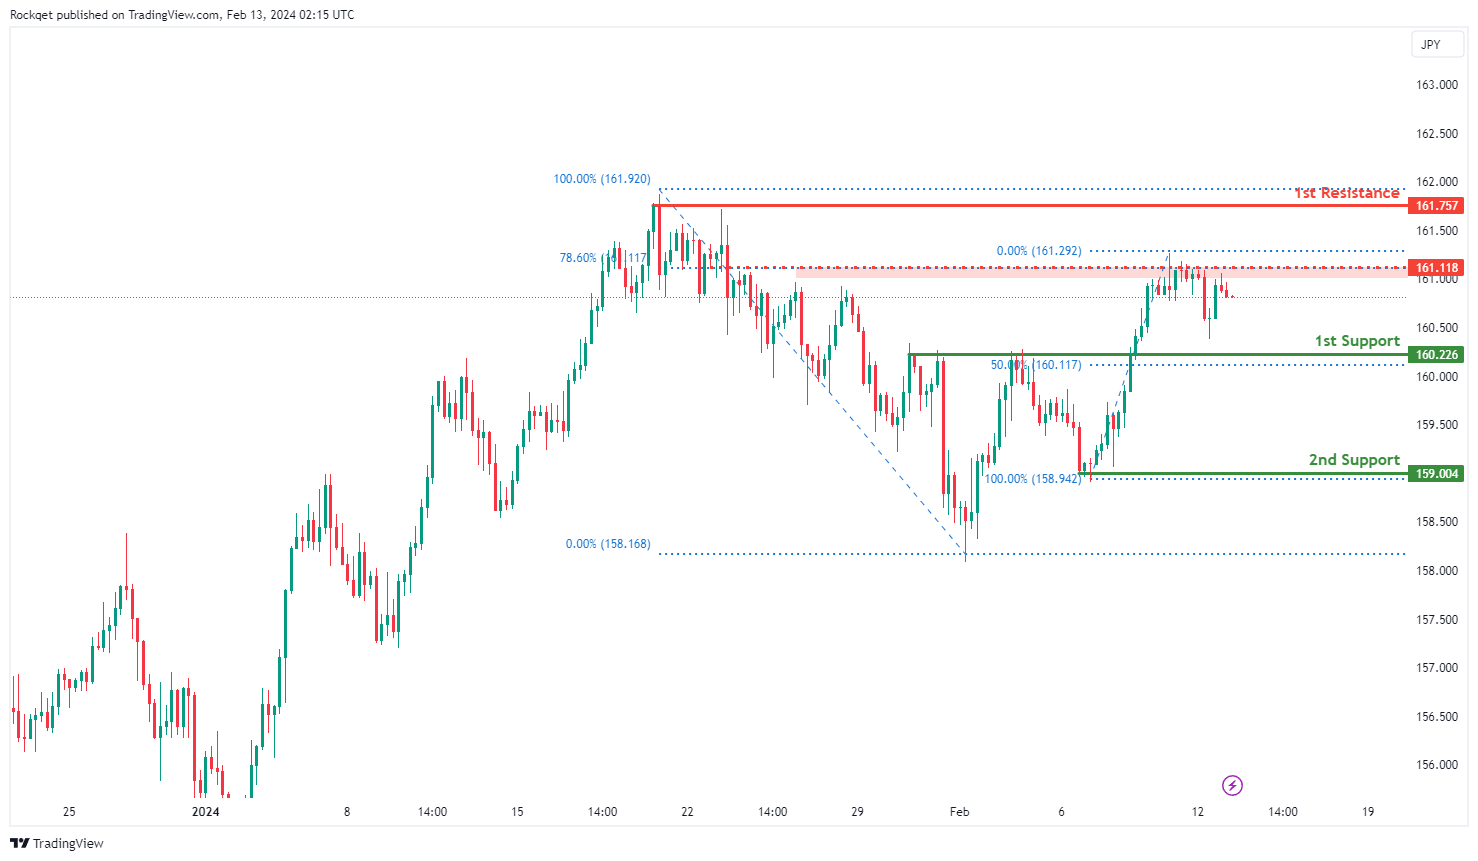
The EUR/JPY chart currently demonstrates a bearish momentum, indicating a prevailing downward trend. Several factors contribute to this bearish sentiment, supporting the potential for a continued downward movement in the price.
The 1st support level at 160.226 is significant as it represents a pullback support, suggesting a historical level where buying interest has previously emerged. Additionally, this level aligns with the 50% Fibonacci Retracement, adding to its significance. Furthermore, the 2nd support at 159.004 is identified as a swing low support, providing additional reinforcement to the potential support zone.
On the resistance side, the 1st resistance at 161.757 is highlighted as a significant level where selling pressure may intensify, as it coincides with a swing high resistance. Moreover, the intermediate resistance at 161.118 is recognized, aligning with an overlap resistance and the 78.60% Fibonacci Projection, further reinforcing its potential as a barrier to further upward movement.
EUR/GBP:
The EUR/GBP chart currently exhibits a neutral momentum, indicating a lack of clear direction in the market. Given this neutrality, the price could potentially fluctuate between the 1st resistance and 1st support levels, with no strong bias towards either direction.
The 1st support level at 0.85170 is considered significant as it represents a multi-swing low support, suggesting a historical level where buying interest has previously emerged. Additionally, the 2nd support at 0.84957 is identified as an overlap support, further strengthening the potential support zone.
On the resistance side, the 1st resistance at 0.85492 is highlighted as a significant level where selling pressure may intensify, as it coincides with a pullback resistance and the 61.80% Fibonacci Retracement. Moreover, the 2nd resistance at 0.85710 is recognized as an overlap resistance, adding to its significance as a barrier to further upward movement.

GBP/USD:
The GBP/USD chart currently demonstrates a bearish overall momentum, suggesting a downward trend. There’s a potential for further bearish movement towards the 1st support level.
The 1st support at 1.2581 is identified as an overlap support, indicating its historical significance as a level where buying interest has previously emerged. Additionally, the 2nd support at 1.2518 is characterized as a swing low support, further reinforcing its potential as a significant level of support.
On the resistance side, the 1st resistance level at 1.2564 is categorized as an overlap resistance, suggesting its historical significance as a point of potential resistance. Furthermore, the 2nd resistance at 1.2720 is identified as a pullback resistance, with the presence of the 78.60% Fibonacci Retracement, highlighting its importance as a potential barrier for further upside movement.
An intermediate support level at 1.2609 is also noted, considered a multi-swing low support, indicating another potential area where buying interest may emerge amidst the bearish momentum.

GBP/JPY:
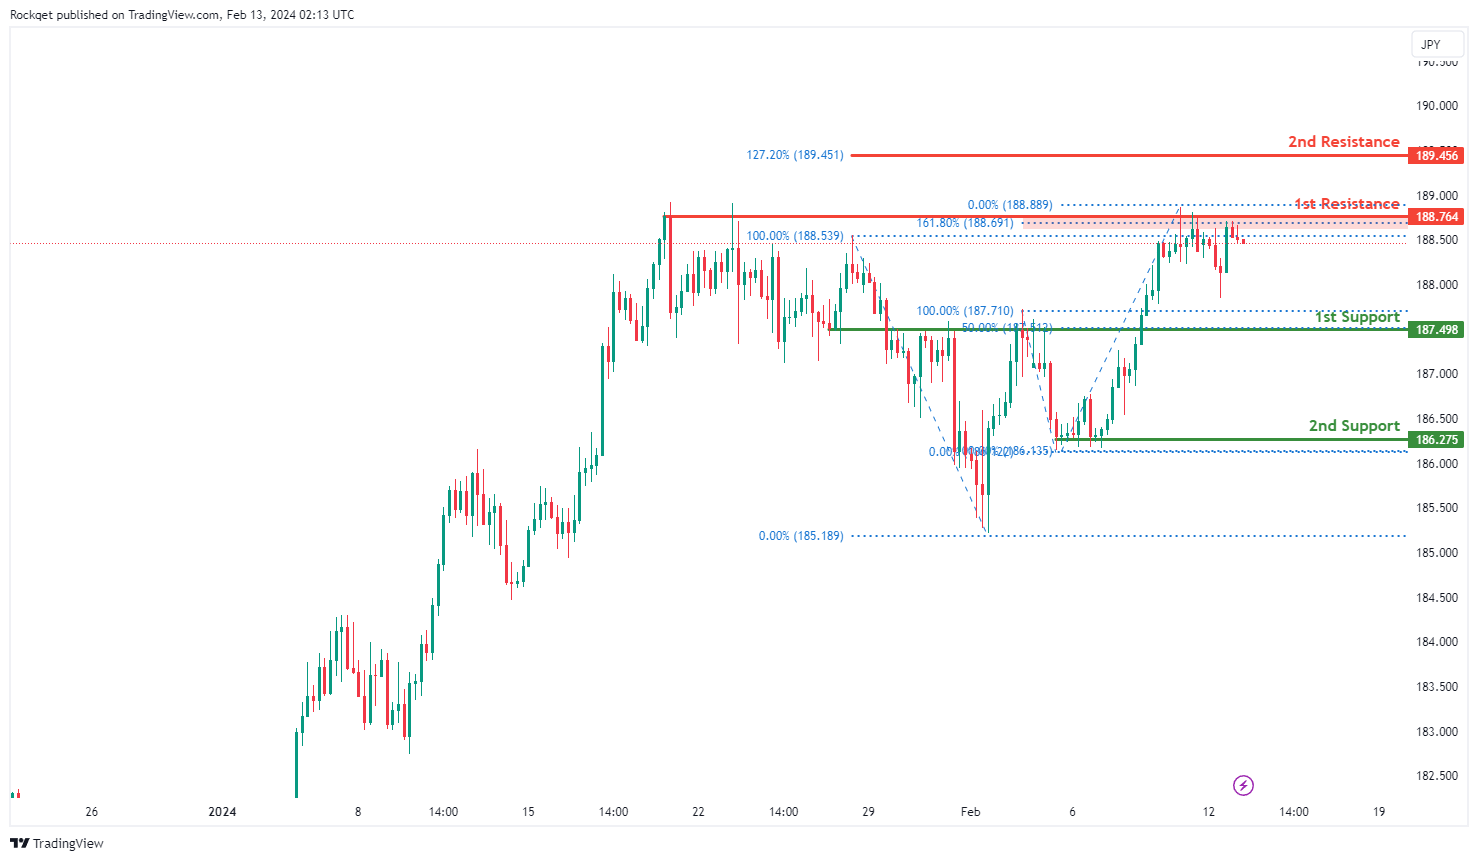
The GBP/JPY chart currently exhibits a bearish momentum, indicating a prevailing downward trend in the market. Given this bearish sentiment, the price could potentially continue its downward movement towards the 1st support level.
The 1st support at 187.498 is considered significant as it represents a pullback support, coinciding with the 50% Fibonacci Retracement level. This suggests a historical level where buying interest has previously emerged. Additionally, the 2nd support at 186.275 is identified as a multi-swing low support, further reinforcing the potential for a bounce at this level.
On the resistance side, the 1st resistance at 188.764 is highlighted as a significant barrier where selling pressure may intensify. This level aligns with a multi-swing high resistance and the 161.80% Fibonacci Extension, adding to its significance. Moreover, the 2nd resistance at 189.456 is recognized, coinciding with the 127.20% Fibonacci Extension, further strengthening its role as a resistance level.
USD/CHF:
The USD/CHF chart currently displays a bullish overall momentum, indicating an upward trend. There’s a potential for further bullish movement towards the 1st resistance level.
The 1st support at 0.8728 is identified as an overlap support, suggesting its historical significance as a level where buying interest has previously emerged.
Additionally, the 2nd support at 0.8675 is characterized as a pullback support, further reinforcing its potential as a significant level of support.
On the resistance side, the 1st resistance level at 0.8807 is categorized as a multi-swing high resistance, indicating its historical significance as a point of potential resistance.
Furthermore, the 2nd resistance at 0.8855 is identified as an overlap resistance, which adds to its importance as a potential barrier for further upside movement.

USD/JPY:
The USD/JPY chart currently exhibits a neutral overall momentum, indicating a lack of clear directional bias. There’s a possibility for price to oscillate between the 1st resistance and 1st support levels.
The 1st support at 148.77 is identified as an overlap support, suggesting its historical significance as a level where buying interest has previously emerged.
Additionally, the 2nd support at 147.81 is also characterized as an overlap support, reinforcing its importance as a potential level of support.
On the resistance side, the 1st resistance level at 149.63 is categorized as a multi-swing high resistance, indicating its historical significance as a point of potential resistance.
Furthermore, the 2nd resistance at 150.41 is identified as a pullback resistance, which adds to its significance as a potential barrier for further upside movement.

USD/CAD:
The USD/CAD chart currently exhibits a neutral bias. In this context, there is a potential scenario for price to fluctuate between the 1st support and the 1st resistance.
The 1st support level at 1.3434 is identified as a pullback support that aligns with the 61.80% Fibonacci Retracement level. Further below, the 2nd support level at 1.3365 is marked as a swing-low support that aligns with the 100.00% Fibonacci projection level, further emphasizing its importance as a potential support zone.
To the upside, the 1st resistance level at 1.3541 is identified as a pullback resistance. Higher up, the 2nd resistance level at 1.3620 is also noted as a pullback resistance that aligns close to the 61.80% Fibonacci Retracement level, further highlighting its importance as a potential resistance point.

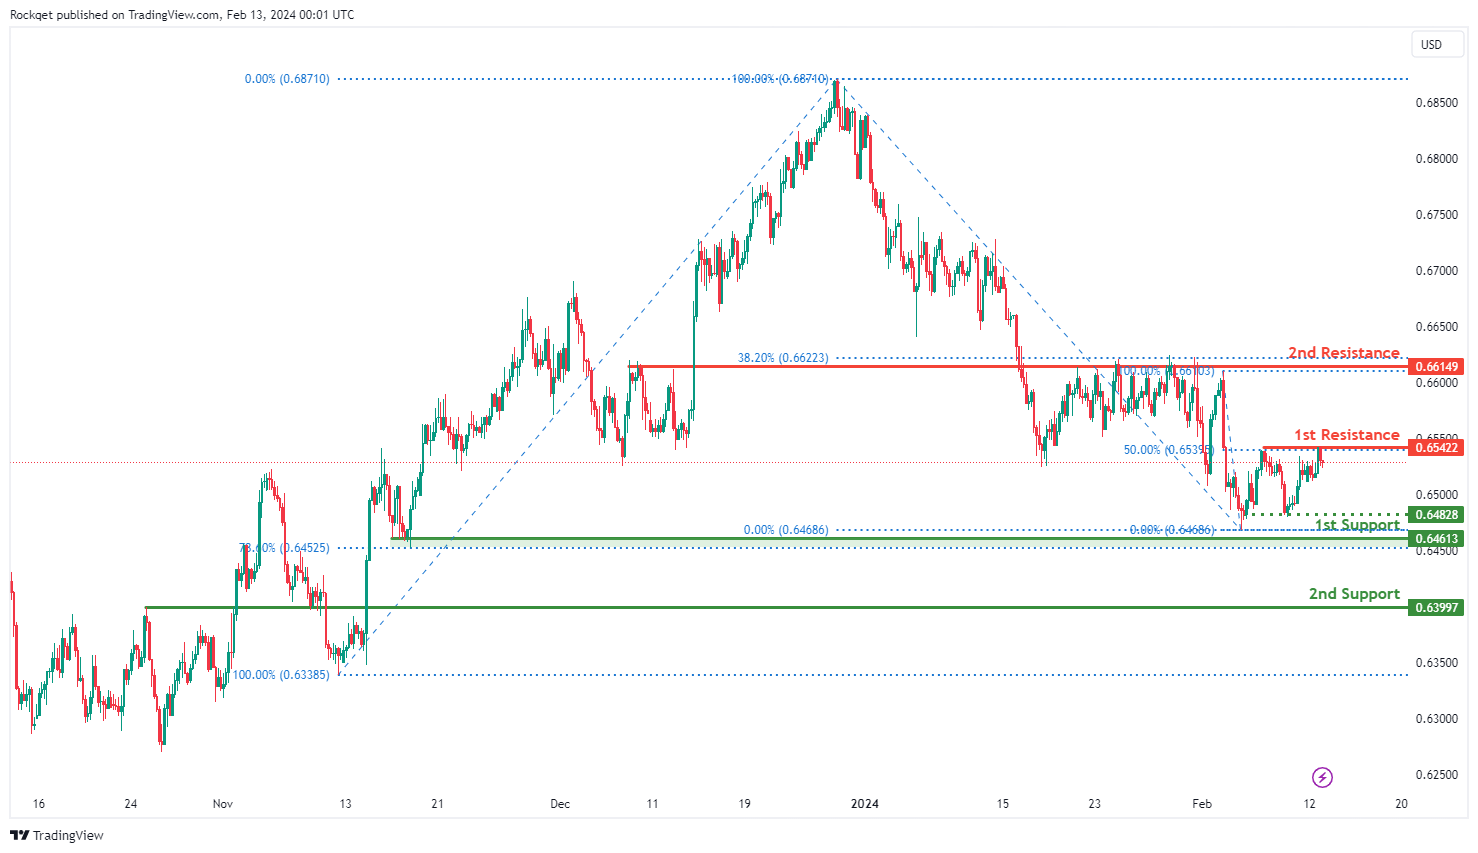
AUD/USD:
The AUD/USD chart currently exhibits a neutral bias. In this context, there is a potential scenario for price to fluctuate between the 1st support and the 1st resistance.
The intermediate support level at 0.6482 is identified as a pullback support while the 1st support level at 0.6461 is also marked as pullback support that aligns close to the 78.60% Fibonacci Retracement level. Further below, the 2nd support level at 0.6399 is noted as an overlap support, further emphasizing its importance as a potential support zone.
To the upside, the 1st resistance level at 0.6542 is identified as a pullback resistance that aligns with the 50.00% Fibonacci Retracement level. Higher up, the 2nd resistance level at 0.6614 is also marked as a pullback resistance that aligns close to the 38.20% Fibonacci Retracement level, further highlighting its importance as a potential resistance point.
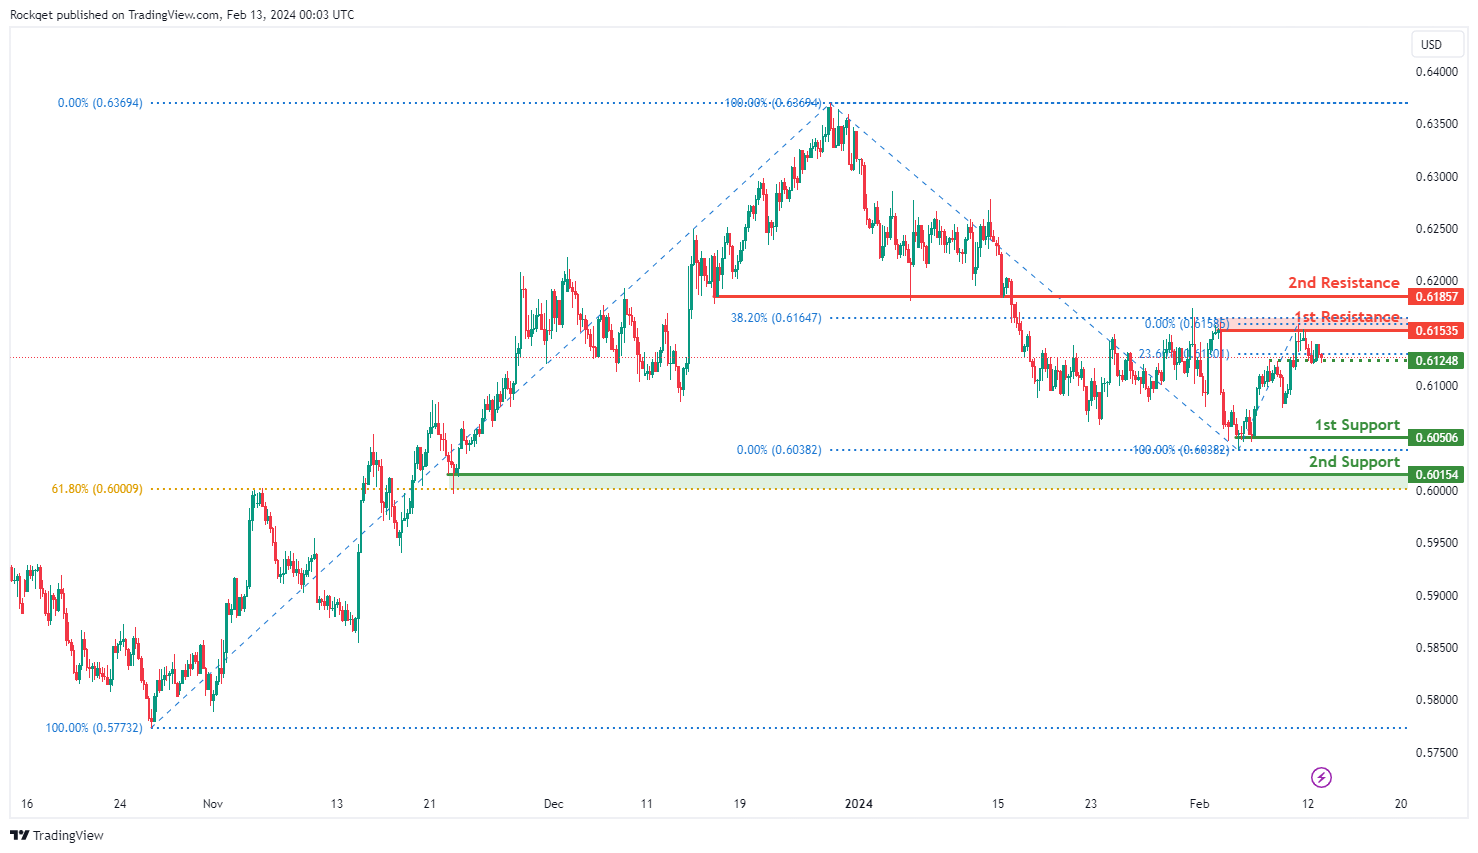
NZD/USD
The NZD/USD chart currently exhibits an overall bearish momentum. In this context, there is a potential scenario for price to drop towards the 1st support should it break under the intermediate support.
The intermediate support level at 0.6124 is identified as an overlap support that aligns with the 23.60% Fibonacci Retracement level while the 1st support level at 0.6050 is marked as a pullback support. Further below, the 2nd support level at 0.6015 is also noted as a pullback support that aligns close to the 61.80% Fibonacci Retracement level, further emphasizing its importance as a potential support zone.
To the upside, the 1st resistance level at 0.6153 is marked as a pullback resistance that aligns close to the 38.20% Fibonacci Retracement level. Higher up, the 2nd resistance level at 0.6185 is also marked as a pullback resistance, further highlighting its importance as a potential resistance point.
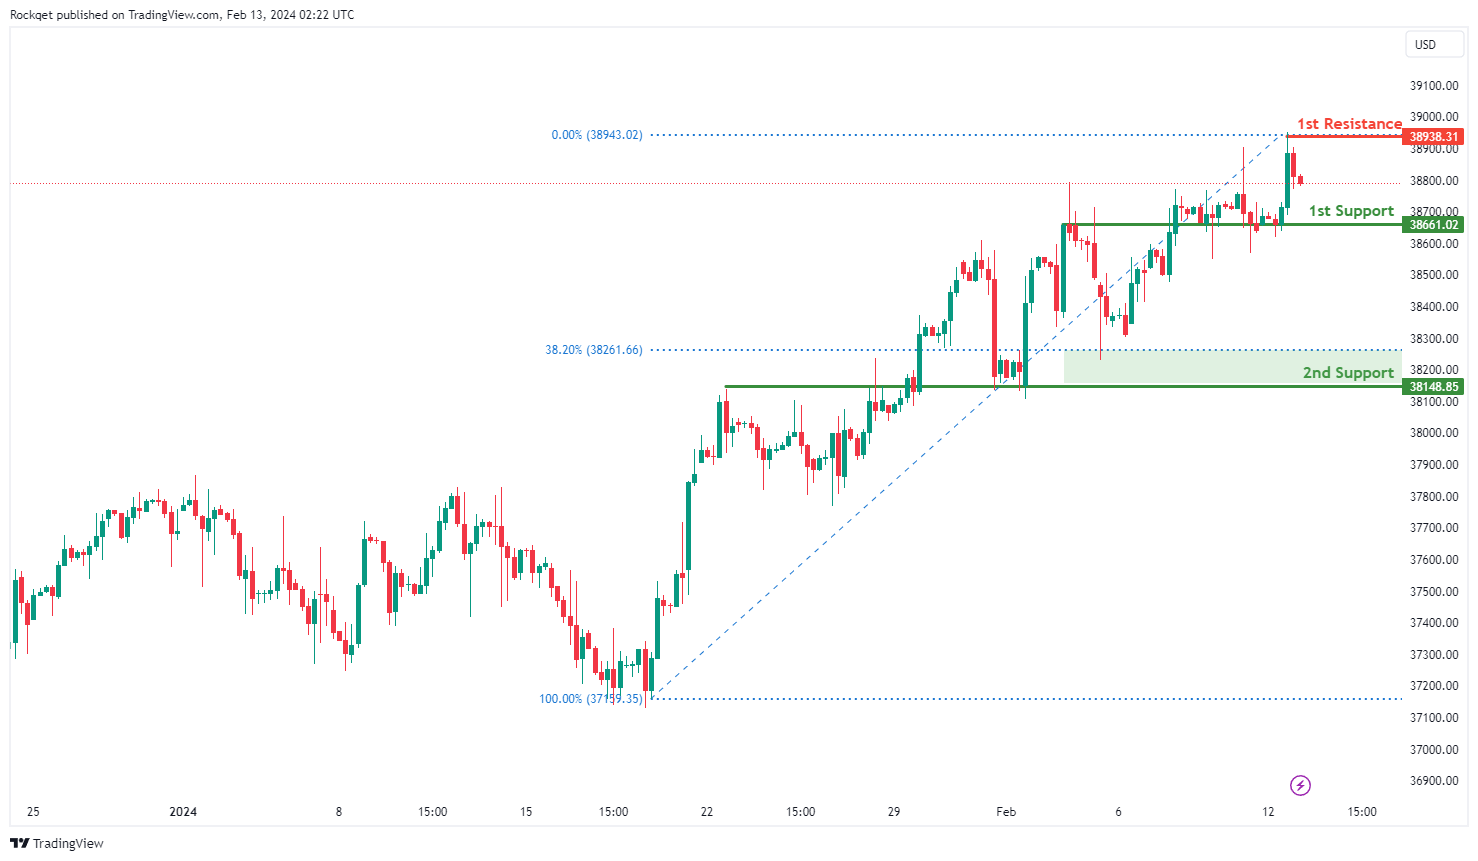
DJ30:
The DJ30 chart currently reflects a bearish momentum, indicating a prevailing downward trend in the market. Given this bearish sentiment, the price could potentially continue its downward movement towards the 1st support level.
The 1st support at 38661.02 is deemed significant as it represents an overlap support, suggesting a historical level where buying interest has previously emerged. Additionally, the 2nd support at 38148.85 aligns with both an overlap support and the 38.20% Fibonacci Retracement level, further reinforcing its potential as a support zone.
On the resistance side, the 1st resistance at 38938.31 is highlighted as a significant barrier where selling pressure may intensify. This level corresponds to a swing high resistance, indicating a historical point where selling interest has emerged.
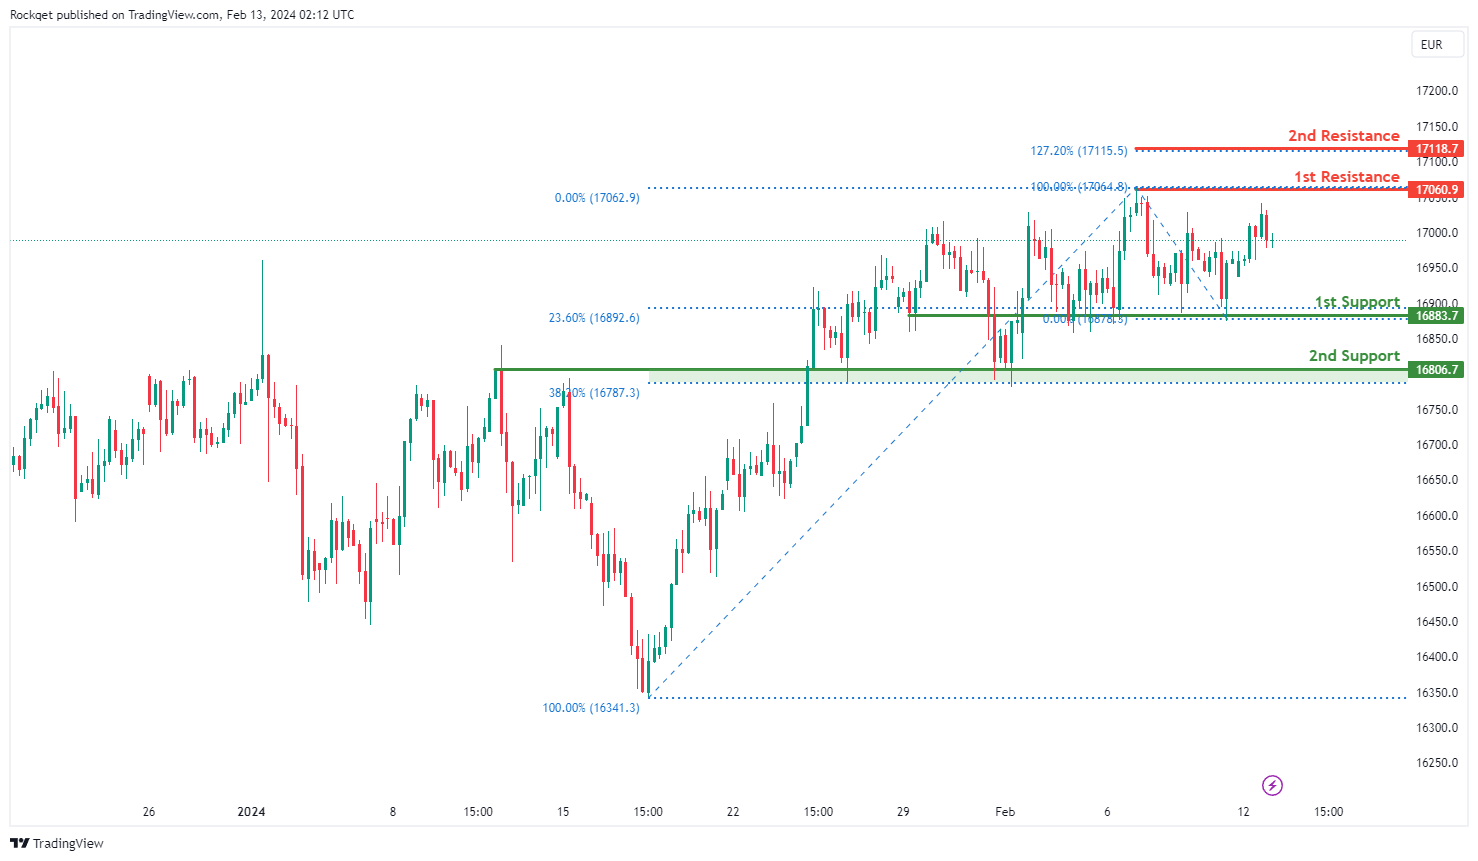
GER40:
The GER40 chart currently demonstrates a bullish momentum, indicating an overall upward trend in the market. Several factors contribute to this bullish sentiment, supporting the potential for a continued upward movement in the price.
The 1st support at 16883.7 is significant as it aligns with an overlap support and the 23.60% Fibonacci Retracement level, indicating a historical level where buying interest has previously emerged. Additionally, the 2nd support at 16806.7 coincides with both an overlap support and the 38.20% Fibonacci Retracement level, further reinforcing its potential as a support zone.
On the resistance side, the 1st resistance at 17060.9 represents a significant barrier where selling pressure may intensify. This level corresponds to a swing high resistance, indicating a historical point where selling interest has emerged.
Furthermore, an intermediate resistance at 17118.7 is identified, aligning with the 127.20% Fibonacci Extension level, adding further significance to this resistance level.
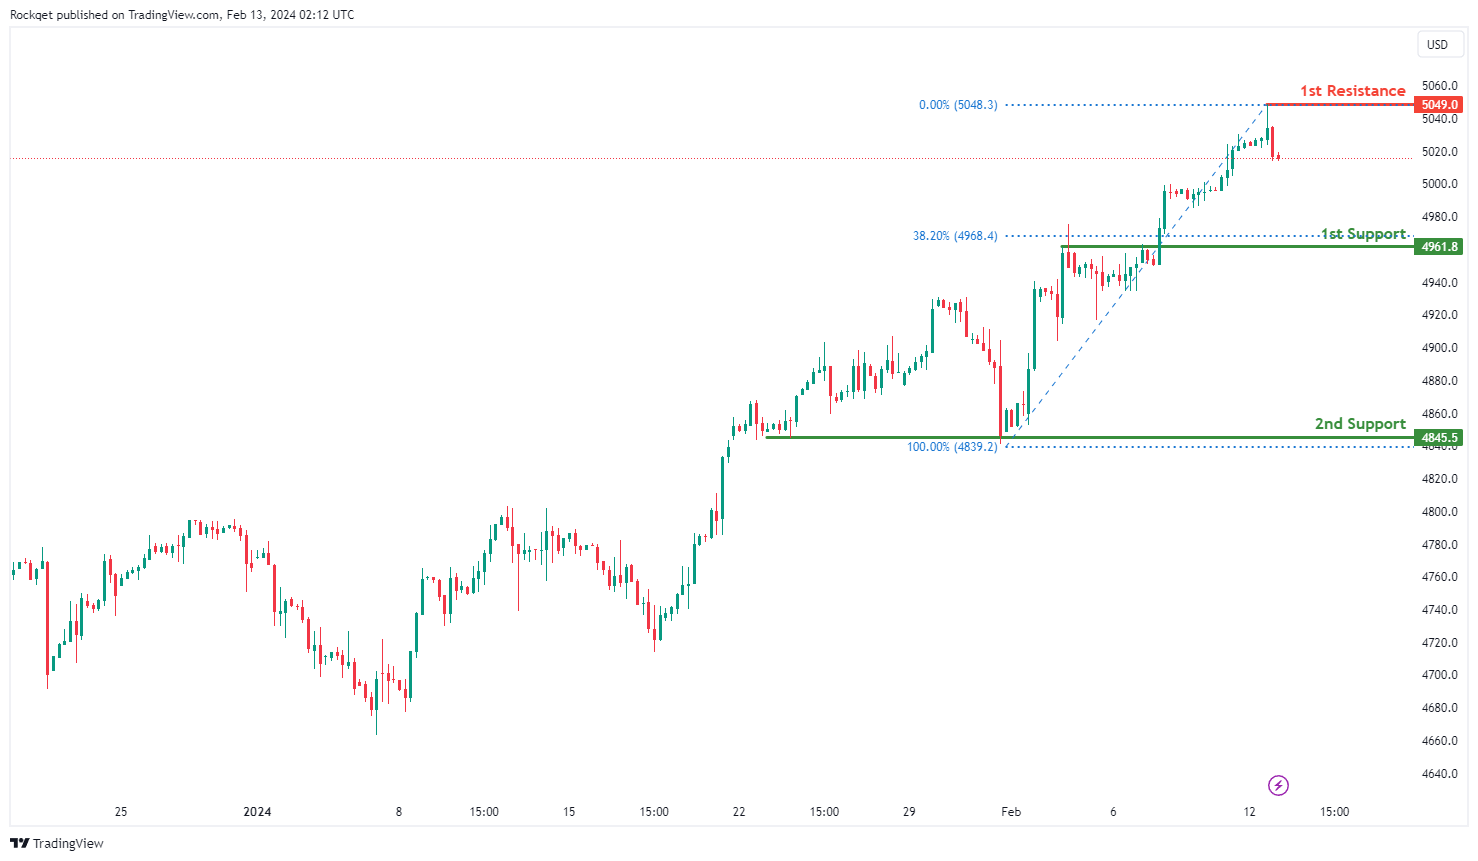
US500:
The US500 chart currently exhibits a bearish momentum, indicating a prevailing downward trend. Several factors contribute to this bearish sentiment, suggesting the potential for a continued downward movement in the price.
The 1st support at 4961.8 is considered significant as it aligns with a pullback support level and the 38.20% Fibonacci Retracement, indicating a historical level where buying interest has previously emerged. Additionally, the 2nd support at 4845.5 is identified as a multi-swing low support, further reinforcing the potential support zone.
On the resistance side, an intermediate resistance level at 5049.0 is noted, corresponding to a swing high resistance. This level may act as a barrier where selling pressure could intensify.
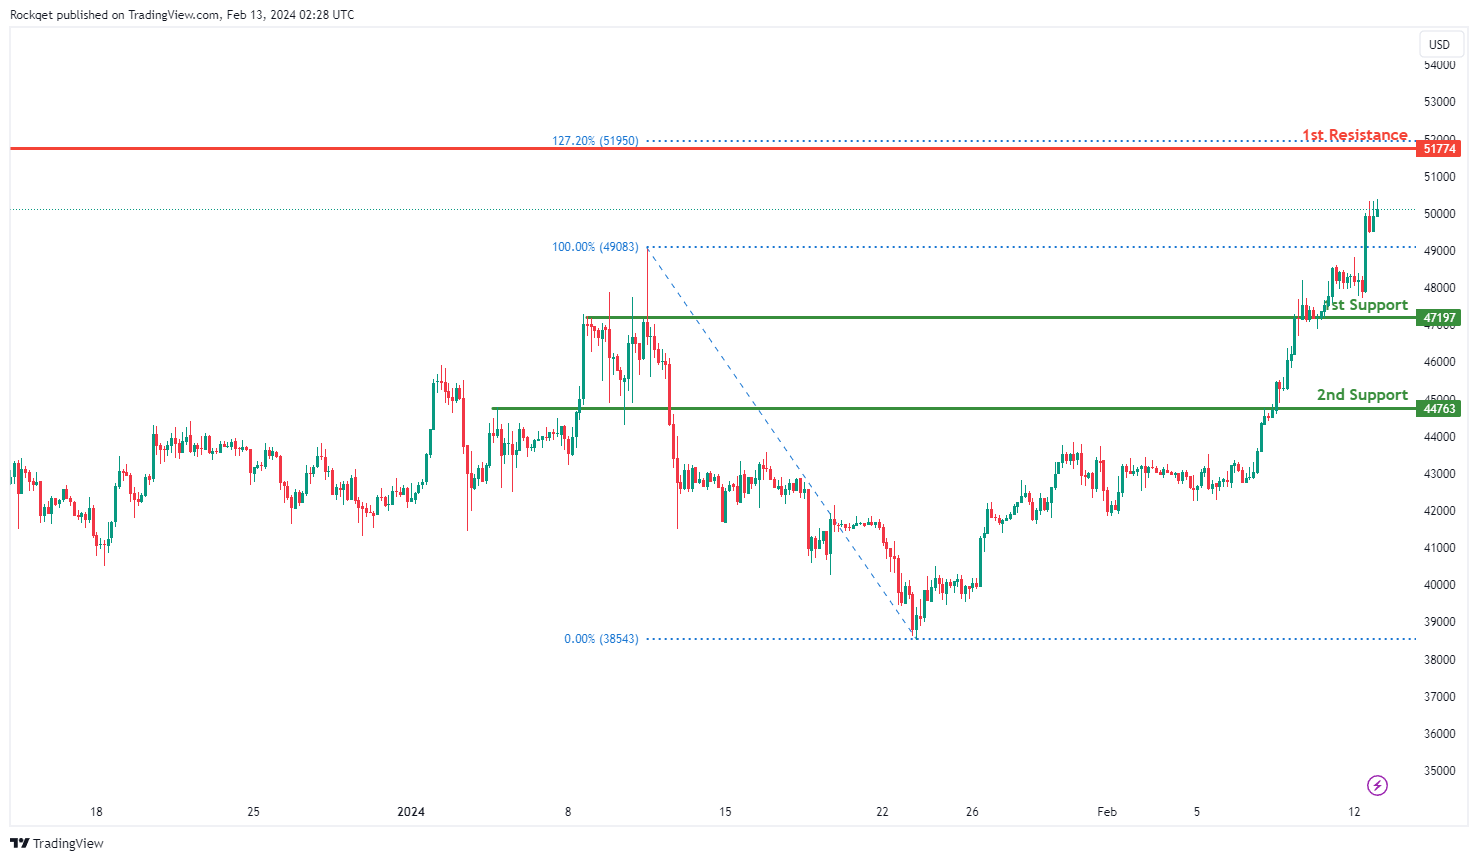
BTC/USD:
The BTC/USD chart currently demonstrates a bullish momentum, indicating an overarching upward trend. Several factors contribute to this bullish sentiment, suggesting the potential for a continued upward movement in the price.
The 1st support level at 47197 is considered significant as it aligns with an overlap support, indicating a historical level where buying interest has previously emerged. Additionally, the 2nd support at 44763 is identified as another overlap support, further reinforcing the potential support zone.
On the resistance side, the 1st resistance level at 51954 is highlighted as a significant barrier where selling pressure may increase, as it coincides with a swing high resistance level and the 127.20% Fibonacci Extension.
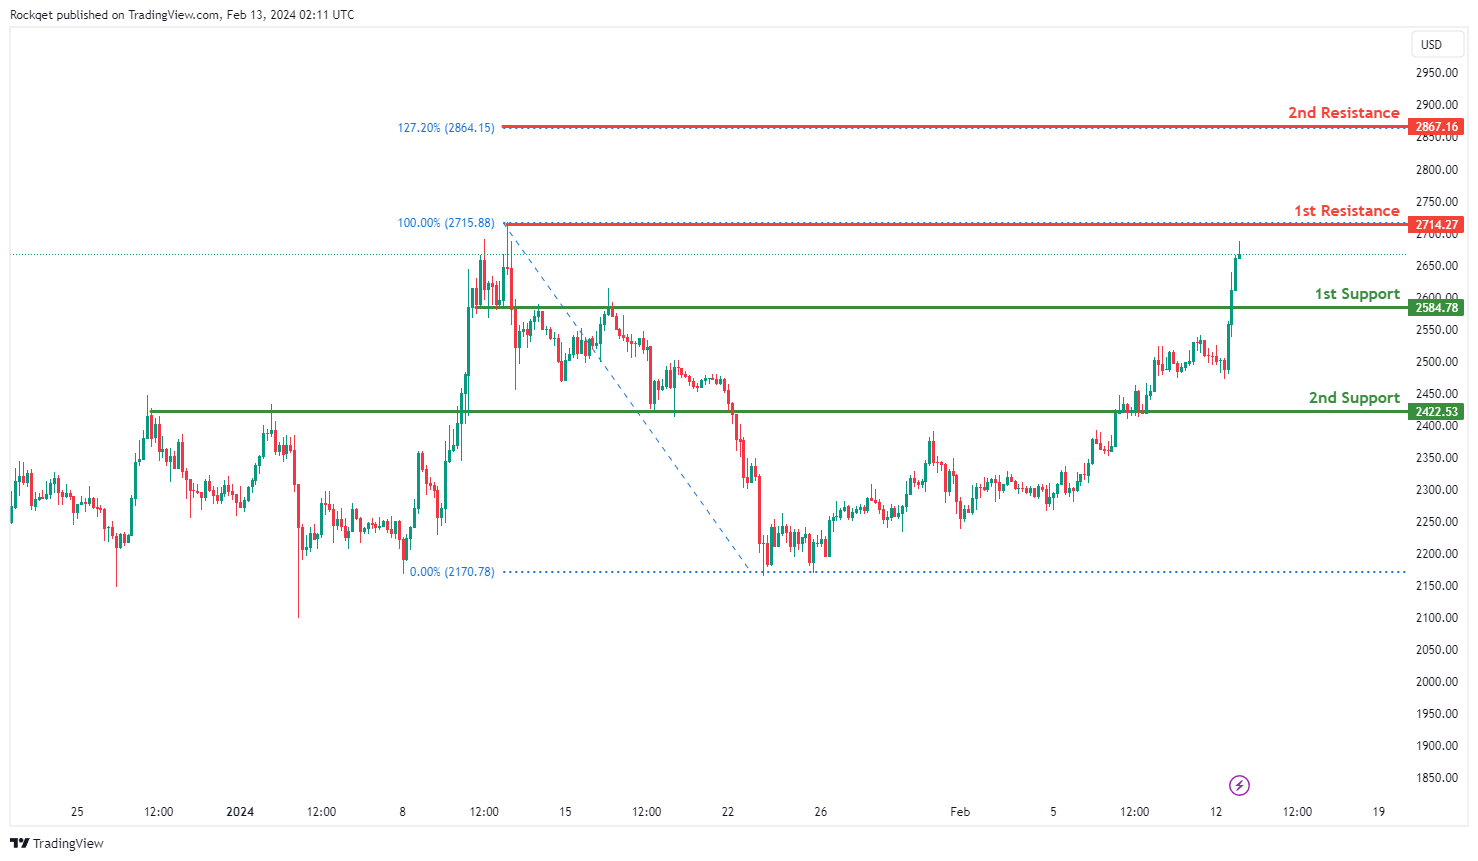
ETH/USD:
The ETH/USD chart currently maintains a bullish momentum, indicating a prevailing upward trend. Several factors contribute to this bullish sentiment, suggesting the potential for further upward movement in the price.
The 1st support level at 2584.78 is considered significant as it aligns with an overlap support, indicating a historical level where buying interest has previously emerged. Furthermore, the 2nd support at 2422.53 also serves as an overlap support, reinforcing the potential support zone.
On the resistance side, the 1st resistance level at 2714.27 stands out as a notable barrier where selling pressure may intensify, as it coincides with a swing high resistance level. Additionally, the 2nd resistance at 2867.16 aligns with the 127.20% Fibonacci Extension, adding further significance to this resistance level.
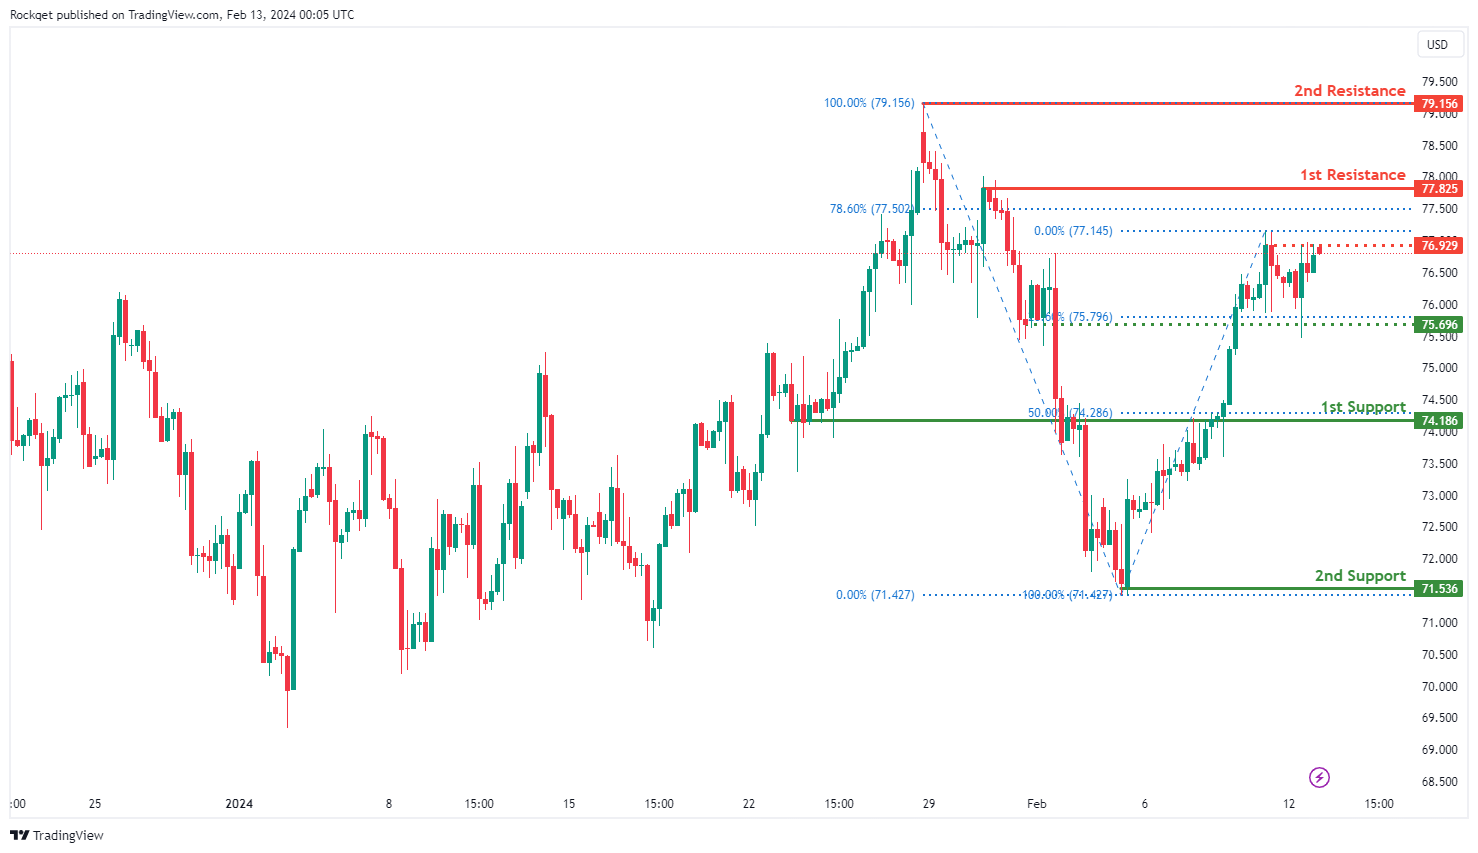
WTI/USD:
The WTI (West Texas Intermediate) chart currently exhibits an overall bullish momentum. In this context, there is a potential scenario for price to rise towards the 1st resistance should it break above the intermediate resistance.
The intermediate resistance level at 76.92 is identified as a pullback resistance while the 1st resistance level at 77.82 is also noted as a pullback resistance that aligns close to the 78.60% Fibonacci Retracement level. Higher up, the 2nd resistance level at 79.15 is marked as a swing-high resistance, further highlighting its importance as a potential resistance zone.
To the downside, the intermediate support level at 75.69 is identified as a pullback support that aligns with the 23.60% Fibonacci Retracement level while the 1st support level at 74.18 is noted as an overlap support that aligns with the 50.00% Fibonacci Retracement level. Further below, the 2nd support level at 71.53 is identified as a swing-low support, reinforcing its significance as a key support level.
XAU/USD (GOLD):
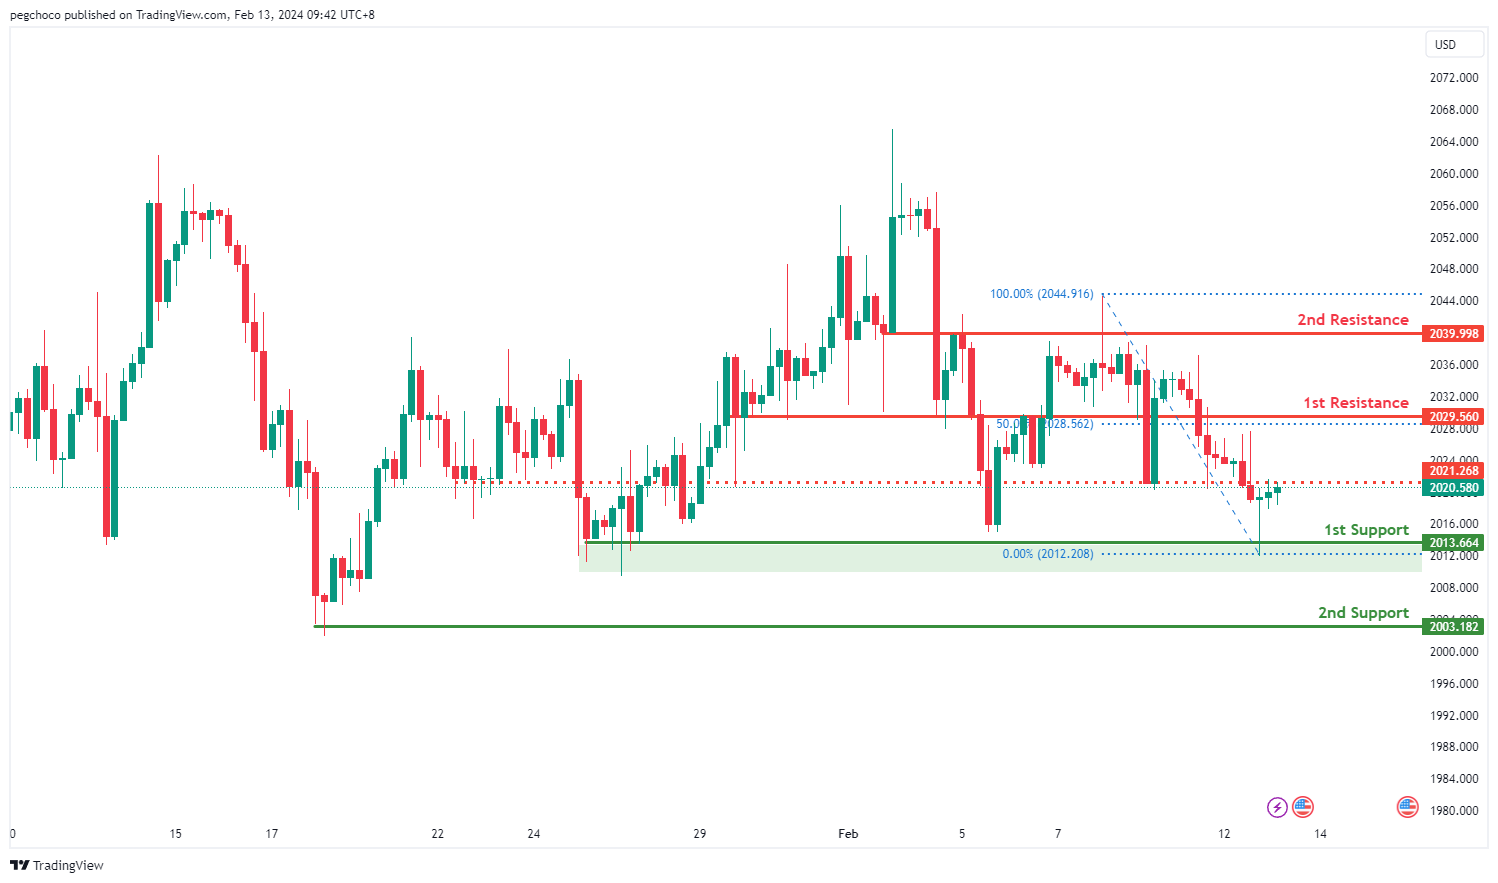
The XAUUSD chart currently demonstrates bullish momentum, indicating a potential continuation of the upward trend.
The first support level at 2013.66 is recognized as a multi-swing low support, suggesting a significant level where buying interest has historically emerged. Additionally, the second support at 2003.18 is characterized as a swing low support, reinforcing its significance as a level where buyers are likely to intervene.
On the resistance side, the first resistance is identified at 2029.56, noted as an overlap resistance. This level is particularly noteworthy as it aligns with the 50% Fibonacci Retracement level, indicating a potential area where selling pressure could emerge. Similarly, the second resistance at 2039.99 is categorized as an overlap resistance, presenting another potential barrier where price may encounter resistance.
Intermediate resistance at 2021.26 is labeled as an overlap resistance, highlighting another level where selling pressure may materialize.
Gold Price Restarts Decline, US CPI Report Next
Key Highlights
- Gold prices started a fresh decline from the $2,060 resistance.
- It traded below a key bullish trend line with support at $2,025 on the 4-hour chart.
- EUR/USD is consolidating losses below the 1.0830 resistance.
- The US Consumer Price Index could decline to 2.9% in Jan 2023 (YoY).
Gold Price Technical Analysis
Gold failed to settle above the $2,060 resistance zone against the US Dollar. It started a fresh decline below the $2,050 and $2,040 levels.
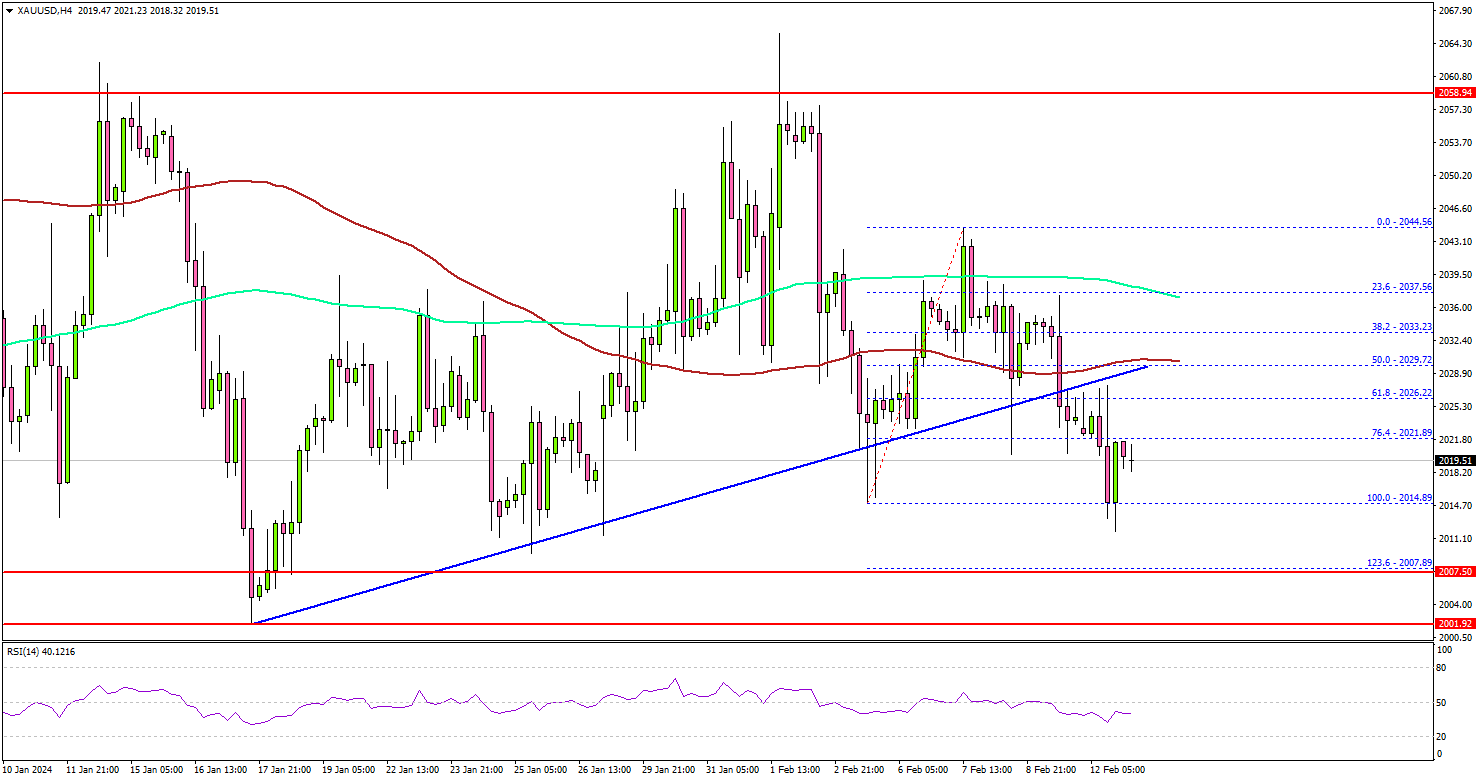
The 4-hour chart of XAU/USD indicates that the price settled below the $2,030 level, the 100 Simple Moving Average (red, 4 hours), and the 200 Simple Moving Average (green, 4 hours).
Besides, Gold traded below a key bullish trend line with support at $2,025 on the same chart. The current price action suggests a high chance of more downsides below the $2,010 level. Initial support is near the $2,007 level.
The first major support sits at $2,000. Any more losses might call for a move toward the $1,975 level in the coming days.
On the upside, the price is facing hurdles near the $2,030 level and the 100 Simple Moving Average (red, 4 hours). An upside break above the $2,030 level could send the price soaring toward the $2,050 resistance. The next major resistance is near the $2,060 level, above which Gold could test $2,078.
Looking at EUR/USD, the pair is still trading in a bearish zone below 1.0830 and there could be more losses in the near term.
Economic Releases to Watch Today
- US Consumer Price Index for Jan 2023 (MoM) – Forecast +0.2%, versus +0.2% previous.
- US Consumer Price Index for Jan 2023 (YoY) – Forecast +2.9%, versus +3.4% previous.
- US Consumer Price Index Ex Food & Energy for Jan 2023 (YoY) – Forecast +3.7%, versus +3.9% previous.
Australia NAB business conditions down to 6, price pressures easing
Australia NAB Business Confidence improved slightly form 0 to 1 in January. Despite this marginal improvement, Business Conditions dropped from 8 to 6, with notable decreases in trading conditions from 11 to 8, profitability conditions from 7 to 5, and employment conditions also falling from 7 to 5.
In terms of cost pressures, labour cost growth remained steady at 2.0% in quarterly equivalent terms, while purchase cost growth saw a slight increase to 1.8% from 1.7%. Product price growth experienced a pickup, moving to 1.2% in quarterly terms from 0.9%, reflecting a broader trend of easing price pressures. Specifically, retail price growth rose to 0.9% from 0.5%, and the growth rate for recreation & personal services prices increased to 1.2% from 0.9%.
NAB Chief Economist Alan Oster commented on the findings, stating, " Capacity utilisation remains high, despite the slowing in growth over the second half of 2023, and price pressures are easing, with hopes they settle well below where they are now."
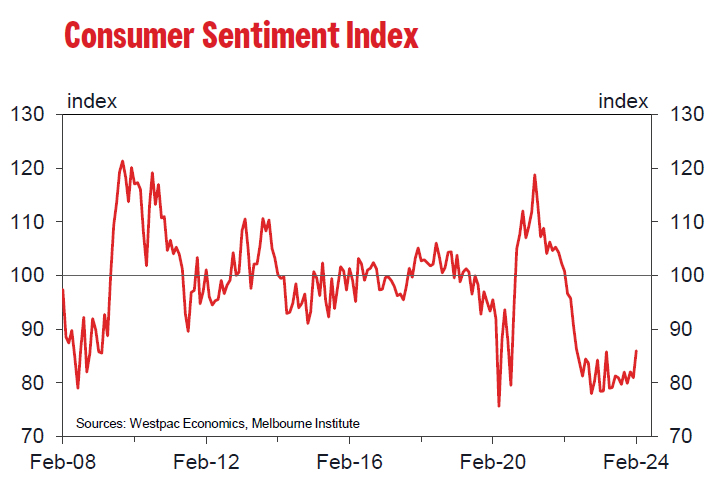
Australian Westpac consumer sentiment hits 20-Month high, but still pessimistic
Australia Westpac Consumer Sentiment Index surged by 6.2% mom to 86 in February, marking the highest level since June 2022. This increase also represents the largest monthly gain since April of the previous year, which conincided with a period when RBA temporarily halted its tightening cycle.
According to Westpac, the surge in consumer sentiment was notably propelled by improved sentiment towards major purchases, which climbed 11.3% to 86.8, and more optimistic outlook for the economy over the next year, rising 8.8% to 88.9—the highest since May 2022. Additionally, five-year economic outlook rose 4.4% to 93.
The cooling inflation and more favorable perspective on interest rates are believed to be the primary factors behind this uplift. However, despite the recent gains, consumer mood remains in the pessimistic territory.
A notable "sharp turnaround" in sentiment was observed following RBA's decision in February to maintain the cash rate steady, with sentiment dropping from 94.1 to just 80 post-meeting. While the decision to keep rates unchanged aligned with general expectations, the decline in sentiment suggests consumers were anticipating a "clearer indication" that interest rates might begin to decrease.
Looking forward, Westpac anticipates the RBA will maintain the current interest rate in March, contingent on inflation continuing to align with expectations.
RBA’s Kohler points to slightly faster than expected inflation decline
Marion Kohler, RBA's Head of Economic Analysis, noted in a speech that inflation is "still high" but acknowledged a welcome trend: it's decreasing "at a slightly faster rate" than what RBA had forecasted three months prior.
Looking ahead, RBA's expectation is for inflation to settle back into its 2-3% target range by 2025 and reach the midpoint by the following year. However, Kohler underscored the "substantial uncertainty" surrounding these long-term predictions.
A notable aspect of Australia's inflation dynamics, as Kohler pointed out, is the "divergence in the path of core goods and services price inflation."
The primary driver behind the recent dip in inflation rates is the decrease in goods price inflation, whereas services price inflation remains "high and broadly based." This sector's inflation is predicted to "only gradually" diminish as a more equitable demand-supply relationship is established and domestic cost pressures begin to ease.
Kohler also touched on labor costs, particularly significant in the labor-intensive services sector, as a crucial factor influencing the pricing strategies of businesses. RBA believes wage growth is "around its peak" and anticipates a gradual reduction in line with improvements in the labor market. Signs of "easing wage pressures" are already evident in specific industries, notably within business services.
ECB’s Cipollone: No further economic slack necessary
In a speech overnight, ECB Executive Board member Piero Cipollone suggested that additional tightening of monetary policy may not be necessary to rein in inflation. His remarks hint at a potentially less restrictive approach going forward, should inflationary pressures continue to subside.
Cipollone emphasized that the current economic conditions, "with demand still weak and inflation expectations anchored", arguing against the need for monetary policy to "generate further slack to keep inflation in check". This perspective underlines a significant shift from aggressive tightening to a more measured stance, possibly preparing the ground for a more accommodative monetary policy in the near future.
Unwinding of supply shocks offers room for demand to pick up "without fuelling inflation". Additionally, the downturn in energy prices could allow for "some wage catch-up, especially if profits normalize."
However, Cipollone also stressed the importance of a balanced approach to policy-making, pointing out that the path to the ECB's inflation target would depend on a complex interplay of economic factors. Consequently, he advocated for a "data-driven" approach to future monetary-policy decisions.
GBP/JPY – Testing Highs Ahead of Key UK Economic Data
- UK wage growth key to BoE sustainably hitting inflation target
- GBPJPY struggling near recent highs
- Divergence points to loss of momentum
The coming days offer several important data points for the UK that could help determine when the Bank of England starts cutting interest rates and, by extension, where the currency is headed in the coming months.
The jobs report on Tuesday is always widely followed but with the unemployment component less reliable than normal, it’s the average earnings that will matter most.
At 6.5% in November, it’s currently running far too high to enable inflation to fall to 2% on a sustainable basis and the BoE will be hoping that it will subside considerably in the coming months, as is expected to have started in December.
A double top at the November and January highs?
The pound has performed very well against the yen recently, as many currencies have, recouping all of December’s losses to surpass the November peak.
GBPJPY Daily
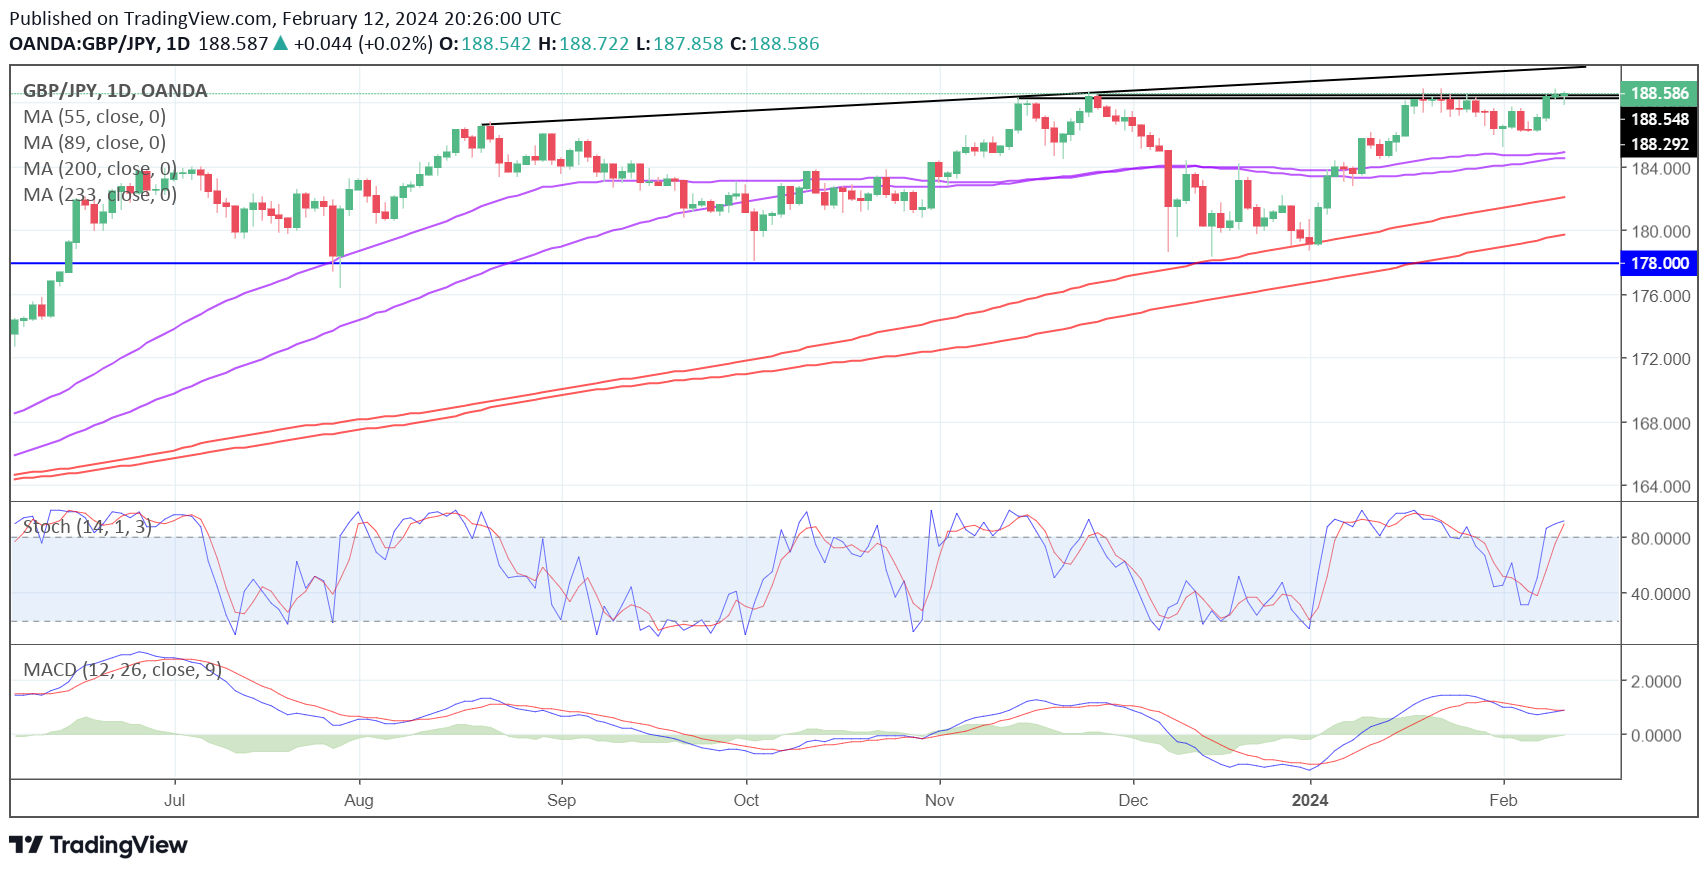
Source – OANDA
It is continuing to struggle near 189 where it has repeatedly now run into resistance. And on this occasion, it’s done so on much weaker momentum, with there being a notable divergence between the stochastic and MACD, and price.
This could potentially set up a double top in the short term, with the neckline falling at the 1 February low – around 185.23 – a break of which would be a bearish development.
Brent Crude Prices Edge Higher Amid Middle East Tensions
Brent crude oil prices are currently hovering around $82.00 per barrel this Monday, with market sentiment influenced by recent developments in the Middle East. Although concerns over disruptions to energy supplies from the region have somewhat subsided, the possibility of supply disturbances continues to support oil prices.
The rejection of a ceasefire offer by Israel from Hamas last week led to a near 6% increase in oil prices, as the market remains sensitive to geopolitical tensions that could impact oil supply.
It's anticipated that trading activity in the oil market may be subdued this week due to holidays in much of the Asia-Pacific region, including China, Hong Kong, South Korea, Taiwan, and Japan.
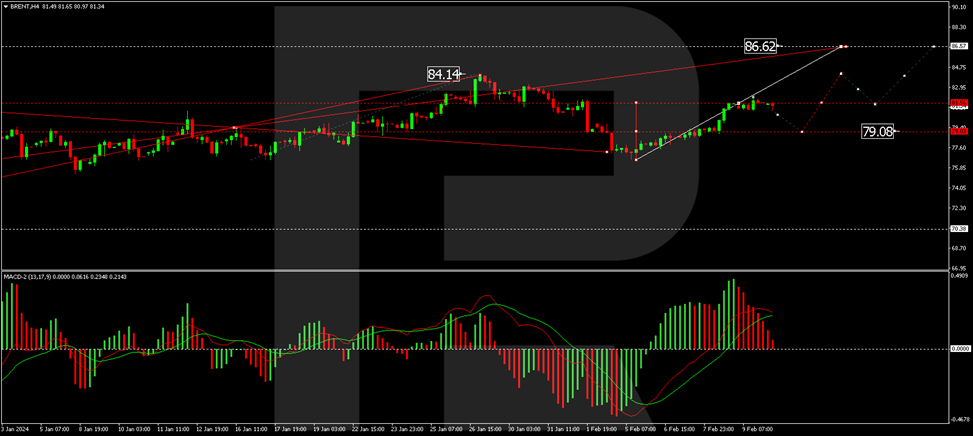
Brent Technical Analysis
The H4 chart analysis for Brent indicates the formation of a new growth wave, with a recent structure completion at $82.12. The market is now forming a consolidation range below this level, and a correction down to $79.10 is not out of the question. Following this correction, a new upward trajectory towards $84.20 is expected, potentially extending to $86.68. The MACD indicator supports this view, with the signal line at the highs and anticipated to cycle back towards zero.
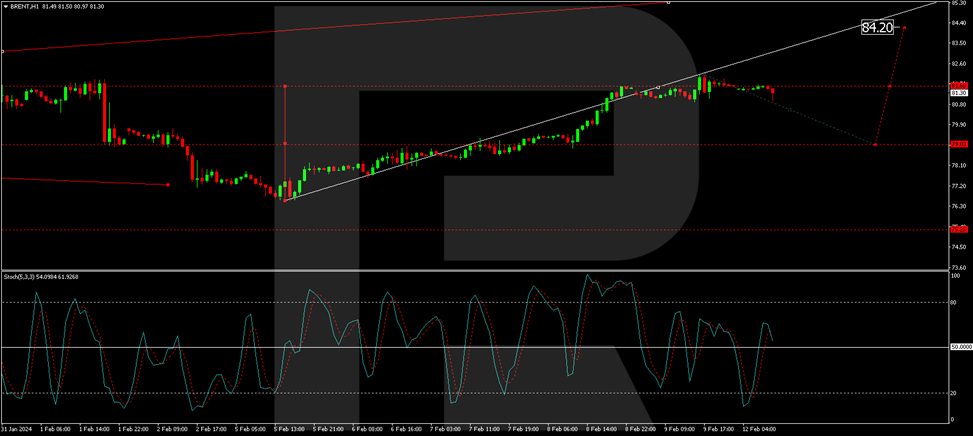
On the H1 Brent chart, a consolidation phase is observed under $82.12. A downward escape could lead to a correction towards $79.10, followed by an expected growth wave to $82.20. An upward breakout could set the stage for a movement towards $84.20. The Stochastic Oscillator, with its signal line above 50 and targeting 80, corroborates this growth potential.
Sunset Market Commentary
Markets
Core bonds marginally gained at the beginning of the new week. In super quiet trading (already starting in Asia as Japan and China kept their doors shut), US yields pared initial drops between 1.5 and 2.6 bps. German rates ease a little more, changes ranging between -0.6 and -2.4 bps. The European swap yield curve shifts lower similarly. Moves are technically inspired. Both US and German bond yields trade just shy of the first technical resistance zones (YtD highs) after recovering some ground last week. Investors took the opportunity of an empty economic calendar today to scoop up some of those beaten-up bonds. With important data scheduled for release later this week, they had an additional argument to do so today. The US and the UK take center stage, beginning with January inflation numbers in the former and the labour market report for the latter tomorrow. Equity markets took a guarded start. The EuroStoxx50 still ekes out a tiny gain, extending its recent winning streak. From a technical point of view, there are basically no resistance levels worth mentioning that lie between the current level (4723) and the nillies all-time high of 5522. Wall Street’s runner’s high is fading with the major indices treading water.
The dollar gains against most G10 peers, including the euro. EUR/USD snaps a four-day winning streak by testing but failing to overcome the 1.0793/1.08 big figure resistance. The pair is currently changing hands at 1.077. The trade-weighted dollar index (DXY) bounced off the 104 mirror support. Sterling holds steady against the euro and eases against an overall stronger USD. GBP/USD remains above 1.26 though – the level that marked the lower bound of a recent sideways trading range. The kiwi dollar underperforms despite the governor of the central bank saying before parliament that inflation remains too high. Deputy governor Hawkesby (what’s in a name) doesn’t seem to be in a hurry to cut rates, noting that the financial system can handle the current higher interest levels. It’s probably some profit-taking in NZD after a boost last week from an influential New Zealand bank airing expectations for the RBNZ to resume hiking. This compares to most, if not all, advanced central banks, be it slowly, pivoting towards monetary easing.
News & Views
The Chartered Institute of Personal and Development published its quarterly survey (winter 2023-24) today. There are signs that UK labour market tightness appears to be reducing and CIPD sees evidence there will be further easing in the coming months, as fewer employers are expecting significant problems filling vacancies. At the start of the new year, hiring freezes also seem more apparent, particularly among SMEs. The net employment balance, measuring the difference between employers expecting to increase staff levels in the next three months and those expecting to decrease staff levels – remains positive but has fallen from +26 last quarter to +22 this quarter. 9% of private sector employers plan to decrease staff levels in the next three months. In the public sector this even amounts to 18%. The expected basic pay increase has fallen from 5% last quarter to 4% this quarter, matching the December Y/Y CPI level. Expected pay awards in the public sector fell further than in the private sector from 5.0% to 3%. CIPD expects this to continue as inflation falls further. The CIPD survey evidence will meet a reality check of the official UK labour market data to be published tomorrow morning.
Price adjustments in the German property market continued in Q4 2023. Property prices were down by 2.2% Q/Q and 7.2% Y/Y, the VDP association of German Pfandbrief Banks revealed. The index dropped 10% off the peak level reached in Q2 2022. Residential property prices declined 1.6% Q/Q and 6.1% Y/Y. However, markets currently are in particular worried on potential impact of a further deterioration in the commercial property markets on banks’ balance sheets. In this respect, VDP saw the Q4 2023 decline in commercial property prices at 4.9% Q/Q and 12.1% Y/Y. This was especially due to office property prices. VDP doesn’t see a material improvement anytime soon as ‘their returns have thus far generally failed to meet investors’ expectations. On top of this, demand for offices remains subdued due to the uncertain economic growth in Germany and the still unclear impact of the working from home trend on office space needed, leading to further price decreases. VDP’s Jens Tolckmitt sees prices in residential property stabilizing summer, but not before the end of the year in the commercial segment.