Sample Category Title
Stronger Labour Market Continues to Boost Pound
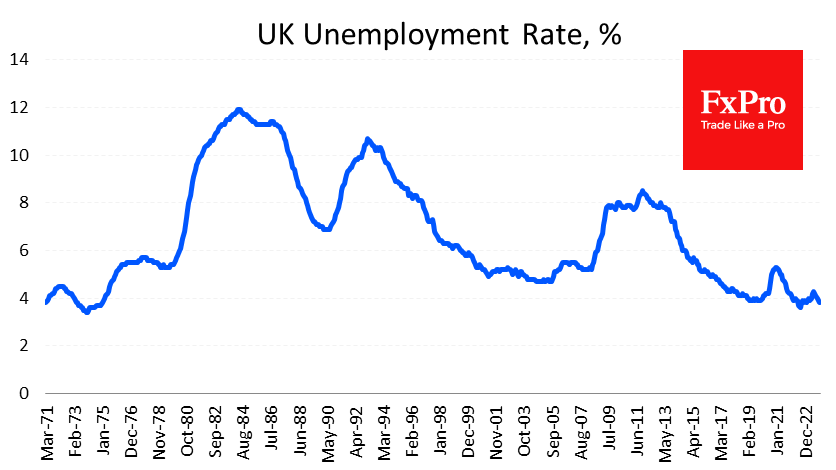
Economic data continues to be on the Pound’s side, with another set of better-than-expected figures, this time from the labour market. The unemployment rate fell from 4.2% to 3.8% against expectations of 4.0%.
A fall in the number of active job seekers in the labour market increases competition among employers, helping to keep wages growing at a higher rate. Wages rose by 5.8% in the three months to December. That’s a solid decline from 6.7% the previous month and a peak of 8.5% six months earlier, but more robust than the 5.8% expected.
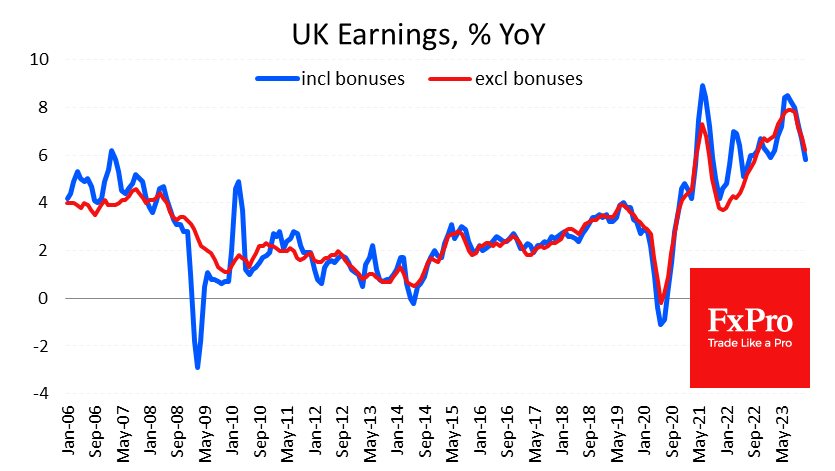
The annual rate of wage growth has been above the rate of consumer inflation for half a year, narrowing the gap that had built up in previous years as prices had risen sharply. The slowdown in wage growth and the uptrend in the unemployment rate create an expectation that the Bank of England’s next move will be to cut interest rates. However, more potent labour market data, especially if complemented by a further acceleration in inflation on Wednesday, will push back the expected date for policy easing.
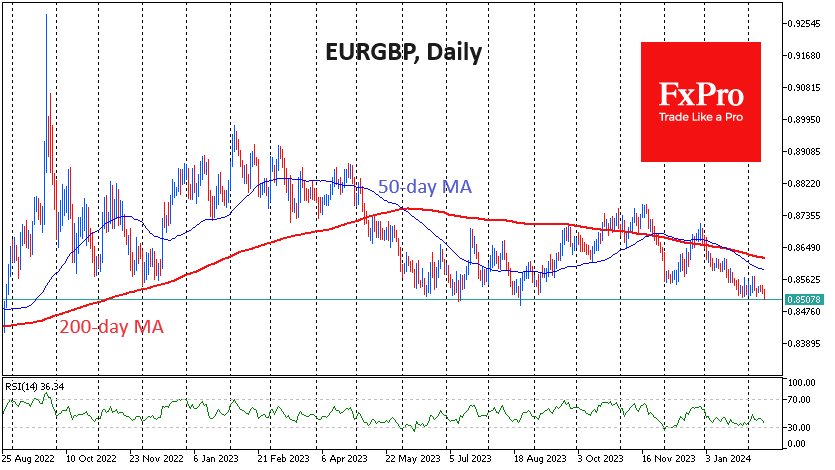
Better-than-expected employment figures have supported the Pound’s gains, especially against the Euro and the Franc. The GBPUSD has primarily traded in a very tight range of 1.26-1.2650 over the past week. EURGBP is down 0.3% at 0.8510, the June-August 2023 pivot area, following the release. The pair’s active bearish trend, which began earlier this year, suggests a renewal of multi-month lows with the potential for a drop to 0.83-0.84 before the end of the current quarter.
A Step in the Right Direction for the UK But BoE Will Remain Cautious
The UK is continuing to make progress toward being able to cut interest rates but as has been the case throughout the last couple of years, the process is far from straightforward.
The good news is that wage growth is slowing at a good pace after peaking last summer and near-term trends are very promising. The bad news is that the labor market remains very tight and it's still highly uncertain whether wage growth will fall to a level consistent with 2% inflation soon.
Then there's the unemployment rate which fell to 3.8% but is no longer reliable as a sole indicator. At a time when the BoE would like absolute clarity on the labor market, it's left to piece together a variety of data and surveys to form a judgment. Not ideal when central banks everywhere are petrified to move too early and risk stoking inflationary pressures again.
This is the first major economic release for the UK this week with inflation to come tomorrow, GDP on Thursday, and retail sales on Friday. Ultimately the CPI data is what matters most but it would be handy if wage growth continues to slide between now and the May meeting if that is to be the live decision many expect it will.
The pound is trading higher on the back of the release on the belief that today's data is a small setback - wage growth not falling as much as expected and unemployment falling further. I don't think today changes a great deal, wage growth is still cooling at a decent rate and the data over the next couple of months is arguably more important.
The MPC will only have data up to March in time for the May meeting which is perhaps why markets are currently favoring a summer start for rate cuts.
Oil continues to drift higher
Oil prices are up almost 8% from last week's lows but remain a little shy of the peak hit in late January. The market remains very volatile, with events in the Middle East creating upside risks. Then there's the global economy and interest rates, the expectations of which are forever changing. Interest rate expectations have been pared back more recently but traders remain upbeat on the economic outlook. Of course, the further back the first rate cuts are pushed, the less confident people will be which could weigh on oil prices.
Gold choppy ahead of US CPI
Gold remains rangebound following quite a choppy start to the year. The yellow metal has remained above $2,000 during this time which suggests traders are committed to the prospect of many rate cuts this year. But in the absence of that first move or even a hint toward it, we haven't seen a breakout in either direction. Perhaps the US CPI data later could tip the balance.
A psychologically important milestone
The post-ETF sell-off in bitcoin didn't last very long and a break above $50,000 will be widely viewed as a significant milestone in its comeback. It's been a rough couple of years but the ETF approvals were an important achievement that's helped propel the price higher. Many will now be hoping it goes from strength to strength, perhaps buoyed by the halving event in April.
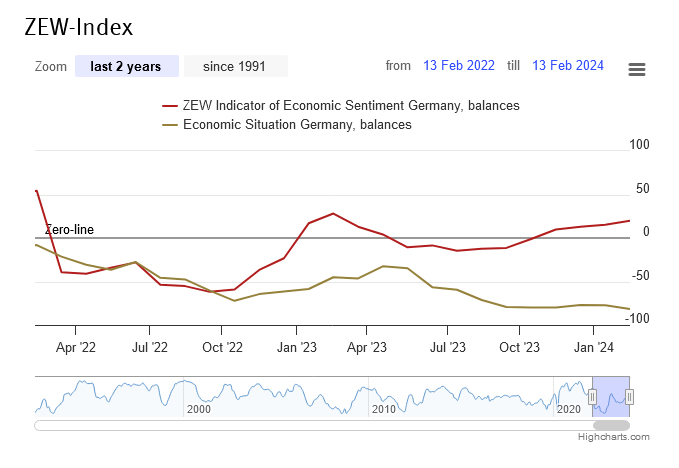
German ZEW sentiment rises to 19.9, anticipating rate cuts
German ZEW Economic Sentiment rose from 15.2 to 19.9 in February, above expectation of 17.5. Current Situation Index, however, fell from -77.3 to -79.0, below expectation of -81.7.
Eurozone ZEW Economic Sentiment rose from 22.7 to 25.0, above expectation of 20.1. Current Situation Index increased 5.9 to -53.4.
ZEW President Achim Wambach said: "The German economy is in a bad place. The assessment of the current economic situation by the respondents has deteriorated to the lowest level since June 2020. In contrast, economic expectations for Germany have improved again."
"Accordingly, more than two-thirds of the respondents expect the ECB to make interest rate cuts over the next six months in light of falling inflation rates. Almost three-quarters of respondents expect imminent interest rate cuts by the American central bank."
USD: Critical Levels To Watch Ahead of CPI
The US Dollar Index (DXY) has been in a consolidation phase since early February, displaying minor signs of weakening last week. Despite this, the USD continues to find support around the 104.00 mark on dips, indicating a general resilience. Analysis suggests that the USD may currently be overvalued in the short term when considering various factors such as spreads. Moreover, US yields have remained relatively stagnant, limiting the potential for the USD to strengthen without significant economic data improvements. Market sentiment is awaiting the release of the US January CPI report, which is expected to influence the USD's short-term trajectory. Depending on whether inflation is slower or sticks close to expectations, the USD's direction could vary, potentially impacting market expectations regarding future Federal Reserve actions. In essence, while the USD remains somewhat stable, its near-term movement hinges on upcoming economic data releases.
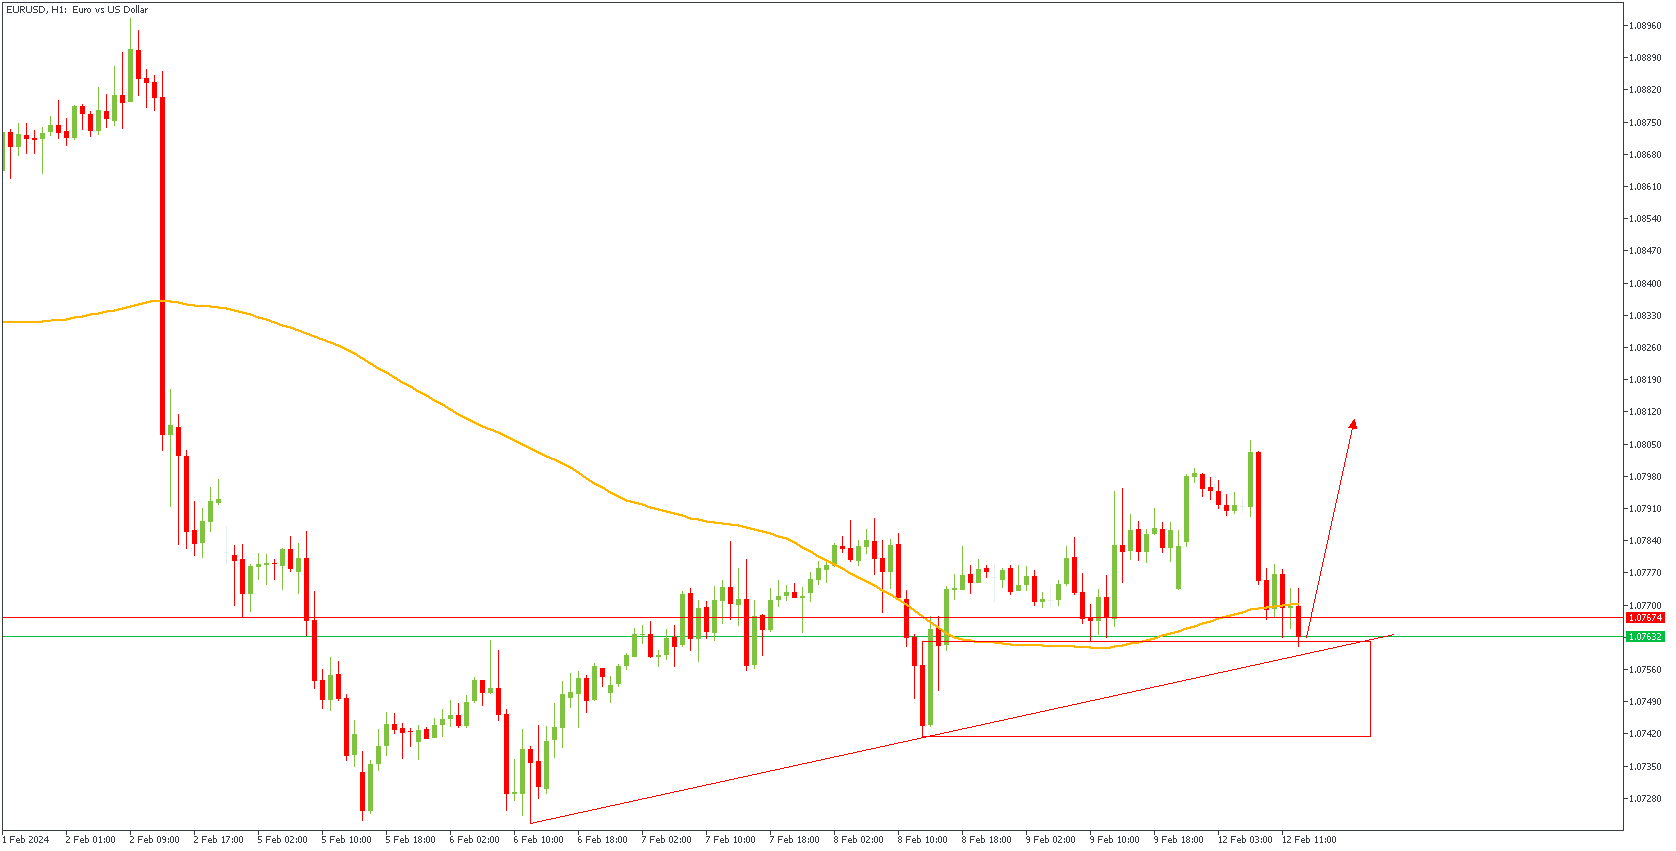
EURUSD - H1 Timeframe
On the 1-hour timeframe, EURUSD is currently being supported by the trendline, 100-period moving average,as well as the demand zone - all of which indicate the possibility of a bullish continuation from the current zone.
Analyst’s Expectations:
- Direction: Bullish
- Target: 1.07997
- Invalidation: 1.07408
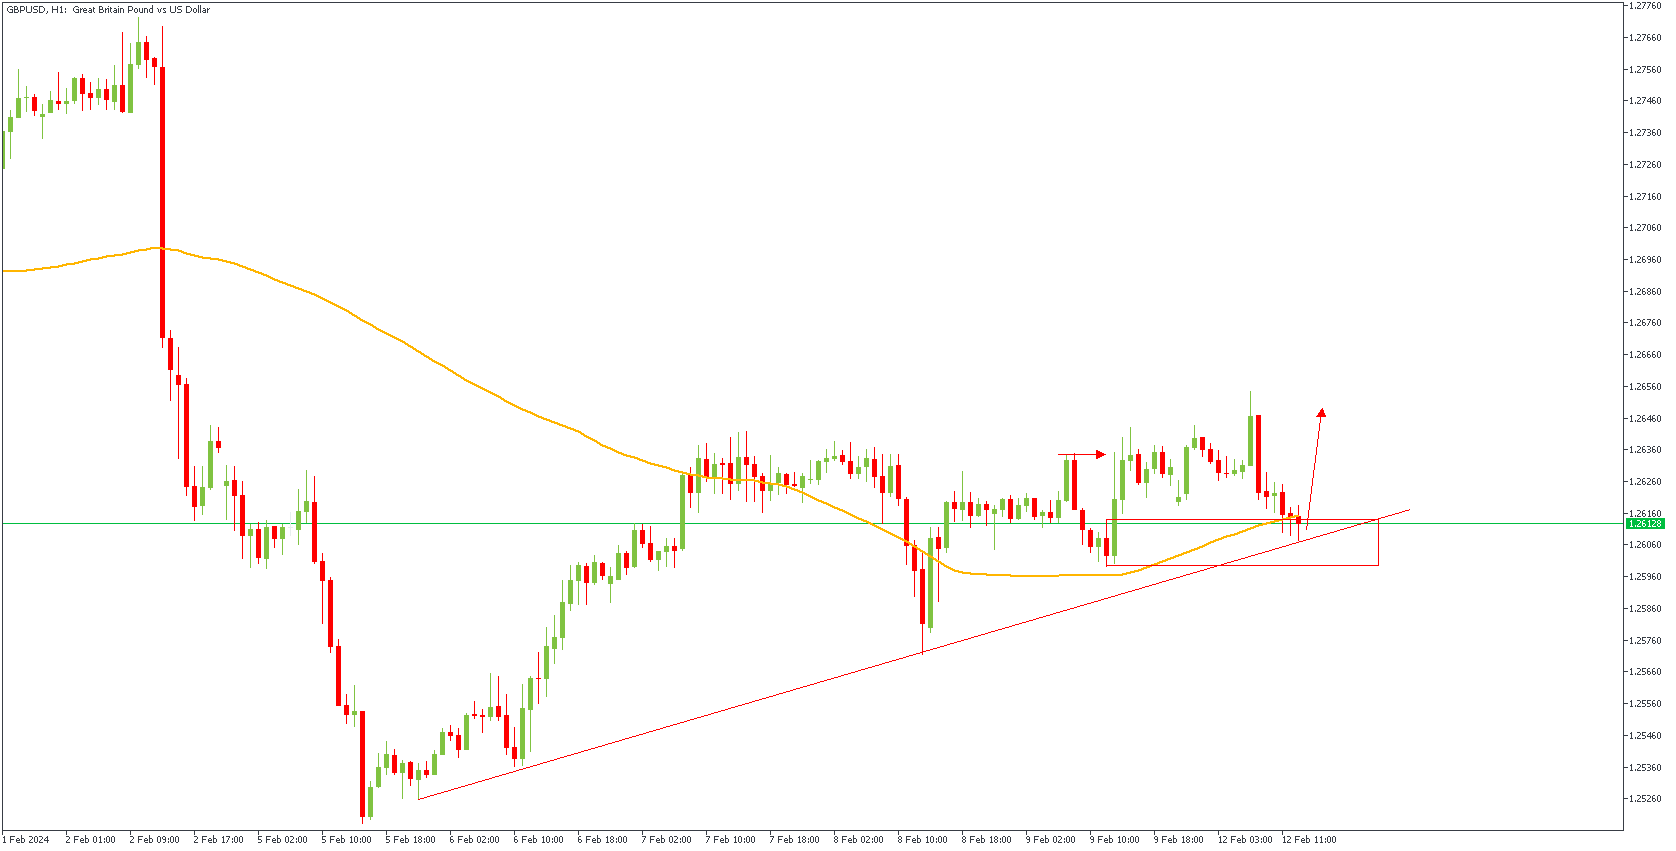
GBPUSD - H1 Timeframe
In a similar manner to what we already analyzed on the EURUSD chart, the hourly timeframe chart of GBPUSD is also trading within the demand zone at the moment with crucial support from the trendline, 100-period moving average, and the demand zone as well.
Analyst’s Expectations:
- Direction: Bullish
- Target: 1.26456
- Invalidation: 1.25989
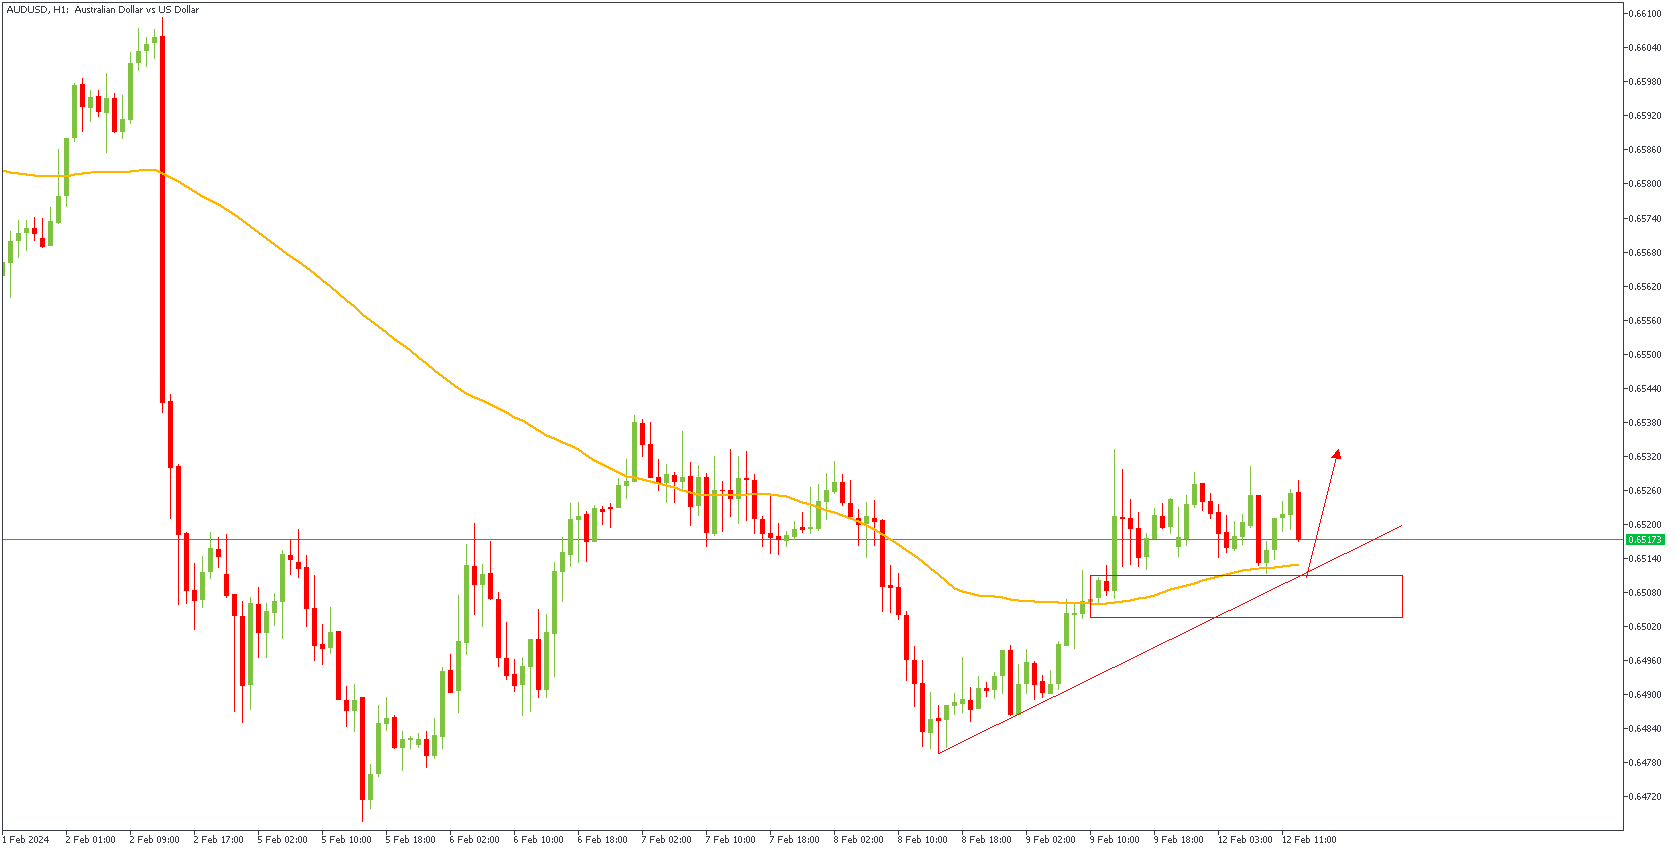
AUDUSD - H1 Timeframe
AUDUSD is in alignment with the views on GBPUSD and EURUSD as afore-mentioned. I see the likelihood of price bouncing off the trendline support, moving average support, and the demand zone.
Analyst’s Expectations:
- Direction: Bullish
- Target: 0.65270
- Invalidation: 0.65032
CONCLUSION
The trading of CFDs comes at a risk. Thus, to succeed, you have to manage risks properly. To avoid costly mistakes while you look to trade these opportunities, be sure to do your due diligence and manage your risk appropriately.
Where Will Bitcoin’s New Growth Momentum End?
Market picture
The crypto market continues its impressive growth, rising over 3.5% in 24 hours to $1.87 trillion. Having broken through its January peak, the market is now at its highest level since April 2022. Confidently gaining momentum even before bitcoin halved, and with the Fed’s rate cut date still some way off, the crypto is confounding not only the pessimists but also the expectations of the cautious. This is a fertile environment for FOMO.
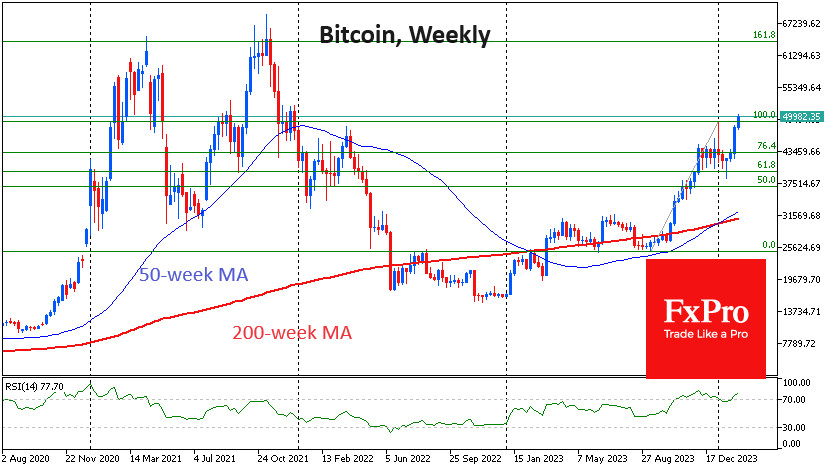
Bitcoin has breached the $50.2K mark, surpassing the psychologically important round level and the January highs set at the time of the spot ETF launch. Looking to the medium term, be prepared for a move out of the $46-52K range to mark the start of an aggressive rally.
From a longer-term perspective, we are formally seeing the beginning of the Fibonacci pattern, the target of which looks to be the $63.7K area. This is close to historical highs and is unlikely to be the end of the global rally, although a significant shakeout is expected.
News background
According to CoinShares, investment in crypto funds rose by a significant $1.116 billion last week, following inflows of $0.708B the week before. Bitcoin investments increased by $1.089B, Ethereum by $17 million, Cardano by $6M and Solana by just $0.1M.
Crypto funds have seen total inflows of $2.7B YTD, with total assets under management of $59B – the highest since the start of 2022.
The potential cash flow into Bitcoin could reach at least $52B a year, according to investment firm Mechanism Capital. At the same time, BlackRock and Fidelity estimate the potential inflow to be $150B-200B over the next three years.
Investment firm Valkуrie Funds expects the number of active spot bitcoin ETFs to be reduced to seven or eight by the end of the year due to the high cost of managing shares and low profits due to competition.
Several on-chain indicators have entered the so-called “risk zone”, which could signal the beginning of a bull market, Glassnode said. More robust net inflows into spot bitcoin ETFs have supported the market’s rally.
Fundamental changes in the supply-demand balance, along with other factors, are likely to have a positive impact on bitcoin prices post-halving, according to Grayscale.
According to a survey by JPMorgan Bank, fewer and fewer large companies believe in the potential of blockchain, with the number falling to 7% by 2024.
Bitcoin Price Exceeds Psychological Level of $50k
The last time the BTC price was above $50,000 was in December 2021, making its way to the low around $15,500 reached in November 2022.
Reaching the $50,000 level was facilitated by:
→ waiting for the halving, after which the price of Bitcoin is believed to receive a bullish impulse due to a reduction in supply;
→ the effect of the approval of a Bitcoin ETF;
→ expectation of easing of the Fed's monetary policy, which increases interest in risky assets. By the way, the Nasdaq-100 technology stock index set a historical high yesterday, breaking the level of 18,000 points.
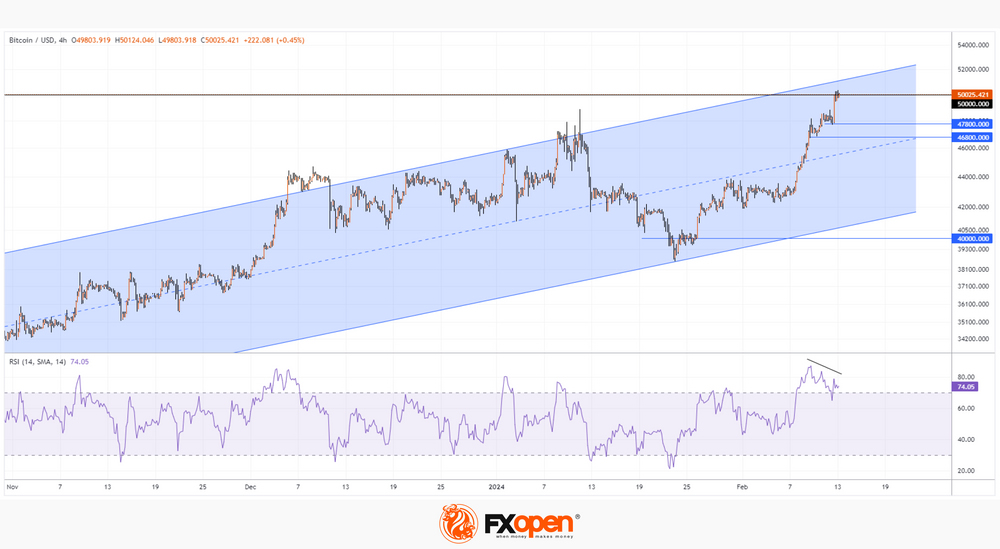
At the same time, the BTC/USD chart shows that:
→ the price of Bitcoin moves within an ascending channel (shown in blue), which dates back to last fall;
→ from the point of view of technical analysis, with this channel construction, the price of Bitcoin still has some room to rise to its upper limit.
However, please note that:
→ the widely known crypto fear and greed index has a value of 79 out of 100, indicating extreme greed;
→ the RSI indicator is in the overbought zone and is forming a bearish divergence pattern, which is a sign of weakening buying pressure;
→ exceeding the psychological level can result in a false breakout, as was the case with a short-term decline in the price of Bitcoin below the support level of 40,000.
Considering the above arguments, there is reason to believe that if the Bitcoin rally continues, it may soon be replaced by a correction to allow the market to “blow off steam” at least in the short term.
FXOpen offers the world's most popular cryptocurrency CFDs*, including Bitcoin and Ethereum. Floating spreads, 1:2 leverage — at your service. Open your trading account now or learn more about crypto CFD trading with FXOpen.
*At FXOpen UK and FXOpen AU, Cryptocurrency CFDs are only available for trading by those clients categorised as Professional clients under FCA Rules and Professional clients under ASIC Rules respectively. They are not available for trading by Retail clients.
This article represents the opinion of the Companies operating under the FXOpen brand only. It is not to be construed as an offer, solicitation, or recommendation with respect to products and services provided by the Companies operating under the FXOpen brand, nor is it to be considered financial advice.
USDCHF Picks Up Steam, But Caution Needed
- USDCHF speeds up, approaches crucial zone
- Overbought signals detected
- Important resistance at 0.8888
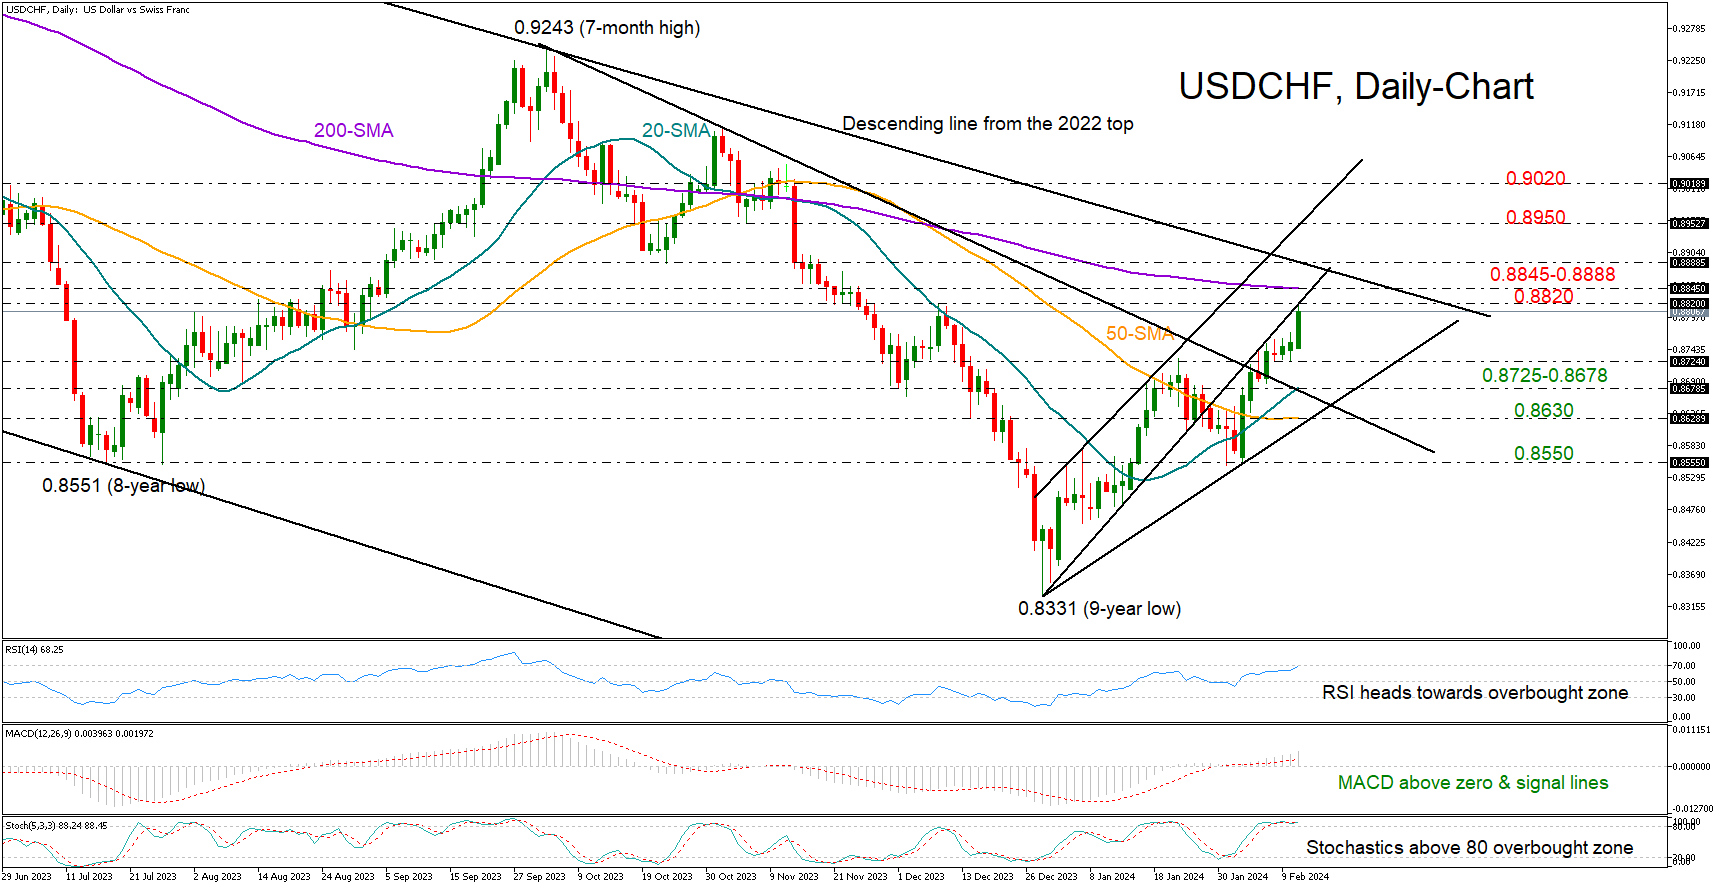
USDCHF gained significant positive momentum during the early European trading hours on Tuesday after a couple of weak sessions, extending its short-term uptrend from December’s low to 0.8816.
Despite the current euphoria in the market, traders will have to be prepared for a potential downside correction as the price is testing the support-turned-to-resistance trendline near December’s high. The 200-day simple moving average (SMA) at 0.8845 and the tentative long-term descending trendline from the 2022 top at 0.8888 are also in the neighborhood.
The RSI and the stochastic oscillator are already near overbought levels. Hence, if upside pressures fade out immediately, the price may reverse lower to seek support near the 0.8725 constraining zone. A break lower could stall around the 20-day SMA and the descending trendline from the 2023 high at 0.8678, while deeper, the decline could stabilize near the 50-day SMA and the tentative ascending trendline from the December low at 0.8630. Failure to hold there could bolster selling appetite towards 0.8550.
Should the pair find enough buyers to cross above the 0.8880 threshold, the uptrend could strengthen towards the 2024 resistance line at 0.8950. Then, the bulls may push again for a close above the 0.9020 bar.
In brief, USDCHF is not out of the woods yet, despite its latest acceleration. Traders would like to see a continuation above 0.8888 to increase their buying orders.
USDJPY Bulls Take Control, But It Could be a Trap
- USDJPY rises but trades within a bearish pattern
- Resistance expected around 149.70-150.00
- US CPI inflation data due for release at 13:30 GMT
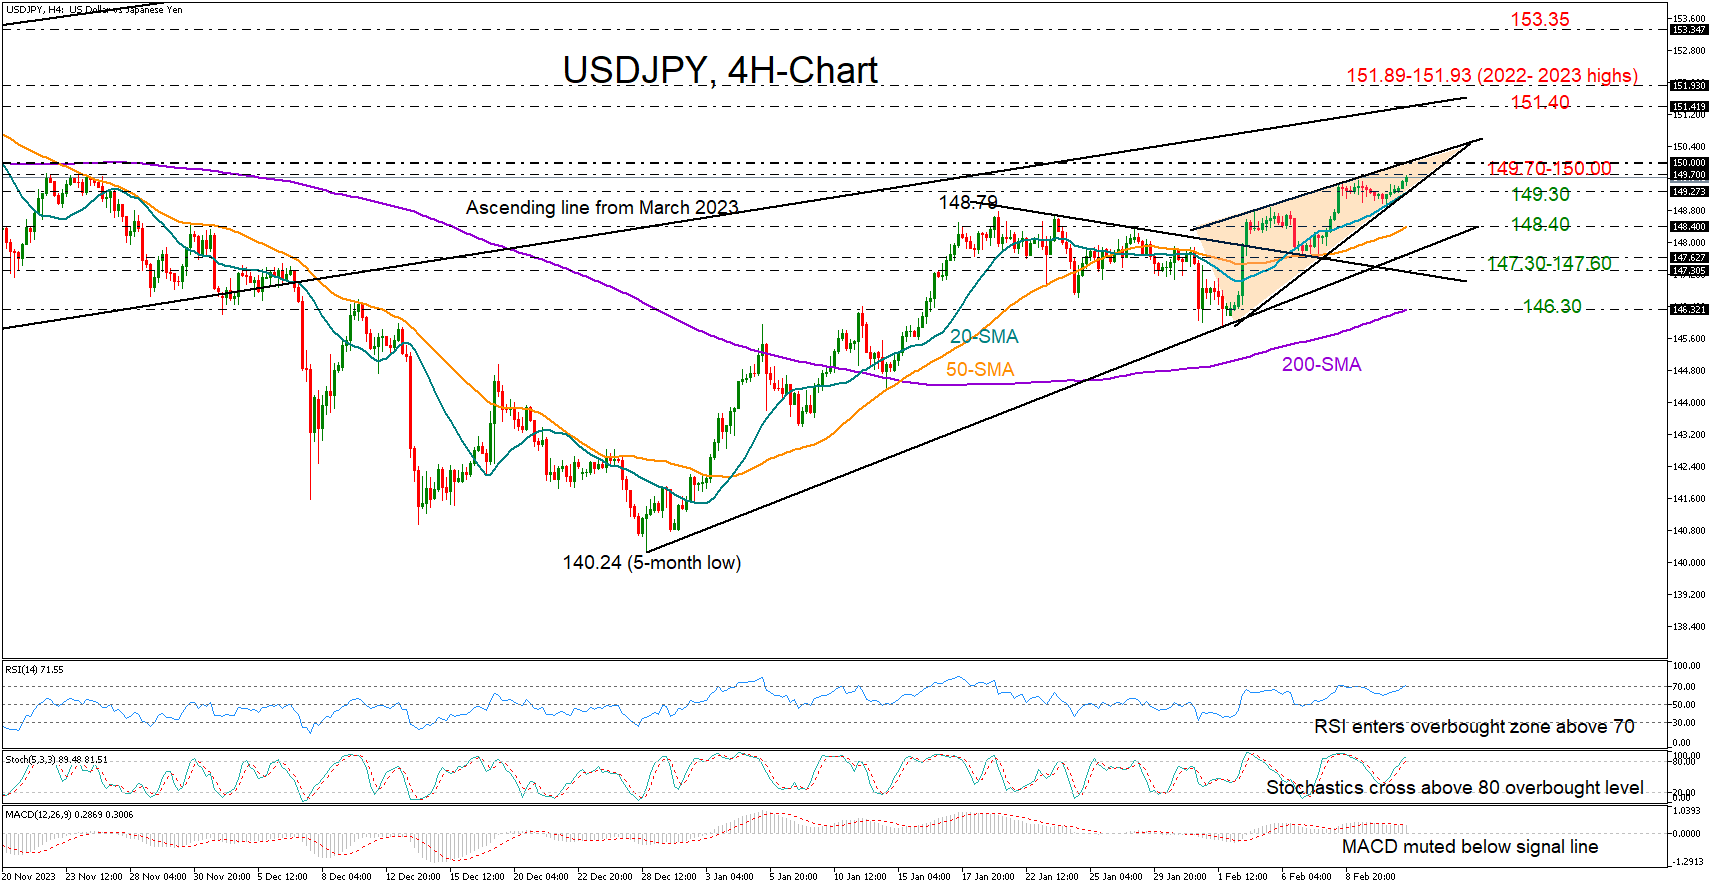
USDJPY turned green after touching its 20-period simple moving average (SMA) in the four-hour chart, rising gradually to a new high of 149.64 on Tuesday and closer to November’s resistance zone ahead of the US CPI inflation data.
February’s trading has transformed into a rising wedge pattern, which is theoretically a signal of a potential bearish reversal. The RSI and the stochastic oscillator are sending a cautious message too as they enter the overbought territory, suggesting upside forces might fade out soon. Note that the MACD has shown no improvement yet, remaining muted below its red signal line.
A decisive close above 149.70-150.00 could eliminate downside risks, boosting the price up to the 151.40 region, where the ascending line from March 2023 is placed. November’s peak of 151.89 and the 2022 top of 151.93 could be the next challenge before the bulls target the 153.35 constraining zone taken from the summer of 1990.
Alternatively, a close below the triangle and the 20-period SMA at 149.30 could trigger a decline towards the 50-period SMA at 148.40. Even lower, the pair may attempt to rebound somewhere within the 147.30-147.60 trendline region. If not, the bears could aggressively squeeze the pair towards the 200-period SMA at 146.30.
All in all, USDJPY continues to face a risky technical picture despite its latest upturn. A durable extension above the 149.70-150.00 region could postpone selling activities.
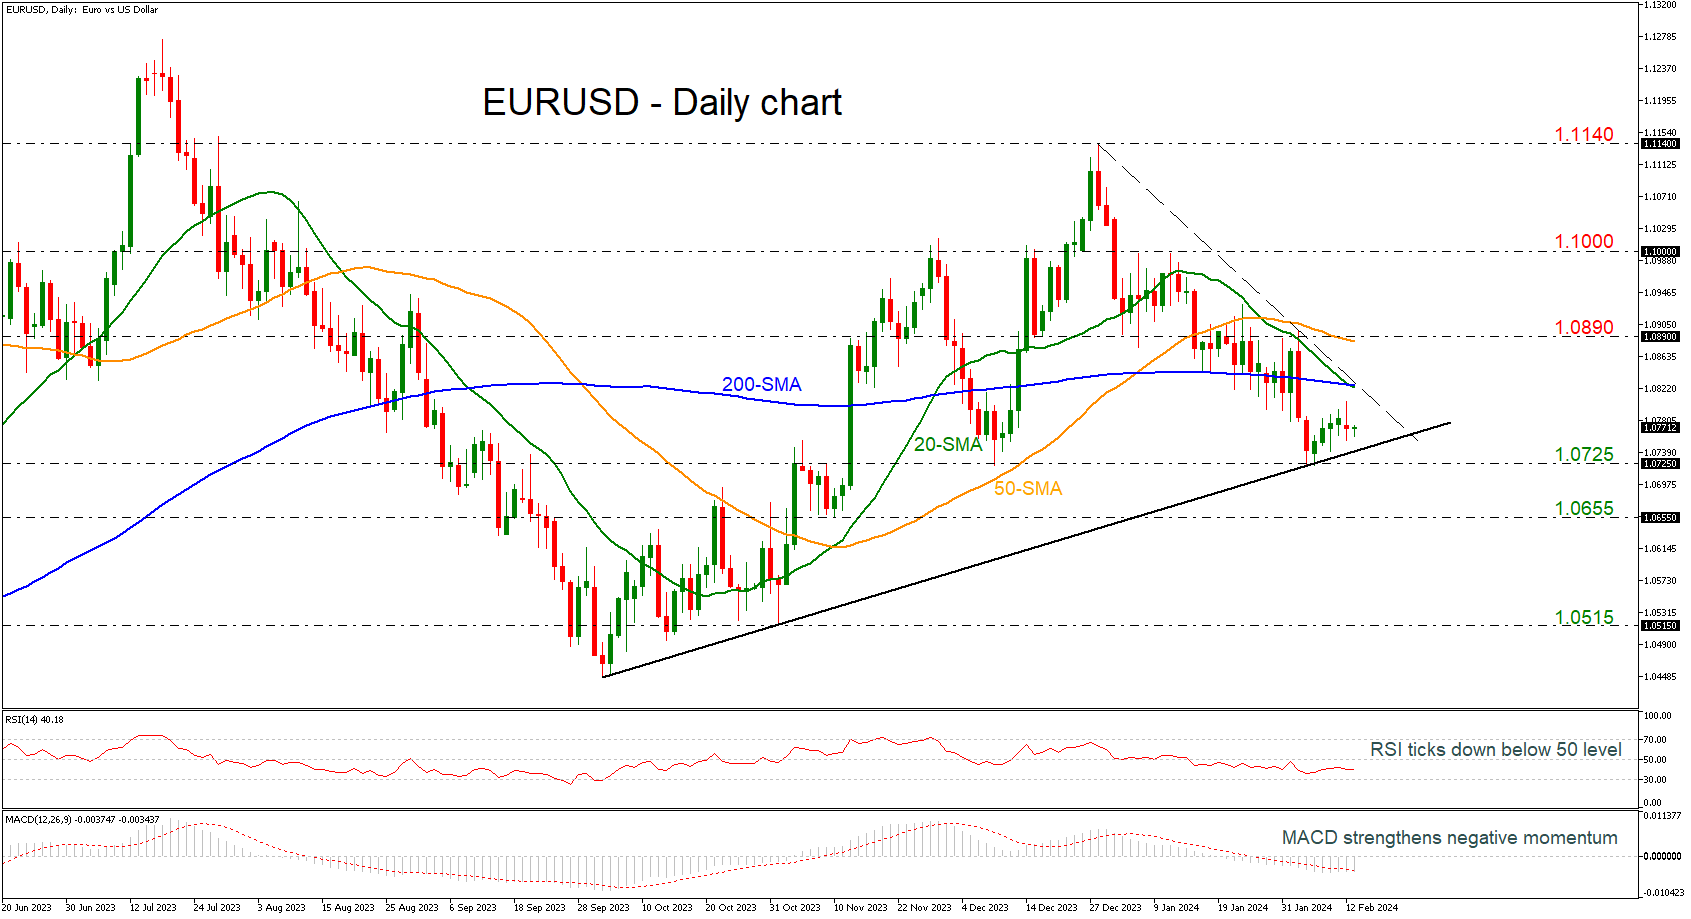
EURUSD Loses Steam After Bounce Off 1.0725
- EURUSD holds beneath downtrend line in short-term
- 20- and 200-day SMAs post death cross
- Long-term view is still bullish
EURUSD is struggling to continue the rebound that started from the 1.0725 support level and the medium-term ascending trend line. Currently, the market is losing momentum indicating a potential downside movement again.
The 20-day and 200-day simple moving averages (SMAs) are on the verge of forming a death cross, confirming a decline. Moreover, the RSI indicator is currently pointing south below the neutral threshold of 50, while the MACD is showing a continuation of its bearish pattern below both its trigger and zero lines.
If the price movement were to reverse, immediate support could once more be found at 1.0725. Steeper decreases could test the 1.0655 barrier serves as an additional important line ahead of the 1.0515 barrier, achieved on November 1.
In the upward direction, the bearish intersection of the SMAs at 1.0830, which coincides with the short-term descending trend line, presents immediate resistance. Beyond that point, the 50-day SMA at 1.0890 emerges as the subsequent significant obstacle to monitor. With a higher run, the 1.1000 round number might put a stop to bullish moves.
Summarizing, in the near-term EURUSD structure is negative; nevertheless, the pair is establishing above the uptrend line over the medium term and any climbs above 1.1000 could endorse the longer-term bullish view.
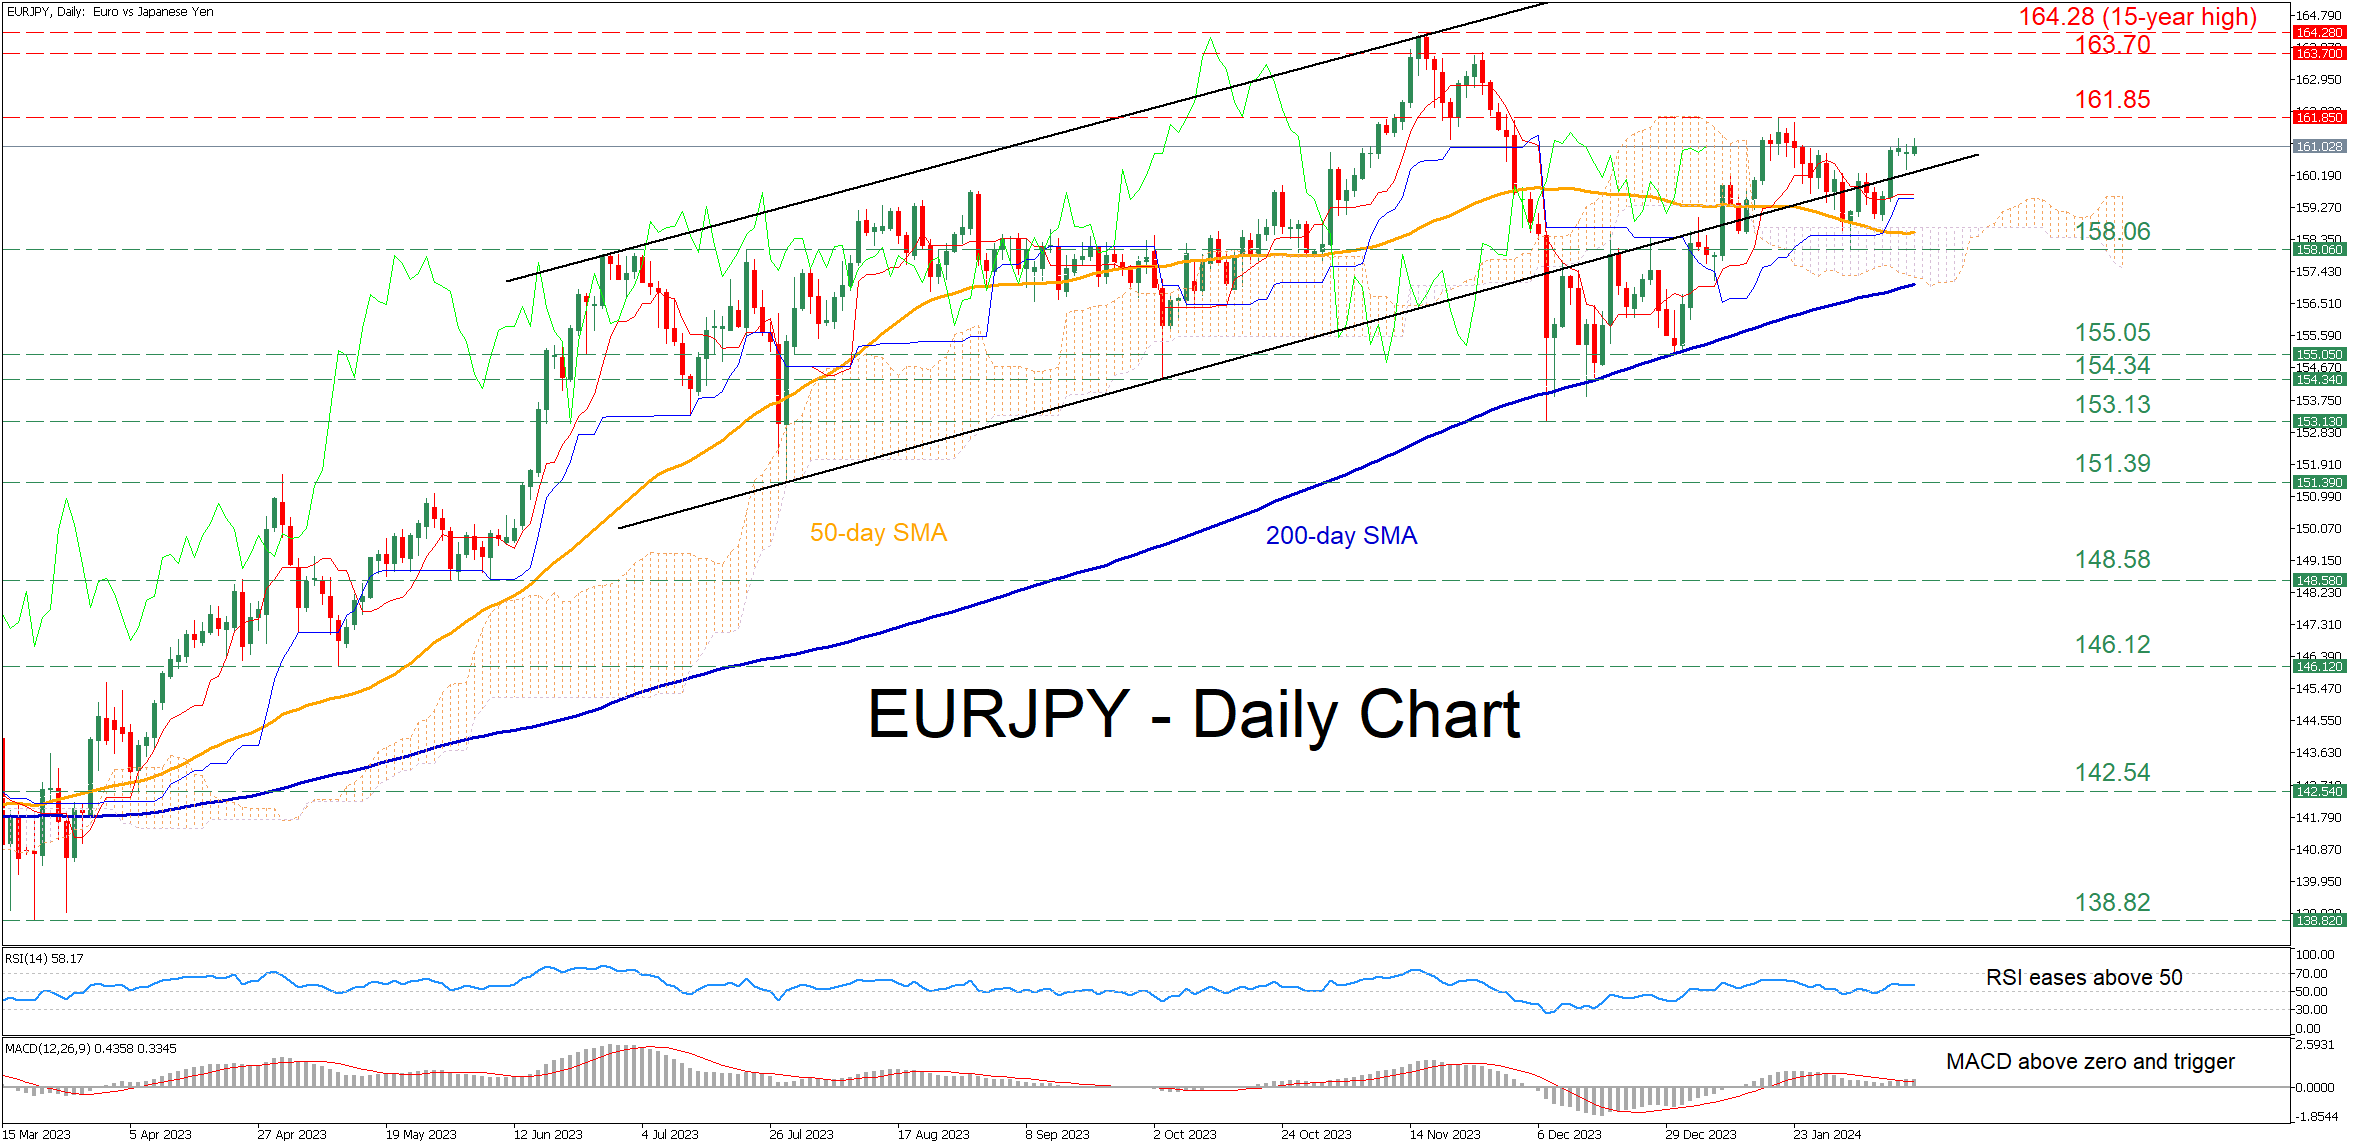
EURJPY Re-enters Bullish Channel
- EURJPY edges higher after 50-day SMA prevents decline
- Jumps back within its bullish channel in place since June
- Momentum indicators turn positive
EURJPY had been sliding lower in the short term, following its rejection at 161.85 in late January. Nevertheless, the pair managed to quickly recoup most of its losses after the 50-day simple moving average (SMA) curbed its downside, re-entering its medium-term bullish channel.
Given that both the RSI and MACD are within their positive zones, the price may revisit the January high of 161.85. Should that barricade fail, the spotlight could turn to the November resistance of 163.70. A break above that area could pave the way for the 15-year peak of 164.28.
Alternatively, if the rebound falters and the pair drops back below its upward sloping channel, the February support of 158.06 could act as the first line of defence. Further declines could then come to a halt at the January low of 155.05 ahead of the October support of 154.34. Even lower, the December bottom of 153.13 could provide downside protection.
In brief, EURJPY has been on track to erase the recent pullback after finding its feet at the 158.06 mark. Hence, a break above the recent rejection region of 161.85 could bring the multi-year highs registered in 2023 under scrutiny.