
Sample Category Title
AUD/USD Daily Report
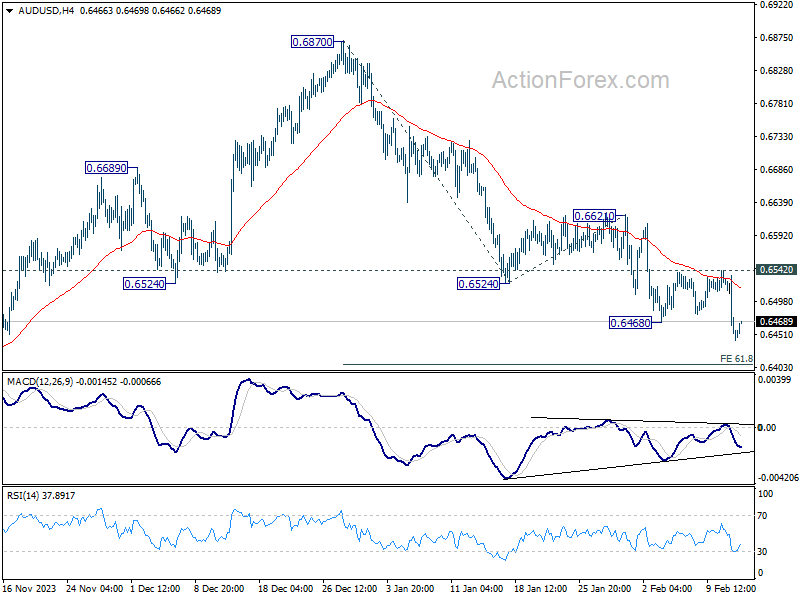
Daily Pivots: (S1) 0.6419; (P) 0.6478; (R1) 0.6514; More...
AUD/USD's decline from 0.6870 resumed by breaking 0.6468 support. Intraday bias is back on the downside for 61.8% projection of 0.6870 to 0.6524 from 0.6621 at 0.6407. Firm break there will target 100% projection at 0.6275, which is close to 0.6269 support. On the upside, 0.6542 resistance is needed to indicate short term bottoming. Otherwise, outlook will stay bearish in case of recovery.
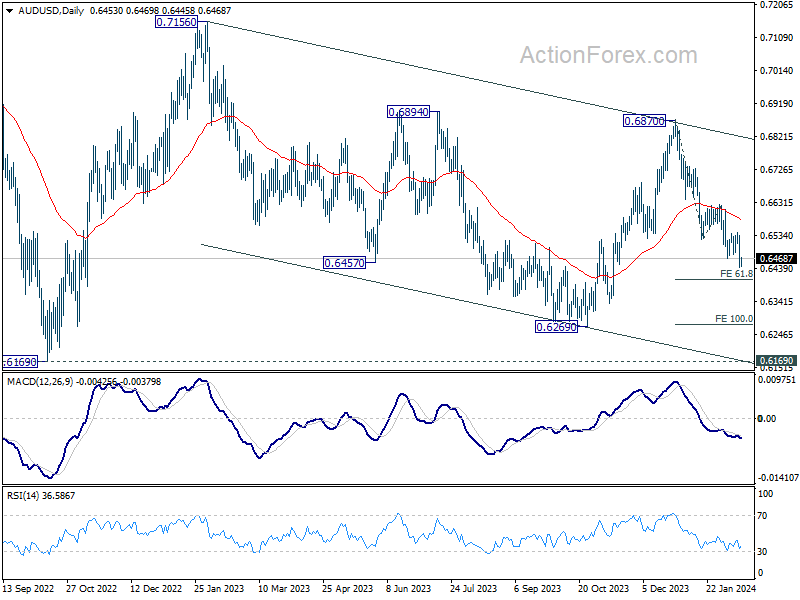
In the bigger picture, price actions from 0.6169 (2022 low) are seen as a medium term corrective pattern to the down trend from 0.8006 (2021 high). Fall from 0.7156 (2023 high) is seen as the second leg, which might still be in progress. Overall, sideway trading could continue in range of 0.6169/7156 for some more time. But as long as 0.7156 holds, an eventual downside breakout would be mildly in favor.
Eyes on UK Inflation While Dollar Dominance Continues
Dollar maintains its position as the week's top performer so far, following notable upside breakouts, while Asian markets remain relatively quiet. Without major economic releases from US today, the greenback could have a breather first. However, attention is set to return later in the week with the release of retail sales and the University of Michigan consumer sentiment index, which could reinvigorate the Dollar's rally.
On the other hand, Sterling is taking center stage for now. As the week's second strongest currency at this point, the Pound showed remarkable resilience even in the face of Dollar's strength. Investors and market analysts alike are keenly awaiting today's UK inflation data, which could either reinforce BoE's hesitation to lower interest rates. Any unexpected upward surprise in inflation might not only affirm the BoE's current stance but also spur additional Sterling rally, especially in crosses.
Across the forex markets, the Swiss Franc endures as the weakest link for the week, following the sharp downturn triggered by less-than-stellar CPI figures released yesterday. New Zealand and Australian Dollars are also under pressure, dampened by mild retreat in risk appetite. Meanwhile, Euro claims the spot as the third strongest currency, while Yen and Canadian Dollar are mixed.
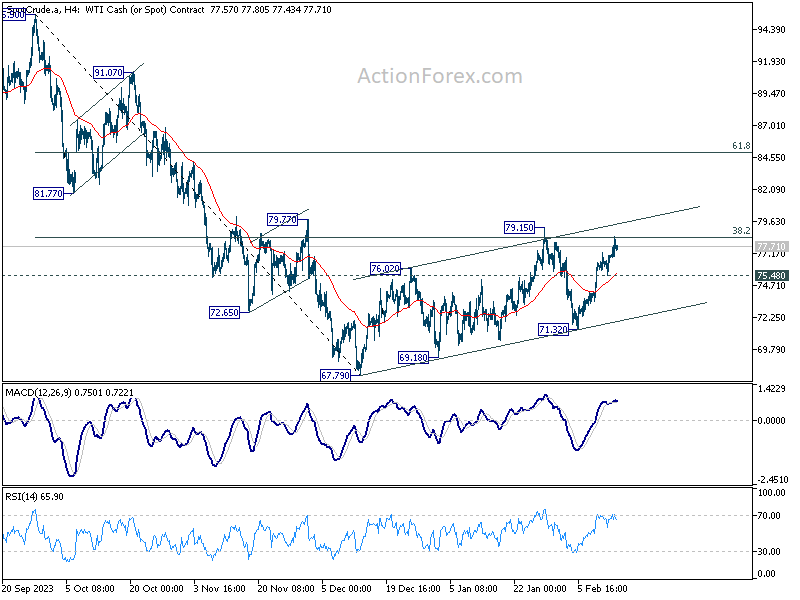
Technically, WTI crude oil is back pressing 38.2% retracement of 95.50 to 67.90 at 78.37 as the rebound from 71.32. extends this week. Strong resistance is still expected between in below 80 psychological level to limit upside. Break of 75.48 will turn bias back tot he downside for 71.32 support. However, sustained break 80 could prompt upside acceleration to 61.8% retracement at 84.91 and above. If materializes, that would be rather bad for global inflation outlook.
In Asia, at the time of writing, Nikkei is down -0.46%. Hong Kong HSI is up 0.50%. Singapore Strait times is down -0.35%. Japan 10-year JGB yield is up 0.0244 at 0.754. Overnight, DOW fell -1.35%. S&P 500 fell -1.37%. NASDAQ fell -1.80%. 10-year yield rose 0.1444 to 4.316.
DOW plunges most in nearly a year, yet outlook not gloom
DOW posted its biggest daily decline in nearly a year overnight, rattled by the latest US inflation figures that unexpectedly showcased a slowdown in disinflation. This development has cast serious doubts over Fed's ability to start cutting interest rates cut in May, a move that was previously anticipated by investors.
The changing market expectations, now leaning towards a 65% probability of Fed maintaining rates in May, mark a stark shift from just a day prior, when the odds stood at around 40%.
The upcoming PCE inflation data, set for release on February 29, holds the potential to further cement these expectations if it mirrors the persistence in core inflation.
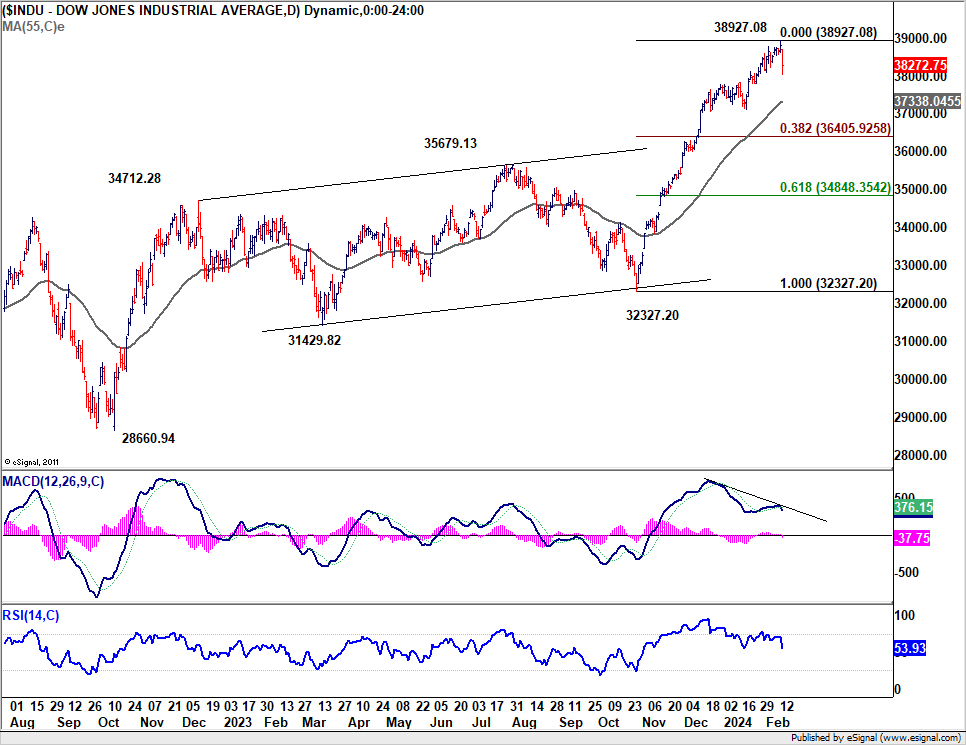
Technically, a short term top should be formed at 38927.08, but it's not a disaster yet. Price actions from there are currently seen as developing in to a near term consolidation pattern. As long as 55 D EMA (now at 37338.04) holds, this consolidation should be relatively brief. Another rise through 38927.08 towards 40k psychological level is expected sooner rather than later.
However, considering bearish divergence condition in D MACD, firm break of 55 D EMA should trigger deeper correction to 38.2% retracement of 32327.20 to 38927.08 at 36405.92, and possibly below.
US 10-year yield breaks key near term fibonacci resistance
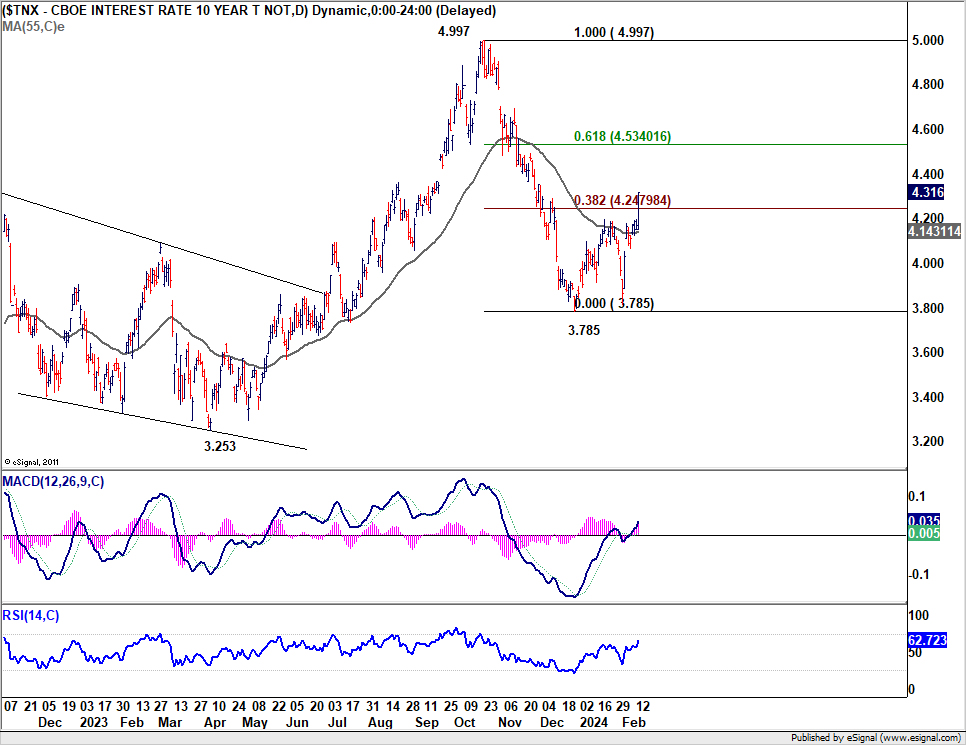
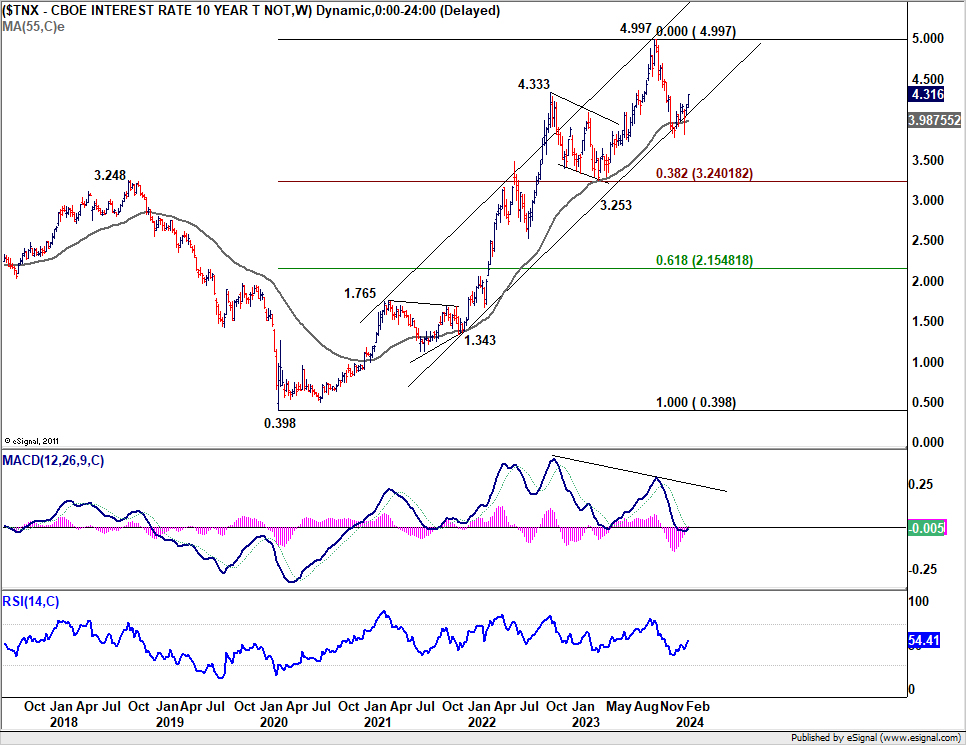
10-year yield rose 0.144 overnight to close at 4.316, breaking above 38.2% retracement of 4.997 to 3.785 at 4.247. A more important perspective is that strong support was seen from 55 W EMA and long term channel, as seen in the weekly chart. Combined, the development suggests that fall from 4.997 has completed at 3.785 already. Further rally is now expected as long as 55 D EMA (now at 4.143 holds), to 61.8% retracement at 4.534 and possibly above.
Nevertheless, there is no change in the view that price actions from 4.997 are developing into a medium term corrective pattern. Rise from 3.785 could be seen as the second leg. Upside should be capped by the 4.997 to bring the third leg down to 3.785 and below.
This technical scenario aligns with the prevailing expectation that Fed's next move will be a rate cut. The duration and extent of the current rebound in 10-year yield will depend on when Fed decides to initiate policy relaxation. In essence, the more Fed postpones its initial rate reduction, the more prolonged and substantial the climb in 10-year yield could be. Still, this scenario would not push yield beyond 5% handle. However, decisive break of 5% would signal a significant shift in the underlying economic and monetary policy outlook and necessitate reevaluation of these expectations.
UK CPI data key to extending Sterling's gains
Sterling has shown marked strength this week, with upcoming UK January inflation data eagerly awaited as potential catalyst for further gains. CPI is expected to edge up from 4.0% yoy to 4.1% yoy, continuing its rebound from the low of 3.9% set in November. Core CPI is also expected to rise from 5.1% yoy to 5.2% yoy.
Some analysts suggest that these projected upticks may stem largely from base effects, yet the focal point remains on the path of services inflation, which has shown a gradual increase in recent months, from December's 6.4%, and November's 6.3%.
Should the inflation data come in slightly above expectations, it is unlikely to shift the majority of BoE MPC towards advocating for further rate hikes alongside members like Jonathan Haskel and Catherine Mann. However, persistent stickiness in inflation, especially within the services sector, would prompt BoE to delay any rate reductions further.
The market's reaction to this week's robust job and wage figures has shifted expectations for BoE's initial rate reduction to August. Today's CPI data, coupled with tomorrow's GDP figures, could further influence these projections.
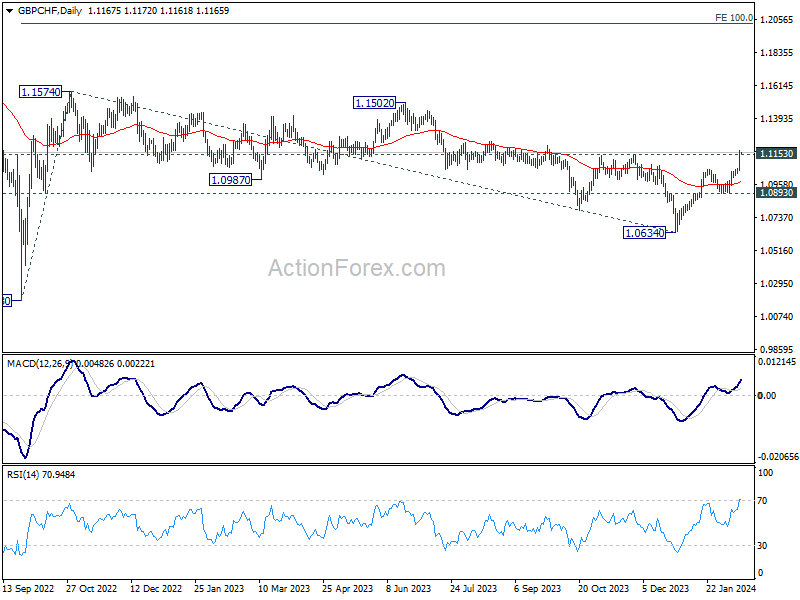
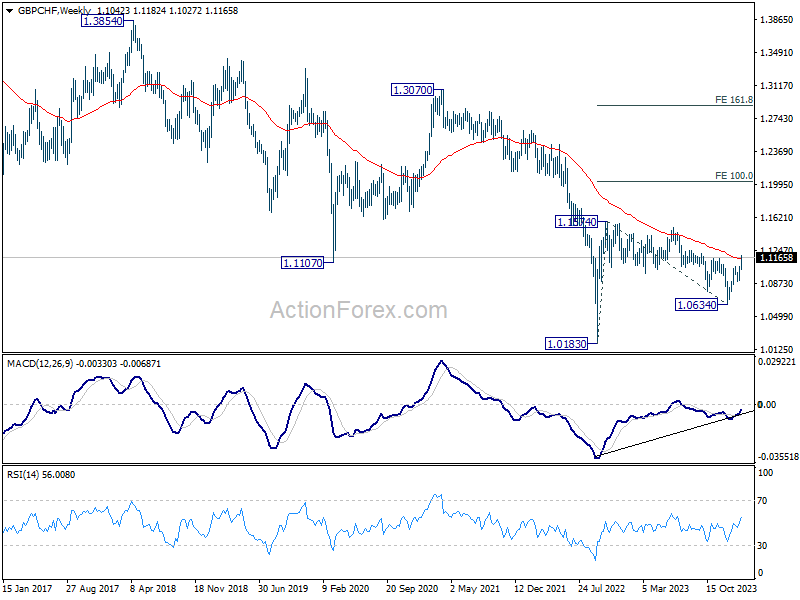
GBP/CHF's rally accelerated higher this week. Sustained trading above 1.1153 resistance and 55 W EMA (now at 1.1149) will strengthen the case that whole correction from 1.1574 has completed with three waves down to 1.0634. Rise from 1.0634 would then develop into a medium term rally, resuming the rebound from 1.0183 (2022 low), and target 100% projection of 1.018 to 1.1574 from 1.0634 at 1.2025.
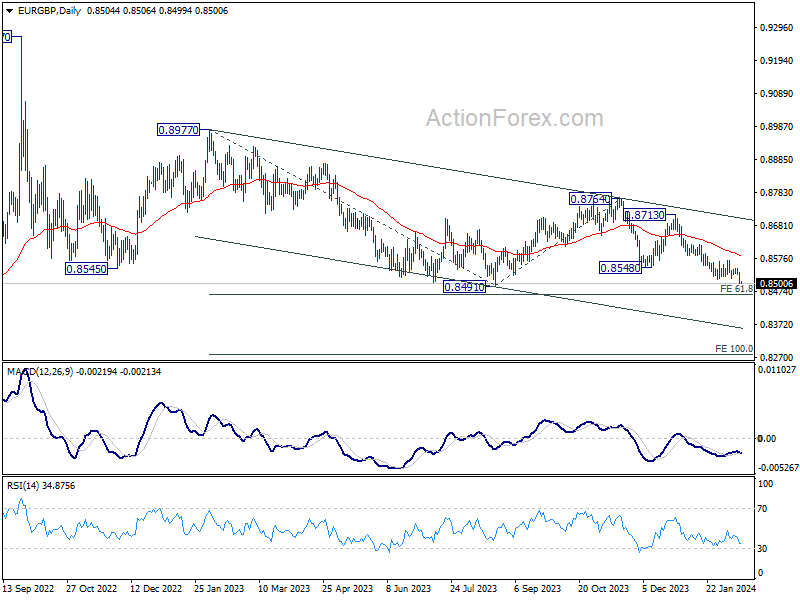
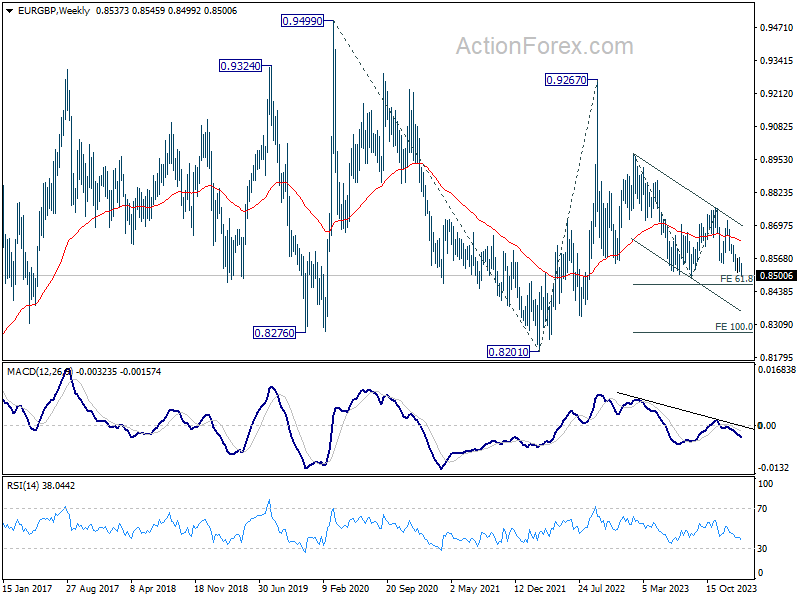
At the same time, EUR/GBP's down trend resumed and it's now on track to 61.8% projection of 0.8977 to 0.8491 from 0.8764 at 0.8464. Decisive break there could prompt downside acceleration, as fall from 0.9267 (2022 high) extends, and target 100% projection at 0.8278.
ECB's Lane signals rate cut as next monetary policy move
ECB Chief Economist Philip Lane, in a discussion with Spanish RTVE, described the disinflation progress as "very good." He added that "the next move is to cut interesting rate".
Nevertheless, the timing of such rate adjustments would be data-dependent. Also, "the number of rate cuts we make will depend on how much progress we make towards our target," he added.
In the background, there's a growing consensus around the first rate cut in the current cycle, with expectations leaning towards April or June as likely windows for action.
Looking ahead
UK CPI, PPI will be released in European session. Eurozone GDP revision and industrial production will also be published. Later in the day, US crude oil inventories will be the only feature in terms of economic data.
AUD/USD Daily Report
Daily Pivots: (S1) 0.6419; (P) 0.6478; (R1) 0.6514; More...
AUD/USD's decline from 0.6870 resumed by breaking 0.6468 support. Intraday bias is back on the downside for 61.8% projection of 0.6870 to 0.6524 from 0.6621 at 0.6407. Firm break there will target 100% projection at 0.6275, which is close to 0.6269 support. On the upside, 0.6542 resistance is needed to indicate short term bottoming. Otherwise, outlook will stay bearish in case of recovery.
In the bigger picture, price actions from 0.6169 (2022 low) are seen as a medium term corrective pattern to the down trend from 0.8006 (2021 high). Fall from 0.7156 (2023 high) is seen as the second leg, which might still be in progress. Overall, sideway trading could continue in range of 0.6169/7156 for some more time. But as long as 0.7156 holds, an eventual downside breakout would be mildly in favor.
Economic Indicators Update
| GMT | Ccy | Events | Actual | Forecast | Previous | Revised |
|---|---|---|---|---|---|---|
| 07:00 | GBP | CPI M/M Jan | -0.30% | 0.40% | ||
| 07:00 | GBP | CPI Y/Y Jan | 4.10% | 4.00% | ||
| 07:00 | GBP | Core CPI Y/Y Jan | 5.20% | 5.10% | ||
| 07:00 | GBP | RPI M/M Jan | -0.10% | 0.50% | ||
| 07:00 | GBP | RPI Y/Y Jan | 5.20% | 5.20% | ||
| 07:00 | GBP | PPI Input M/M Jan | 0.00% | -1.20% | ||
| 07:00 | GBP | PPI Input Y/Y Jan | -3.00% | -2.80% | ||
| 07:00 | GBP | PPI Output M/M Jan | -0.20% | -0.60% | ||
| 07:00 | GBP | PPI Output Y/Y Jan | -0.50% | 0.10% | ||
| 07:00 | GBP | PPI Core Output M/M Jan | 0.00% | |||
| 07:00 | GBP | PPI Core Output Y/Y Jan | 0.10% | |||
| 10:00 | EUR | Eurozone GDP Q/Q Q4 P | 0.00% | 0.00% | ||
| 10:00 | EUR | Eurozone Employment Change Q/Q Q4 P | 0.20% | 0.20% | ||
| 10:00 | EUR | Eurozone Industrial Production M/M Dec | -0.30% | -0.30% | ||
| 15:30 | USD | Crude Oil Inventories | 3.3M | 5.5M |
Technical Outlook and Review
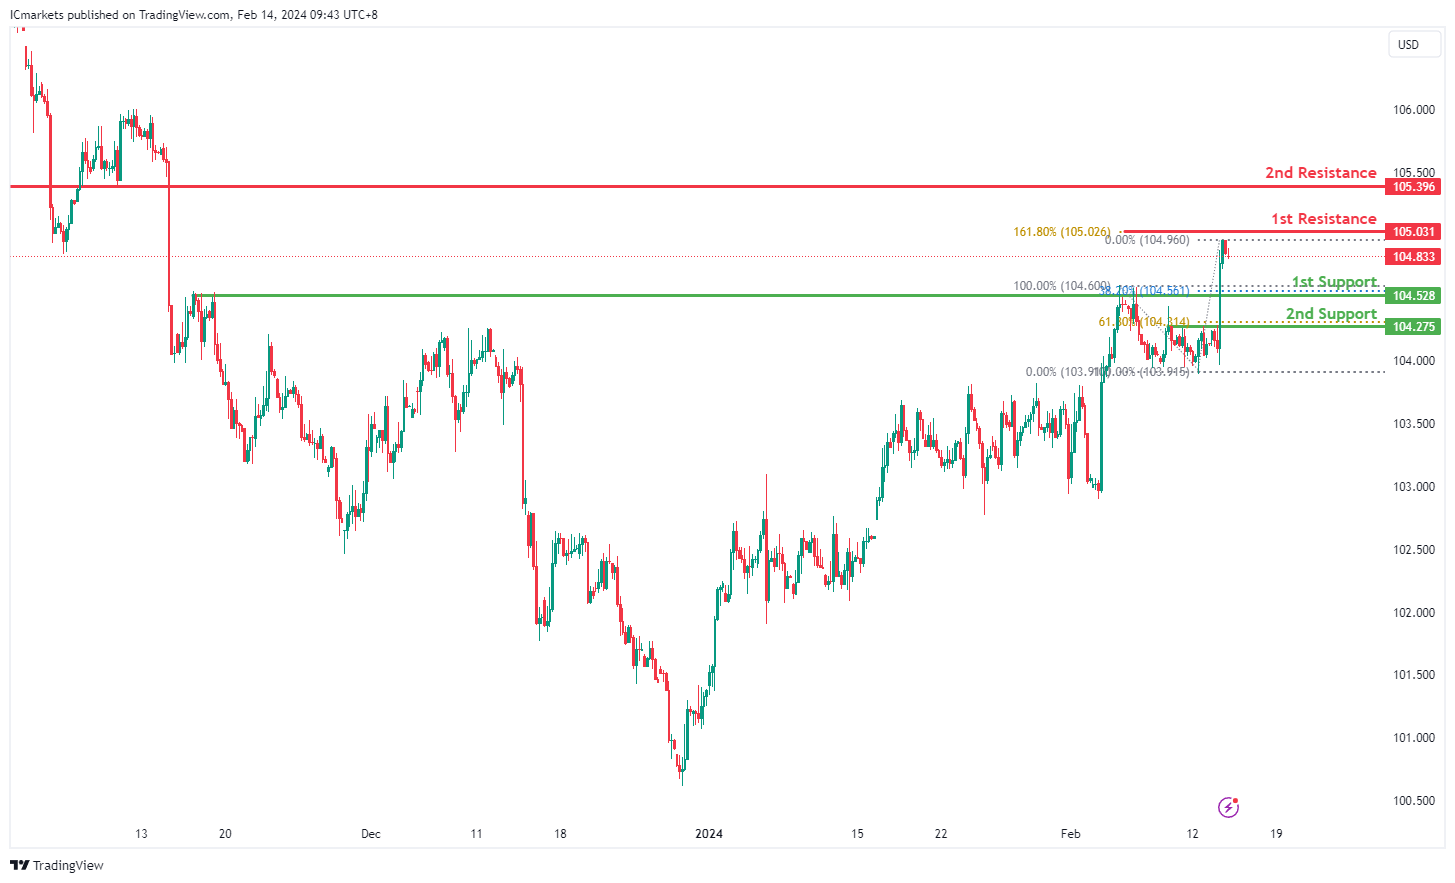
DXY:
The DXY chart currently exhibits a bearish momentum, indicating a potential continuation of the downward trend.
The 1st support level at 104.52 is identified as a pullback support, coinciding with the 38.20% Fibonacci Retracement level. This level suggests historical significance, where buyers might step in to prevent further decline.
Additionally, the 2nd support at 104.27 aligns with the 61.80% Fibonacci Retracement level, further reinforcing its importance as a potential support zone.
On the resistance side, the 1st resistance is noted at 105.03, characterized by the presence of the 161.80% Fibonacci Extension. This level signifies a historical point of potential resistance where selling pressure may intensify.
Similarly, the 2nd resistance at 105.39 is identified as a pullback resistance, indicating another area where sellers could exert pressure on the price.
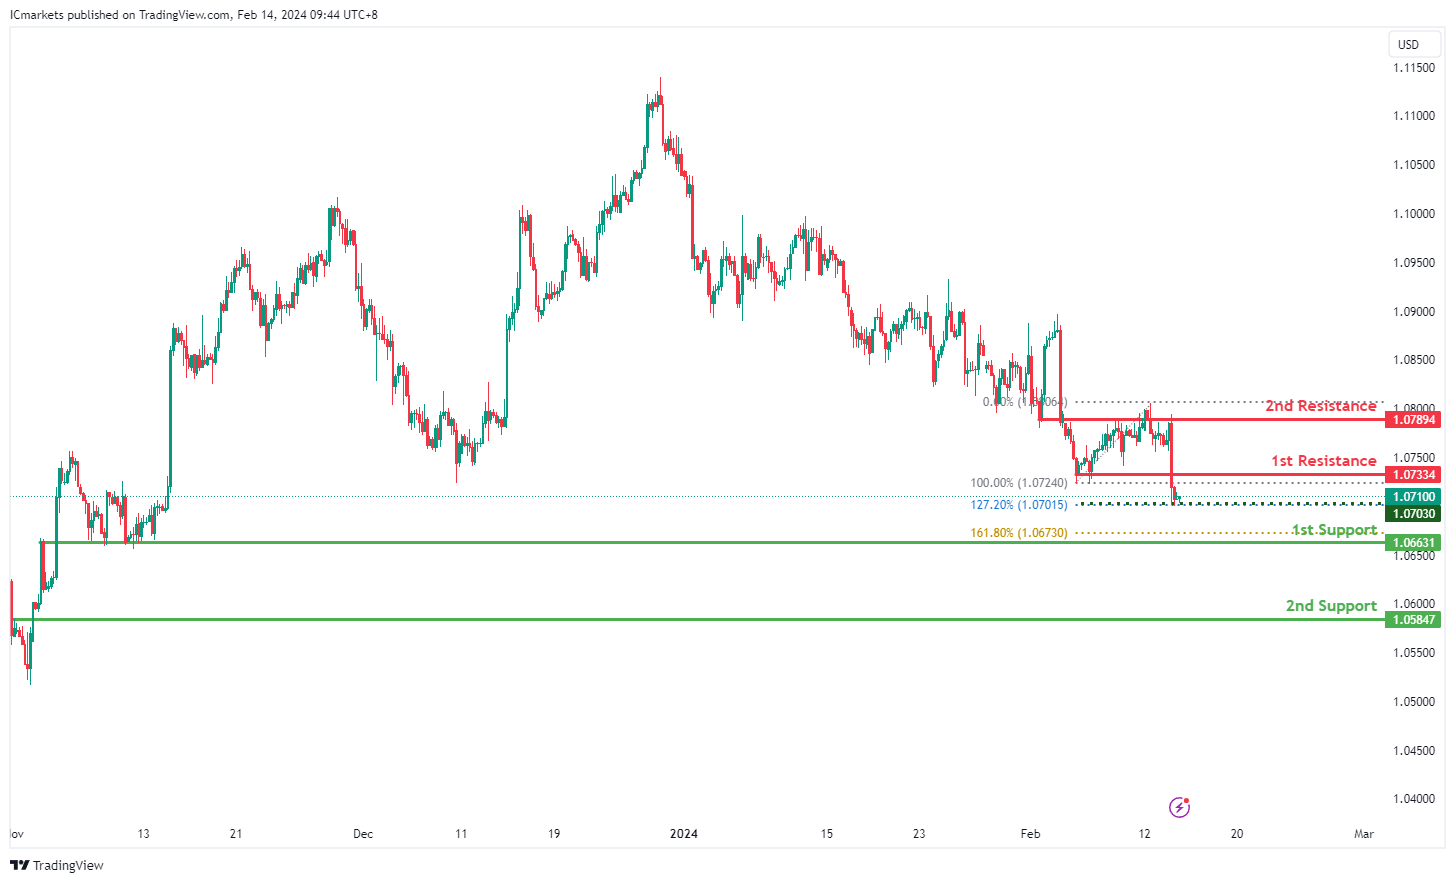
EUR/USD:
The EUR/USD chart currently demonstrates a bullish momentum, suggesting a potential upward trend.
The 1st support level is situated at 1.0663, characterized by an overlap support and coinciding with the 161.80% Fibonacci Extension level. This level indicates historical significance and potential buying interest, providing a strong foundation for a bullish bounce.
Additionally, the 2nd support at 1.0584 is identified as a pullback support, further reinforcing its importance as a potential area for buyers to step in.
On the resistance side, the 1st resistance level is noted at 1.0733, representing an overlap resistance where selling pressure may emerge.
Similarly, the 2nd resistance at 1.0789 is identified as an overlap resistance, suggesting another potential barrier to further upside movement.
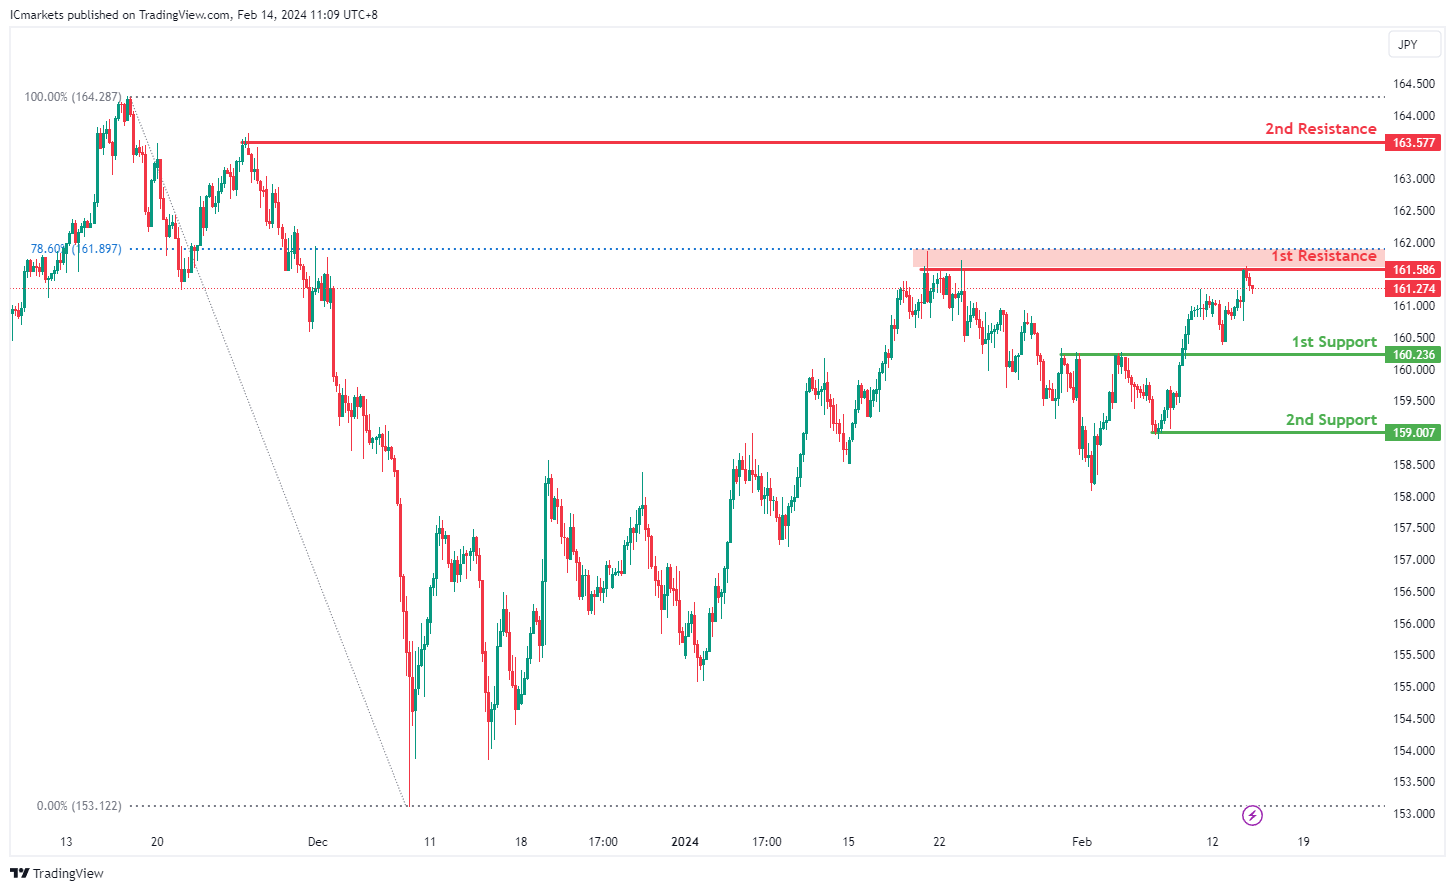
EUR/JPY:
The EUR/JPY chart currently demonstrates a bearish momentum, indicating a prevailing downward trend. Several factors contribute to this bearish sentiment, suggesting the potential for further downward movement in the price.
The 1st support level at 160.236 is considered significant as it represents a pullback support, indicating a historical level where buying interest has previously emerged. Additionally, this level aligns with the 50% Fibonacci Retracement, adding further confluence to its significance. Furthermore, the 2nd support at 159.007 is identified as a swing low support, reinforcing the potential support zone.
On the resistance side, the 1st resistance level at 161.586 is highlighted as a significant barrier where selling pressure may increase, as it coincides with a swing high resistance and the 78.60% Fibonacci Retracement level. Additionally, the 2nd resistance at 163.577 stands as another swing high resistance level, further solidifying the potential resistance zone.
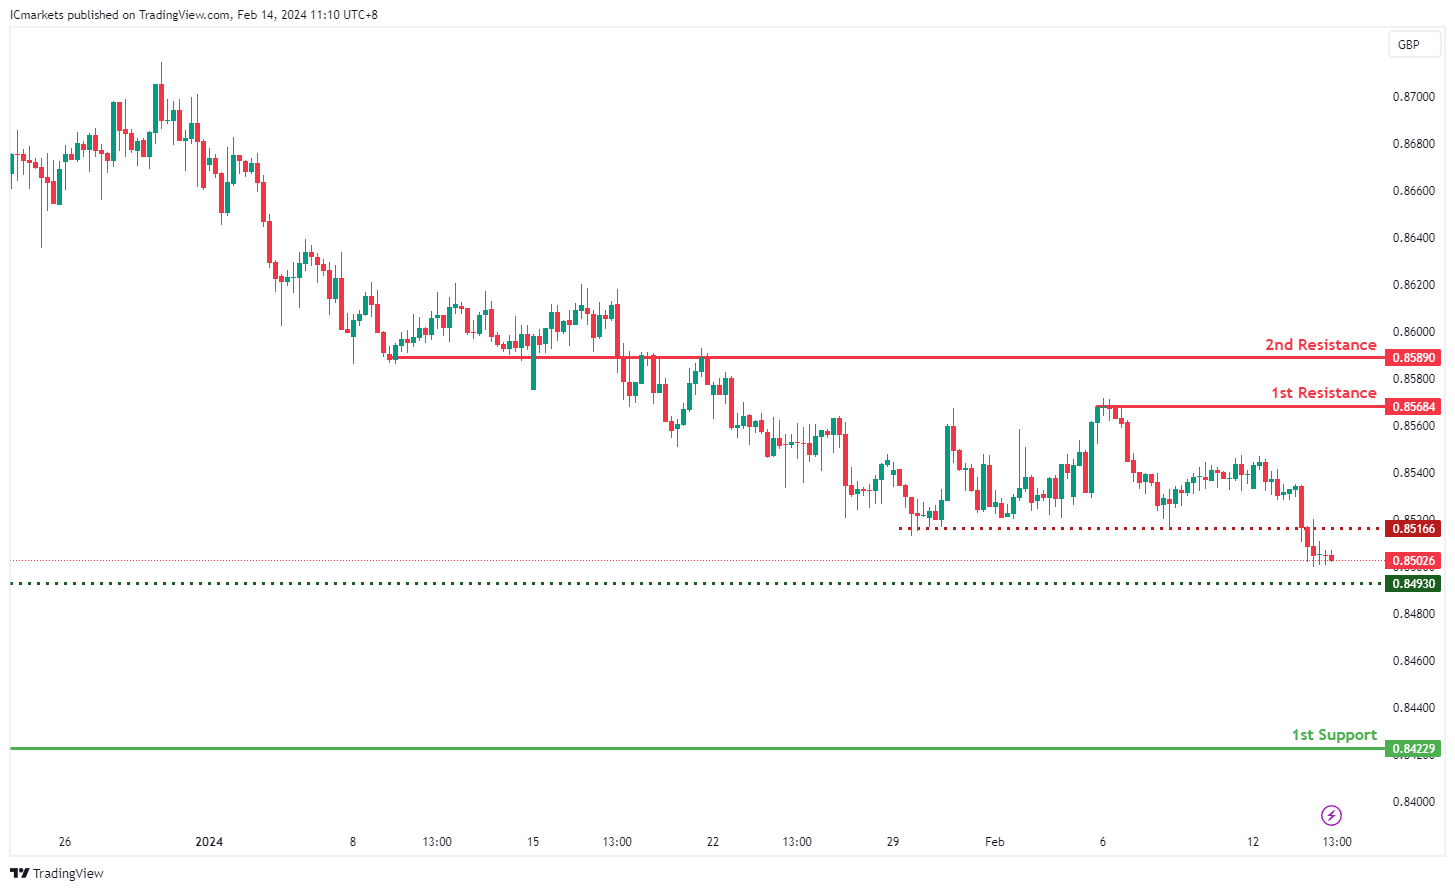
EUR/GBP:
The EUR/GBP chart currently exhibits a bearish overall momentum, suggesting a prevailing downward trend. Several factors contribute to this bearish sentiment, indicating the potential for a continued downward movement in the price.
The identified intermediate support at 0.84930 is deemed significant as it represents an overlap support level, suggesting a historical area where buying interest has previously emerged. Additionally, the 1st support level at 0.84229 coincides with a swing low support, further reinforcing its importance as a potential level where buyers may intervene.
On the resistance side, the 1st resistance level at 0.85684 is highlighted as a significant barrier where selling pressure may intensify, as it aligns with a swing high resistance. Moreover, the 2nd resistance level at 0.85890 is identified as an overlap resistance, suggesting a strong potential resistance zone.
An intermediate resistance at 0.85166 is also recognized, which aligns with an overlap resistance, providing additional reinforcement to the resistance structure.
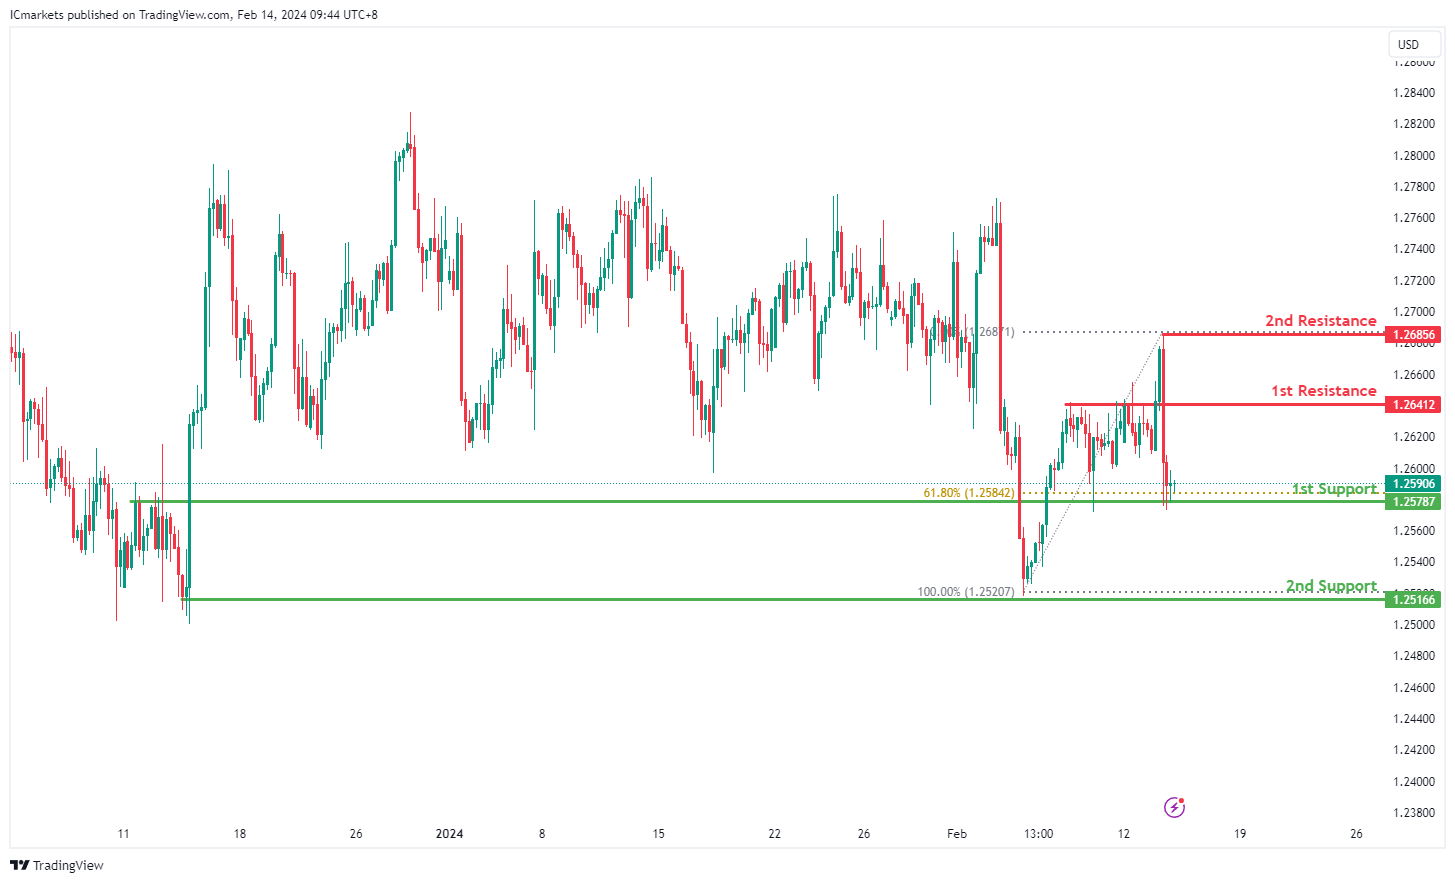
GBP/USD:
The GBP/USD chart currently indicates a bullish momentum, suggesting a potential upward trend.
The 1st support level is located at 1.2578, characterized by an overlap support and coinciding with the 61.80% Fibonacci Retracement level. This level indicates historical significance and potential buying interest, providing a strong foundation for a bullish bounce.
Additionally, the 2nd support at 1.2516 is identified as a multi-swing low support, further reinforcing its importance as a potential area for buyers to step in.
On the resistance side, the 1st resistance level is noted at 1.2641, representing a pullback resistance where selling pressure may emerge.
Similarly, the 2nd resistance at 1.2685 is identified as a swing high resistance, suggesting another potential barrier to further upside movement.
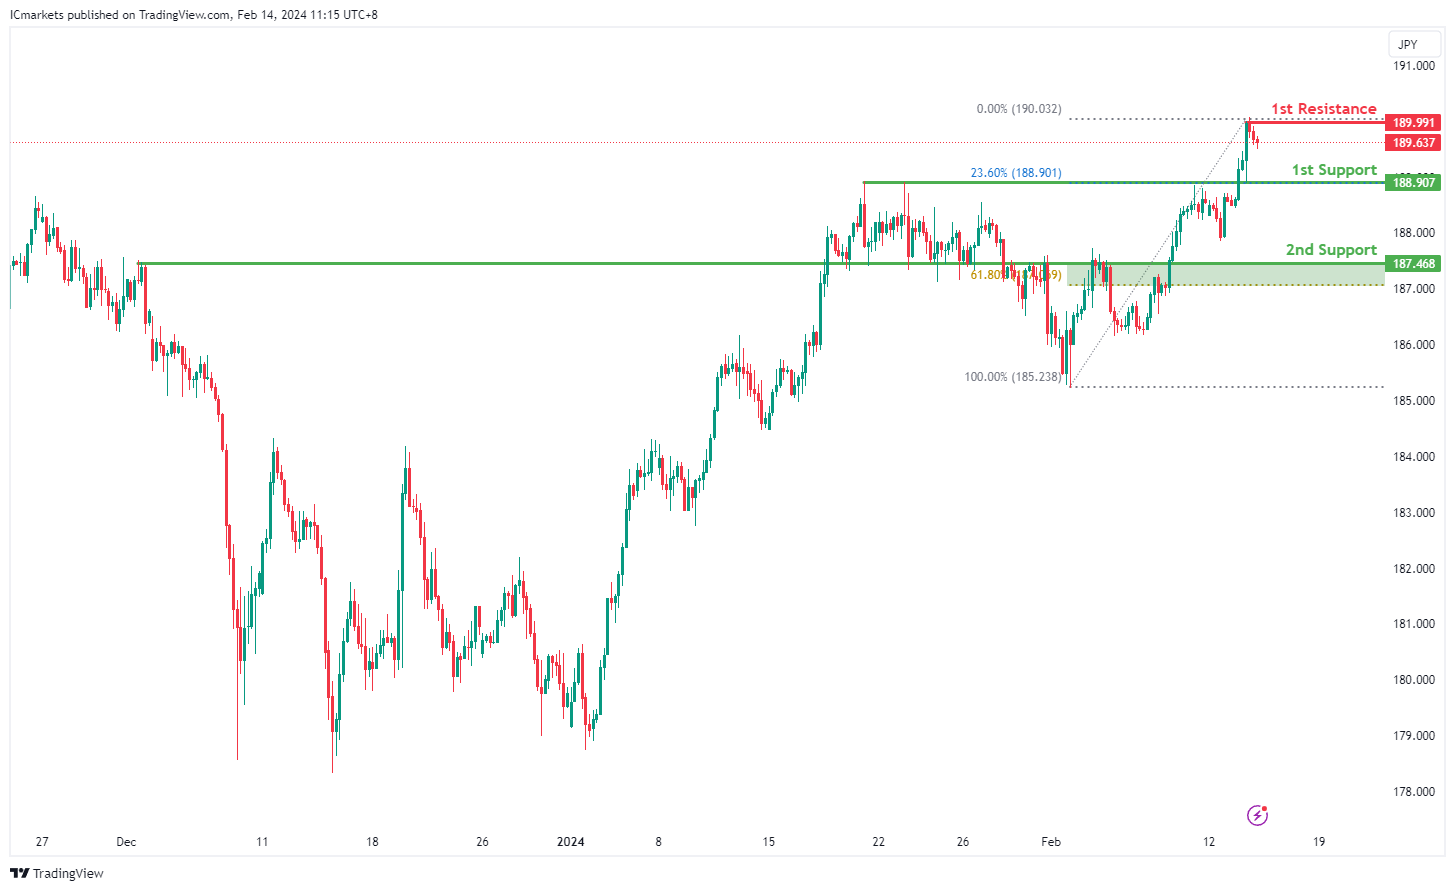
GBP/JPY:
The GBP/JPY chart currently demonstrates a bearish overall momentum, indicating a prevailing downward trend. Several factors contribute to this bearish sentiment, suggesting the potential for a continued decline in price.
The identified 1st support level at 188.907 is considered significant as it represents a pullback support, coinciding with the 23.60% Fibonacci Retracement level. This suggests a historical area where buying interest has previously emerged and aligns with a key Fibonacci level, adding to its significance. Additionally, the 2nd support level at 187.468 is identified as an overlap support, further reinforcing its importance as a potential level where buyers may intervene. This level also coincides with the 61.80% Fibonacci Retracement level, adding confluence to the support zone.
On the resistance side, the 1st resistance level at 189.991 is highlighted as a significant barrier where selling pressure may intensify. This level aligns with a swing high resistance, suggesting a historical point where selling interest has been strong.
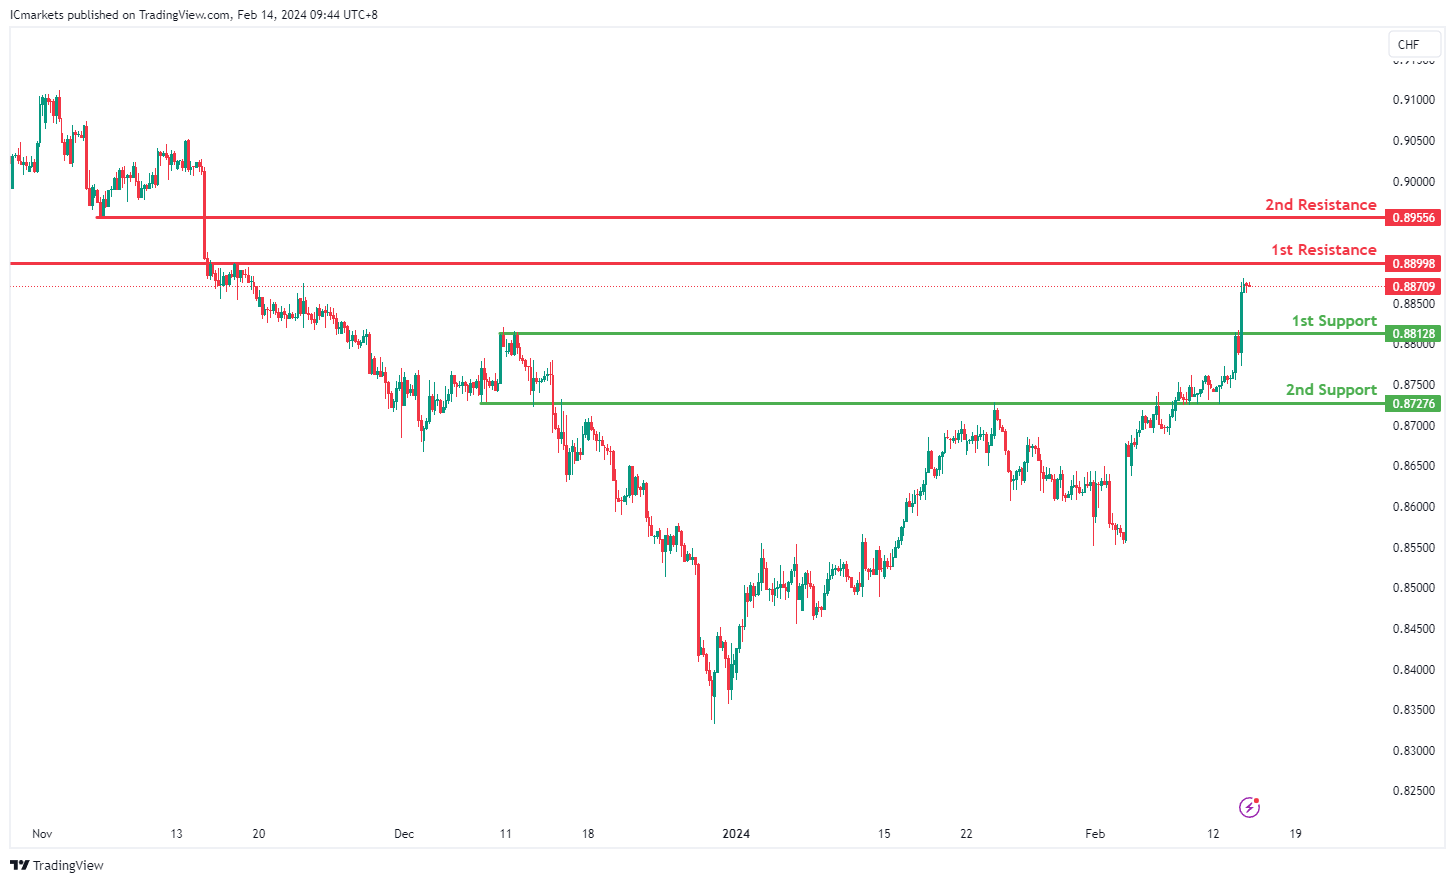
USD/CHF:
The USD/CHF chart currently indicates a bearish momentum, suggesting a potential downward trend.
The 1st support level is situated at 0.8812, identified as a pullback support. This level may serve as a significant area where buying interest could emerge, potentially halting the downward movement of the price.
Additionally, the 2nd support at 0.8727 is characterized as an overlap support, further reinforcing its potential as a level of support where buyers may intervene.
On the resistance side, the 1st resistance level is noted at 0.8899, representing an overlap resistance. This level may act as a barrier to upward movement, potentially prompting a bearish reaction.
Similarly, the 2nd resistance at 0.8955 is identified as a pullback resistance, indicating another potential area where selling pressure may intensify.
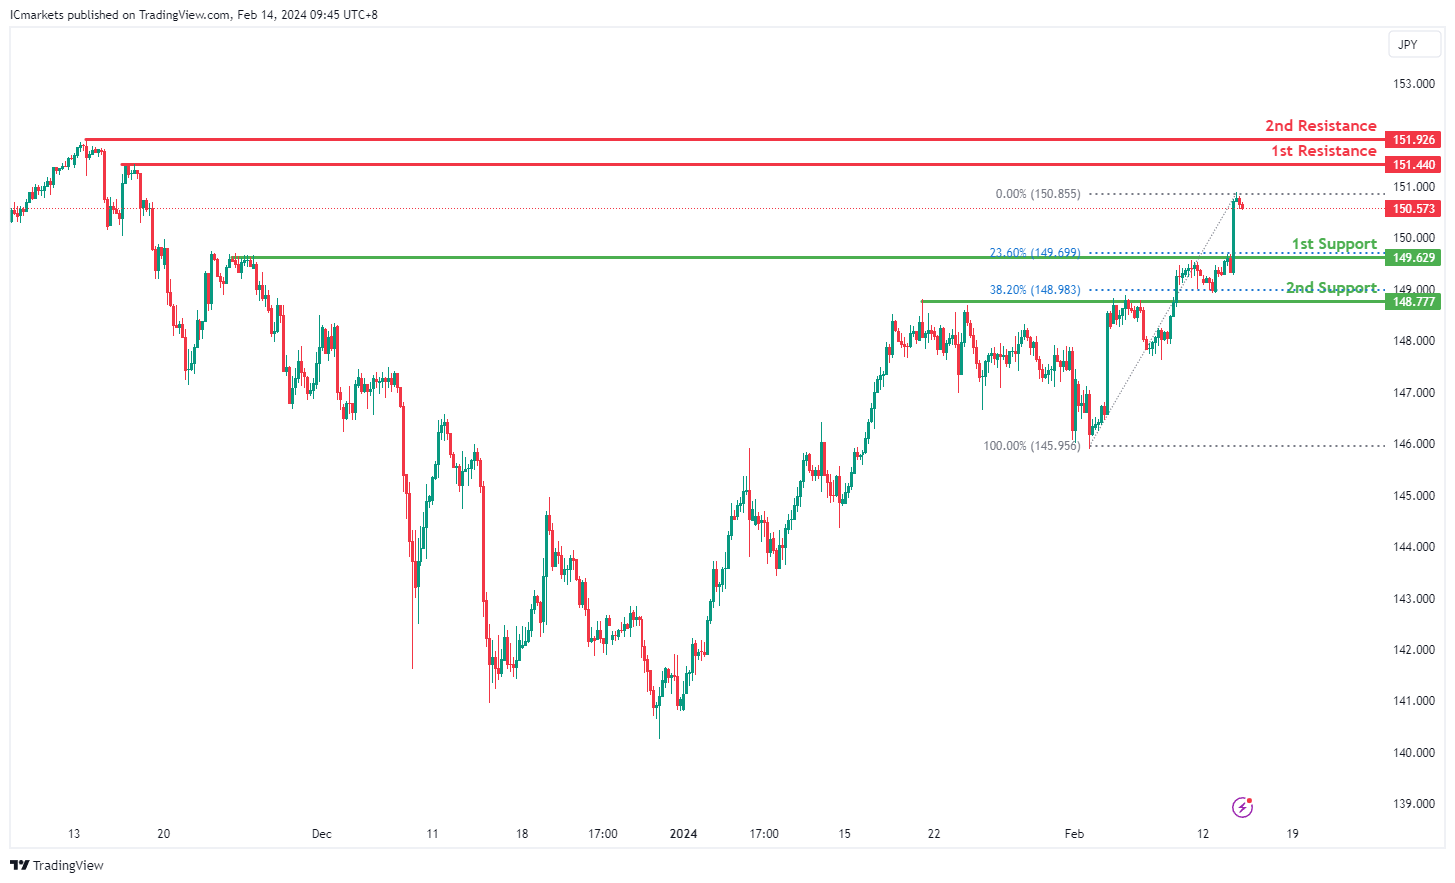
USD/JPY:
The USD/JPY chart currently exhibits a bearish momentum, suggesting a potential downward trend.
The 1st support level is identified at 149.62, characterized as a pullback support and coinciding with the 23.60% Fibonacci Retracement. This level holds significance as it may attract buying interest, potentially halting the downward movement of the price.
Additionally, the 2nd support at 148.77 is another pullback support, aligned with the 38.20% Fibonacci Retracement, further reinforcing its potential as a level of support.
On the resistance side, the 1st resistance level is noted at 151.44, representing a multi-swing high resistance. This level may act as a barrier to upward movement, potentially triggering a bearish reaction.
Similarly, the 2nd resistance at 151.92 is identified as a swing high resistance, indicating another potential area where selling pressure may intensify.
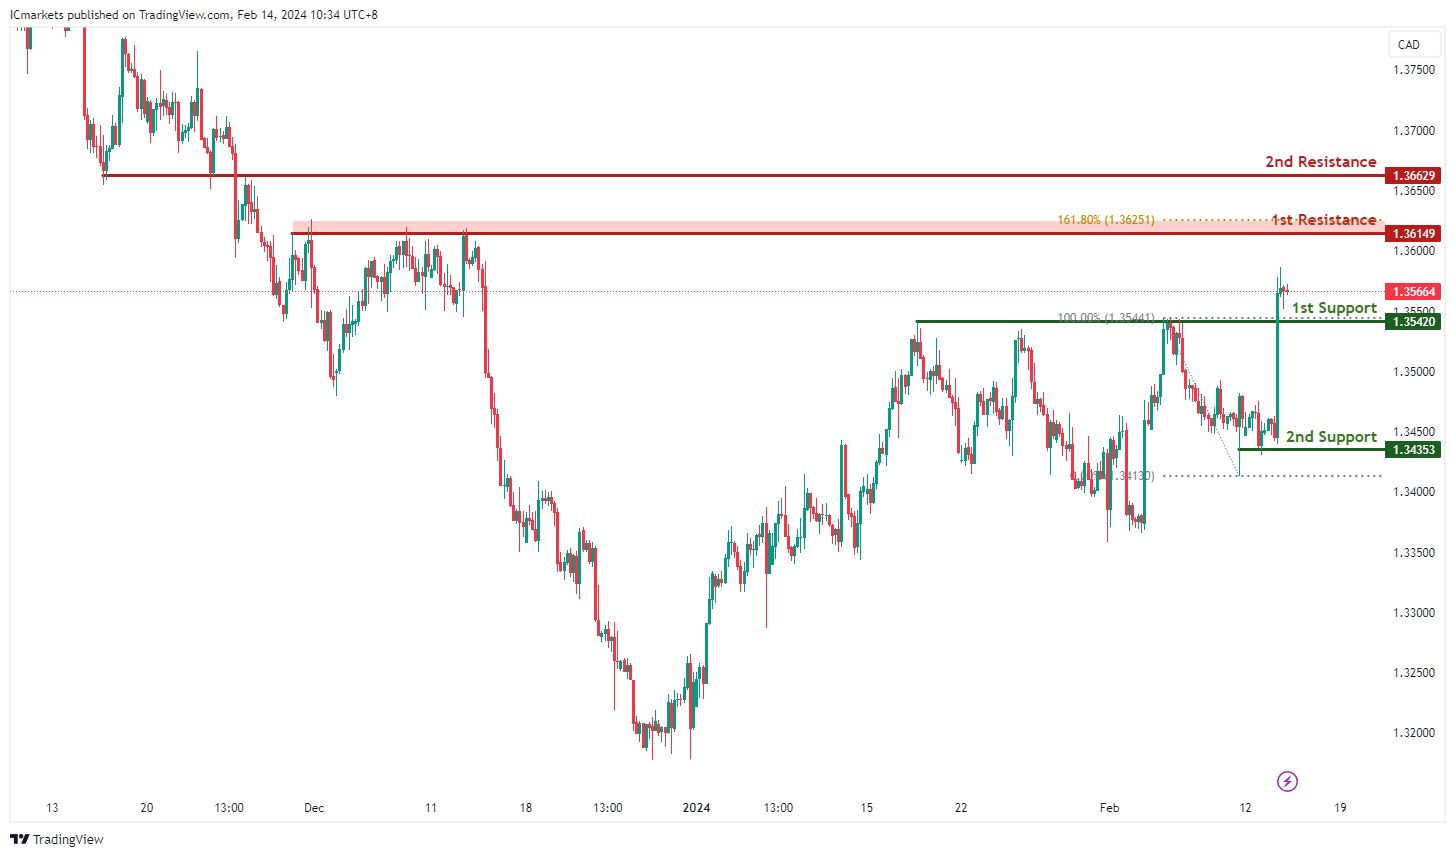
USD/CAD:
The USD/CAD chart currently exhibits an overall bullish momentum. In this context, there is a potential scenario for price to make a bullish bounce off the 1st support and resume to uptrend towards the 1st resistance.
The 1st support level at 1.3542 is identified as a pullback support. Further below, the 2nd support level at 1.3435 is also marked as a pullback support, further emphasizing its importance as a potential support zone.
To the upside, the 1st resistance level at 1.3614 is identified as a pullback resistance that aligns close to the 161.80% Fibonacci Extension level. Higher up, the 2nd resistance level at 1.3662 is noted as an overlap resistance, further highlighting its importance as a potential resistance point.
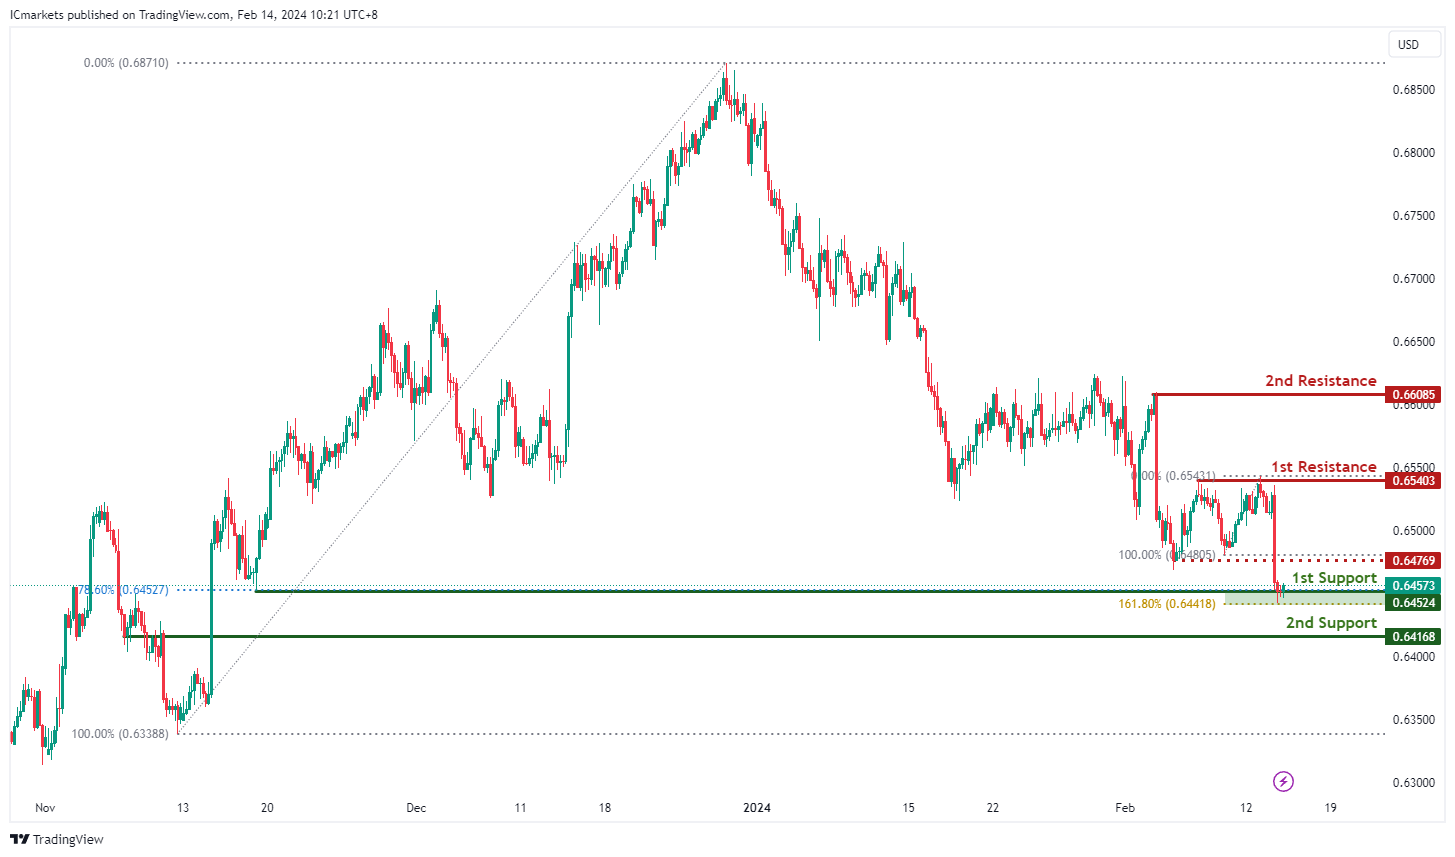
AUD/USD:
The AUD/USD chart currently exhibits an overall bearish momentum. In this context, there is a potential scenario for price to break under the 1st support and drop towards the 2nd support.
The 1st support level at 0.6452 is identified as pullback support that aligns with a confluence of Fibonacci levels i.e. the 78.60% Retracement and the 161.80% Extension. Further below, the 2nd support level at 0.6416 is noted as an overlap support, further emphasizing its importance as a potential support zone.
To the upside, the intermediate resistance level at 0.6476 is identified as a pullback resistance while the 1st resistance level at 0.6540 is also noted as a pullback resistance. Higher up, the 2nd resistance level at 0.6608 is also marked as a pullback resistance, further highlighting its importance as a potential resistance point.
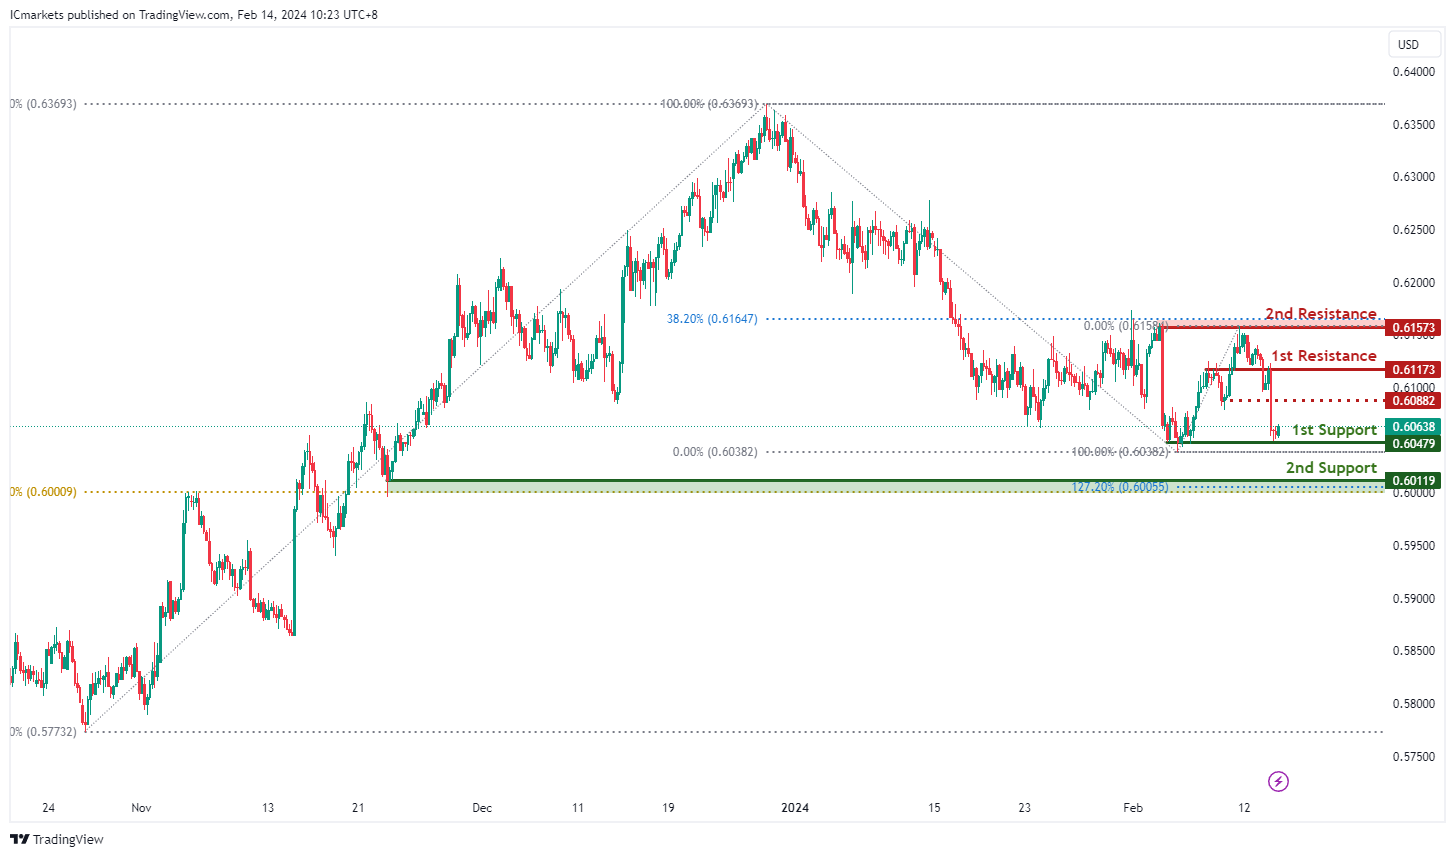
NZD/USD
The NZD/USD chart currently exhibits an overall bearish momentum. However, there is a potential scenario for price to make a weak bullish bounce off the 1st support before resuming the downturn.
The 1st support level at 0.6047 is identified as a pullback support. Further below, the 2nd support level at 0.6011 is also noted as a pullback support that aligns close to the 61.80% Fibonacci Retracement level, further emphasizing its importance as a potential support zone.
To the upside, the intermediate resistance level at 0.6088 is identified as a pullback resistance while the 1st resistance level at 0.6117 is noted as an overlap resistance. Higher up, the 2nd resistance level at 0.6157 is marked as a pullback resistance that aligns close to the 38.20% Fibonacci Retracement level, further highlighting its importance as a potential resistance point.
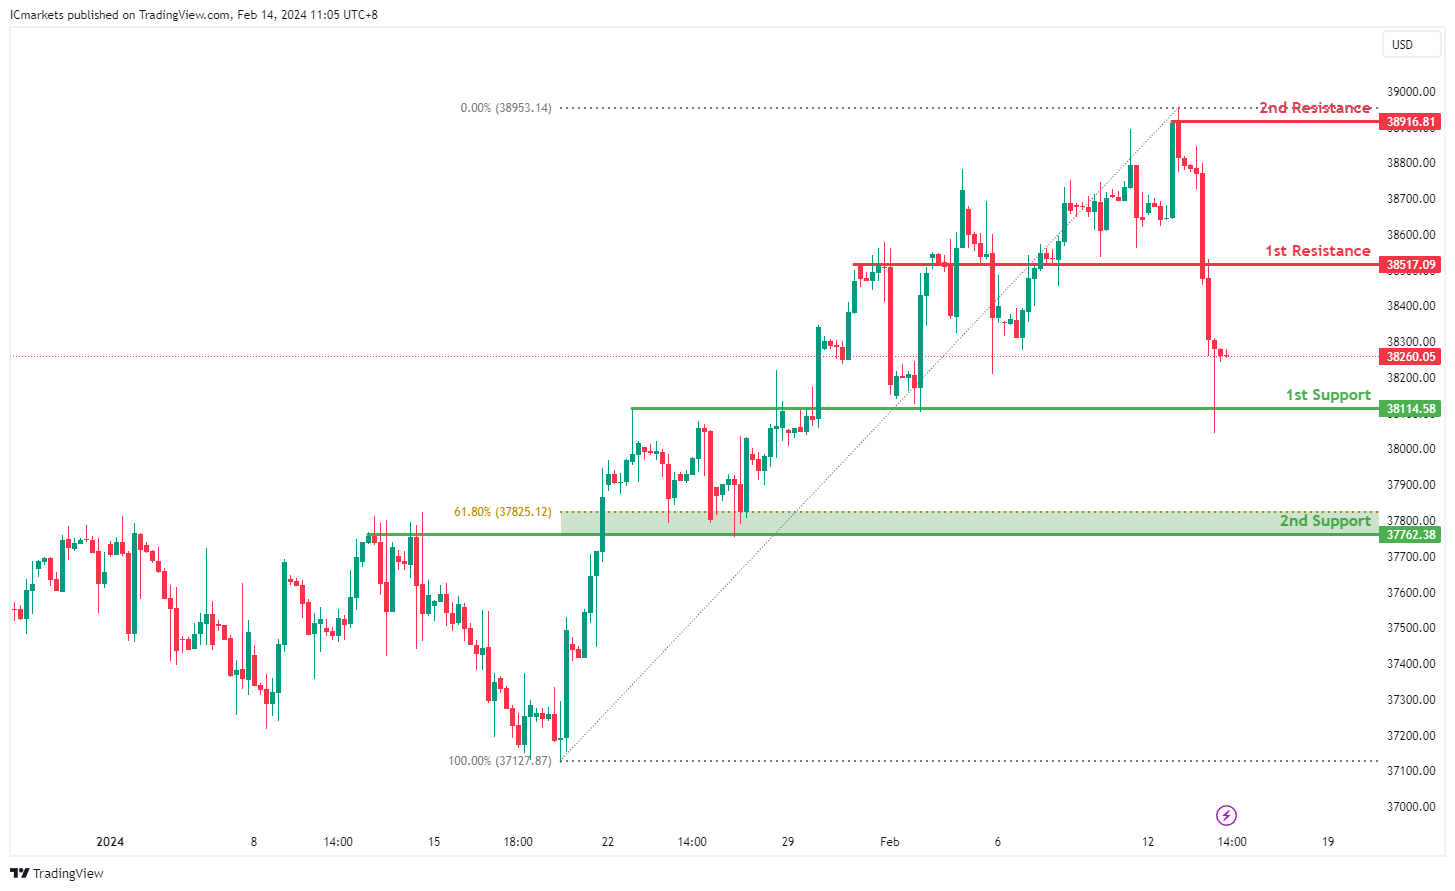
DJ30:
The DJ30 chart currently indicates a bearish overall momentum, suggesting a prevailing downward trend in the market.
The identified 1st support level at 38114.58 is considered significant as it represents an overlap support, indicating a historical level where buying interest has previously emerged. This level serves as a crucial area where buyers may step in again to support the price, potentially leading to a bounce.
Additionally, the 2nd support level at 37762.38 aligns with both an overlap support and the 61.80% Fibonacci Retracement level, further reinforcing its importance as a potential support zone. The confluence of these factors strengthens the significance of this support level.
On the resistance side, the 1st resistance level at 38517.09 is identified as a barrier where selling pressure may increase, as it coincides with an overlap resistance. This level represents a historical point where selling interest has been strong and could potentially cap further upside movement.
Further up, the 2nd resistance level at 38916.81 aligns with a swing high resistance, adding to its significance as a potential barrier to upward movement.
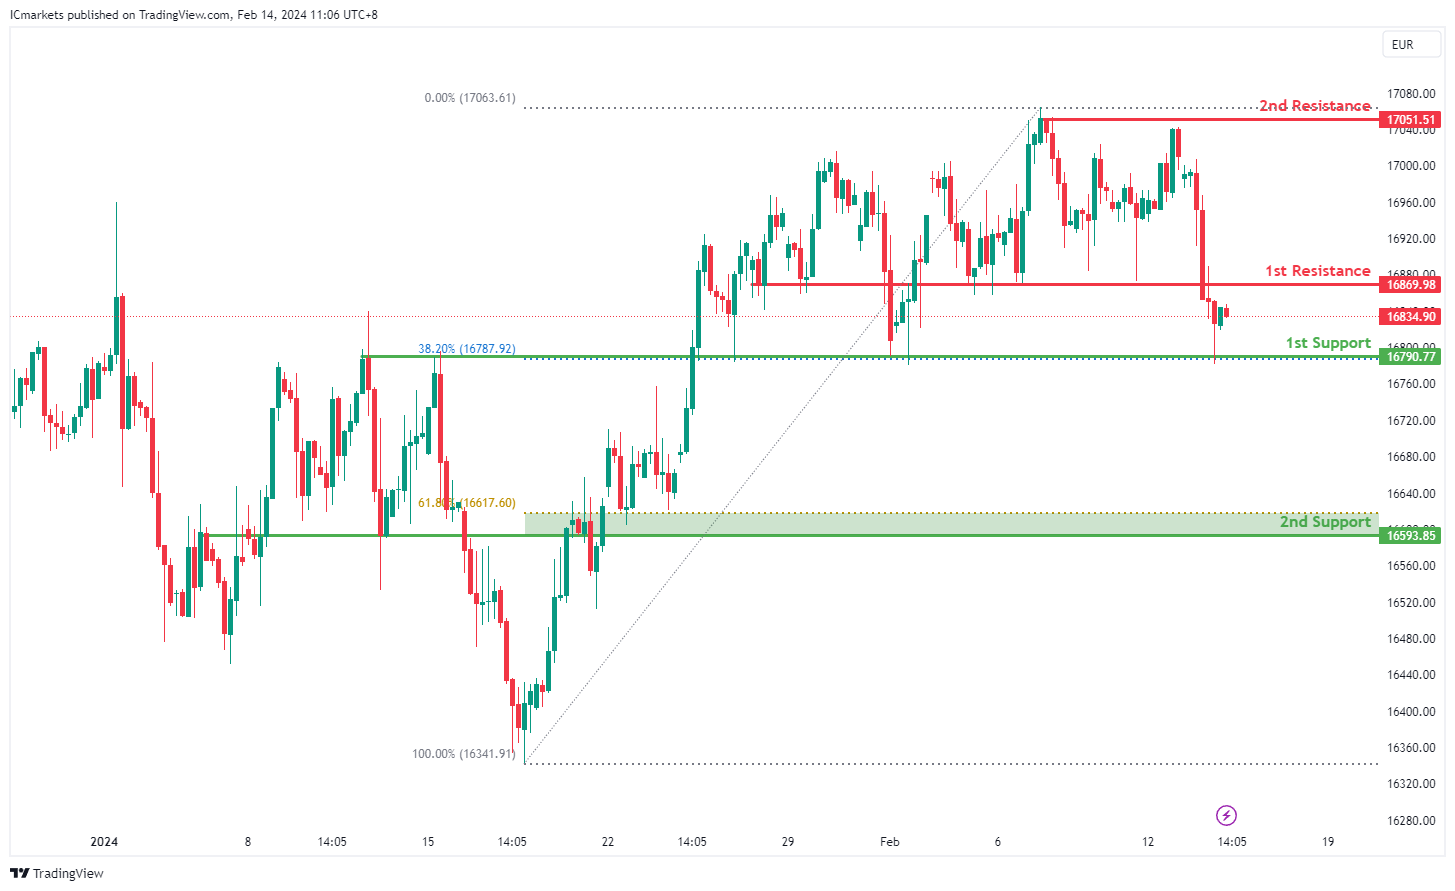
GER40:
The GER40 chart currently exhibits a bullish overall momentum, indicating a prevailing upward trend. Several factors contribute to this bullish sentiment, supporting the potential for a continued upward movement in price.
The identified 1st support level at 16790.77 is significant as it aligns with both an overlap support and the 38.20% Fibonacci Retracement level. This convergence of support factors enhances its importance as a level where buying interest has historically emerged, potentially acting as a foundation for further upward movement.
Additionally, the 2nd support level at 16593.85 coincides with an overlap support and the 61.80% Fibonacci Retracement level, further reinforcing its significance as a potential support zone. The confluence of these support factors strengthens the potential support area and indicates a strong foundation for potential bullish momentum.
On the resistance side, the 1st resistance level at 16869.98 is identified as a barrier where selling pressure may increase, as it aligns with an overlap resistance. This level represents a historical point where selling interest has been strong and could potentially halt further upward movement.
Further up, the 2nd resistance level at 17051.51 aligns with a swing high resistance, adding to its significance as a potential barrier to upward movement.
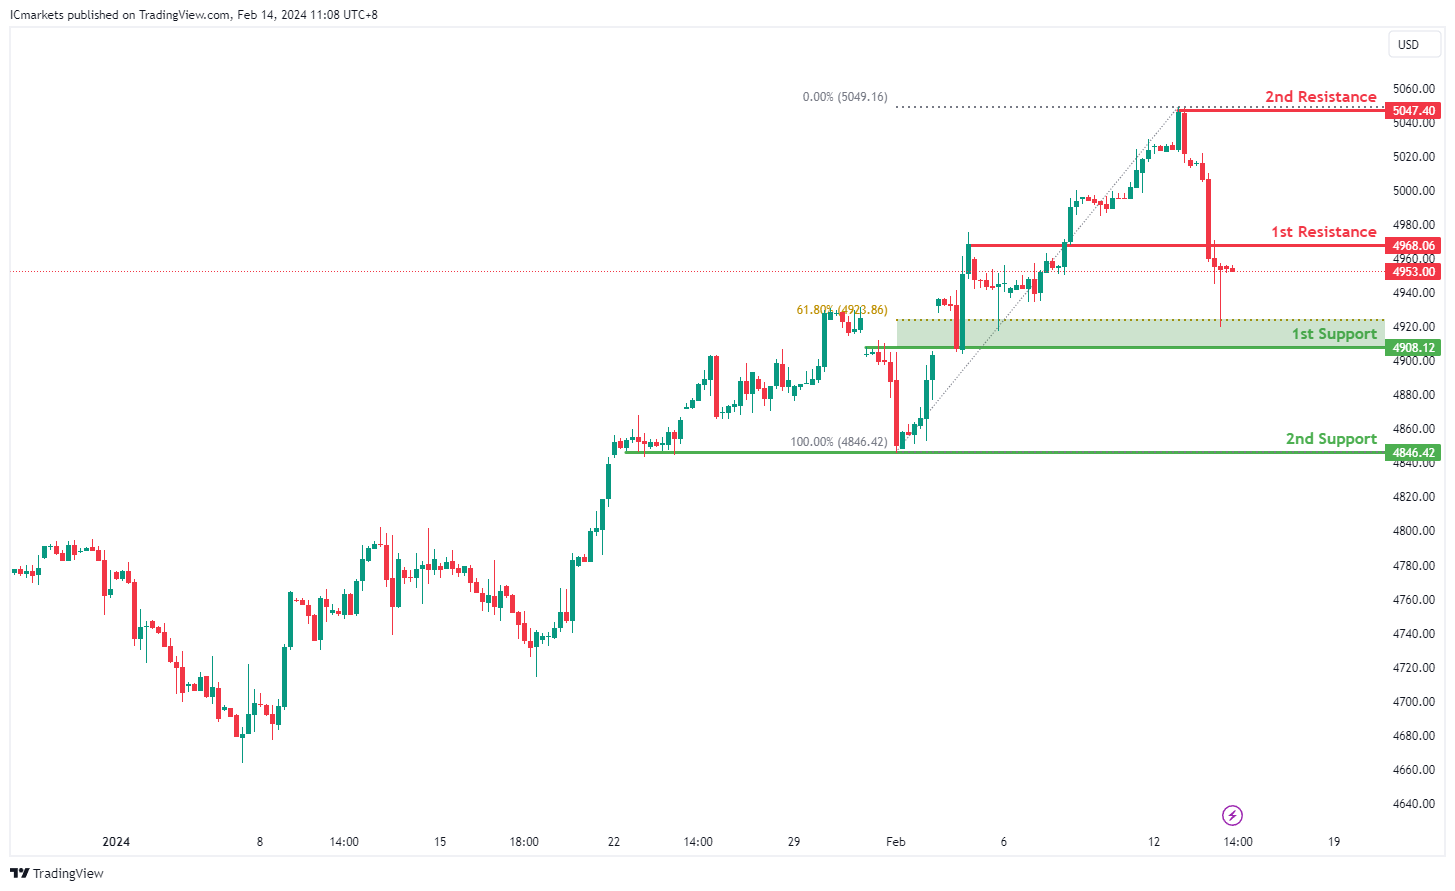
US500:
The US500 chart currently indicates a bullish overall momentum, suggesting a prevailing upward trend. Several factors contribute to this bullish sentiment, supporting the potential for a continued upward movement in price.
The identified 1st support level at 4908.12 is significant as it aligns with both an overlap support and the 61.80% Fibonacci Retracement level. This convergence of support factors strengthens its importance as a level where buying interest has historically emerged, potentially providing a strong foundation for further upward movement.
Additionally, the 2nd support level at 4846.42 corresponds to a multi-swing low support, further reinforcing its significance as a potential support zone. The combination of these support factors suggests a robust area where buyers may step in to support the price.
On the resistance side, the 1st resistance level at 4968.06 is identified as a point where selling pressure may increase, as it represents a pullback resistance. This level indicates a historical point where selling interest has been strong and could potentially act as a barrier to further upward movement.
Further up, the 2nd resistance level at 5047.40 aligns with a swing high resistance, adding to its significance as a potential barrier to upward movement.
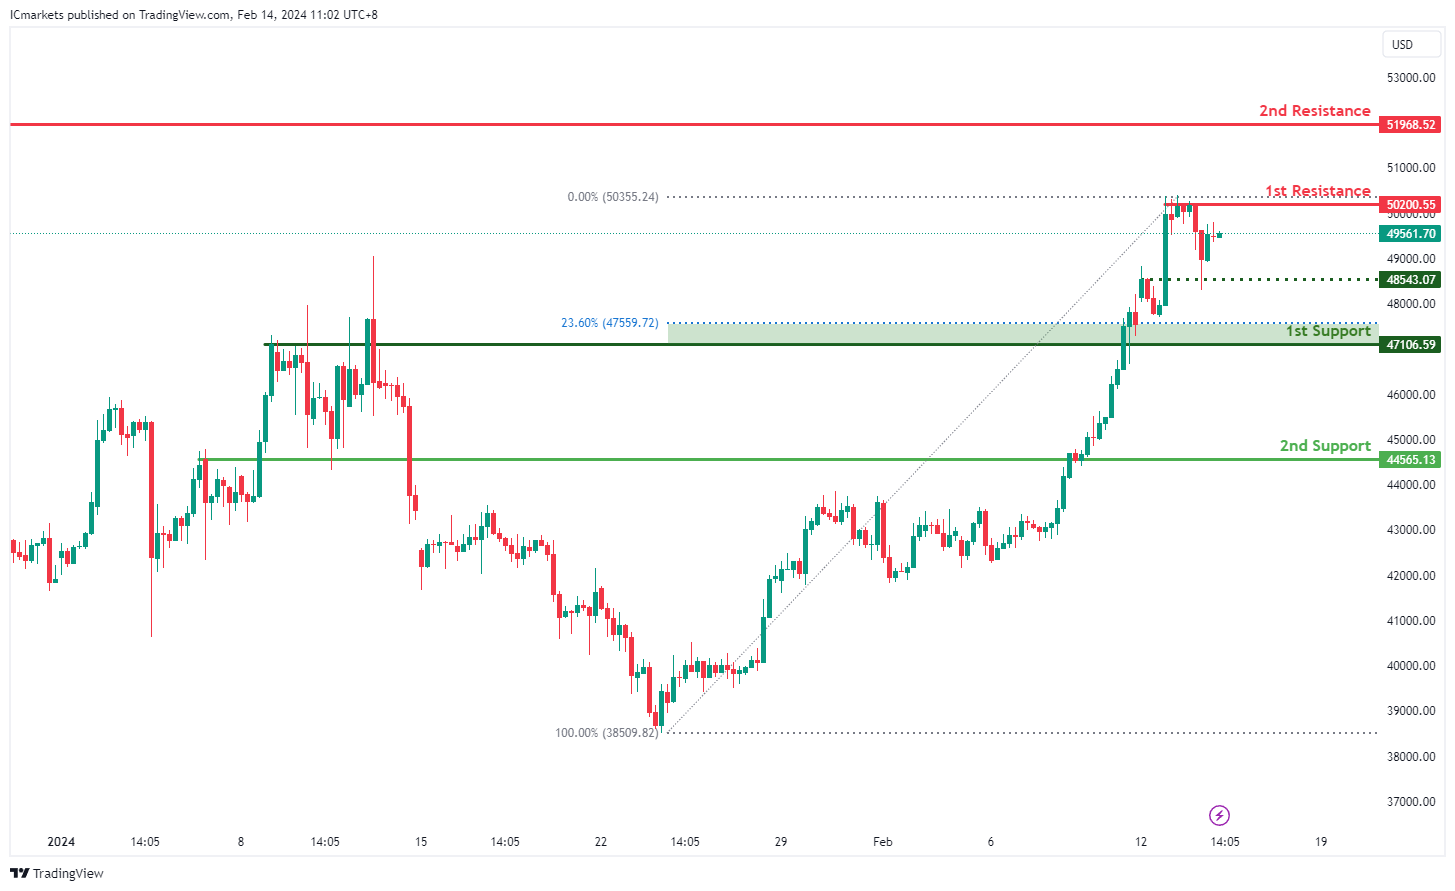
BTC/USD:
The BTC/USD chart currently exhibits a bullish overall momentum, indicating a prevailing upward trend. Several factors contribute to this bullish sentiment, supporting the potential for a continued upward movement in price.
The 1st support level at 47106.59 is considered significant as it aligns with both an overlap support and the 23.60% Fibonacci Retracement level. This convergence of support factors suggests a strong level where buying interest has historically emerged, potentially providing a solid foundation for further upward movement.
Additionally, the 2nd support level at 44565.13 corresponds to another overlap support, reinforcing its importance as a potential support zone. This level indicates a significant historical level where buyers have previously stepped in to support the price. An intermediate support level at 48543.07 is also identified, which aligns with an overlap support, providing additional reinforcement to the support structure.
On the resistance side, the 1st resistance level at 50200.55 is identified as a point where selling pressure may increase, as it represents a multi-swing high resistance. This level suggests a historical point where selling interest has been strong and could act as a barrier to further upward movement.
Further up, the 2nd resistance level at 51968.52 also aligns with a multi-swing high resistance, adding to its significance as a potential barrier to upward movement.
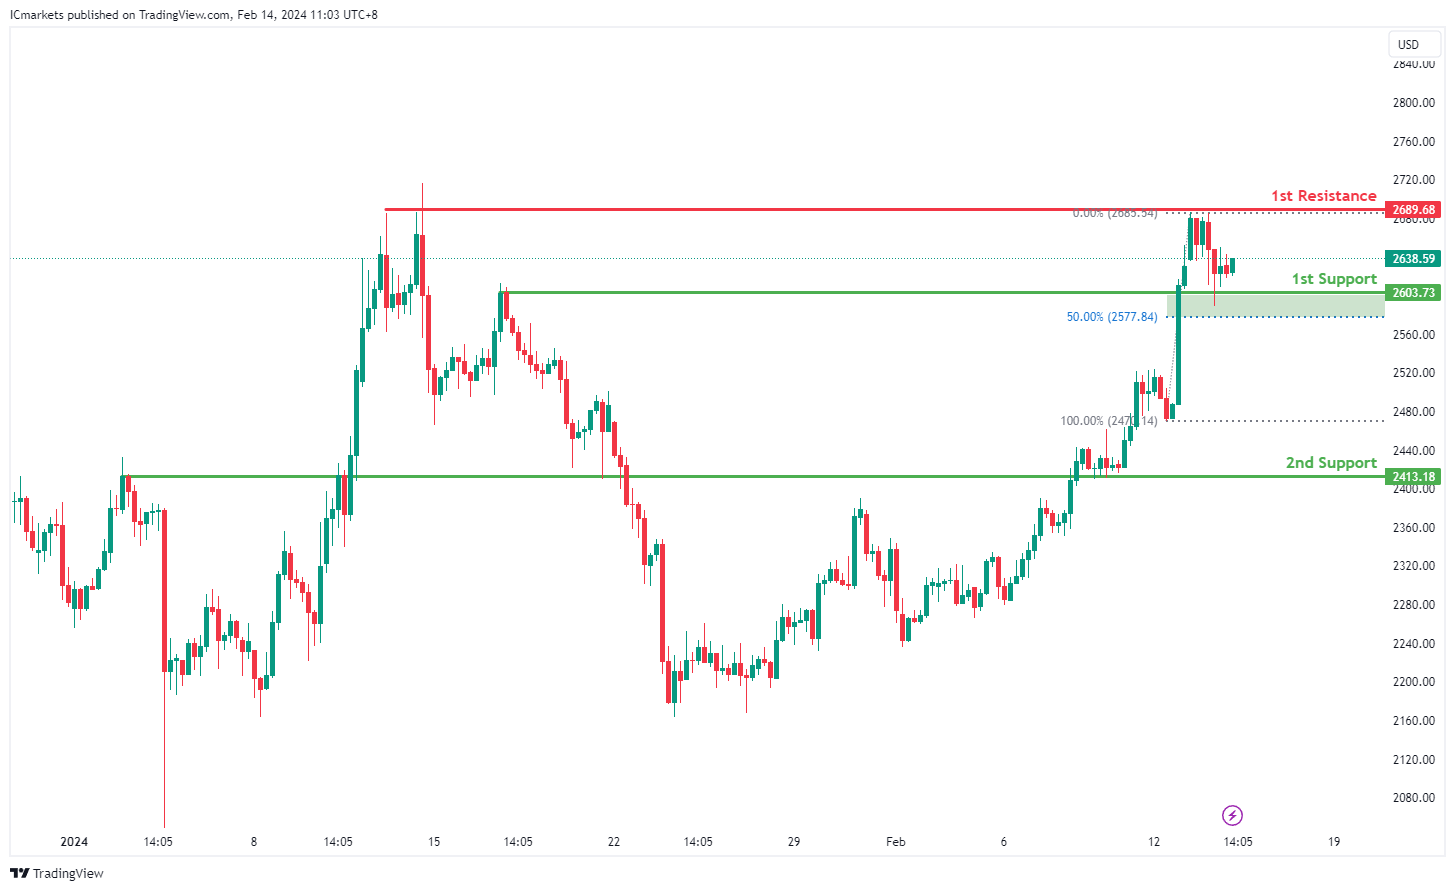
ETH/USD:
The ETH/USD chart currently presents a neutral overall momentum, indicating a lack of clear direction in the market. This neutrality suggests that the price may oscillate between the identified support and resistance levels without a strong bias towards either bullish or bearish sentiment.
The 1st support level at 2603.73 is significant as it coincides with both an overlap support and the 50% Fibonacci Retracement level. This confluence of support factors indicates a robust level where buying interest has previously emerged, potentially providing a floor for the price.
Furthermore, the 2nd support level at 2413.18 also aligns with an overlap support, reinforcing its significance as a potential area where buyers may step in to support the price.
On the resistance side, the 1st resistance level at 2689.68 is identified as a swing high resistance. This level represents a historical point where selling pressure has previously halted upward movements, potentially acting as a barrier to further price appreciation.
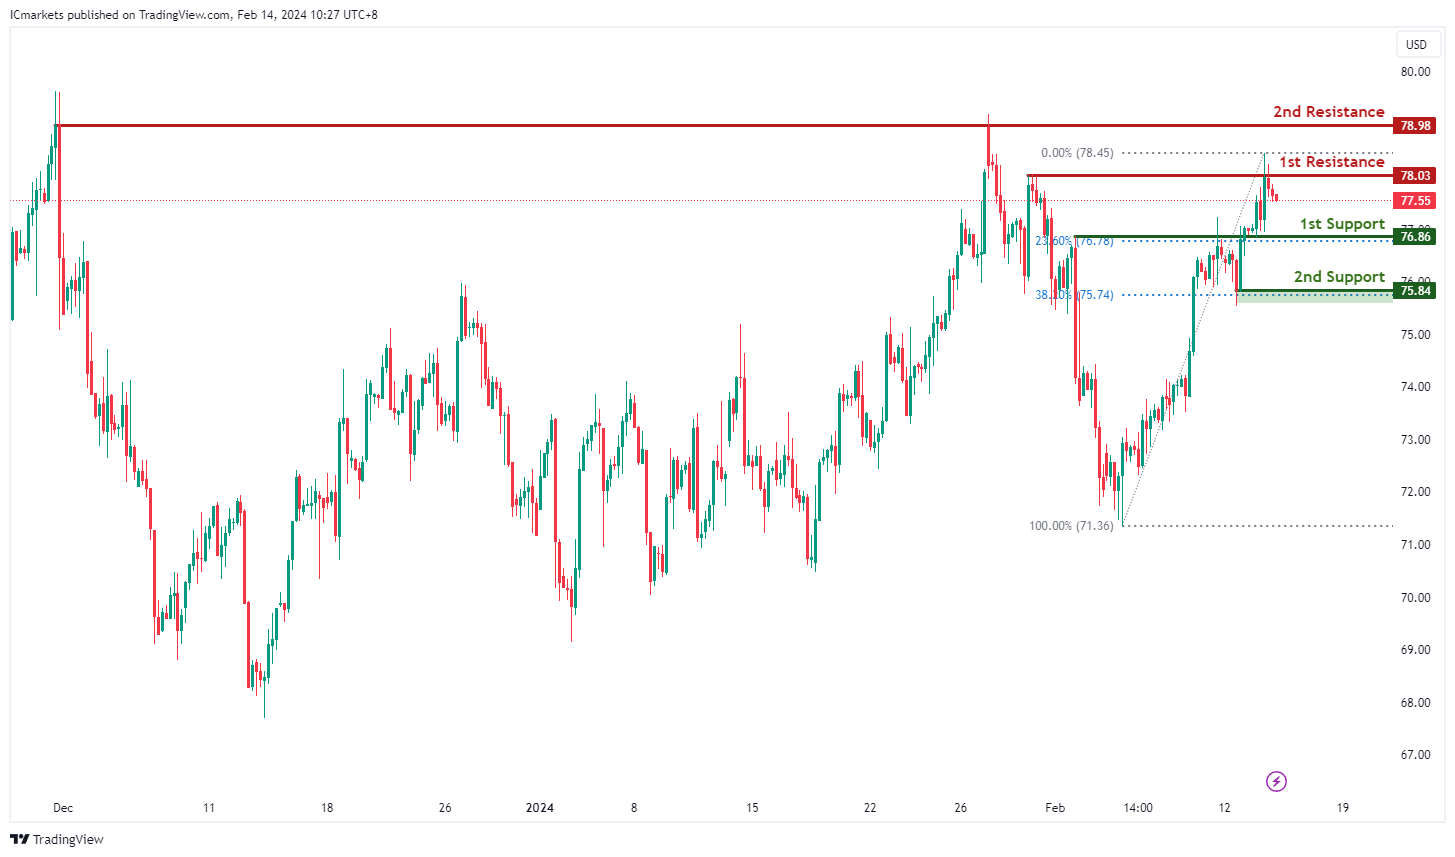
WTI/USD:
The WTI (West Texas Intermediate) chart currently exhibits an overall bullish momentum. In this context, there is a potential scenario for price to rise towards the 1st resistance.
The 1st resistance level at 78.03 is identified as a pullback resistance. Higher up, the 2nd resistance level at 78.98 is marked as a multi-swing-high resistance, further highlighting its importance as a potential resistance zone.
To the downside, the 1st support level at 76.86 is identified as an overlap support that aligns with the 23.60% Fibonacci Retracement level. Further below, the 2nd support level at 75.84 is noted as a pullback support that aligns close to the 38.20% Fibonacci Retracement level, reinforcing its significance as a key support level.
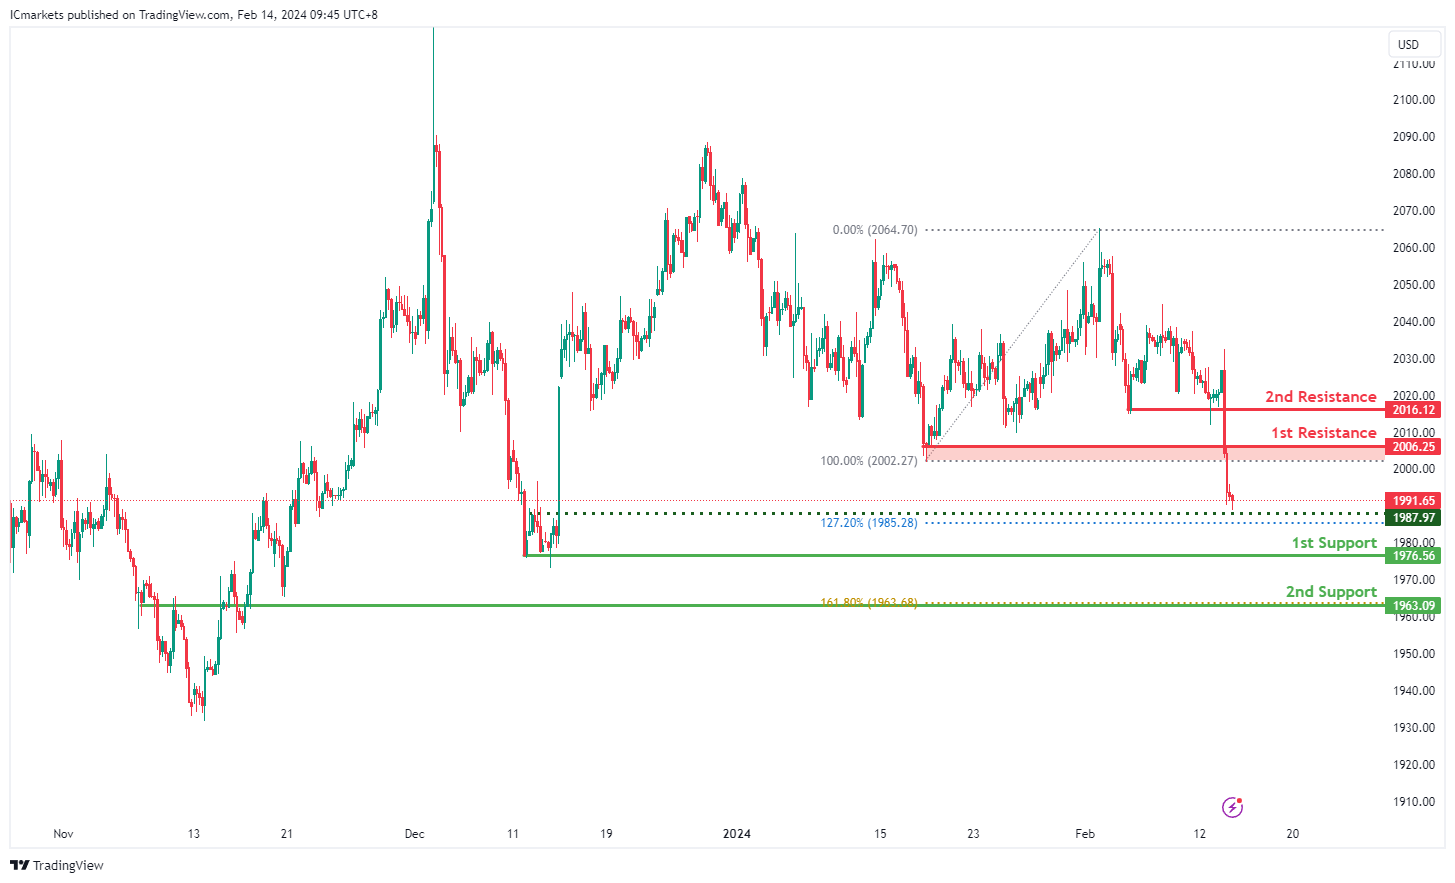
XAU/USD (GOLD):
The XAUUSD chart currently demonstrates a bullish momentum, indicating a potential upward trend.
The 1st support level is positioned at 1976.56, identified as a multi-swing low support. This level holds significance as it has previously acted as a strong support area, potentially attracting buying interest and halting the downward movement of the price.
Additionally, the 2nd support at 1963.09 is noted as an overlap support, coinciding with the 161.80% Fibonacci Extension, further reinforcing its potential as a support zone.
On the resistance side, the 1st resistance level is located at 2006.25, characterized as a pullback resistance. This level may serve as a barrier to upward movement, potentially triggering a temporary reversal or consolidation.
Similarly, the 2nd resistance at 2016.12 is identified as a pullback resistance, indicating another potential area where selling pressure may intensify.
UK CPI data key to extending Sterling’s gains
Sterling has shown marked strength this week, with upcoming UK January inflation data eagerly awaited as potential catalyst for further gains. CPI is expected to edge up from 4.0% yoy to 4.1% yoy, continuing its rebound from the low of 3.9% set in November. Core CPI is also expected to rise from 5.1% yoy to 5.2% yoy.
Some analysts suggest that these projected upticks may stem largely from base effects, yet the focal point remains on the path of services inflation, which has shown a gradual increase in recent months, from December's 6.4%, and November's 6.3%.
Should the inflation data come in slightly above expectations, it is unlikely to shift the majority of BoE MPC towards advocating for further rate hikes alongside members like Jonathan Haskel and Catherine Mann. However, persistent stickiness in inflation, especially within the services sector, would prompt BoE to delay any rate reductions further.
The market's reaction to this week's robust job and wage figures has shifted expectations for BoE's initial rate reduction to August. Today's CPI data, coupled with tomorrow's GDP figures, could further influence these projections.
GBP/CHF's rally accelerated higher this week. Sustained trading above 1.1153 resistance and 55 W EMA (now at 1.1149) will strengthen the case that whole correction from 1.1574 has completed with three waves down to 1.0634. Rise from 1.0634 would then develop into a medium term rally, resuming the rebound from 1.0183 (2022 low), and target 100% projection of 1.018 to 1.1574 from 1.0634 at 1.2025.
At the same time, EUR/GBP's down trend resumed and it's now on track to 61.8% projection of 0.8977 to 0.8491 from 0.8764 at 0.8464. Decisive break there could prompt downside acceleration, as fall from 0.9267 (2022 high) extends, and target 100% projection at 0.8278.
US 10-year yield breaks key near term fibonacci resistance
10-year yield rose 0.144 overnight to close at 4.316, breaking above 38.2% retracement of 4.997 to 3.785 at 4.247. A more important perspective is that strong support was seen from 55 W EMA and long term channel, as seen in the weekly chart. Combined, the development suggests that fall from 4.997 has completed at 3.785 already. Further rally is now expected as long as 55 D EMA (now at 4.143 holds), to 61.8% retracement at 4.534 and possibly above.
Nevertheless, there is no change in the view that price actions from 4.997 are developing into a medium term corrective pattern. Rise from 3.785 could be seen as the second leg. Upside should be capped by the 4.997 to bring the third leg down to 3.785 and below.
This technical scenario aligns with the prevailing expectation that Fed's next move will be a rate cut. The duration and extent of the current rebound in 10-year yield will depend on when Fed decides to initiate policy relaxation. In essence, the more Fed postpones its initial rate reduction, the more prolonged and substantial the climb in 10-year yield could be. Still, this scenario would not push yield beyond 5% handle. However, decisive break of 5% would signal a significant shift in the underlying economic and monetary policy outlook and necessitate reevaluation of these expectations.
DOW plunges most in nearly a year, yet outlook not gloom
DOW posted its biggest daily decline in nearly a year overnight, rattled by the latest US inflation figures that unexpectedly showcased a slowdown in disinflation. This development has cast serious doubts over Fed's ability to start cutting interest rates cut in May, a move that was previously anticipated by investors.
The changing market expectations, now leaning towards a 65% probability of Fed maintaining rates in May, mark a stark shift from just a day prior, when the odds stood at around 40%.
The upcoming PCE inflation data, set for release on February 29, holds the potential to further cement these expectations if it mirrors the persistence in core inflation.
Technically, a short term top should be formed at 38927.08, but it's not a disaster yet. Price actions from there are currently seen as developing in to a near term consolidation pattern. As long as 55 D EMA (now at 37338.04) holds, this consolidation should be relatively brief. Another rise through 38927.08 towards 40k psychological level is expected sooner rather than later.
However, considering bearish divergence condition in D MACD, firm break of 55 D EMA should trigger deeper correction to 38.2% retracement of 32327.20 to 38927.08 at 36405.92, and possibly below.
ECB’s Lane signals rate cut as next monetary policy move
ECB Chief Economist Philip Lane, in a discussion with Spanish RTVE, described the disinflation progress as "very good." He added that "the next move is to cut interesting rate".
Nevertheless, the timing of such rate adjustments would be data-dependent. Also, "the number of rate cuts we make will depend on how much progress we make towards our target," he added.
In the background, there's a growing consensus around the first rate cut in the current cycle, with expectations leaning towards April or June as likely windows for action.
Gold – Falls Below $2,000 After Resilient Display This Year
- US inflation report hits gold
- Fewer Fed rate cuts priced into markets
- A loss of major technical support
US inflation data finally took its toll on gold which, after holding strong above $2,000 this year, finally crumbled under the pressure of higher rates.
How much worse it gets for the yellow metal will ultimately depend on how bad the data gets but, under the circumstances, we’re certainly back in a “good news is bad news” scenario ahead of the retail sales data.
The fairytale scenario of a strong economy, low inflation, and rate cuts now looks a step too far.
US inflation rose 0.3% last month and 3.1% compared to a year earlier. That’s still well above the Federal Reserve’s 2% target and the report has almost erased any possibility of a March rate cut in the markets.
Gold hits a two-month low after the CPI report
Gold fell heavily after the data as traders finally appeared to accept that rate cuts may not come as soon and as fast this year as previously assumed.
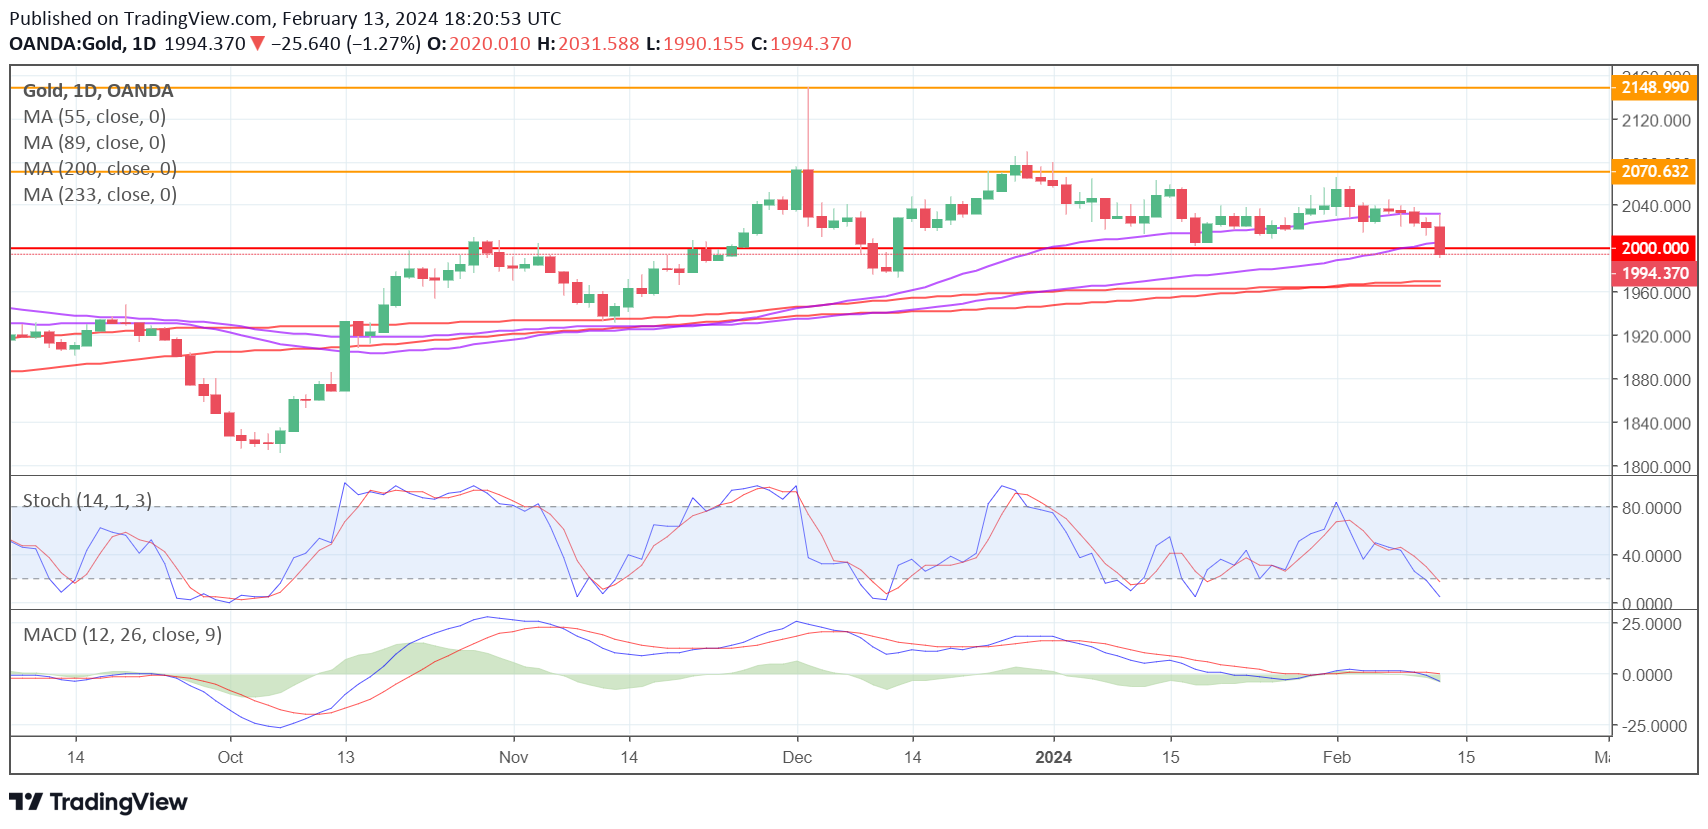
Source – OANDA
The break below $2,000 may be a big psychological blow after such a long period of resilience. The next big test could fall around $1,973 where the December low aligns with the 200/233-day simple moving average band.
What Next for Commodity-Linked Currencies?
- Risk linked currencies lose correlation to S&P 500
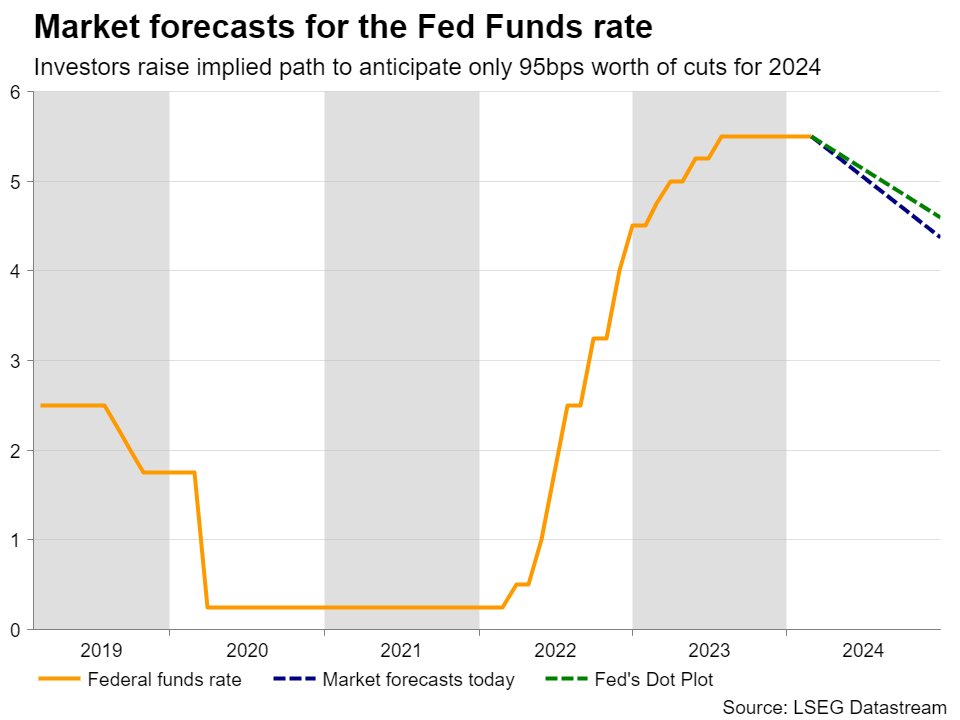
- Dollar outperforms all as Fed implied rate path rises
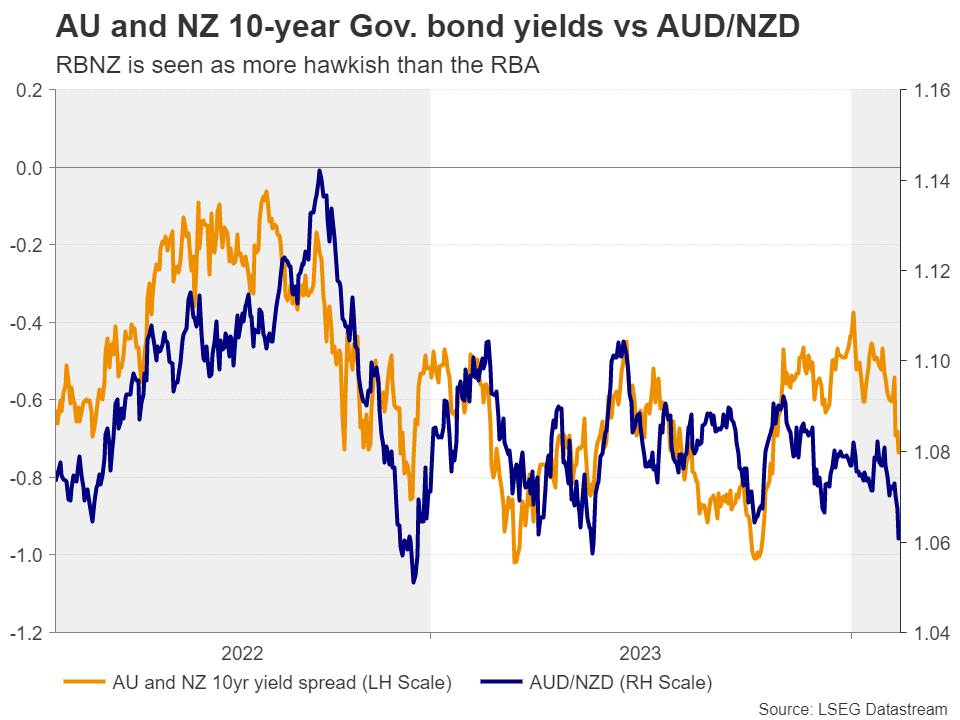
- BoC abandons tightening bias, but RBA and RBNZ stay hawkish
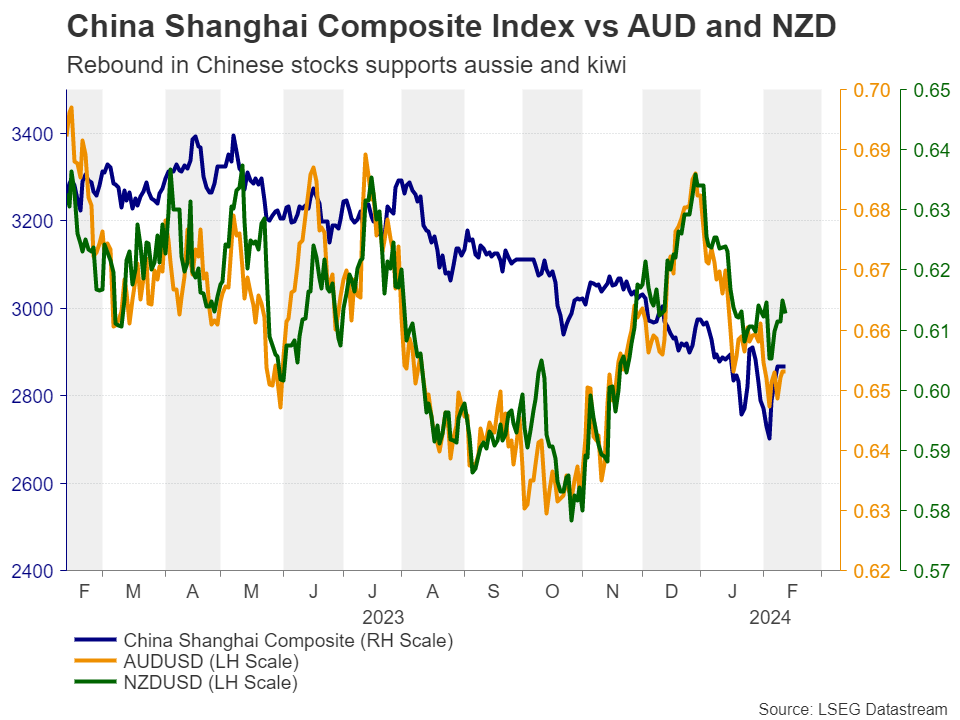
- China impacts aussie and kiwi, loonie linked to oil prices
Surrendering to the greenback’s dominance
Just before the turn of the year, the risk-linked currencies - the Australian dollar, the New Zealand dollar, and the Canadian dollar - also known as the commodity-linked currencies, have come under selling pressure despite risk appetite remaining elevated and allowing Wall Street to conquer unchartered territories, with the correlations between these three currencies and the S&P 500 declining notably.
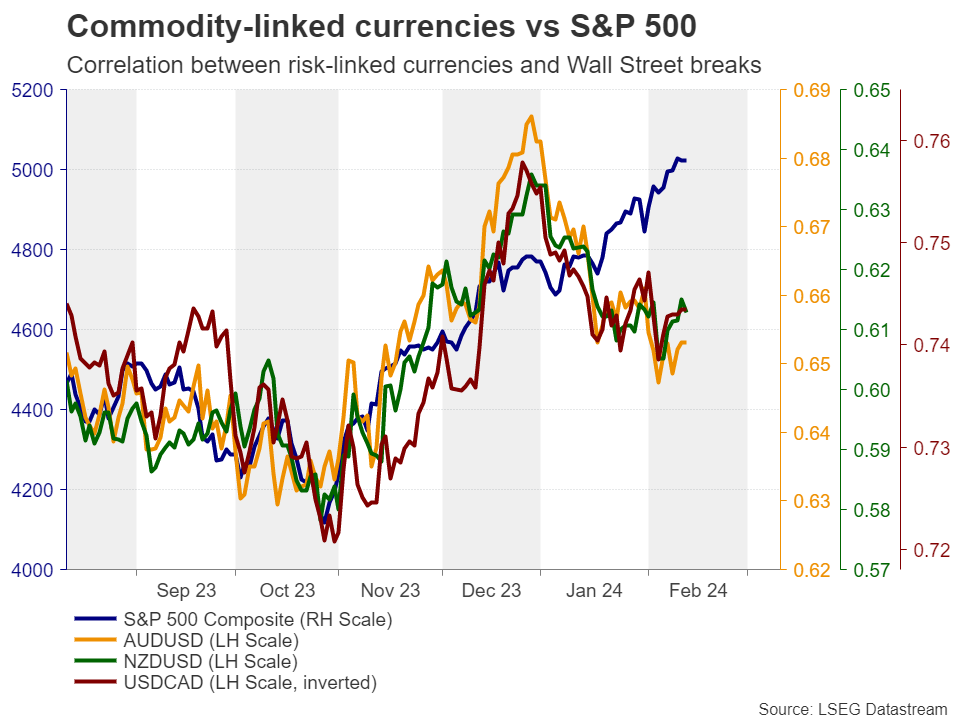
But what’s behind the break of an up-until-recently strong correlation? One reason is the greenback’s strength due to the market’s repricing regarding the Fed’s future course of action. At the start of the year, investors were fully convinced that Powell and his colleagues will lower interest rates by 25bps in March.
However, a less-dovish-than-expected Fed meeting in January, a streak of astounding US economic data, stickier than expected US inflation, and a chorus of policymakers that kept pushing back against an imminent rate reduction, forced market participants to lift their implied rate path, with the probability of a March cut dropping to a mere 4%. Even the June probability has dropped below 50% after the US CPI data for January.
At the same time, the impact of this repricing on Wall Street was minimal as investors remained willing to buy, perhaps on the logic that there are more AI-related future growth opportunities to be priced in. This allowed the greenback to stage a stellar recovery against all its major peers at a time when the S&P 500 was conquering uncharted territories.
However, the aussie and the kiwi have been performing worse than the loonie, which is losing only against the dollar and the pound. Up until recently, and taking the bleeding yen out of the equation, the aussie and the kiwi were the worst performers.
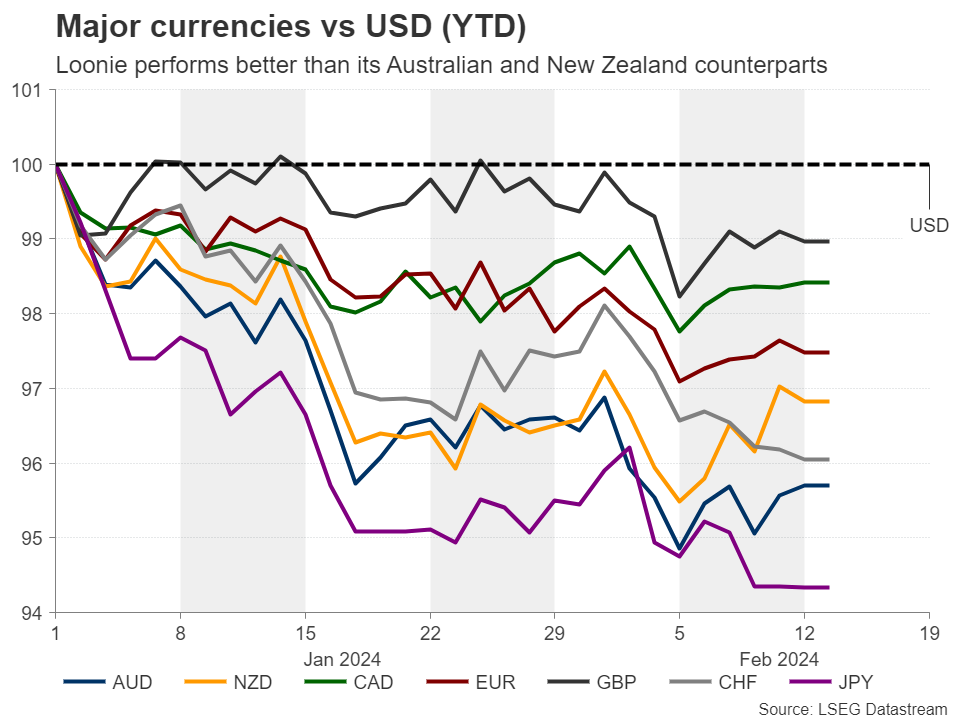
This suggests that besides expectations surrounding the Fed, there are other forces to be considered; one that may be weighing on both the aussie and the kiwi, and one that is helping the loonie avoid being severely damaged, despite the Bank of Canada dropping its hiking bias at its latest gathering.
China, oil prices, RBA and RBNZ monetary policy
The force that added extra weight on the aussie and kiwi is called China. Mainly due to a battered property sector, the uncertainty surrounding the world’s second largest economy, and Australia’s and New Zealand’s main trading partner, prompted investors to abandon Chinese equities, with aussie and kiwi traders focusing more on that rather than the euphoria on Wall Street. As for the loonie, it may have received a helping hand recently by the recovery in oil prices, which is driven by the Middle East crisis.
Having said all that, both the aussie and the kiwi paused their slides after the RBA maintained its tightening bias at its first policy decision for the year and after New Zealand’s employment report for Q4 came in better than anticipated. The kiwi received an extra boost last Friday, after the Australia and New Zealand Banking Group (ANZ) said it expects the RBNZ to lift its official cash rate by another 50bps to 6%. They clarified that they believe a 25bps hike will be delivered this month and another one in April.
What’s next?
Now the question is where those currencies are headed next, and which could perform better. Putting them all against the dollar, they are likely to come again under selling pressure if the market continues to upwardly adjust its Fed implied path.
However, against each other and amongst the three of them, the loonie may be the one to fall from first place to third. The BoC is the most dovish central bank among the three, while a resolution of the conflict in the Middle East may remove support from oil prices. But even if there is no ceasefire, as long as the situation does not escalate into something bigger, the market may stop paying attention at some point. After all, this is what happened with the war in Ukraine.
When aussie and kiwi enter the same ring
Now, putting the aussie against the kiwi, the latter has been outperforming and may continue to do so if the market remains convinced that the RBNZ is not done raising rates, and especially in the extreme case they hike in February and signal that another one could be looming as the ANZ projected.
However, considering both the RBA and RBNZ implied paths, the risk of the RBNZ disappointing the market is bigger than the RBA. Therefore, should the RBNZ appear less hawkish than the market anticipates at its upcoming gathering, the pair aussi/kiwi pair may be poised to rebound.
As for China, the latest rebound in Chinese stocks due to the decision by regulatory authorities to step up efforts to stabilize the market is a positive for both currencies, but it’s a zero-sum game when they enter the same ring. That said, this is what may allow both to outperform their Canadian counterpart.
Technically, aussie/kiwi rebounded the last couple of days, after hitting support slightly below 1.0600. The pair returned above the 1.0620 key barrier which has been acting as the lower end of the sideways range that’s been containing most of the price action since February 24, which keeps the long-term picture neutral for now.
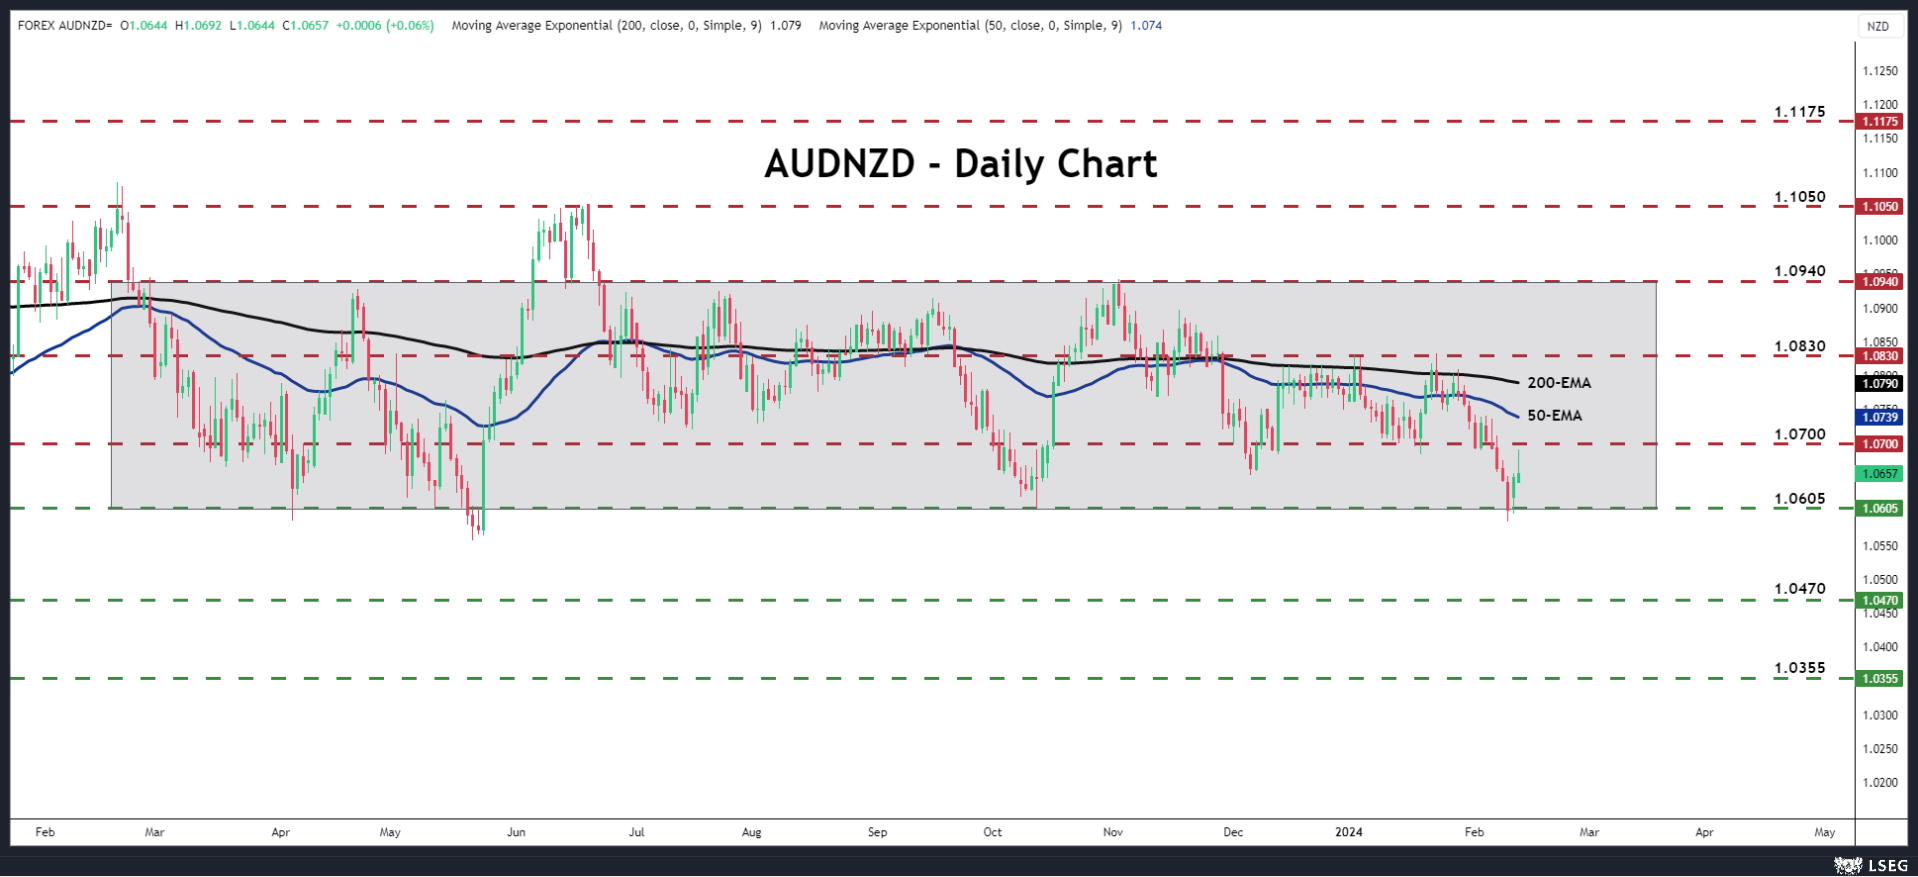
Another dip and a decisive close below 1.0620 may confirm that this time, the bears are willing to take the driver’s seat again and may allow extensions towards the low of December 2022 at around 1.0470. On the upside, a recovery above 1.0700 may signal that traders want to keep the pair range bound for a while longer.
USD: CPI Carries The Dollar to Pivots
The higher-than-expected inflation data for January has reignited concerns about rising prices and its implications for Federal Reserve policy. While investors had anticipated rate cuts in the near term, the hot inflation print may delay such actions. As the Fed navigates the delicate balance between containing inflation and supporting economic growth, market participants will closely monitor future inflation reports and Fed communications for further insights into monetary policy direction.
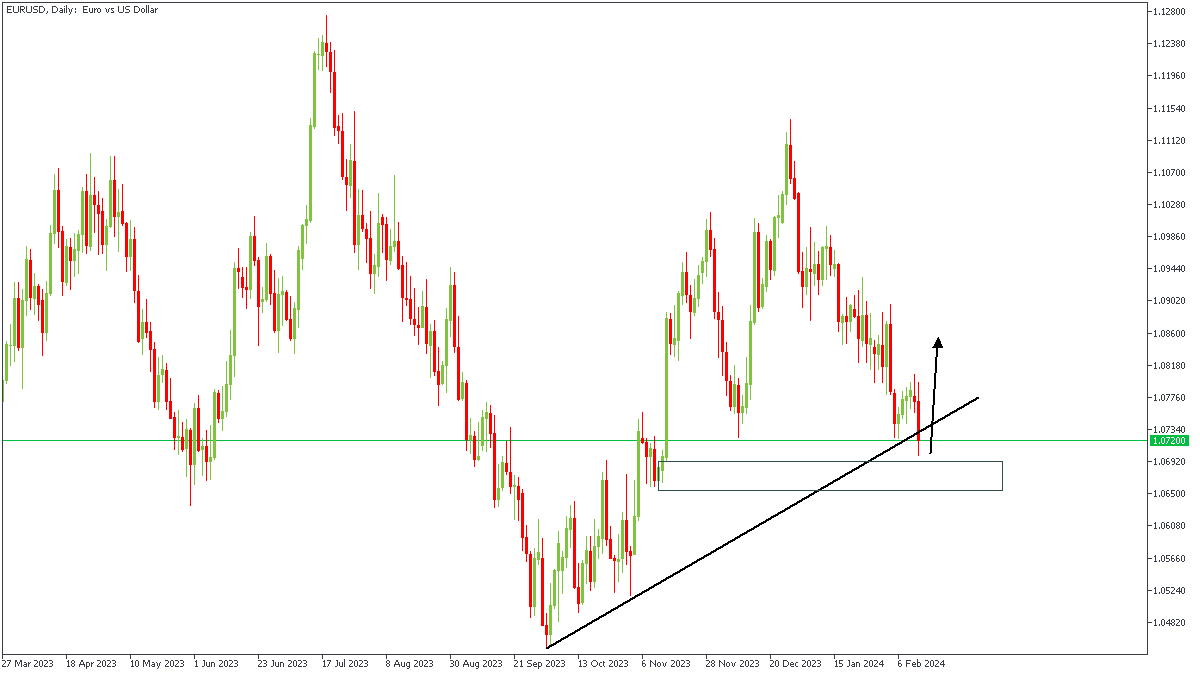
EURUSD - D1 Timeframe
The price action on the Daily timeframe of EURUSD has reached a crucial zone, as shown by the overlapping of the trendline support and the demand zone which come together to provide ample confluence for the bullish sentiment to play out. Here, I expect to see price retest the previous high before any further decline in prices.
Analyst’s Expectations:
- Direction: Bullish
- Target: 1.07717
- Invalidation: 1.06511
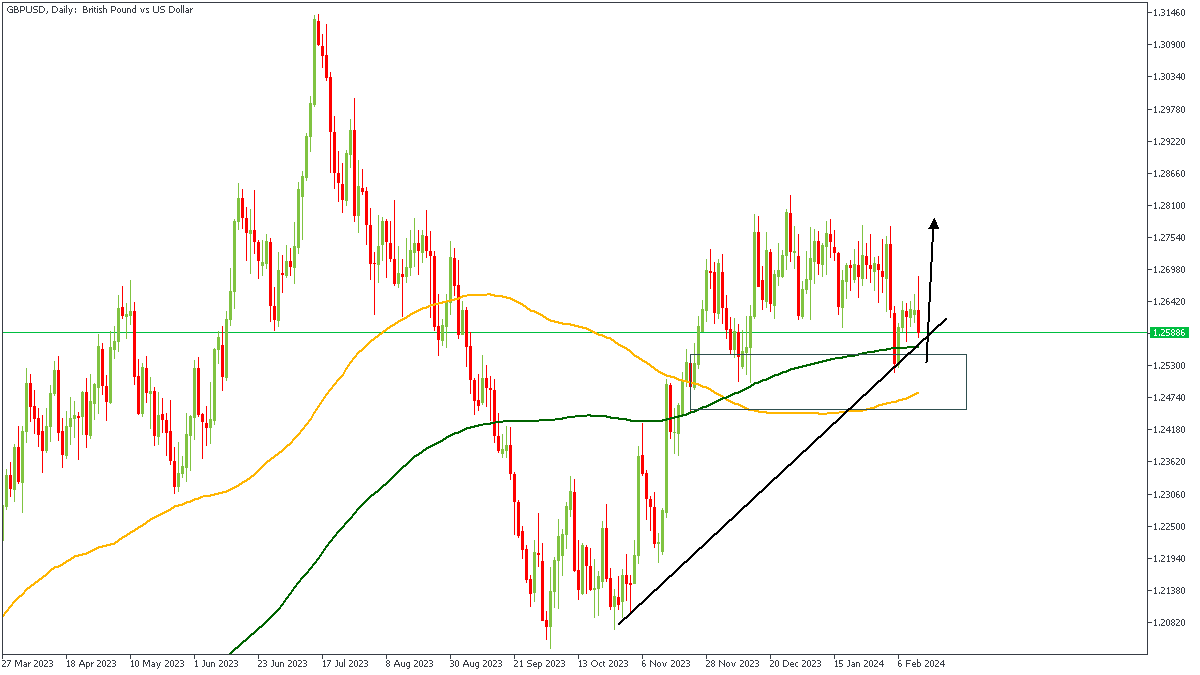
GBPUSD - D1 Timeframe
Asides the 100 and 200 period moving averages that are expected to serve as support areas for the price action on GBPUSD, we also see the demand zone on the daily timeframe currently being retested. At the moment, the most logical expectation from this is a bullish sentiment, since the trendline support can be considered another major confluence.
Analyst’s Expectations:
- Direction: Bullish
- Target: 1.27359
- Invalidation: 1.24482
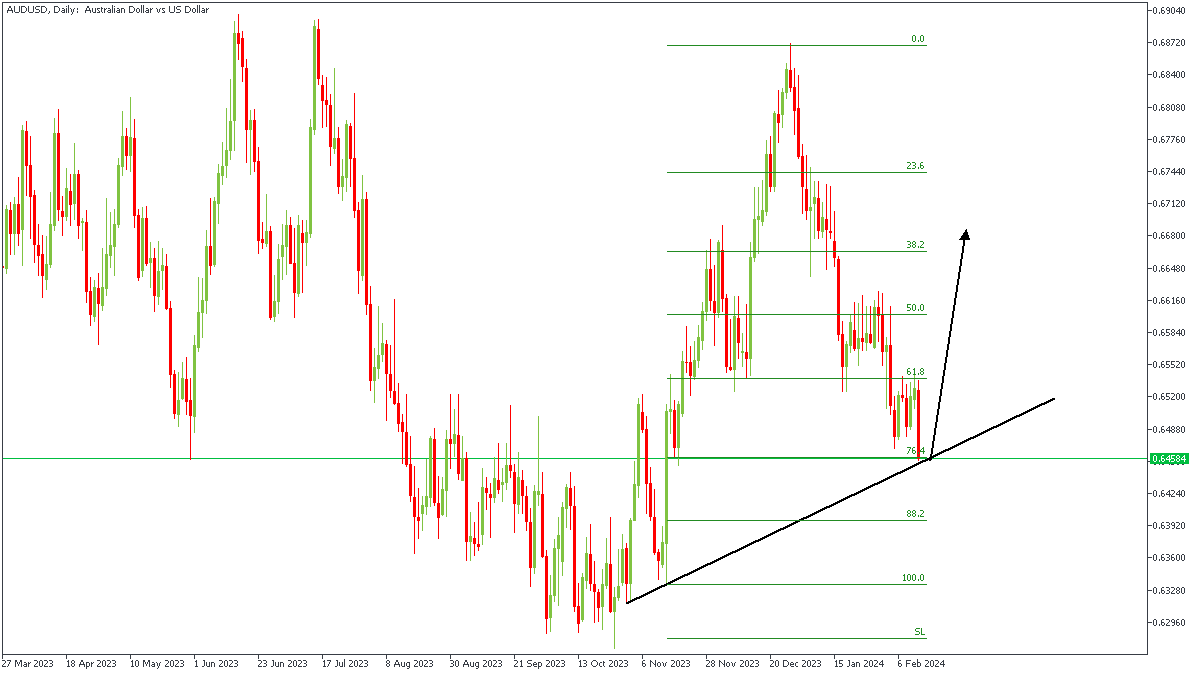
AUDUSD - D1 Timeframe
The current price action on the Daily timeframe of AUDUSD is sitting on the 76% of the Fibonacci retracement of the initial bullish move that broke structure. Following this, price also formed a trendline support, which provides further arguments in favour of the bullish sentiment.
Analyst’s Expectations:
- Direction: Bullish
- Target: 0.66641
- Invalidation: 0.63318
CONCLUSION
The trading of CFDs comes at a risk. Thus, to succeed, you have to manage risks properly. To avoid costly mistakes while you look to trade these opportunities, be sure to do your due diligence and manage your risk appropriately.