Sample Category Title
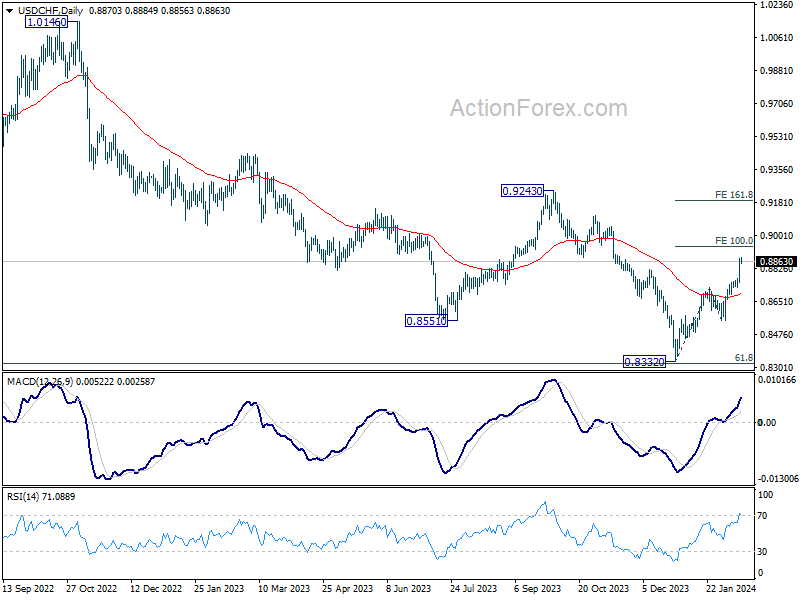
USD/CHF Mid-Day Outlook
Daily Pivots: (S1) 0.8786; (P) 0.8833; (R1) 0.8919; More....
USD/CHF's rally from 0.8332 is still in progress, and intraday bias stays on the upside. Next target is 100% projection of 0.8332 to 0.8727 from 0.8550 at 0.8954. Firm break there will pave the way to 161.8% projection at 0.9189. On the downside, below 0.8816 minor support will turn intraday bias neutral first. But retreat should be contained well above 0.8550 support to bring another rally.
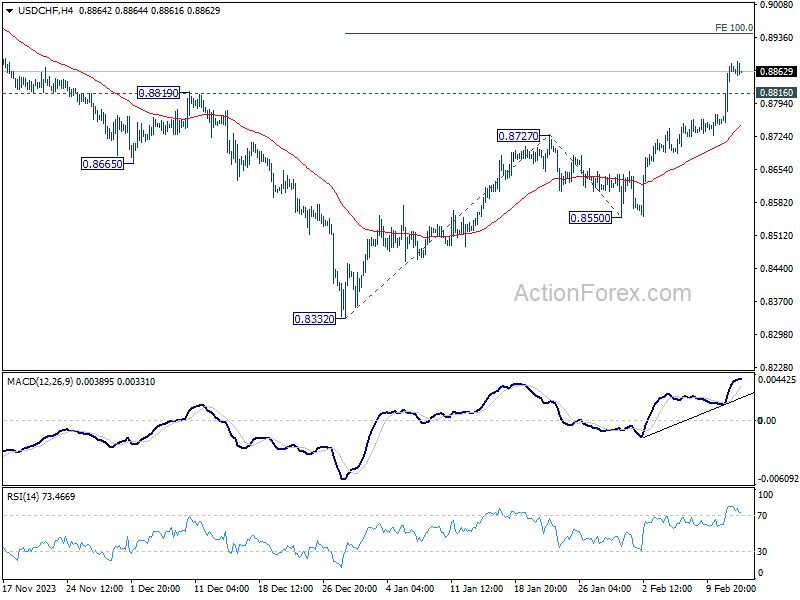
In the bigger picture, a medium term bottom should be formed at 0.8332, on bullish convergence condition in W MACD, just ahead of 0.8317 long term fibonacci support, on bullish convergence condition in W MACD. It's still early to decide if the larger down trend from 1.0146 (2022 high) is reversing. But further rise should be seen to 0.9243 resistance even as a correction.
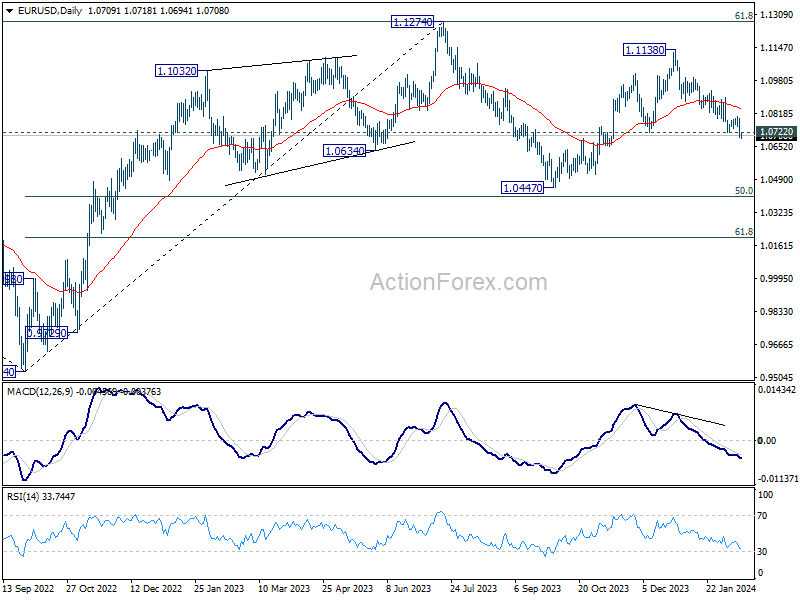
EUR/USD Mid-Day Outlook
Daily Pivots: (S1) 1.0674; (P) 1.0736; (R1) 1.0772; More...
EUR/USD's fall from 1.1138 is in progress and intraday bias remains on the downside. Current development argues that whole rise from 1.0447 has already finished. Deeper decline would be seen back to this 1.0447 support. On the upside, break of 1.0804 resistance is needed to signal short term bottoming. Otherwise, outlook will remain bearish in case of recovery.
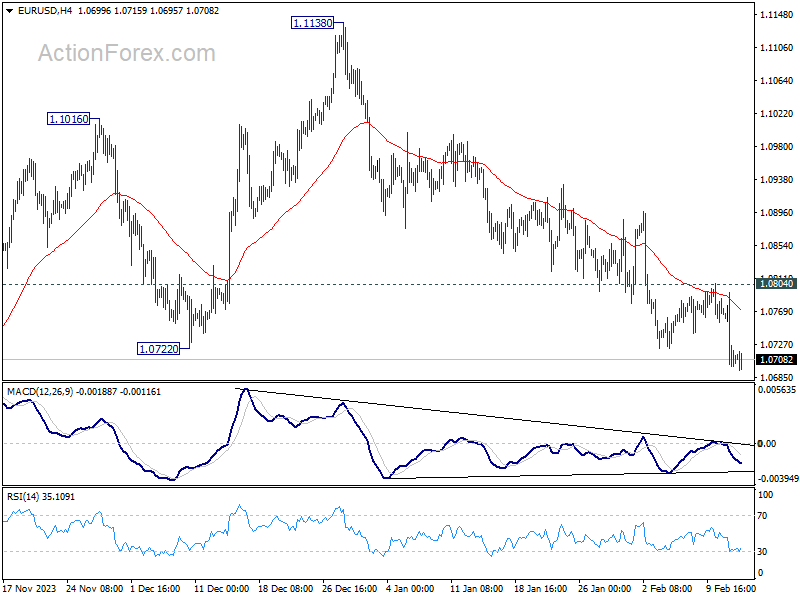
In the bigger picture, price actions from 1.1274 are viewed as a corrective pattern to rise from 0.9534 (2022 low). Rise from 1.0447 is seen as the second leg. While further rally could cannot be ruled out, upside should be limited by 1.1274 to bring the third leg of the pattern. Meanwhile, sustained break of 1.0722 support will argue that the third leg has already started for 1.0447 and possibly below.
GBP/USD Mid-Day Outlook
Daily Pivots: (S1) 1.2549; (P) 1.2617; (R1) 1.2661; More...
GBP/USD dips notably today but stays above 1.2517 support. Intraday bias remains neutral for the now. On the upside, break of 1.2691 resistance will indicate that correction from 1.2826 has completed. Intraday bias will be back on the upside for retesting 1.2826. Nevertheless, decisive break of 1.2499 will argue that whole rise from 1.2036 has completed and turn near term outlook bearish.
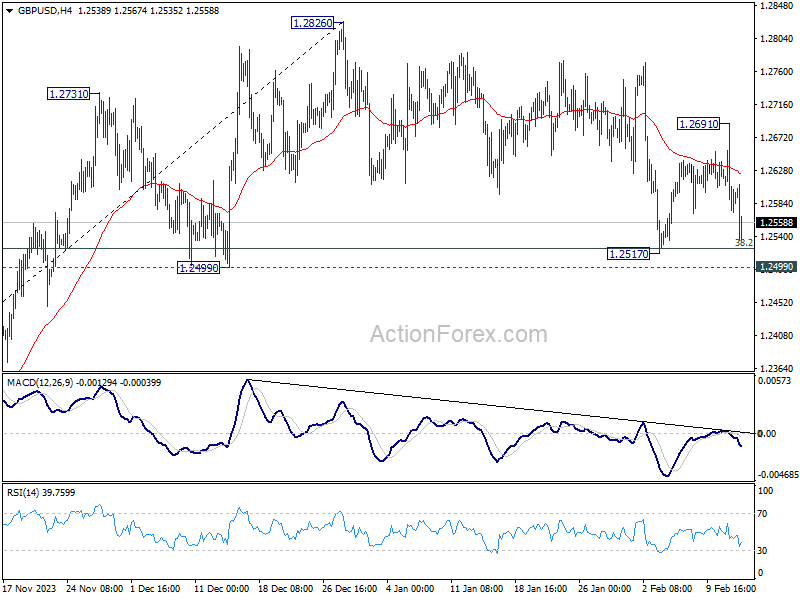
In the bigger picture, price actions from 1.3141 medium term top are seen as a corrective pattern to up trend from 1.0351 (2022 low). Rise from 1.2036 is seen as the second leg, which could be still in progress. But upside should be limited by 1.3141 to bring the third leg of the pattern. Meanwhile, break of 1.2499 support will argue that the third leg has already started for 38.2% retracement of 1.0351 (2022 low) to 1.3141 at 1.2075 again.
UK Inflation Data Tempers Sterling, But Impact Limited
Sterling is taking a modest step back today, responding to UK's latest inflation report that came in below market expectations. Despite this, the actual figures for both headline and core CPI merely held their ground compared to the previous month's readings, signaling continued pause in disinflationary progress. Additionally, the report highlighted a slight uptick in services inflation.
Consequently, the data underscores a lingering necessity for the BoE to adopt a wait-and-see approach, and data more economic data before acting on interest rate. August still appears more feasible than an earlier first cut in May. Consequently, Sterling's reaction was measured, reflecting a cautious recalibration of expectations rather than a drastic reassessment of the BoE's monetary policy path
In the broader currency market, Dollar softens slightly today, taking a moment to consolidate after achieving significant gains earlier in the week. Euro and Swiss Franc found themselves on the softer side as well. Conversely, Australian Dollar found favor among traders, buoyed by an easing in risk aversion. Yen's performance is mixed, showing indifference to Japan's verbal interventions amid its depreciation past the 150 mark against Dollar.
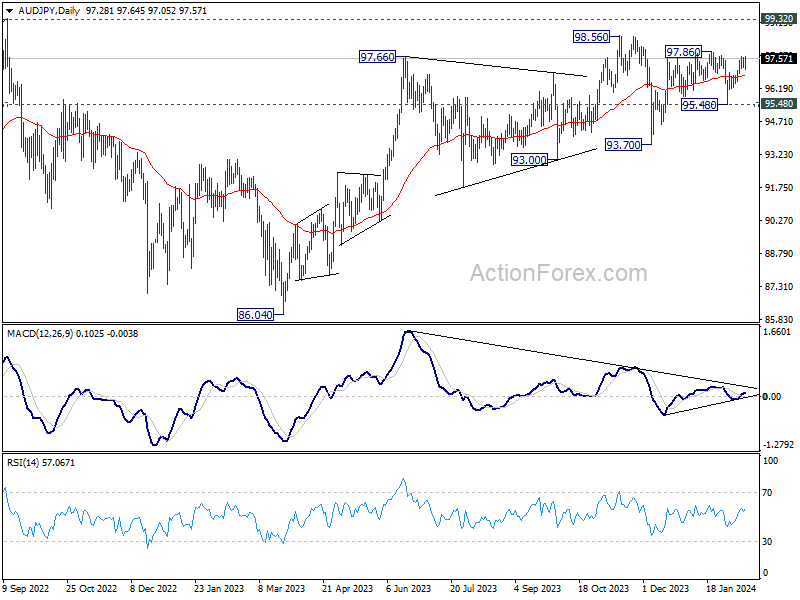
AUD/JPY is a pair to watch in the upcoming Asian session, with Japan GDP and Australia employment data due. The cross rebounded strong strong after a brief dip to 95.48 earlier in the month. Further rise is mildly in favor and break of 97.86, or even 98.56, could be seen. However, based on current momentum. Upside would likely be limited by 99.32 (2022 high).
In Europe, at the time of writing, FTSE is up 0.87%. DAX is up 0.35%. CAC is up 0.59%. UK 10-year yield is down -0.067 at 4.088. Germany 10-year yield is down -0.022 at 2.375. Earlier in Asia, Nikkei fell -0.69%. Hong Kong HSI rose 0.84%. Singapore Strait Times fell -0.09%. Japan 10-year JGB yield rose 0.0304 to 0.760.
ECB's de Guindos: we must not get ahead of ourselves
ECB Vice President Luis de Guindos acknowledged in a speech that inflation is moving "on the right track" towards target. But he also pointed out several factors that could derail progress.
De Guindos highlighted "wage pressures" as a crucial factor yet to show signs of easing, alongside the potential for "profit margins" to remain robust. Furthermore, he pointed to "heightened geopolitical tensions," especially in the Middle East, as a risk that could lead to increased energy prices and disrupt global trade, complicating the inflation outlook.
"While we are heading in the right direction, we must not get ahead of ourselves," he said, indicating that it would take "some more time" to gather necessary data to confirm that inflation is on a stable path towards 2% target.
The coming months are expected to provide crucial insights into underlying inflation drivers, with forthcoming data on wage settlements and firms' pricing behaviors, along with new economic projections in March, set to inform ECB's future policy decisions.
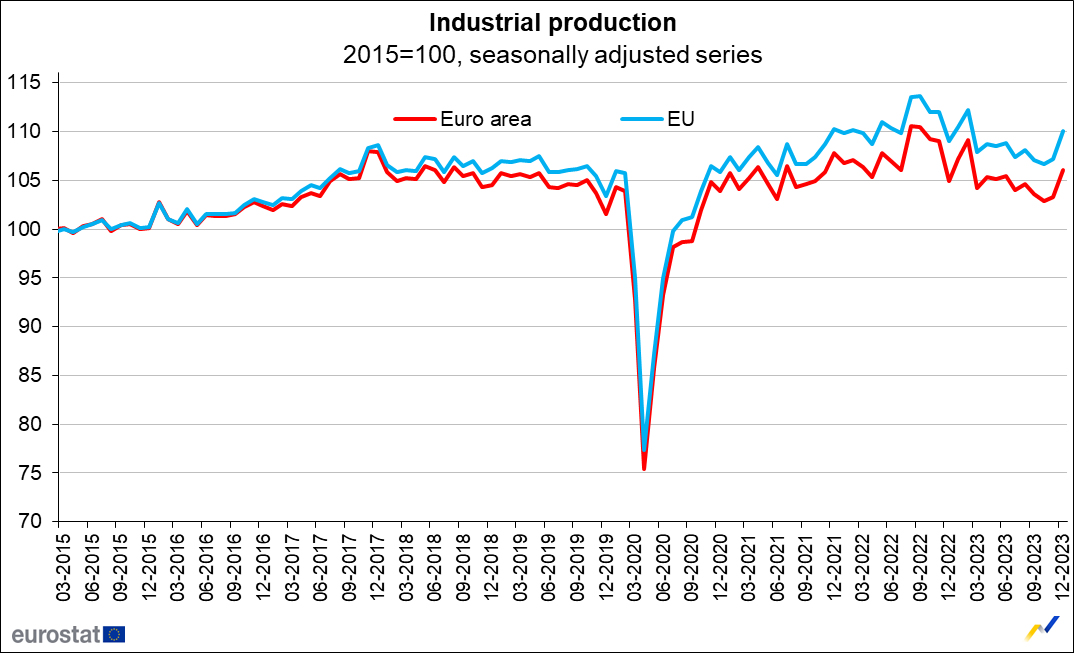
Eurozone industrial production rises 2.6% mom in Dec, vs exp -0.3% mom
Eurozone industrial production rose 2.6% mom in December, much better than expectation of -0.3% mom decline. Production grew by 20.5% for capital goods, by 0.5% for durable consumer goods, by 0.3% for energy and by 0.2% for non-durable consumer goods, while production fell by -1.2% for intermediate goods.
EU industrial production also rose 2.6% mom. Among Member States for which data are available, the highest monthly increases were registered in Ireland (+23.5%), the Netherlands (+6.6%) and Denmark (+5.6%). The largest decreases were observed in Slovenia (-7.4%), Croatia (-4.3%) and Finland (-2.7%).
UK CPI and core unchanged in Jan, at 4.0% and 5.1%
UK CPI fell -0.6% mom in January, below expectation of -0.3% mom. Annually, CPI was unchanged at 4.0% yoy, below expectation of 4.1% yoy.
Core CPI (excluding energy, food, alcohol and tobacco) was also unchanged at 5.1% yoy, below expectation of 5.2% yoy. CPI goods slowed from 1.9% yoy to 1.8% yoy. CPI services accelerated from 6.4% yoy to 6.5% yoy.
The largest upward contribution to the monthly change in both CPI annual rates came from housing and household services (principally higher gas and electricity charges), while the largest downward contribution came from furniture and household goods, and food and non-alcoholic beverages.
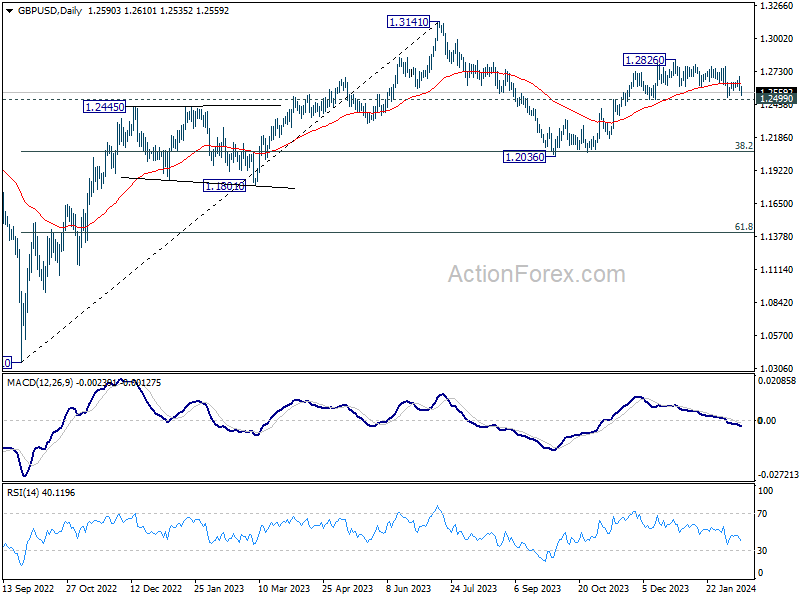
GBP/USD Mid-Day Outlook
Daily Pivots: (S1) 1.2549; (P) 1.2617; (R1) 1.2661; More...
GBP/USD dips notably today but stays above 1.2517 support. Intraday bias remains neutral for the now. On the upside, break of 1.2691 resistance will indicate that correction from 1.2826 has completed. Intraday bias will be back on the upside for retesting 1.2826. Nevertheless, decisive break of 1.2499 will argue that whole rise from 1.2036 has completed and turn near term outlook bearish.
In the bigger picture, price actions from 1.3141 medium term top are seen as a corrective pattern to up trend from 1.0351 (2022 low). Rise from 1.2036 is seen as the second leg, which could be still in progress. But upside should be limited by 1.3141 to bring the third leg of the pattern. Meanwhile, break of 1.2499 support will argue that the third leg has already started for 38.2% retracement of 1.0351 (2022 low) to 1.3141 at 1.2075 again.
Economic Indicators Update
| GMT | Ccy | Events | Actual | Forecast | Previous | Revised |
|---|---|---|---|---|---|---|
| 07:00 | GBP | CPI M/M Jan | -0.60% | -0.30% | 0.40% | |
| 07:00 | GBP | CPI Y/Y Jan | 4.00% | 4.10% | 4.00% | |
| 07:00 | GBP | Core CPI Y/Y Jan | 5.10% | 5.20% | 5.10% | |
| 07:00 | GBP | RPI M/M Jan | -0.30% | -0.10% | 0.50% | |
| 07:00 | GBP | RPI Y/Y Jan | 4.90% | 5.20% | 5.20% | |
| 07:00 | GBP | PPI Input M/M Jan | -0.80% | 0.00% | -1.20% | -0.40% |
| 07:00 | GBP | PPI Input Y/Y Jan | -3.30% | -3.00% | -2.80% | -2.10% |
| 07:00 | GBP | PPI Output M/M Jan | -0.20% | -0.20% | -0.60% | -0.50% |
| 07:00 | GBP | PPI Output Y/Y Jan | -0.60% | -0.50% | 0.10% | |
| 07:00 | GBP | PPI Core Output M/M Jan | 0.20% | 0.00% | -0.10% | |
| 07:00 | GBP | PPI Core Output Y/Y Jan | -0.40% | 0.10% | 0.00% | |
| 10:00 | EUR | Eurozone GDP Q/Q Q4 P | 0.00% | 0.00% | 0.00% | |
| 10:00 | EUR | Eurozone Employment Change Q/Q Q4 P | 0.30% | 0.20% | 0.20% | |
| 10:00 | EUR | Eurozone Industrial Production M/M Dec | 2.60% | -0.30% | -0.30% | 0.40% |
| 15:30 | USD | Crude Oil Inventories | 3.3M | 5.5M |
US Stock Market Bulls Facing a Reality Check (3 Ominous Signs to Watch)
- Goods-based inflationary pressures in the US may resurface in H2 2024 due to leading bullish momentum built-up in commodities.
- Persistent low correlation readings among S&P 500 constituents may trigger a spike in the VIX.
- The leading Nasdaq 100 has displayed bearish reversal elements.
The US stock market continued to hit another milestone last week when the benchmark S&P 500 recorded 14 weekly gains in the past 15 weeks as of 9 February 2024, its longest winning streak since 1972.
Overall, among the major US benchmark stock indices, the rally has been led by the Nasdaq 100 which recorded a year-to-gain of 8.56% as of 9 February surpassing the S&P 500 (+6.04%) and the S&P 500 equal-weighted exchange-traded fund (+0.68%) over the same period.
The bulk of the Nasdaq 100’s rally has been attributed to the top 7 mega capitalization US stocks in which the Artificial Intelligence (AI) theme play juggernaut, NVIDIA rose by +44.50%, almost 5 times more than the Nasdaq 100 (see Fig 1).
AI theme play is leading the bullish camp (again)
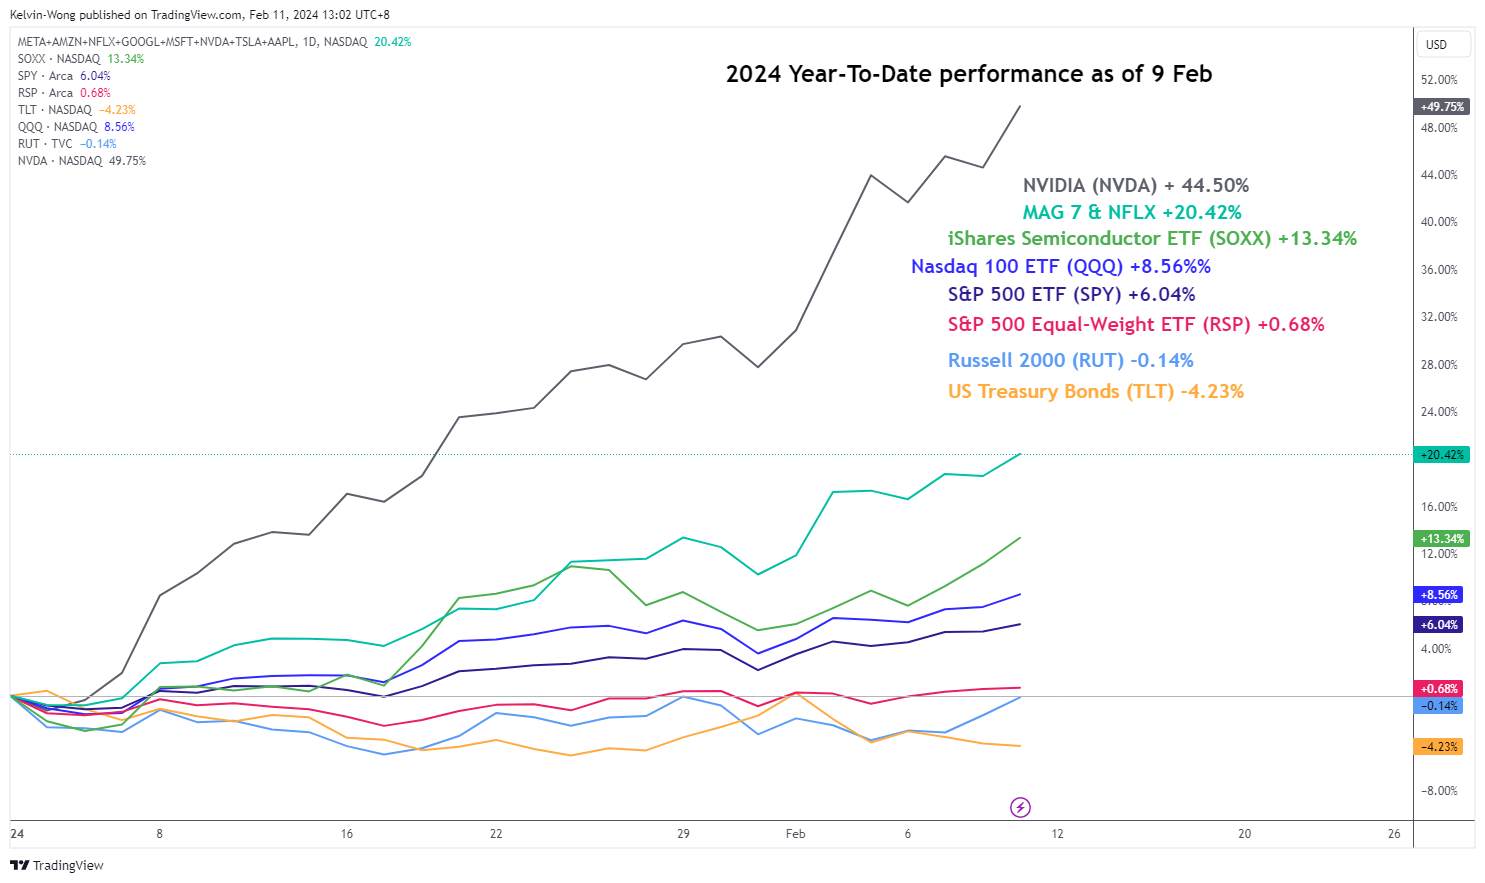
Fig 1: Year-to-date performance of major US benchmark stock indices & key ETFs as of 9 Feb 2024 (Source: TradingView, click to enlarge chart)
The hotter-than-expected US CPI inflation data for January 2024 for both headline and core components halted the “Fed dovish pivot optimism” in play since late last year that killed off the highly anticipated first Fed funds rate cut that was priced in earlier for the upcoming March’s FOMC meeting and further pushed back the expectations to the June monetary policy meeting (77% chance based on CME FedWatch Tool as of 14 February 2024).
Also, the number of expected rate cuts has been reduced from six (after last December’s FOMC meeting) to four at this juncture, almost in line with the median projection of three cuts inferred from the latest Fed’s dot-plot (summary of economic projections) released in last December.
Before yesterday’s sell-off seen in all the major US benchmark stock indices; S&P 500 (-1.37%), Nasdaq 100 (-1.58%), Dow Jones Industrial Average (-1.35%), and Russell 2000 (-3.96%), three potential ominous signs are flashing out to warn the rampant bulls that are riding on the coattails of AI and Fed dovish pivot optimism.
Goods-based inflation in the US may see an uptick next
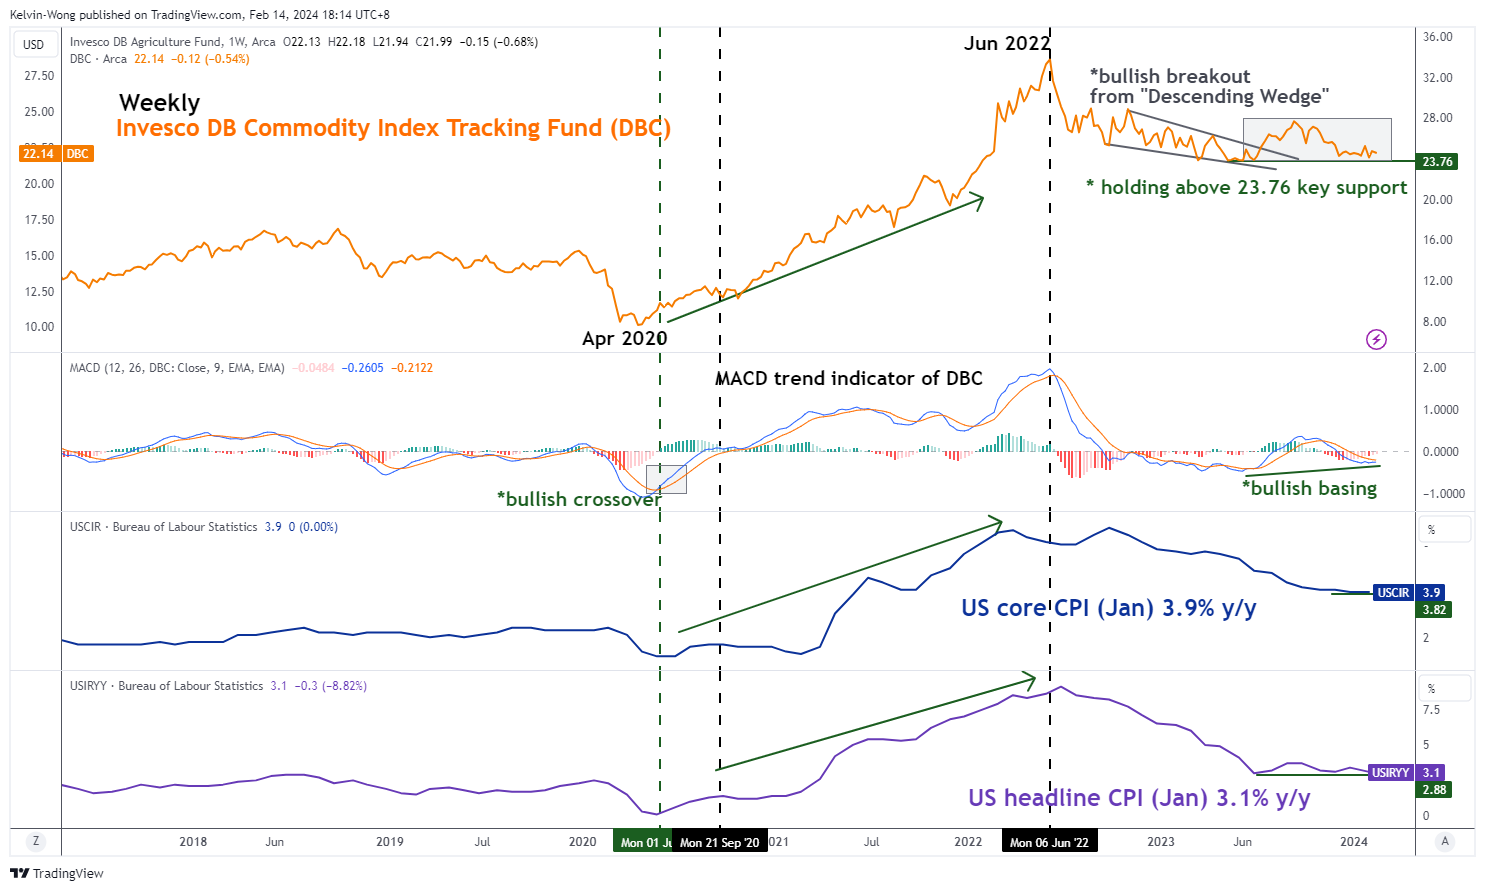
Fig 2: Invesco DB Commodity Index Tracking Fund major trend with US CPI as of 14 Feb 2024 (Source: TradingView, click to enlarge chart)
The firmer US CPI inflation data for January that has risen above forecasts has been primarily driven by the service components of the CPI basket. The supercore services inflation (CPI excluding food, energy & shelter) increased to 4.4% y/y in January from 3.9% y/y in December 2023, an eight-month high while headline inflation dipped lower to 3.1% y/y in January from 3.4% y/y in December 2023.
Headline inflation or primarily goods-based inflation (including food & energy) has a high direct linkage to prices of tradable commodities.
Using the Invesco DB Commodity Index Tracking Fund (DBC), a broad-based commodities futures exchange-traded fund with its highest weightage holding of 56% concentrated in energy-related futures and 21% (second highest) weightage in agriculture-related futures in conjunction with the trend movements of both the US headline and core CPI y/y rates to conduct an intermarket analysis.
Based on historical price actions, movements seen in the DBC tend to lead over the headline and core CPI inflation trends. Before the recent significant upsurge in the US inflation rates from September 2020 to June 2022, the weekly MACD trend indicator of the DBC flashed a bullish crossover signal earlier in June 2020 that preceded the change of DBC’s major trend from bearish to bullish.
A similar positive element can be detected in the most recent movement of the weekly MACD trend indicator of DBC where it has started to form a bullish basing formation (higher lows from June 2023 to January 2024).
If history plays out again, the current positive momentum element inherent in the DBC may lead to at least a further potential medium-term upmove in DBC which in turn could translate to a possible uptick in inflationary pressures in the real economy in H2 2024 that may put the Fed dovish pivot narrative in jeopardy.
Apersistent low correlation reading among S&P 500 constituents
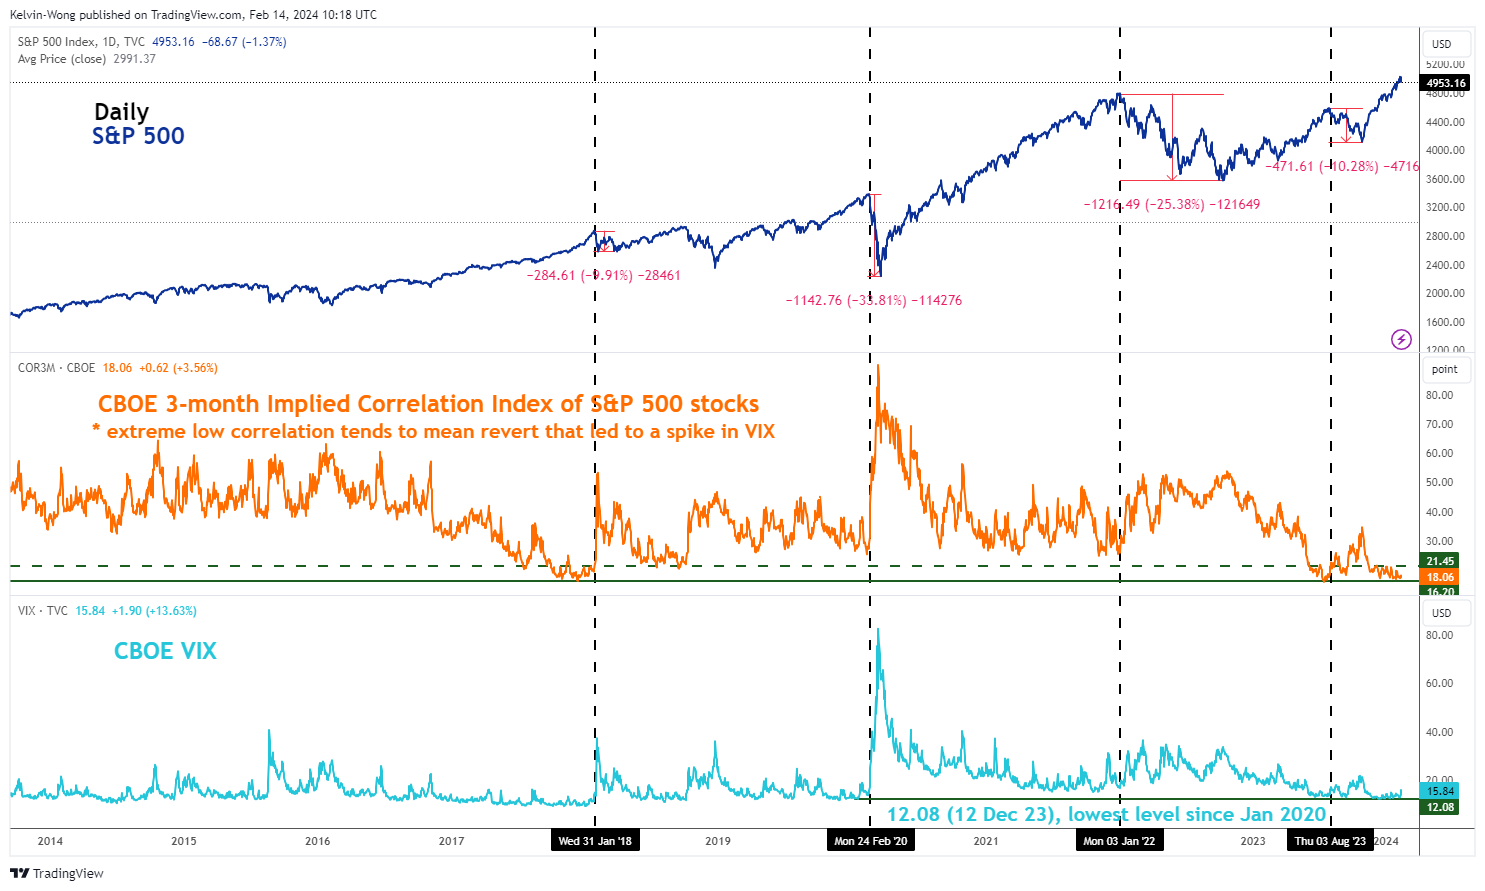
Fig 3: CBOE VIX & 3-month implied correlation index of S&P 500 constituents as of 14 Feb 2024 (Source: TradingView, click to enlarge chart)
Another interesting point to note is the recent plunge in the VIX (implied volatility of the S&P) to a 3-year low of 12.08 on 12 December 2023 which in turn coincided with market participants’ perceptions of future low correlation readings (higher dispersion of returns on the average) among the US S&P 500 index constituents.
The CBOE 3-month Implied Correlation Index which measures the 3-month expected correlation across the top 50 value-weighted S&P 500 constituents has slipped to a low reading of 17.10 on 13 December 2023 which is close to a 6-year low of 16.20 that was met recently on 18 July 2023 (see Fig 2).
A relative “low calm” level of the CBOE 3-month Implied Correlation Index is likely not going to last forever. Based on past occurrences, a break above 21.45 on the CBOE 3-month Implied Correlation Index after a prior low depressed level has led to a spike in the VIX which in turn saw a decline of -10% in the S&P 500 from January 2018 to March 2018 and most recently a loss of -10.3% from August 2023 to October 2023.
The leading Nasdaq 100 has shaped a potential bearish reversal configuration
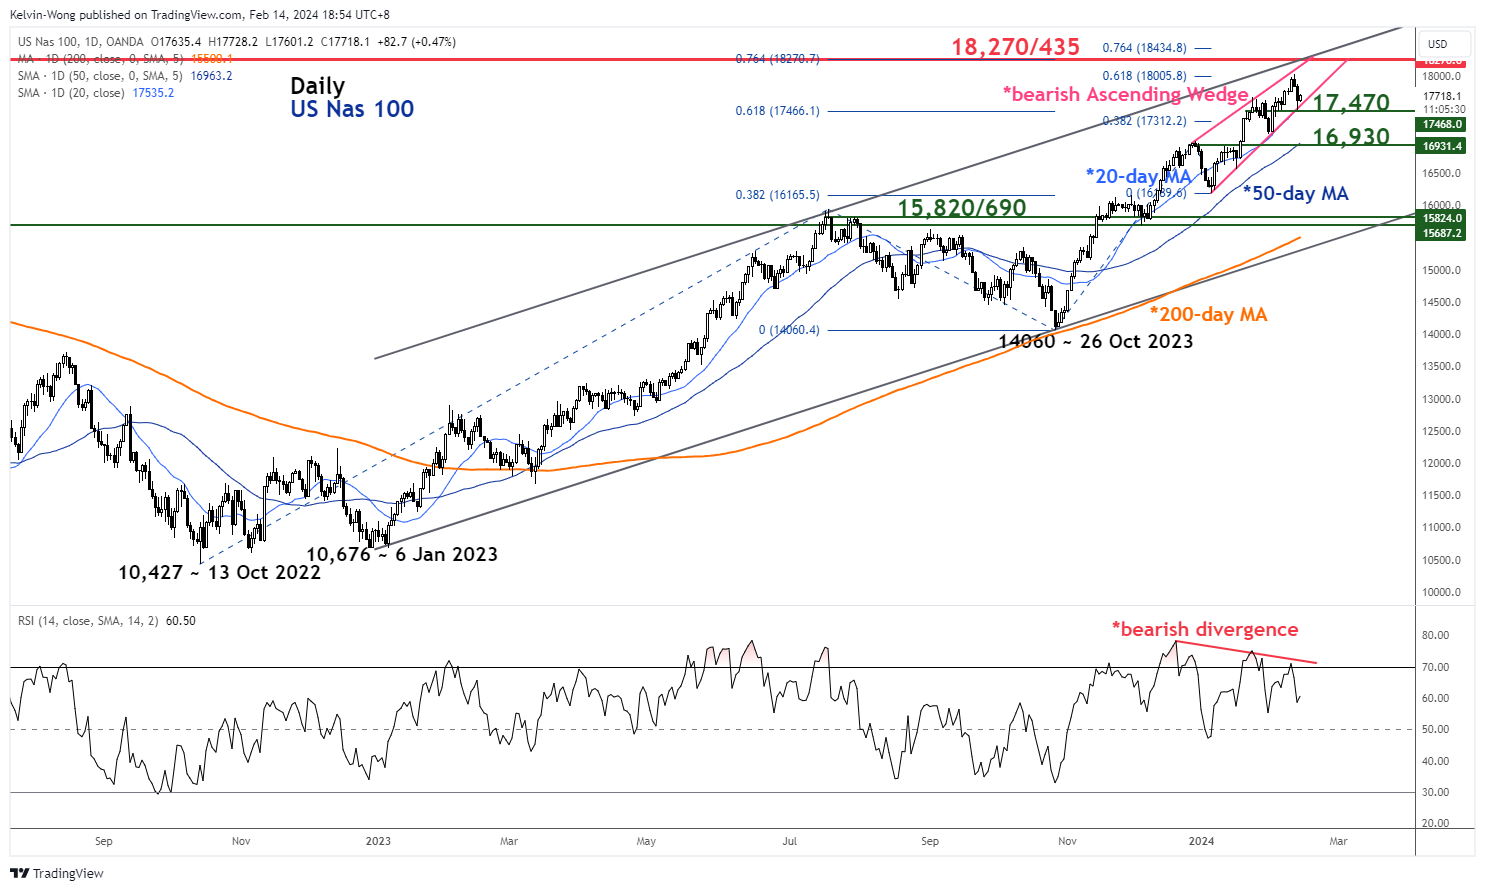
Fig 4: US Nas 100 medium-term & major trends as of 14 Feb 2024 (Source: TradingView, click to enlarge chart)
The recent eight weeks of price action movement seen in the US Nas 100 Index (a proxy for the Nasdaq 100 futures) has traced out an impending bearish reversal “Ascending Wedge” configuration as seen on its daily chart.
The appearance of the bearish “Ascending Wedge” coupled with a triple bearish divergence condition seen on the daily RSI momentum indicator at its overbought region suggests a weakening upside momentum despite the Index hitting a recent fresh all-time high of 18,043 on Monday, 12 February.
These observations suggest that the recent major uptrend phase in place since the 13 October 2022 low of 10,427 may be approaching a terminal point soon and a potential multi-week corrective decline may unfold next.
The potential terminal resistance zone stands at 18,270/435 which confluences with the intersection of the upper boundaries of the major ascending channel and “Ascending Wedge” as well as a Fibonacci extension cluster level.
A break below the key near-term support of 17,470 (the lower boundary of the Ascending Wedge) and 20-day moving average) may trigger the start of the potential multi-week corrective decline with the next intermediate support coming in at 16,930 (50-day moving average) followed by the major support zone of 15,820/690 (also the 200-day moving average).
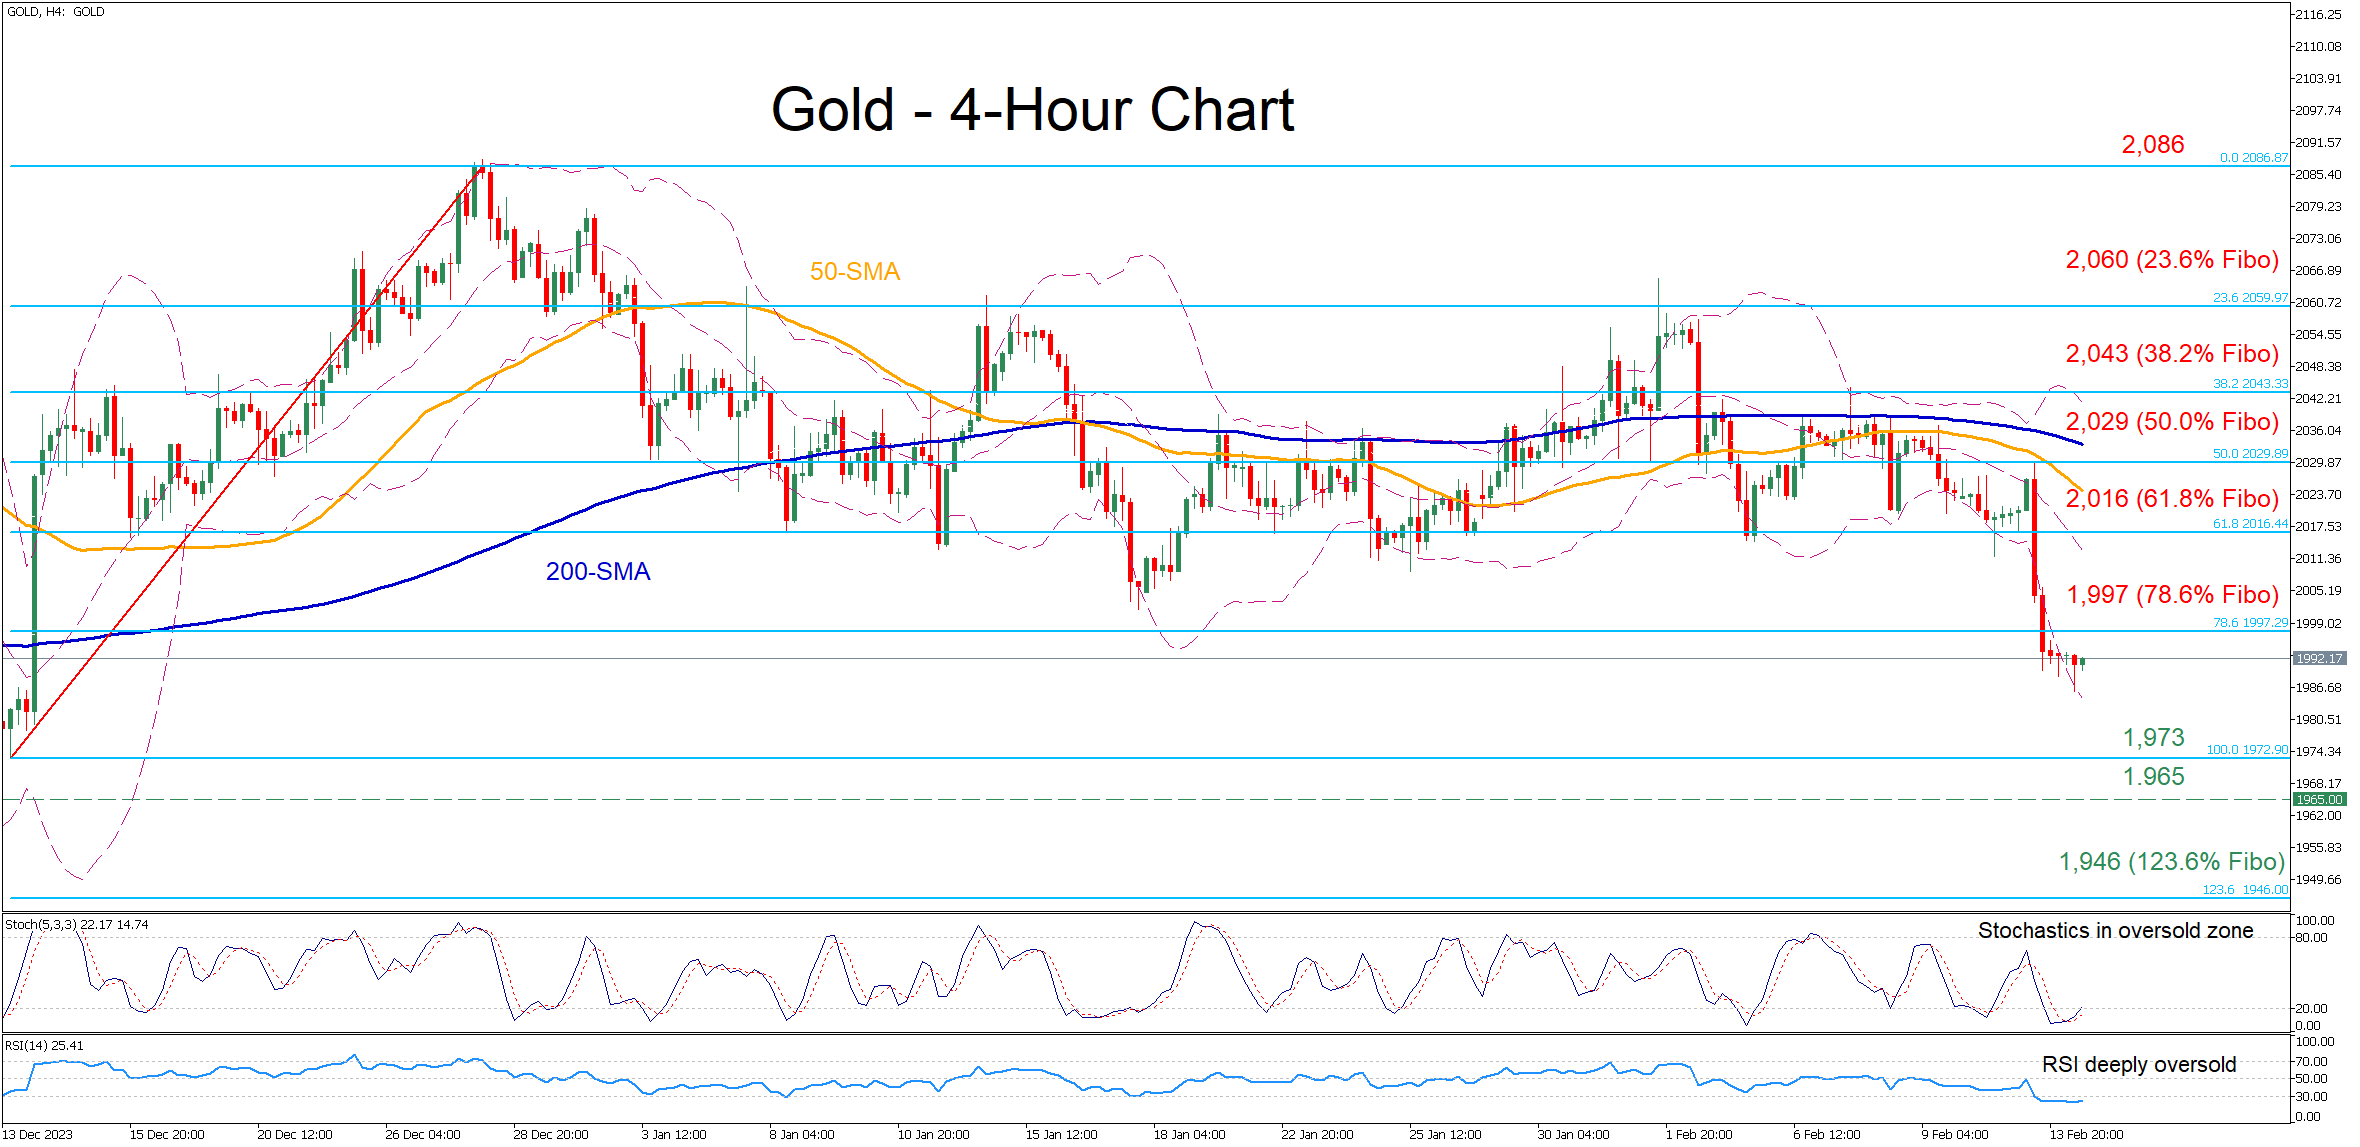
Gold Plummets Below 2,000
- Gold drops to its lowest since mid-December
- Breaks beneath the crucial 2,000 mark
- Oscillators point to extreme oversold conditions
Gold experienced a massive downward spike in the four-hour chart following the hotter-than-expected US CPI report on Tuesday, dropping to a fresh two-month low. The magnitude of the decline has been reflected in the momentum indicators, which are currently deep in their oversold territories.
Should the retreat resume, immediate support could be found at the December bottom of 1,973. Failing to halt there, bullion could test the November support of 1,965. A violation of that region could set the stage for 1,946, which is the 123.6% Fibonacci extension of the 1,973-2,086 upleg.
On the flipside, if the price rotates higher, the 78.6% Fibo of 1,997 could provide initial resistance. Conquering this barricade, the bulls could attack the 61.8% Fibo of 2,016 ahead of the 50.0% Fibo of 2,029. Surpassing the latter, the price might then test the 23.6% Fibo of 2,060, which held strong three times in January.
All in all, gold plummeted to a two-month bottom on the back of a hotter-than-expected US inflation print. However, traders should not rule out a comeback as the price has reached extremely oversold levels.
GBP/JPY – Eases From Fighs After Weaker UK Inflation Data
- UK inflation unchanged in January
- Markets expect BoE rate cut in Q2
- GBPJPY pares gains after hitting 8.5 year high
UK inflation data this morning will have been a welcome surprise for the Bank of England but there’s still a long way to go.
Unfavorable base effects were expected to lift headline and core CPI last month but in both cases, they stayed at the same level. A small win but a win nonetheless for the BoE.
It was already expected to fall back to target in the second quarter before rebounding a little later in the year and this now increases the possibility of inflation undershooting the 2% target in the coming months and not rebounding as strongly.
While it’s tempting to get carried away with the release – as markets have repeatedly over the last year – the BoE will need more evidence the inflation is running lower than it assumed a couple of weeks ago before it considers cutting rates.
But based on today and if repeated in the coming months, a second-quarter cut is very possible.
An exhausted rally or temporary reprieve?
The pound fell sharply against the yen after the data and continues to trade near the day’s lows.
GBPJPY Daily

Source – OANDA
This occurred shortly after the pair hit an eight-and-a-half-year high above 190 on Tuesday, seeing resistance around the rising trend line. It initially did so with decent momentum but the inflation data may have changed that.
The first test below now becomes the November to January highs followed by the rising trendline from the early January lows. A break of these could be a very bearish development.
Crypto Market Shows No Sign of Stopping
Market picture
Negative momentum in equities after the US inflation report triggered a quick correction but only attracted new buyers who saw it as an opportunity to buy cheaper.
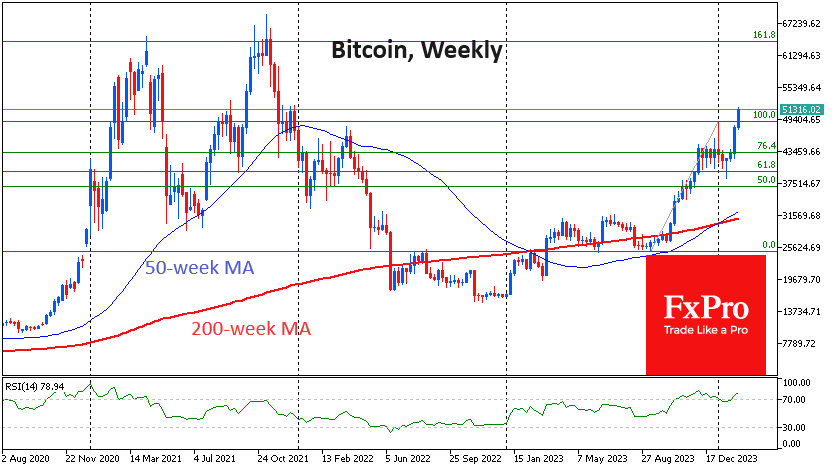
In 24 hours, the crypto market added another 1.5% to reach $1.91 trillion. Now, buying is concentrated in a narrow range of the largest coins. We are still in the relatively early stages of the global rally, where second and third-tier coins are not yet in high demand. The story is different for the top coins.
Bitcoin rose 2.2% in 24 hours to $51.2K and peaked at $51.7K. This is the upper limit of the December 2021 consolidation. Bitcoin may well see a shakeout in this area, as it did in September and December 2021. However, we believe this is part of a powerful bullish wave that could resume growth very quickly.
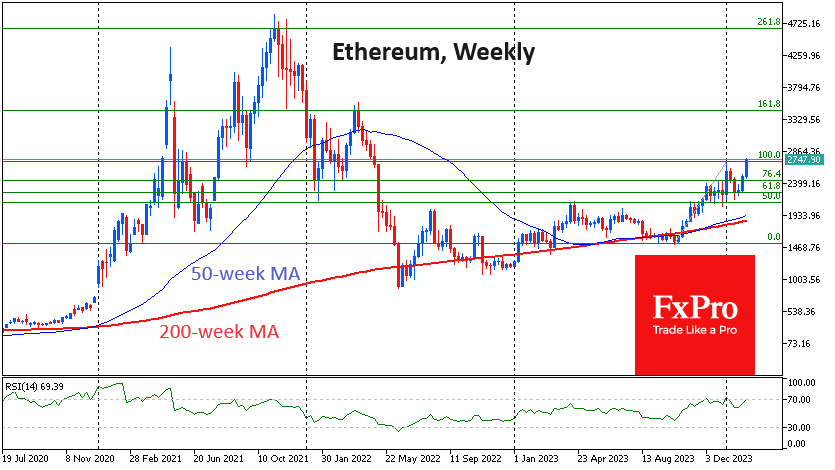
Ethereum has broken above $2700 for the first time since May 2022. The 15% rise in less than nine days suggests impressive buying interest after the bulls reloaded their positions in January. Possibly as part of a new wave of growth, ETH could quickly find itself approaching $3500 – returning to the April 2022 peak.
News Background
According to Deribit, bitcoin options traders have been betting on a rally to the $65K – $75K level before the end of the second quarter.
Michael van de Poppe, founder of MN Trading, noted that net inflows into spot bitcoin ETFs have exceeded $1.5 billion in the last three days and have reached $3.26 billion since 11 January.
CryptoJelleNL pointed out that BTC broke through the 0.618 Fibonacci retracement level for the first time ever before halving. According to him, this is “the strongest start to a new bull cycle in history”.
Since November 2023, long-term investors (hodlers) have taken around 148,000 BTC out of their wallets. According to Glassnode, this situation signals the start of profit-taking by this category of market participants.
The absence of spot bitcoin ETFs for ten years has held back investor demand for digital gold, said Michael Saylor, founder of MicroStrategy. He said: “BTC is in demand because it is not correlated to traditional risk assets, nor is it tied to any country, company, weather, supply chain, market cycle or competitor.”
The sentencing of Binance founder Changpeng Zhao on money laundering charges was postponed until 30 April. Zhao faces a maximum sentence of 18 months in prison. Prosecutors had previously announced their intention to seek a harsher sentence of up to 10 years.
Cryptocurrency market maker Wintermute, together with The Block, will launch the Global Markets Crypto Intelligence (GMCI) index to track the top 30 cryptocurrencies.
ECB’s de Guindos: we must not get ahead of ourselves
ECB Vice President Luis de Guindos acknowledged in a speech that inflation is moving "on the right track" towards target. But he also pointed out several factors that could derail progress.
De Guindos highlighted "wage pressures" as a crucial factor yet to show signs of easing, alongside the potential for "profit margins" to remain robust. Furthermore, he pointed to "heightened geopolitical tensions," especially in the Middle East, as a risk that could lead to increased energy prices and disrupt global trade, complicating the inflation outlook.
"While we are heading in the right direction, we must not get ahead of ourselves," he said, indicating that it would take "some more time" to gather necessary data to confirm that inflation is on a stable path towards 2% target.
The coming months are expected to provide crucial insights into underlying inflation drivers, with forthcoming data on wage settlements and firms' pricing behaviors, along with new economic projections in March, set to inform ECB's future policy decisions.
Eurozone industrial production rises 2.6% mom in Dec, vs exp -0.3% mom
Eurozone industrial production rose 2.6% mom in December, much better than expectation of -0.3% mom decline. Production grew by 20.5% for capital goods, by 0.5% for durable consumer goods, by 0.3% for energy and by 0.2% for non-durable consumer goods, while production fell by -1.2% for intermediate goods.
EU industrial production also rose 2.6% mom. Among Member States for which data are available, the highest monthly increases were registered in Ireland (+23.5%), the Netherlands (+6.6%) and Denmark (+5.6%). The largest decreases were observed in Slovenia (-7.4%), Croatia (-4.3%) and Finland (-2.7%).