Sample Category Title
Technical Outlook and Review
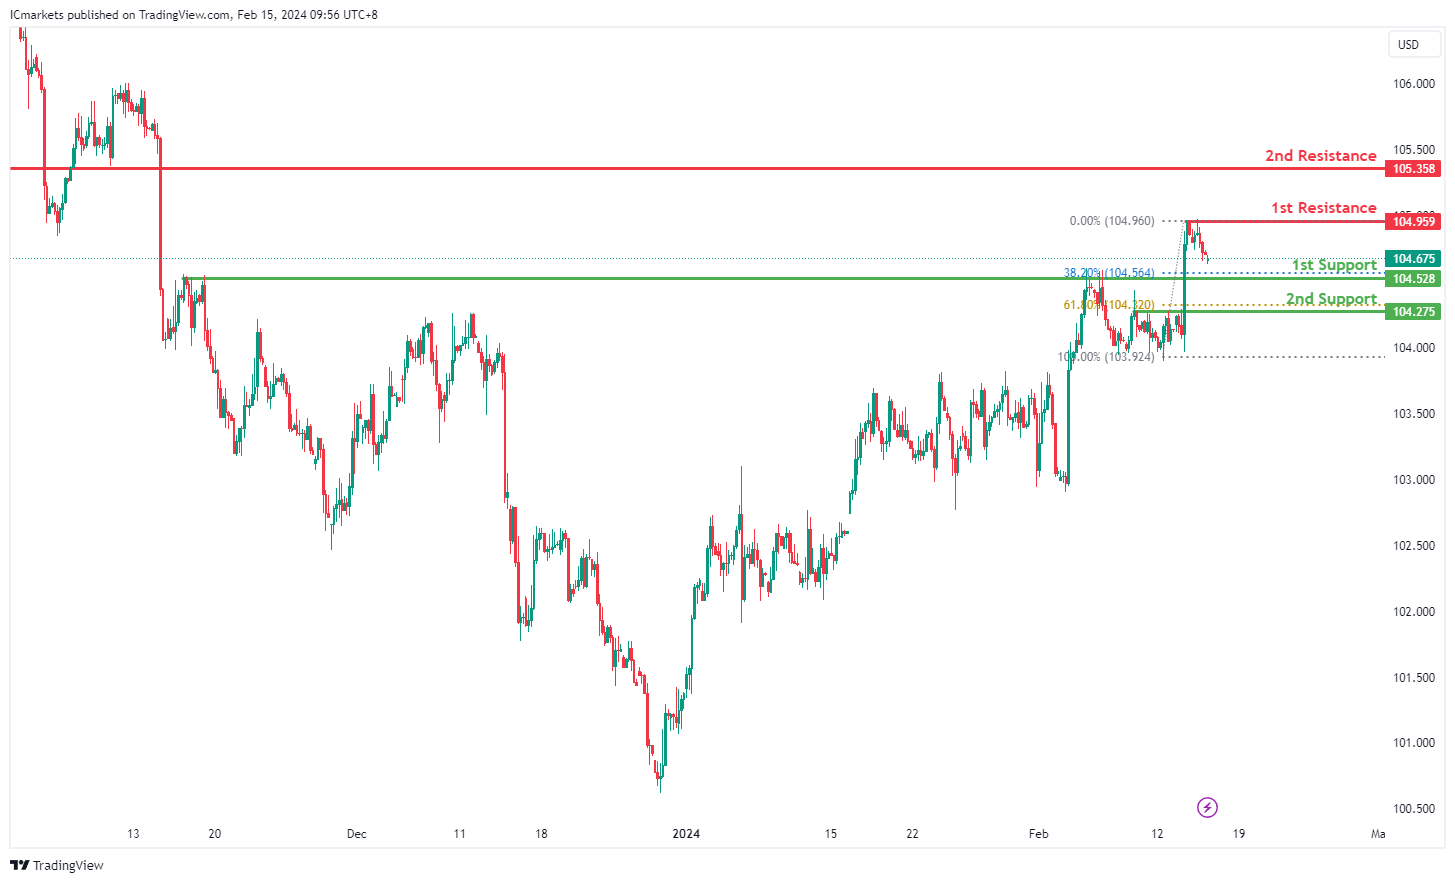
DXY:
The DXY chart currently indicates a bearish momentum, suggesting a potential continuation of the downward trend.
The 1st support level is situated at 104.52, identified as a pullback support. This level corresponds to the 38.20% Fibonacci Retracement, adding to its significance as a potential area where buying interest could emerge.
Additionally, the 2nd support at 104.27 is noted as another pullback support, coinciding with the 61.80% Fibonacci Retracement, further reinforcing its potential as a support zone.
On the resistance side, the 1st resistance level is positioned at 104.95, characterized as a multi-swing high resistance. This level may act as a barrier to upward movement, potentially triggering a reversal or a temporary halt in the downtrend.
Similarly, the 2nd resistance at 105.38 is identified as a pullback resistance, indicating another potential area where selling pressure may intensify.
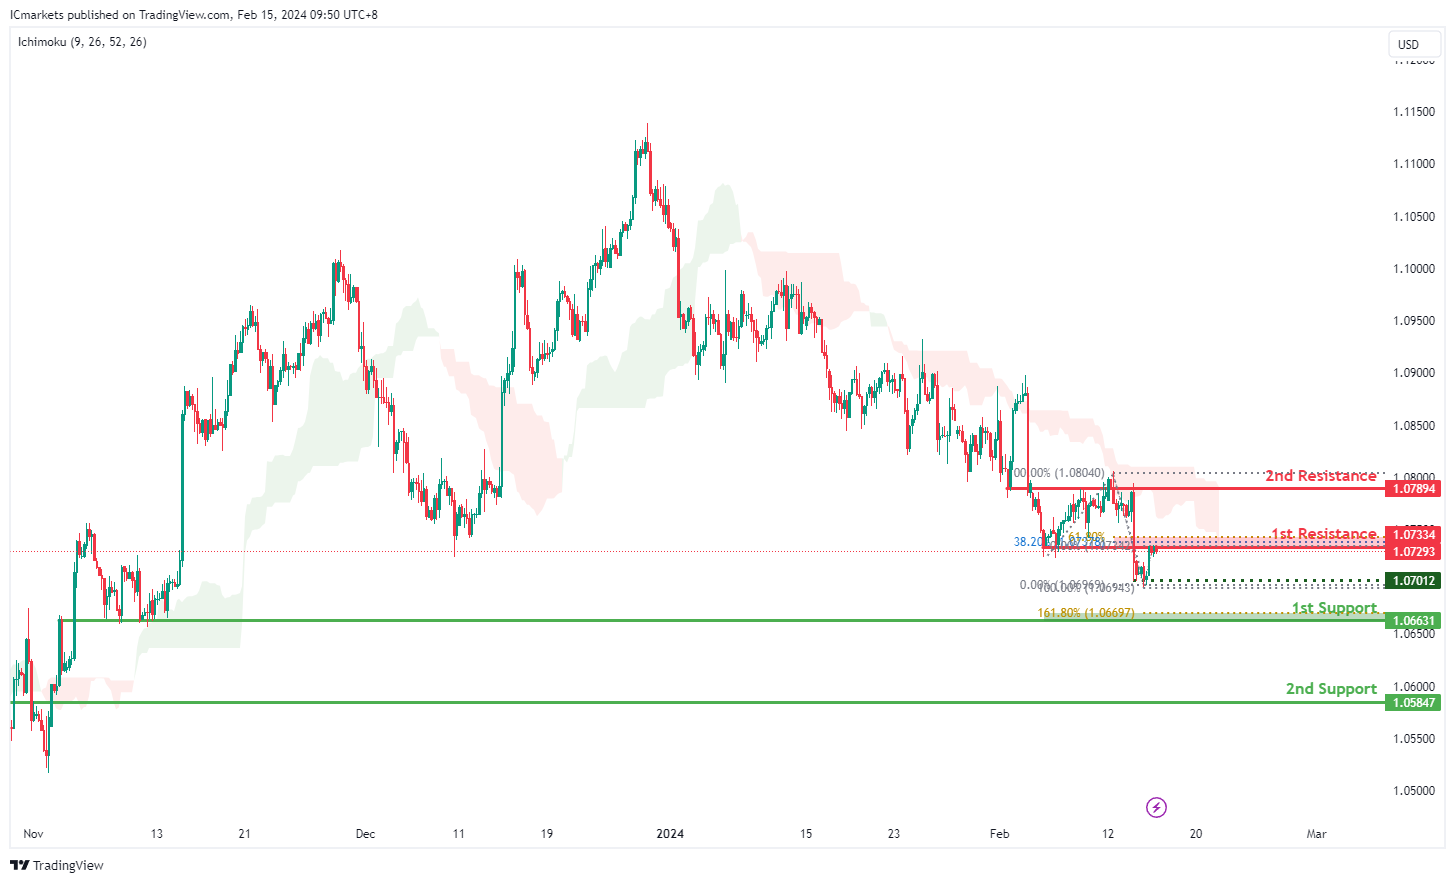
EUR/USD:
The EUR/USD chart currently exhibits a bearish momentum, with one of the contributing factors being that the price is below the bearish Ichimoku cloud.
Given this scenario, the price could potentially continue its bearish movement towards the 1st support level at 1.0663. This level is identified as an overlap support and coincides with the 161.80% Fibonacci Extension, enhancing its significance as a potential area of buying interest.
In addition, the 2nd support at 1.0584 is noted as a pullback support, suggesting another level where buyers might step in to support the price.
On the resistance side, the 1st resistance level at 1.0733 is characterized as an overlap resistance. This level is reinforced by the presence of the 61.80% Fibonacci Projection and the 38.20% Fibonacci Retracement, indicating Fibonacci confluence and suggesting a potential area of selling interest.
Furthermore, the 2nd resistance at 1.0789 is identified as another overlap resistance, adding to its significance as a potential barrier for further upside movement.
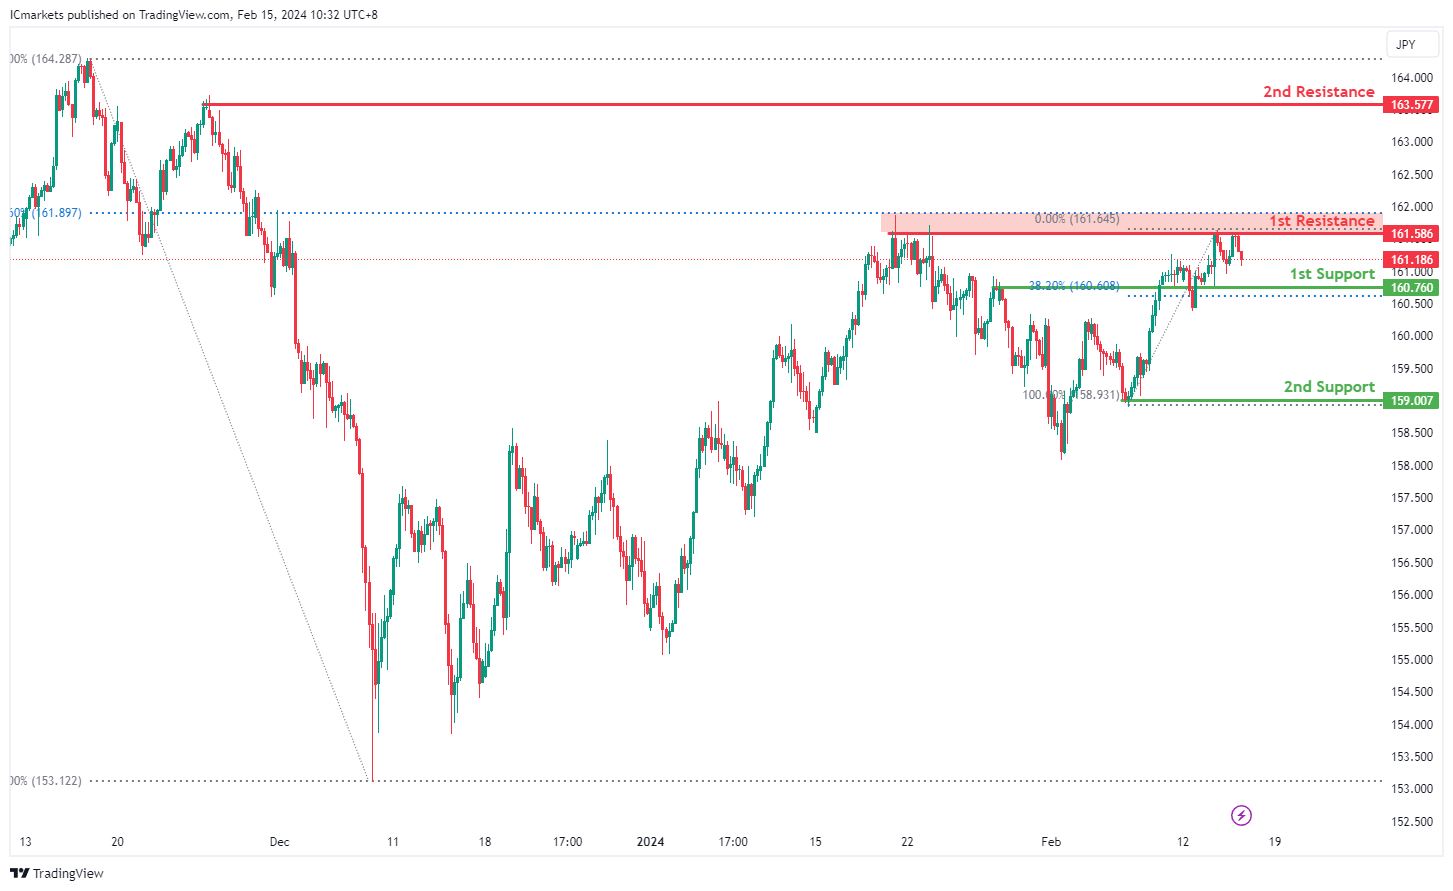
EUR/JPY:
The EUR/JPY chart currently demonstrates a bearish overall momentum, indicating a prevalent downward trend. Several factors contribute to this bearish sentiment, reinforcing the potential for a continued decline in price.
The 1st support level at 160.760 is significant as it aligns with both a pullback support and the 38.20% Fibonacci Retracement level. This convergence of support factors suggests a strong level where buying interest has historically emerged, potentially acting as a temporary floor for the price.
Additionally, the 2nd support level at 150.007 corresponds to a swing low support, further emphasizing its importance as a potential area where buyers may intervene to support the price.
On the resistance side, the 1st resistance level at 161.586 is identified as a swing high resistance and coincides with the 78.60% Fibonacci Retracement level. This level indicates a historical point where selling pressure has been significant, potentially acting as a barrier to further upward movement.
Further up, the 2nd resistance level at 163.705 also aligns with a swing high resistance, reinforcing its significance as a potential barrier to price appreciation.
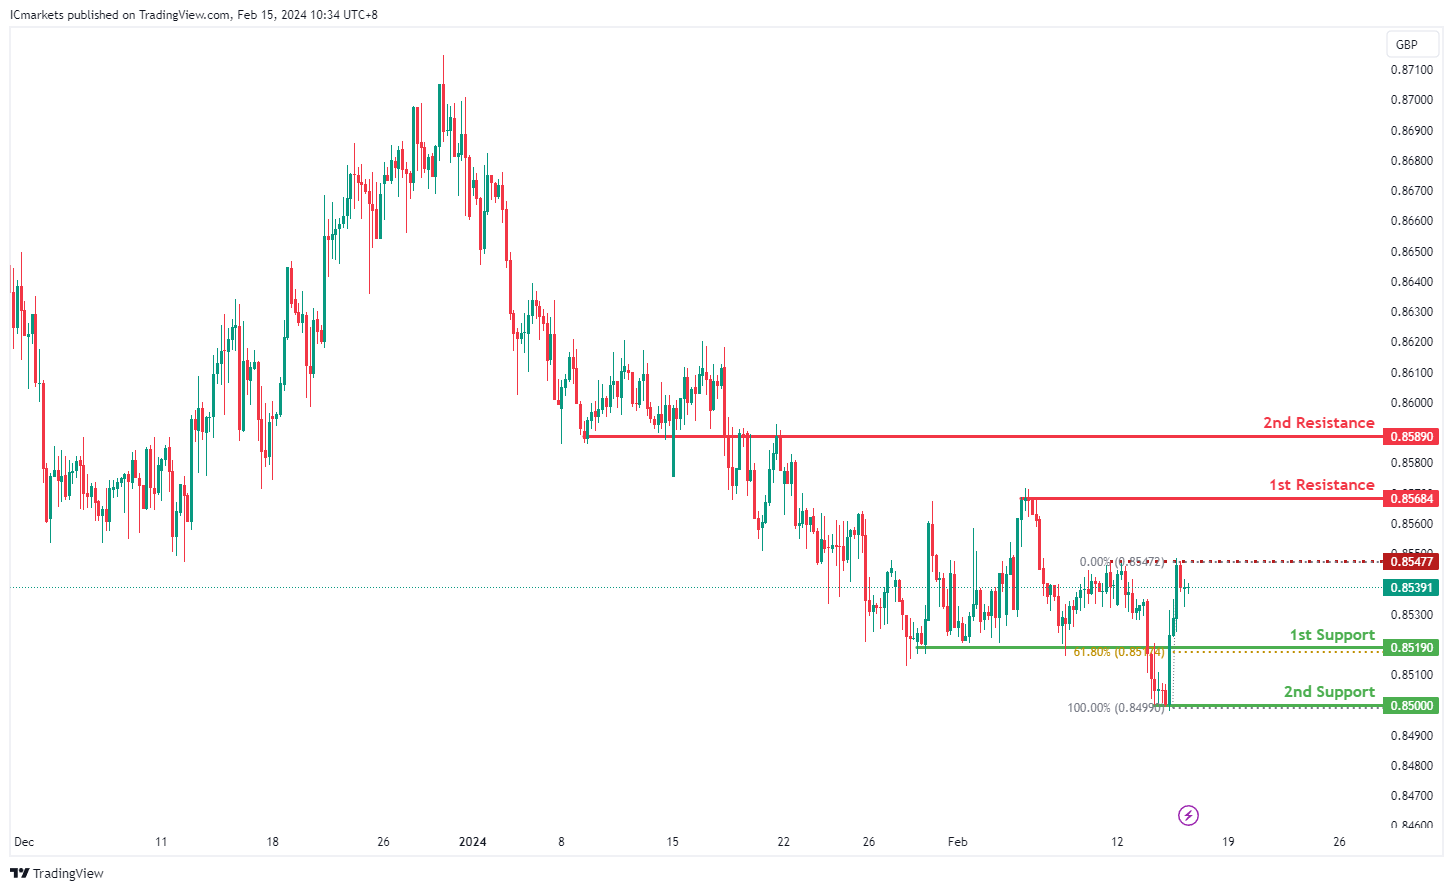
EUR/GBP:
The EUR/GBP chart currently maintains a neutral overall momentum, indicating a lack of clear directionality in the market. This indecisiveness suggests that price could potentially oscillate between key support and resistance levels in the near term.
The 1st support level at 0.85190 is notable as it coincides with a pullback support and the 61.80% Fibonacci Retracement level. This convergence suggests a robust level where buying interest may emerge, potentially providing a foundation for price stability.
Furthermore, the 2nd support level at 0.85000 aligns with a swing low support, reinforcing its significance as a historical level where buyers have previously intervened to support the price.
On the flip side, the 1st resistance level at 0.85684 represents a swing high resistance, indicating a historical point where selling pressure has been prevalent. This level may act as a barrier to further upward movement.
Similarly, the 2nd resistance level at 0.85890 is identified as an overlap resistance, suggesting another level where selling interest may intensify.
An intermediate resistance level at 0.85477 is also identified, corresponding to a pullback resistance. This level may add to the complexity of price movements, potentially influencing short-term fluctuations.
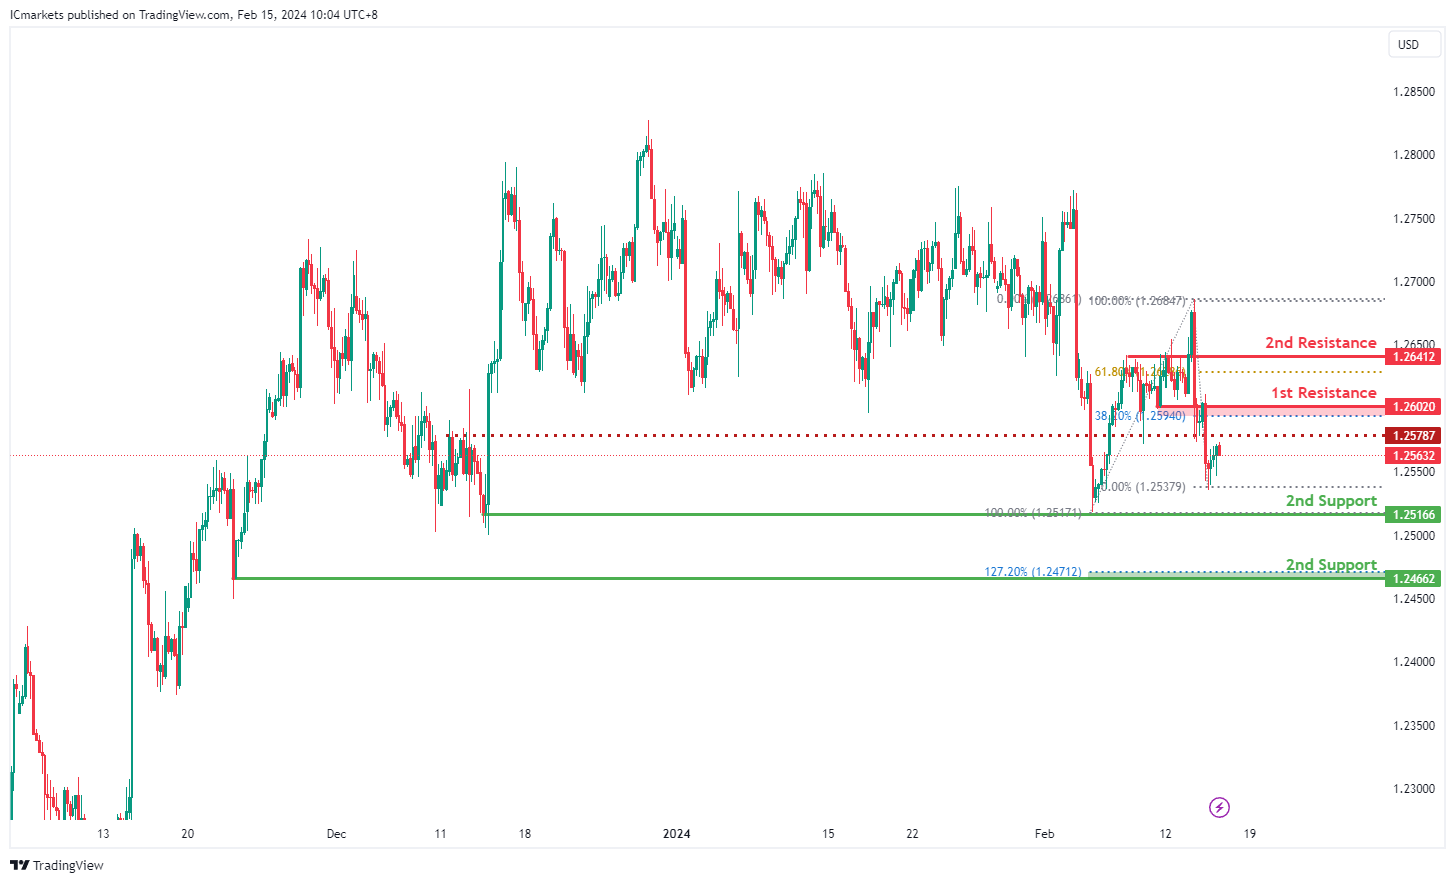
GBP/USD:
The GBP/USD chart currently demonstrates a bearish momentum.
There is a potential scenario where the price reacts bearishly upon reaching the 1st resistance level and subsequently declines towards the 1st support.
The 1st support level at 1.2516 is identified as a multi-swing low support, indicating its historical significance as a level where buying interest has emerged in the past.
Additionally, the 2nd support level at 1.2466 is characterized as a swing low support, further reinforced by the presence of the 127.20% Fibonacci Extension, enhancing its importance as a potential area of buying interest.
On the resistance side, the 1st resistance level at 1.2602 is categorized as an overlap resistance. This level coincides with the 38.20% Fibonacci Retracement, indicating its historical significance as a point of potential resistance.
Furthermore, the 2nd resistance at 1.2641 is identified as a pullback resistance, with the presence of the 61.80% Fibonacci Retracement, adding to its significance as a potential barrier for further upside movement.
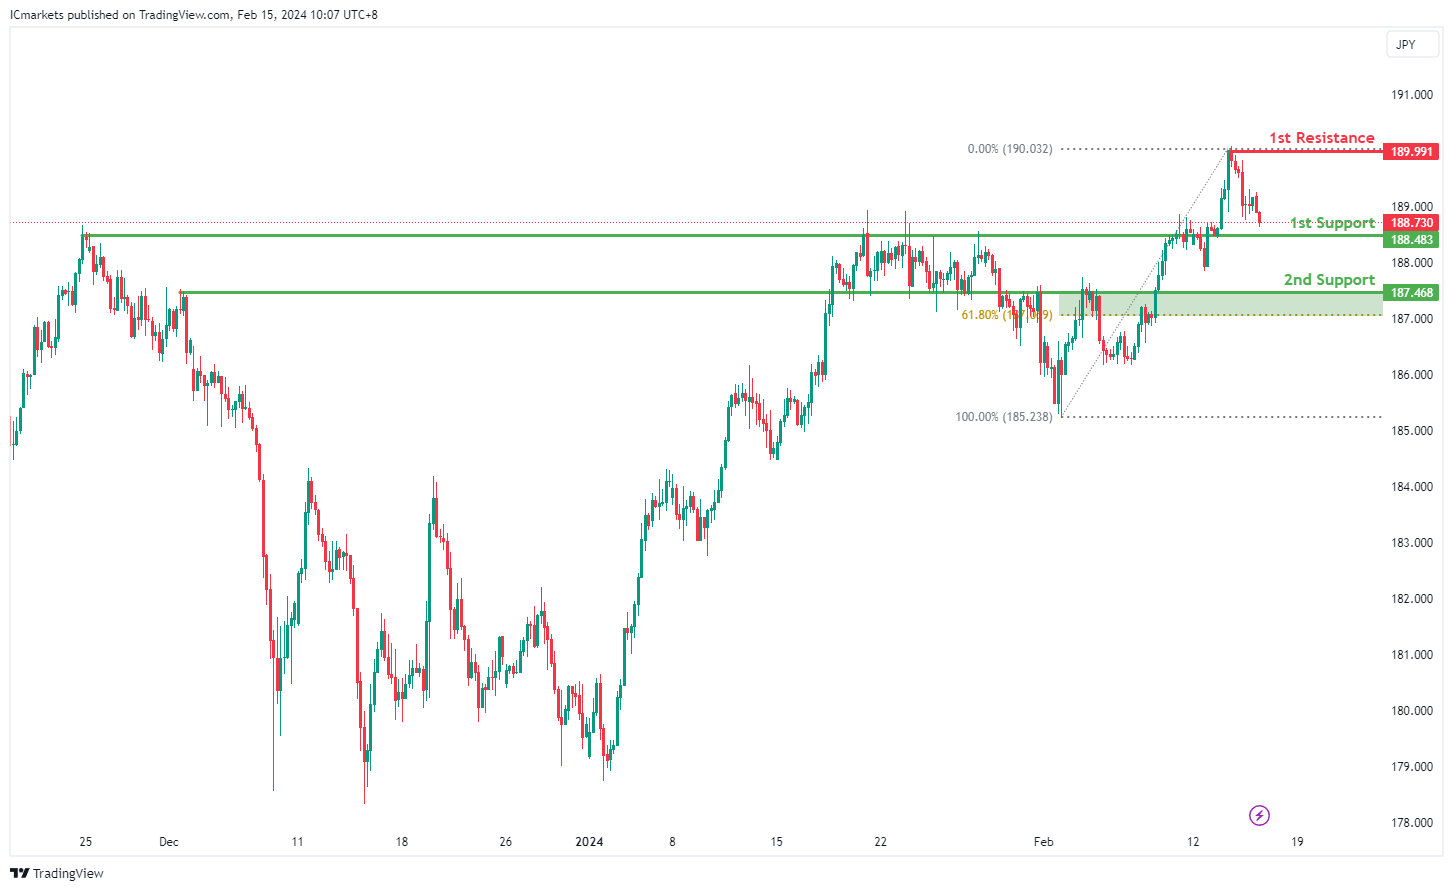
GBP/JPY:
The GBP/JPY chart currently exhibits a bearish overall momentum, suggesting a prevailing downward trend. Several factors contribute to this bearish sentiment, indicating the potential for a continued decline in price.
The 1st support level at 188.483 is identified as a significant level, characterized by pullback support. This suggests a historical area where buying interest has emerged following a pullback, potentially indicating a level where traders might look to enter long positions.
Furthermore, the 2nd support level at 187.478 aligns with an overlap support and the 61.80% Fibonacci Retracement level. This confluence strengthens its significance as a potential support zone, indicating a historical level where buyers have previously stepped in to support the price.
On the resistance side, the 1st resistance level at 189.991 represents a swing high resistance. This level may act as a barrier to further upward movement, as it denotes a historical point where selling pressure has been prevalent.
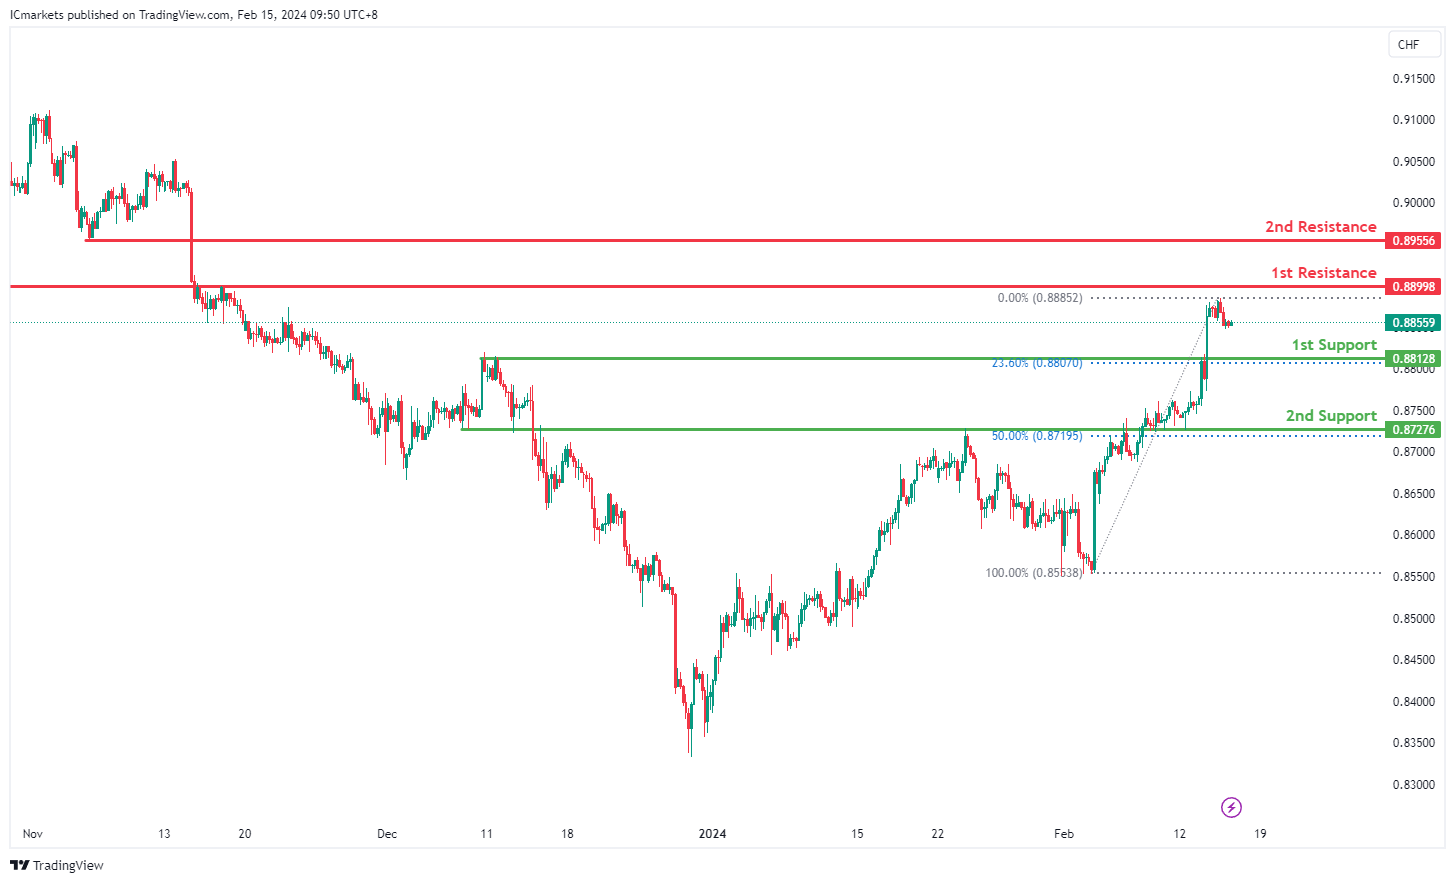
USD/CHF:
The USD/CHF chart currently indicates a bullish momentum.
There’s a potential scenario where the price may experience a short-term drop towards the 1st support before bouncing from there and moving towards the 1st resistance.
The 1st support level at 0.8812 is identified as a pullback support, coinciding with the 23.60% Fibonacci Retracement. This suggests historical significance as a level where buying interest has previously emerged.
Moreover, the 2nd support level at 0.727.0000 is characterized as an overlap support, coinciding with the 50% Fibonacci Retracement, further reinforcing its significance as a potential area of buying interest.
On the resistance side, the 1st resistance level at 0.8899 is categorized as an overlap resistance, indicating its historical significance as a point of potential resistance.
Additionally, the 2nd resistance at 0.8955 is identified as a pullback resistance, which could act as a barrier for further upside movement.
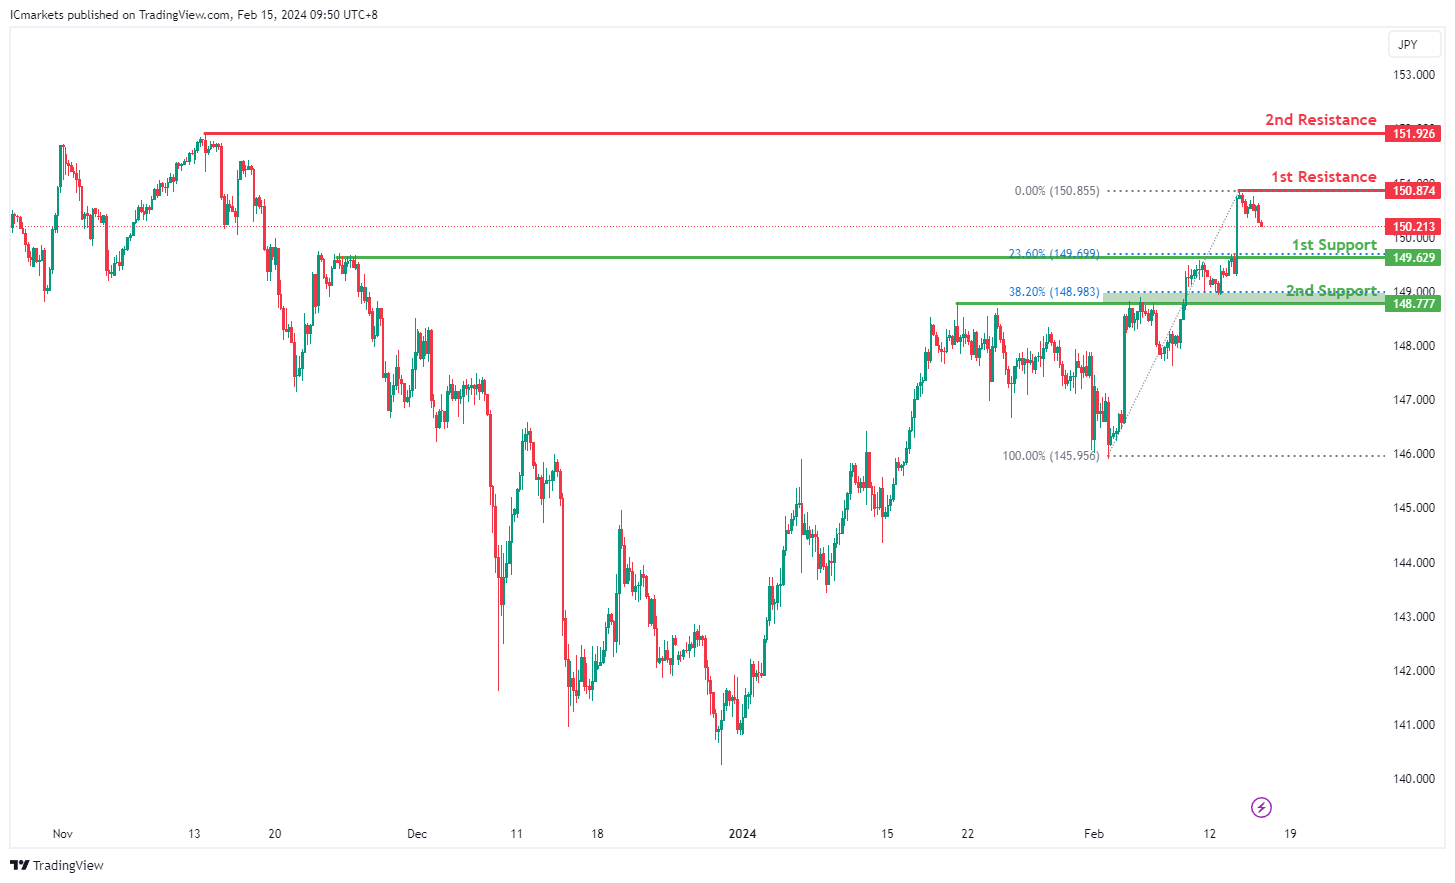
USD/JPY:
The USD/JPY chart currently demonstrates bullish momentum.
There’s a potential scenario where the price may experience a short-term drop towards the 1st support before bouncing from there and rising to the 1st resistance.
The 1st support level at 149.62 is identified as a pullback support, coinciding with the 23.60% Fibonacci Retracement. This suggests historical significance as a level where buying interest has previously emerged.
Furthermore, the 2nd support level at 148.77 is characterized as a pullback support, coinciding with the 38.20% Fibonacci Retracement, further reinforcing its significance as a potential area of buying interest.
On the resistance side, the 1st resistance level at 150.87 is categorized as a swing high resistance, indicating its historical significance as a point of potential resistance.
Additionally, the 2nd resistance at 151.92 is identified as another swing high resistance, which could act as a barrier for further upside movement.
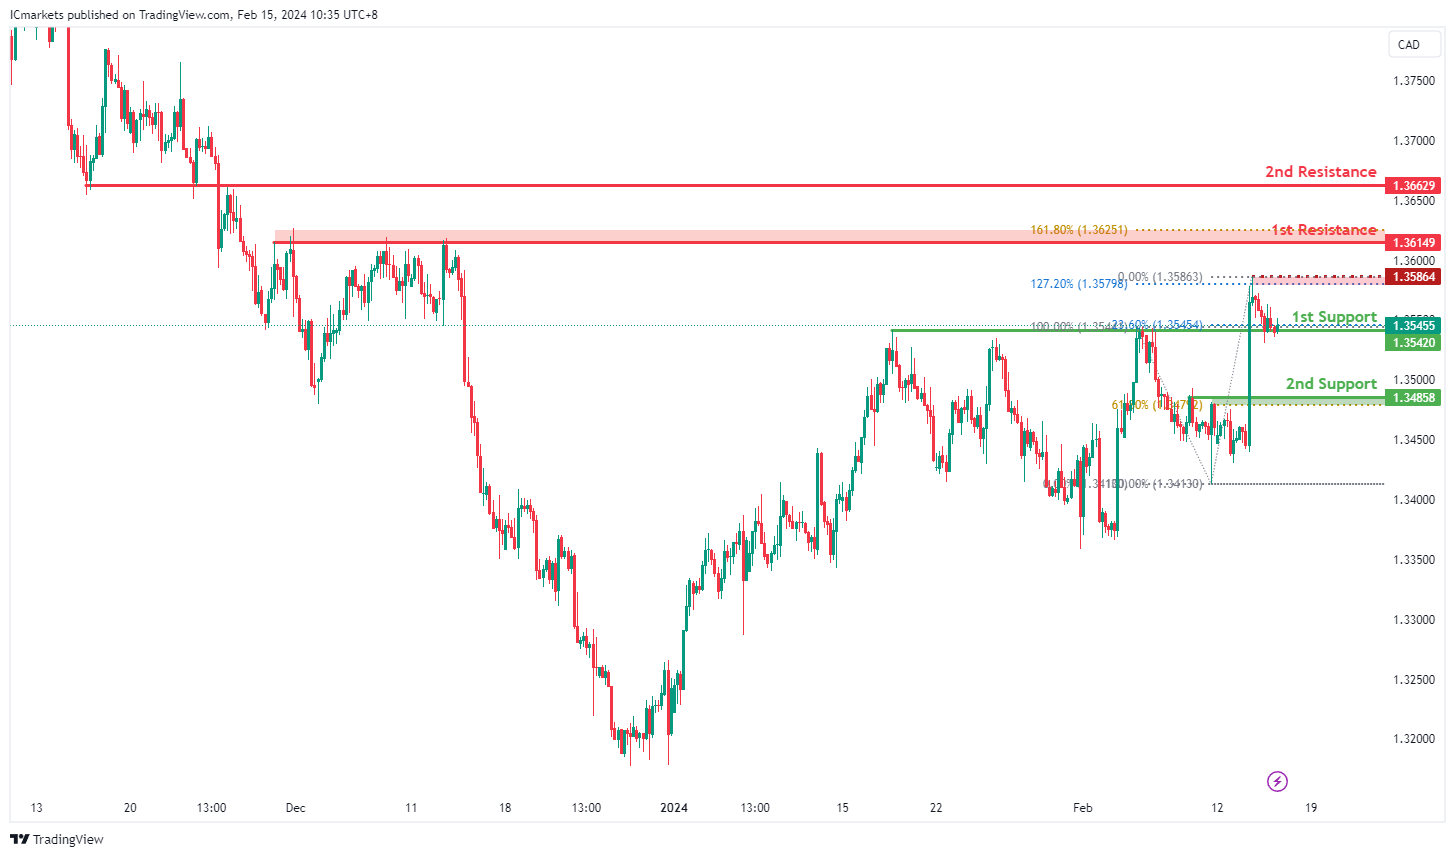
USD/CAD:
The USD/CAD chart currently exhibits a weak bullish momentum. In this context, there is a potential scenario for price to make a bullish bounce off the 1st support and rise towards the intermediate resistance.
The 1st support level at 1.3542 is identified as a pullback support that aligns with the 23.60% Fibonacci Retracement level. Further below, the 2nd support level at 1.3485 is also marked as a pullback support that aligns close to the 61.80% Fibonacci Retracement level, further emphasizing its importance as a potential support zone.
To the upside, the intermediate resistance level at 1.3586 is identified as a pullback resistance that aligns close to the 127.20% Fibonacci Extension level while the 1st resistance level at 1.3614 is also marked as a pullback resistance that aligns close to the 161.80% Fibonacci Extension level. Higher up, the 2nd resistance level at 1.3662 is noted as an overlap resistance, further highlighting its importance as a potential resistance point.
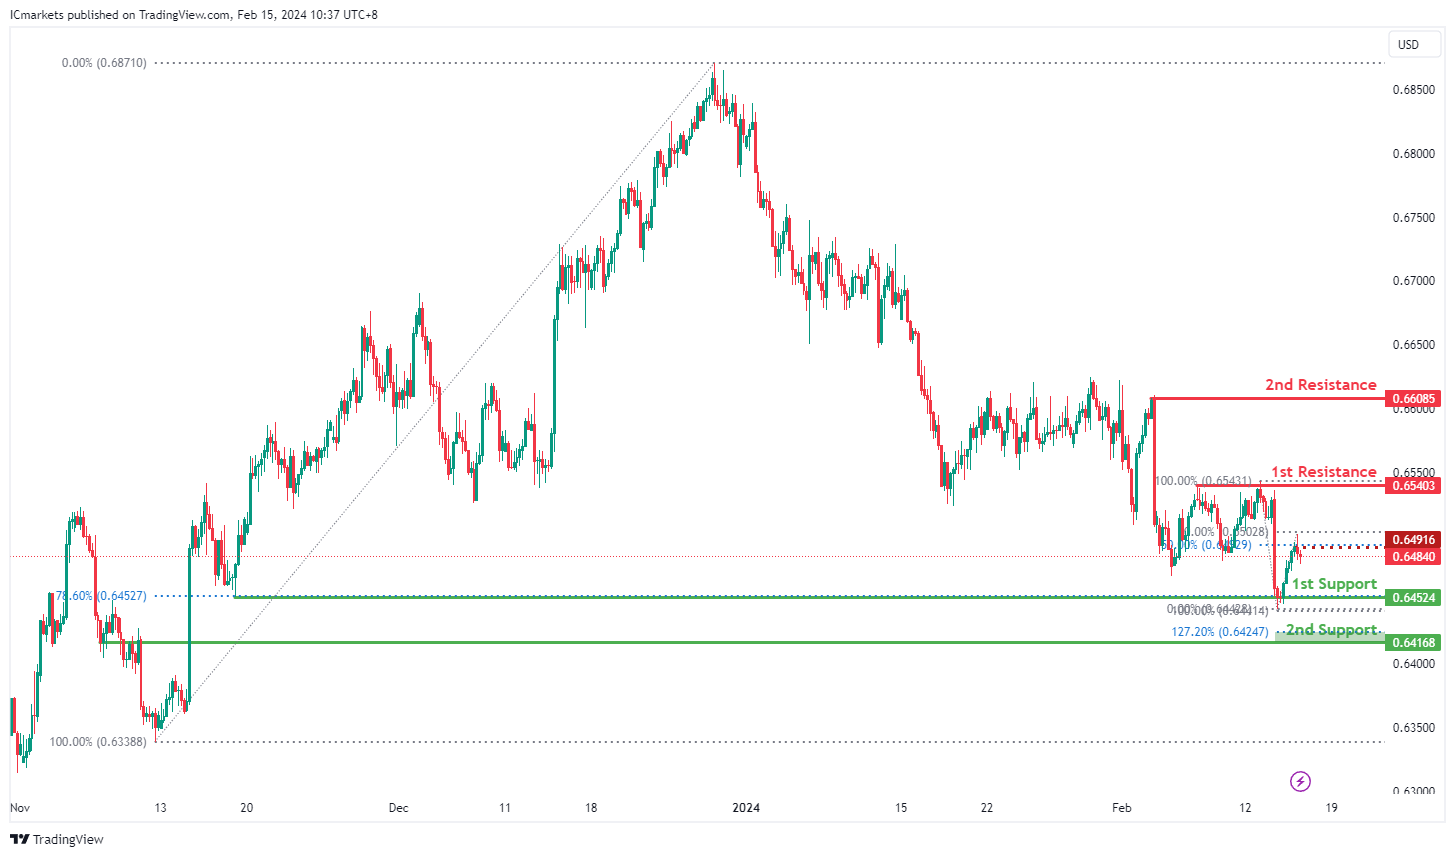
AUD/USD:
The AUD/USD chart currently exhibits a weak bullish momentum. In this context, there is a potential scenario for price to rise towards the 1st resistance should it break above the intermediate resistance.
The intermediate resistance level at 0.6491 is identified as a pullback resistance that aligns with the 50.00% Fibonacci Retracement level while the 1st resistance level at 0.6540 is also noted as a pullback resistance. Higher up, the 2nd resistance level at 0.6608 is also marked as a pullback resistance, further highlighting its importance as a potential resistance point.
To the downside, the 1st support level at 0.6452 is identified as pullback support that aligns with the 78.60% Fibonacci Retracement level. Further below, the 2nd support level at 0.6416 is noted as an overlap support that aligns close to the 127.20% Fibonacci Extension level, further emphasizing its importance as a potential support zone.
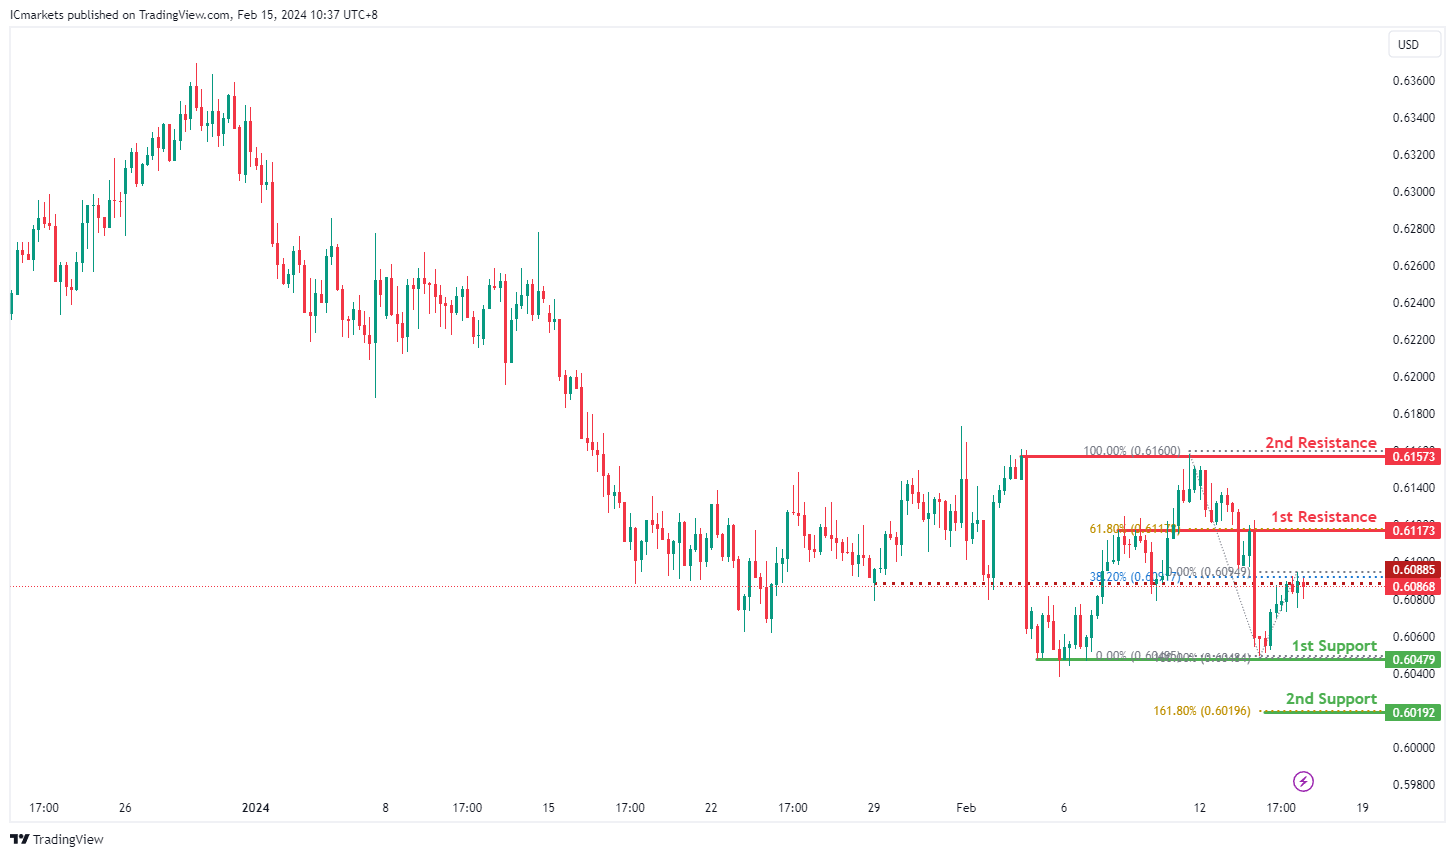
NZD/USD
The NZD/USD chart currently exhibits a weak bullish momentum. In this context, there is a potential scenario for price to rise towards the 1st resistance should it break above the intermediate resistance.
The intermediate resistance level at 0.6089 is identified as a pullback resistance that aligns close to the 38.20% Fibonacci Retracement level while the 1st resistance level at 0.6117 is noted as an overlap resistance that aligns with the 61.80% Fibonacci Retracement level. Higher up, the 2nd resistance level at 0.6157 is marked as a pullback resistance, further highlighting its importance as a potential resistance point.
To the downside, the 1st support level at 0.6047 is identified as a pullback support. Further below, the 2nd support level at 0.6019 is also noted as a pullback support that aligns with the 161.80% Fibonacci Extension level, further emphasizing its importance as a potential support zone.
DJ30:
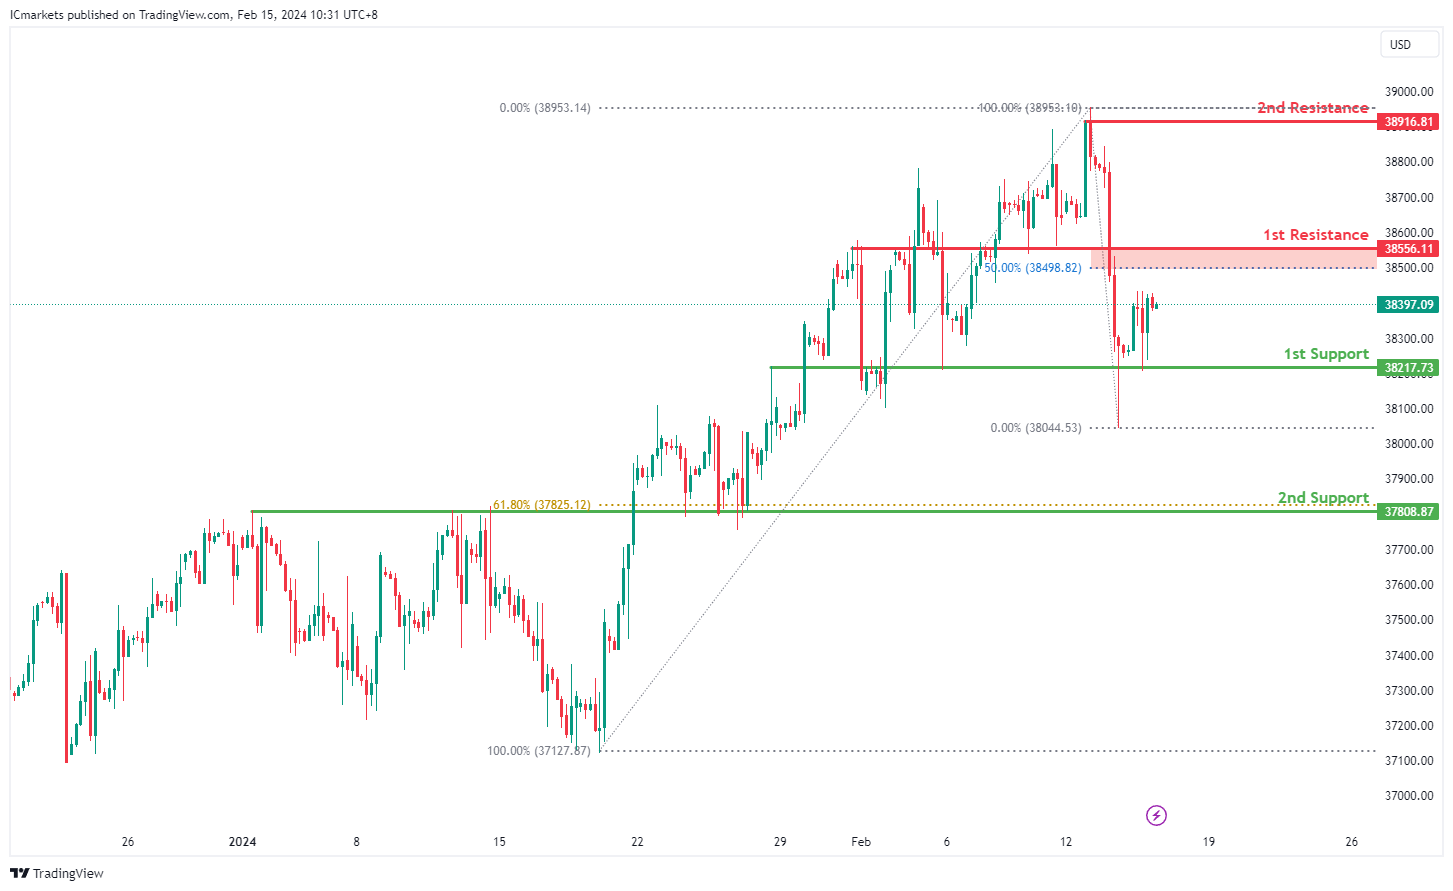
The DJ30 chart currently demonstrates a bullish overall momentum, indicating a prevalent upward trend. Several factors contribute to this bullish sentiment, suggesting the potential for a continued upward movement in price.
The 1st support level at 38217.73 is identified as significant due to its alignment with an overlap support. This suggests a historical level where buying interest has previously emerged, potentially indicating a strong level of support.
Additionally, the 2nd support level at 37808.87 corresponds to both an overlap support and the 61.80% Fibonacci Retracement level. This confluence of support factors further reinforces its significance as a potential support zone, indicating a level where buyers may be inclined to enter the market.
On the resistance side, the 1st resistance level at 38556.11 is identified as a point where selling pressure may increase, as it aligns with both an overlap resistance and the 50% Fibonacci Retracement level. This suggests a historical point where selling interest has been strong and could act as a barrier to further upward movement.
Further up, the 2nd resistance level at 38916.81 corresponds to a swing high resistance, indicating another potential barrier to upward movement.
GER40:
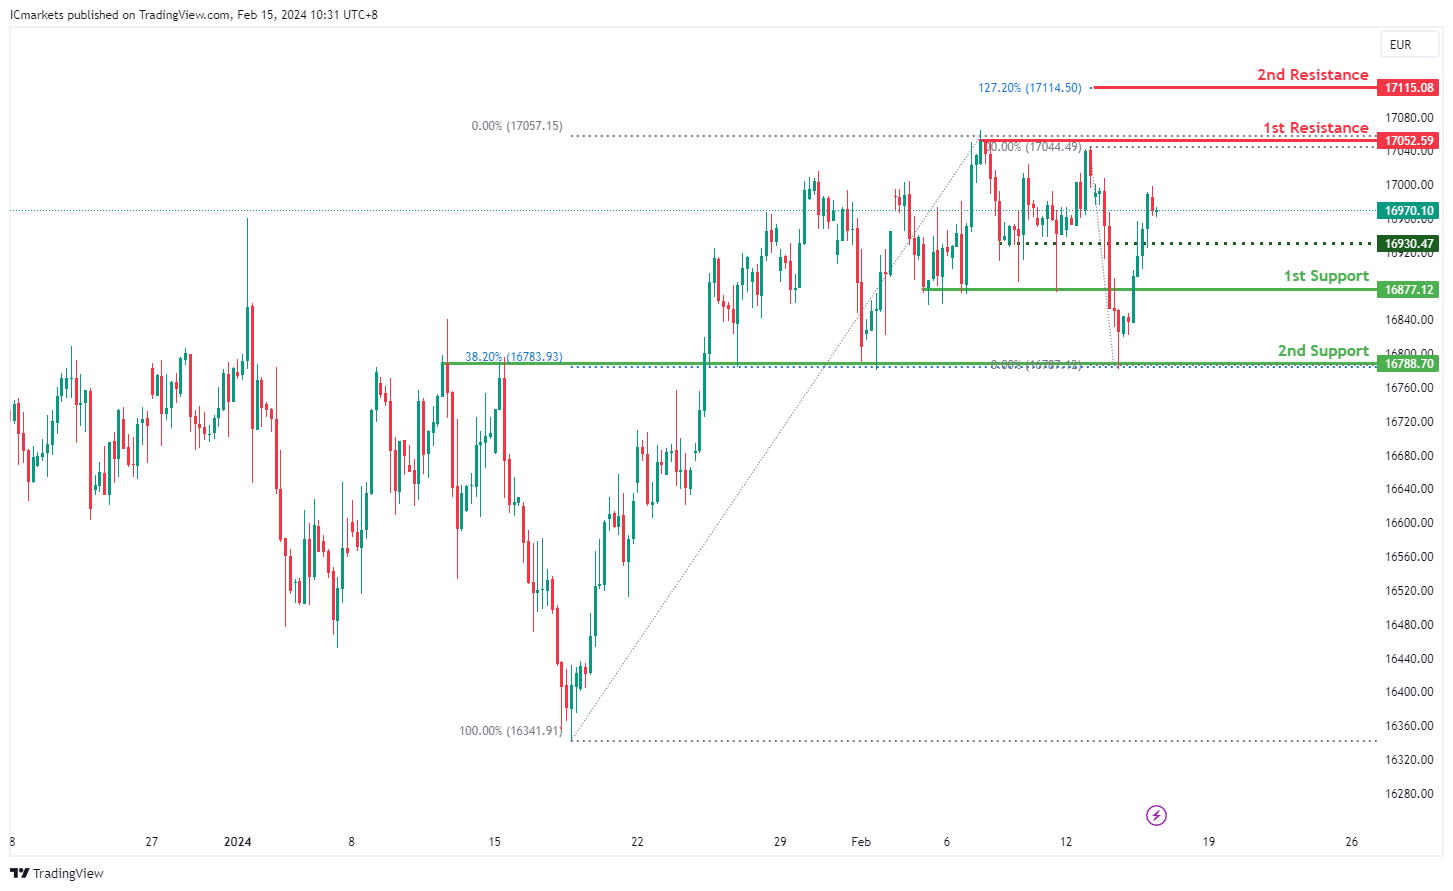
The GER40 chart currently maintains a bearish overall momentum, indicating a prevalent downward trend. Several factors contribute to this bearish sentiment, suggesting the potential for a continued downward movement in price.
The 1st support level at 16877.1 is identified as significant, representing a pullback support. This suggests a historical level where buying interest has previously emerged, potentially offering a level of support for the price.
Furthermore, the 2nd support level at 16788.7 corresponds to both an overlap support and the 38.20% Fibonacci Retracement level. This confluence of support factors strengthens its significance as a potential support zone, indicating a level where buyers may intervene.An intermediate support level at 16930.5 is also identified, which corresponds to a pullback support, providing additional reinforcement to the support structure.
On the resistance side, the 1st resistance level at 17052.6 is noted as a point where selling pressure may intensify, as it represents a pullback resistance. This indicates a historical point where selling interest has been strong and could act as a barrier to further upward movement.
Additionally, the 2nd resistance level at 17115.1 aligns with the 127.20% Fibonacci Extension, adding to its significance as a potential barrier to upward movement.
US500:
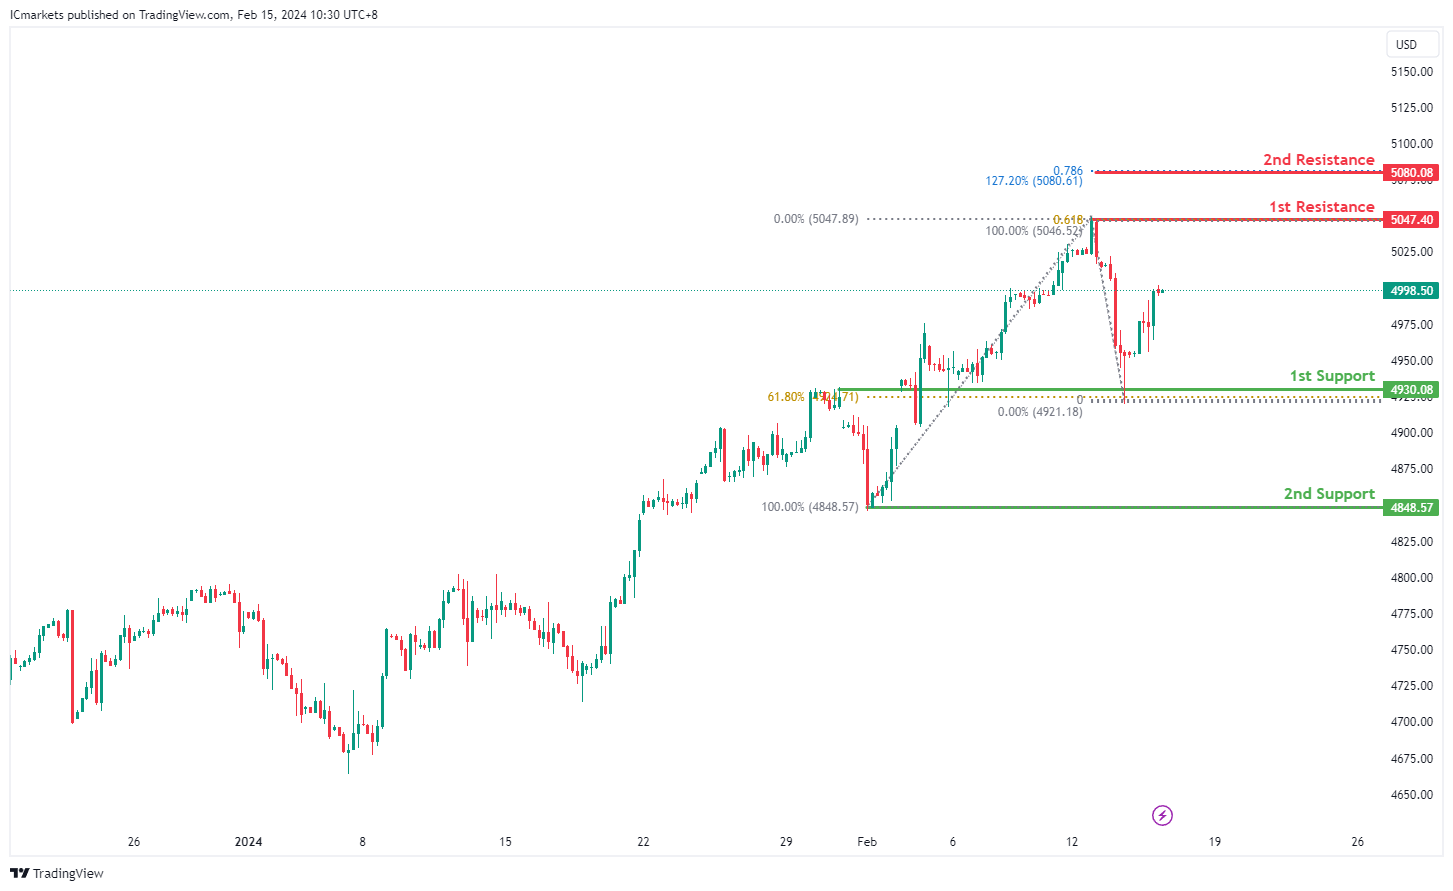
The US500 chart currently demonstrates a bullish overall momentum, indicating a prevalent upward trend. Several factors contribute to this bullish sentiment, suggesting the potential for a continued upward movement in price.
The 1st support level at 4930.1 is deemed significant as it aligns with both an overlap support and the 61.80% Fibonacci Retracement level. This convergence of support factors suggests a robust level where buying interest has historically emerged, potentially providing a solid foundation for further upward movement.
Additionally, the 2nd support level at 4848.6 corresponds to a swing low support, further reinforcing its importance as a potential support zone. This level indicates a significant historical level where buyers have previously intervened to support the price.
On the resistance side, the 1st resistance level at 5047.4 is identified as a point where selling pressure may increase, as it represents a swing high resistance and aligns with the 61.80% Fibonacci Projection. This suggests a historical point where selling interest has been strong and could act as a barrier to further upward movement.
Further up, the 2nd resistance level at 5080.1 aligns with both the 127.20% and 78.60% Fibonacci Extensions, adding to its significance as a potential barrier to upward movement.
BTC/USD:
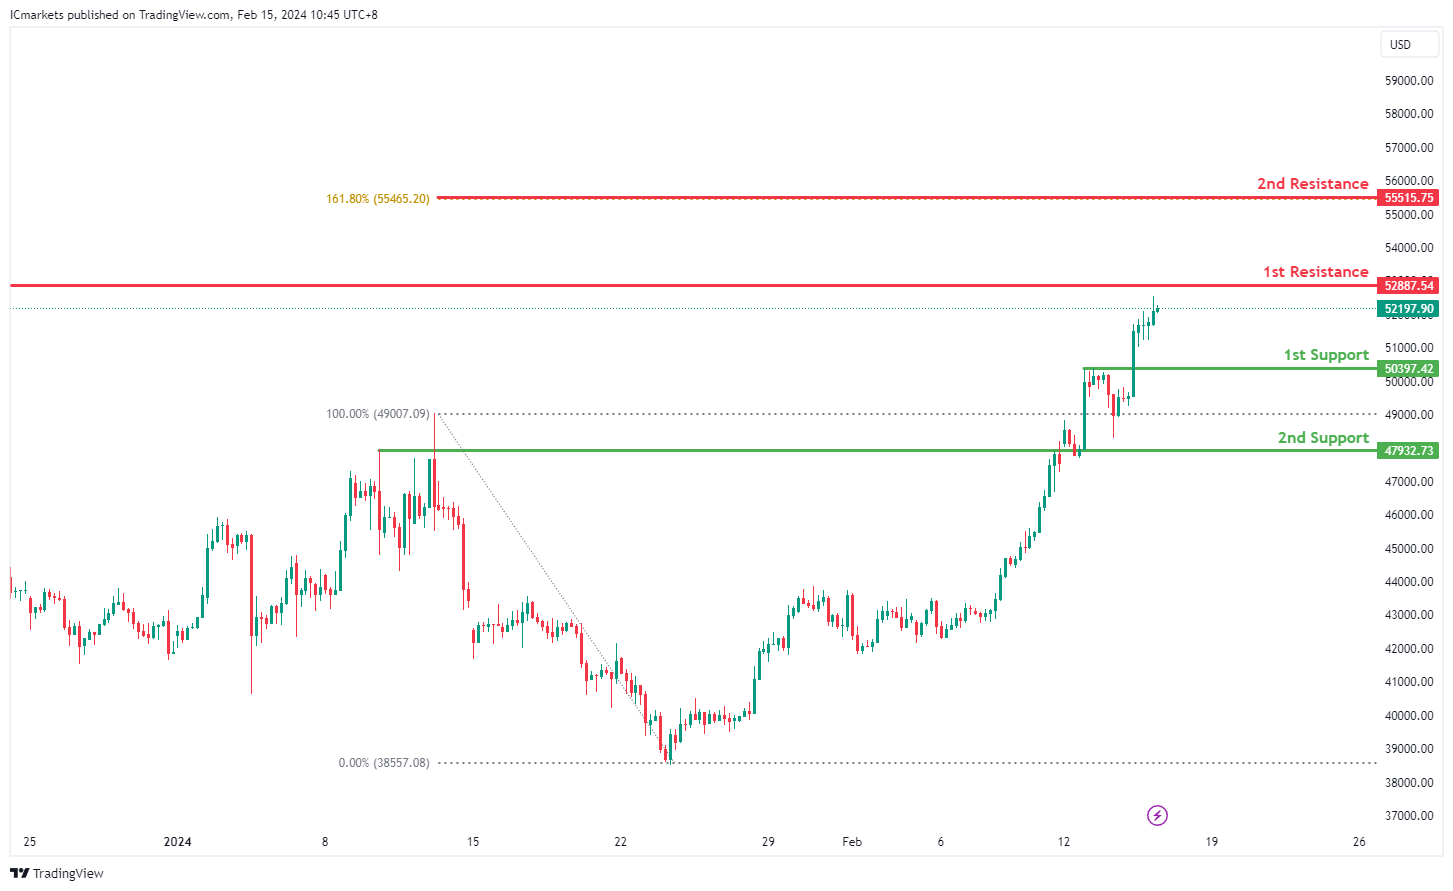
The BTC/USD chart currently exhibits a bullish overall momentum, indicating a prevailing upward trend. Several factors contribute to this bullish sentiment, suggesting the potential for further upward movement in price.
The 1st support level at 50397.42 is significant as it represents a pullback support. This level indicates a historical point where buying interest has previously emerged, potentially acting as a foundation for continued upward movement.
Additionally, the 2nd support level at 47932.73 aligns with an overlap support, further reinforcing its importance as a potential support zone. This level suggests a historical area where buyers have shown significant interest in supporting the price, adding credibility to its role as a support level.
On the resistance side, the 1st resistance level at 52887.54 aligns with a multi-swing high resistance. This level represents a historical point where selling pressure has been strong, potentially acting as a barrier to further upward movement.
Further up, the 2nd resistance level at 55515.75 corresponds to the 161.80% Fibonacci Extension, adding to its significance as a resistance level. Fibonacci extensions are commonly used to identify potential price targets, suggesting that this level could present a significant hurdle for further price appreciation.
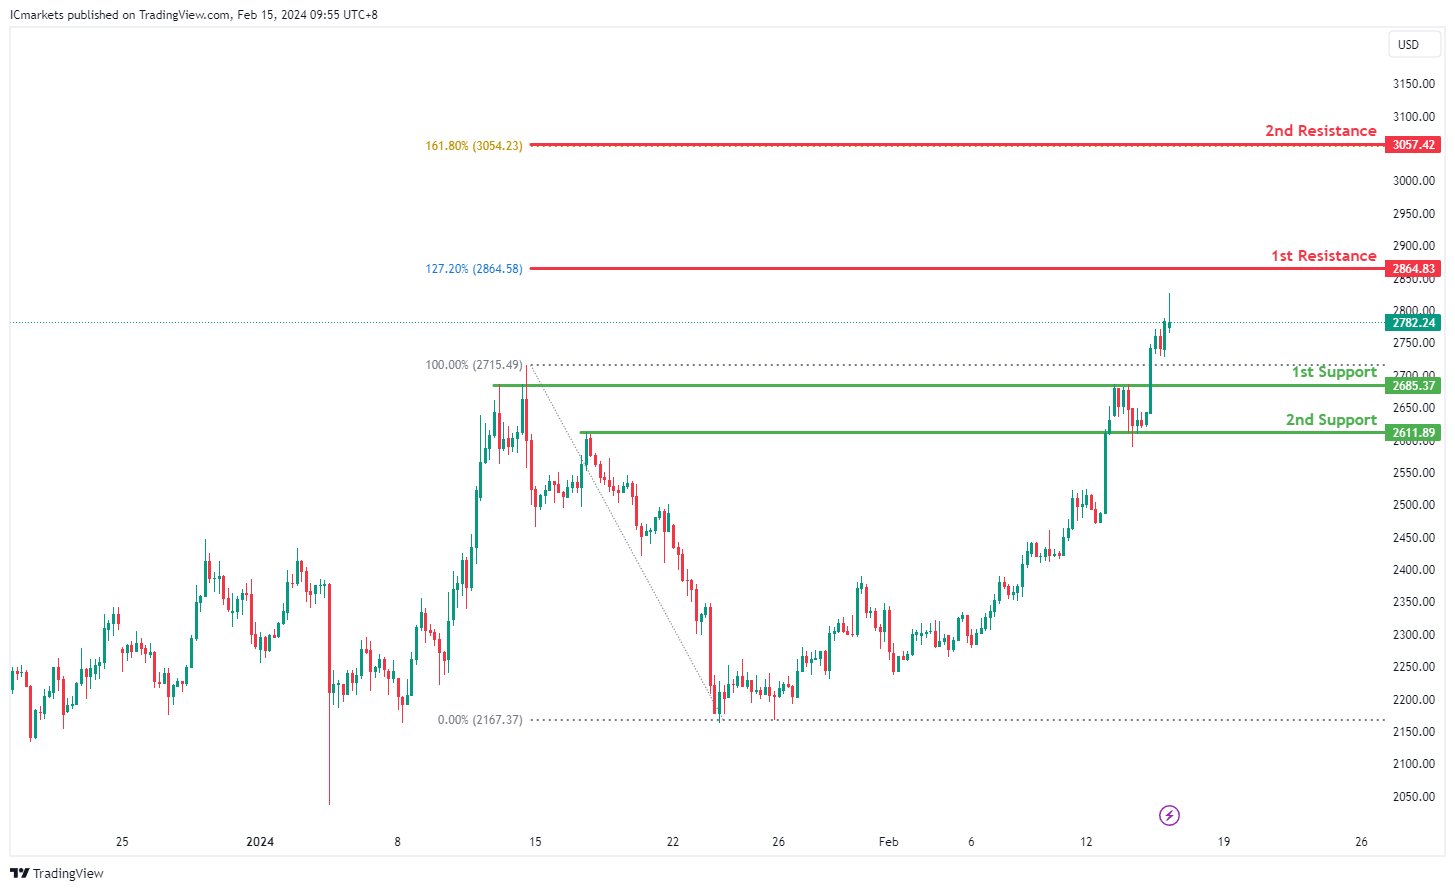
ETH/USD:
The ETH/USD chart currently indicates a bullish overall momentum, suggesting a predominant upward trend. Several factors contribute to this bullish sentiment, indicating the potential for further upward movement in price.
The 1st support level at 2685.37 is significant as it represents a pullback support, indicating a historical level where buying interest has previously emerged. This level could serve as a foundation for further upward movement, with buyers potentially entering the market at this point.
Additionally, the 2nd support level at 2611.89 aligns with an overlap support, further reinforcing its importance as a potential support zone. This level indicates a historical area where buyers have shown significant interest in supporting the price, adding credibility to its role as a support level.
On the resistance side, the 1st resistance level at 2864.83 aligns with the 127.20% Fibonacci Extension, which adds significance to this resistance level. Fibonacci extensions are commonly used by traders to identify potential price targets, suggesting that this level could present a significant hurdle for further upward movement.
Furthermore, the 2nd resistance level at 3057.42 corresponds to the 161.80% Fibonacci Extension, further emphasizing its importance as a resistance level. This level indicates a potential price target derived from Fibonacci analysis and could act as a strong barrier to further price appreciation.
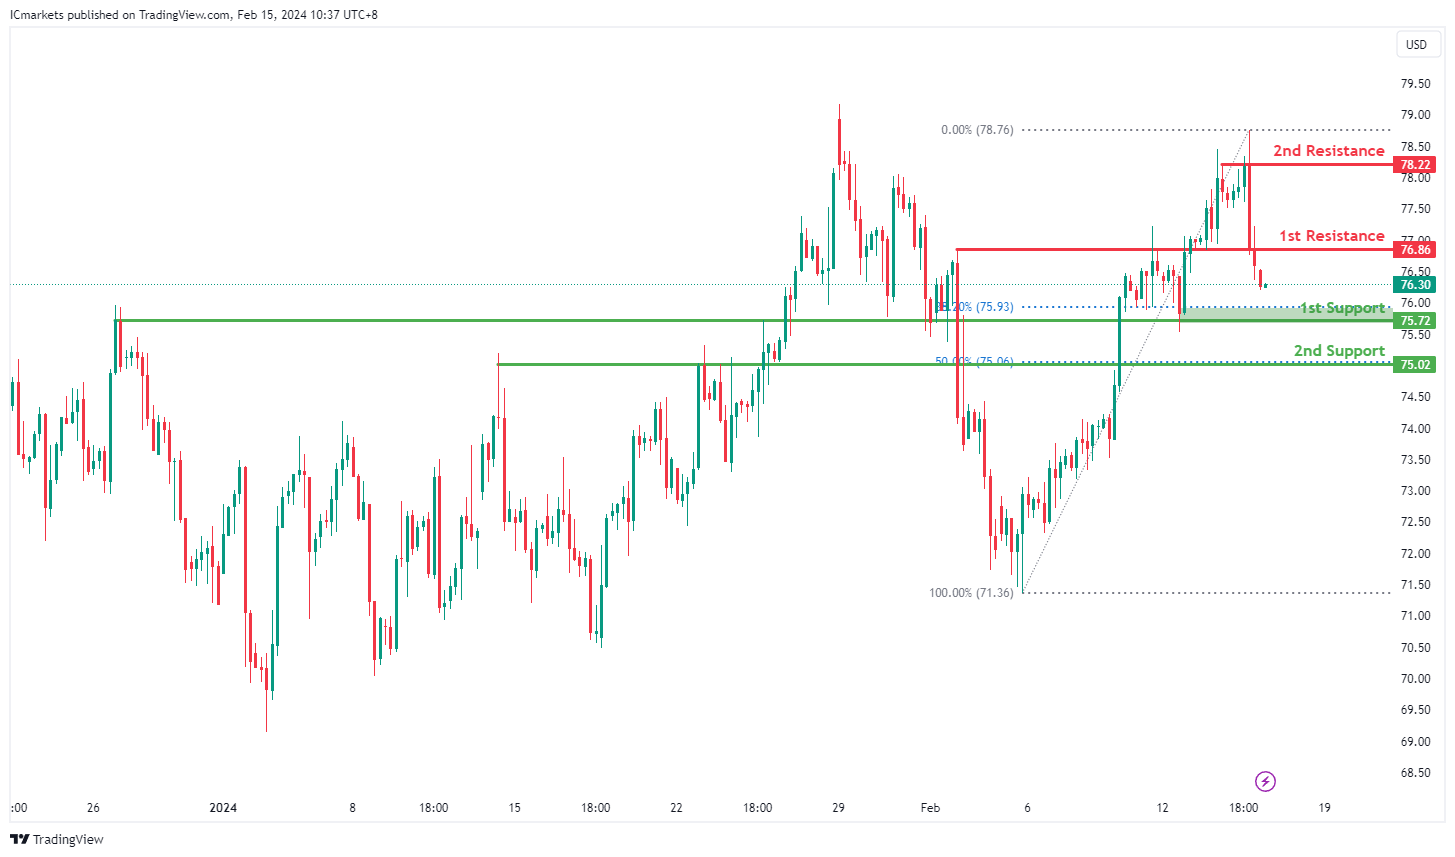
WTI/USD:
The WTI (West Texas Intermediate) chart currently exhibits an overall bearish momentum. In this context, there is a potential scenario for price to drop towards the 1st support.
The 1st support level at 75.72 is identified as an overlap support that aligns close to the 38.20% Fibonacci Retracement level. Further below, the 2nd support level at 75.02 is also noted as an overlap support that aligns with the 50.00% Fibonacci Retracement level, reinforcing its significance as a key support level.
To the upside, the 1st resistance level at 76.86 is identified as an overlap resistance. Higher up, the 2nd resistance level at 78.22 is marked as a pullback resistance, further highlighting its importance as a potential resistance zone.
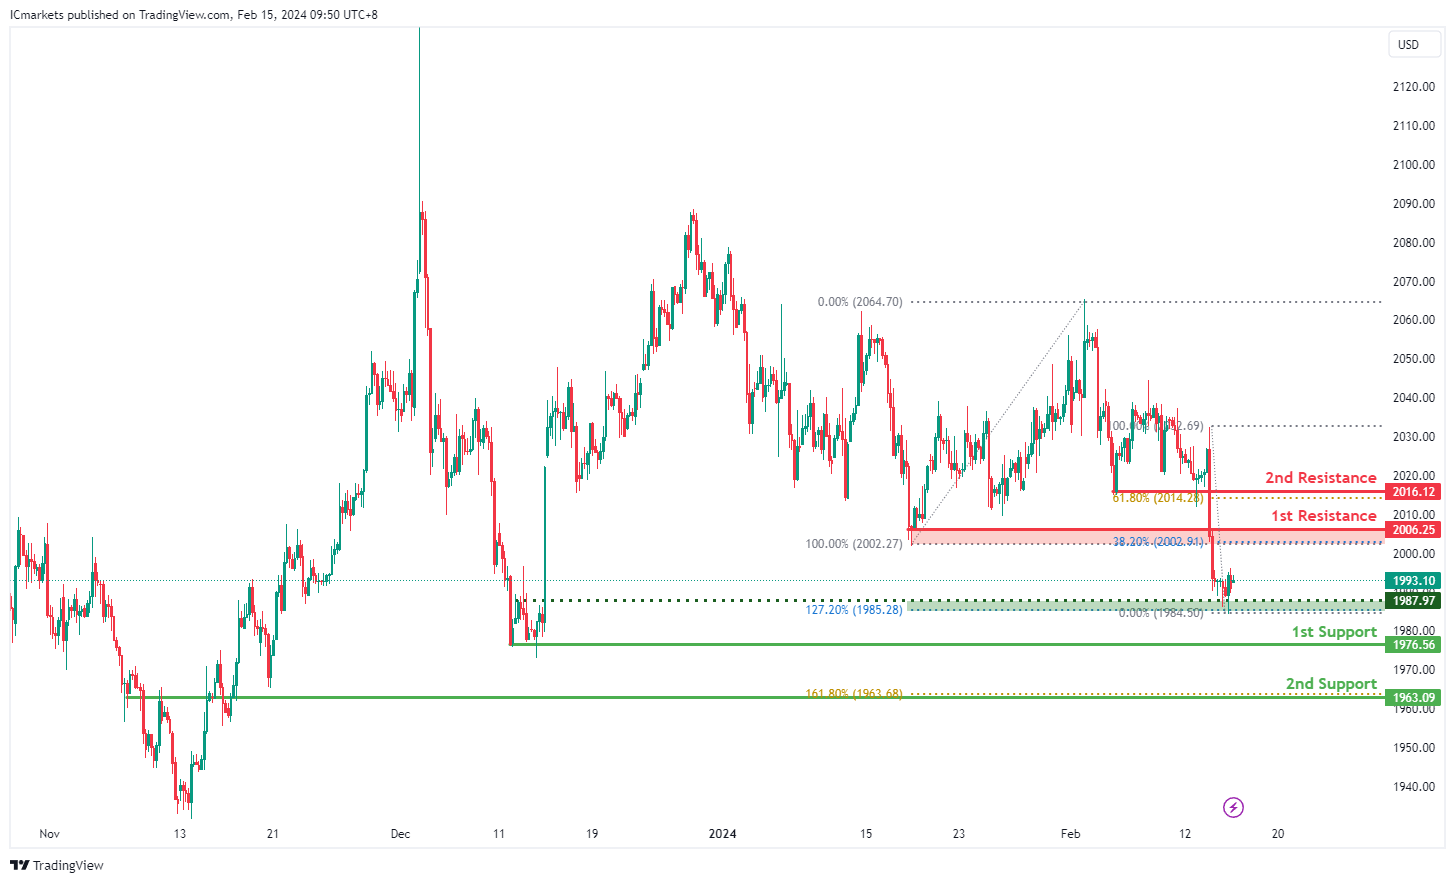
XAU/USD (GOLD):
The XAUUSD chart currently exhibits a bearish overall momentum, indicating a downward trend.
There’s a potential scenario where the price may rise towards the 1st resistance in the short term before reversing off it and dropping towards the 1st support.
The 1st support level at 1976.56 is identified as a multi-swing low support, suggesting historical significance as a strong support level where buying interest may emerge.
Additionally, the 2nd support level at 1963.09 is characterized as an overlap support, coinciding with the 161.80% Fibonacci Extension, further emphasizing its importance as a potential support zone.
On the resistance side, the 1st resistance level at 2006.25 is categorized as a pullback resistance, coinciding with the 38.20% Fibonacci Retracement, indicating its historical significance as a point of potential resistance.
Moreover, there is a 2nd resistance level at 2016.12, identified as another pullback resistance, coinciding with the 61.80% Fibonacci Retracement, which further adds to its significance as a potential barrier for further upside movement.
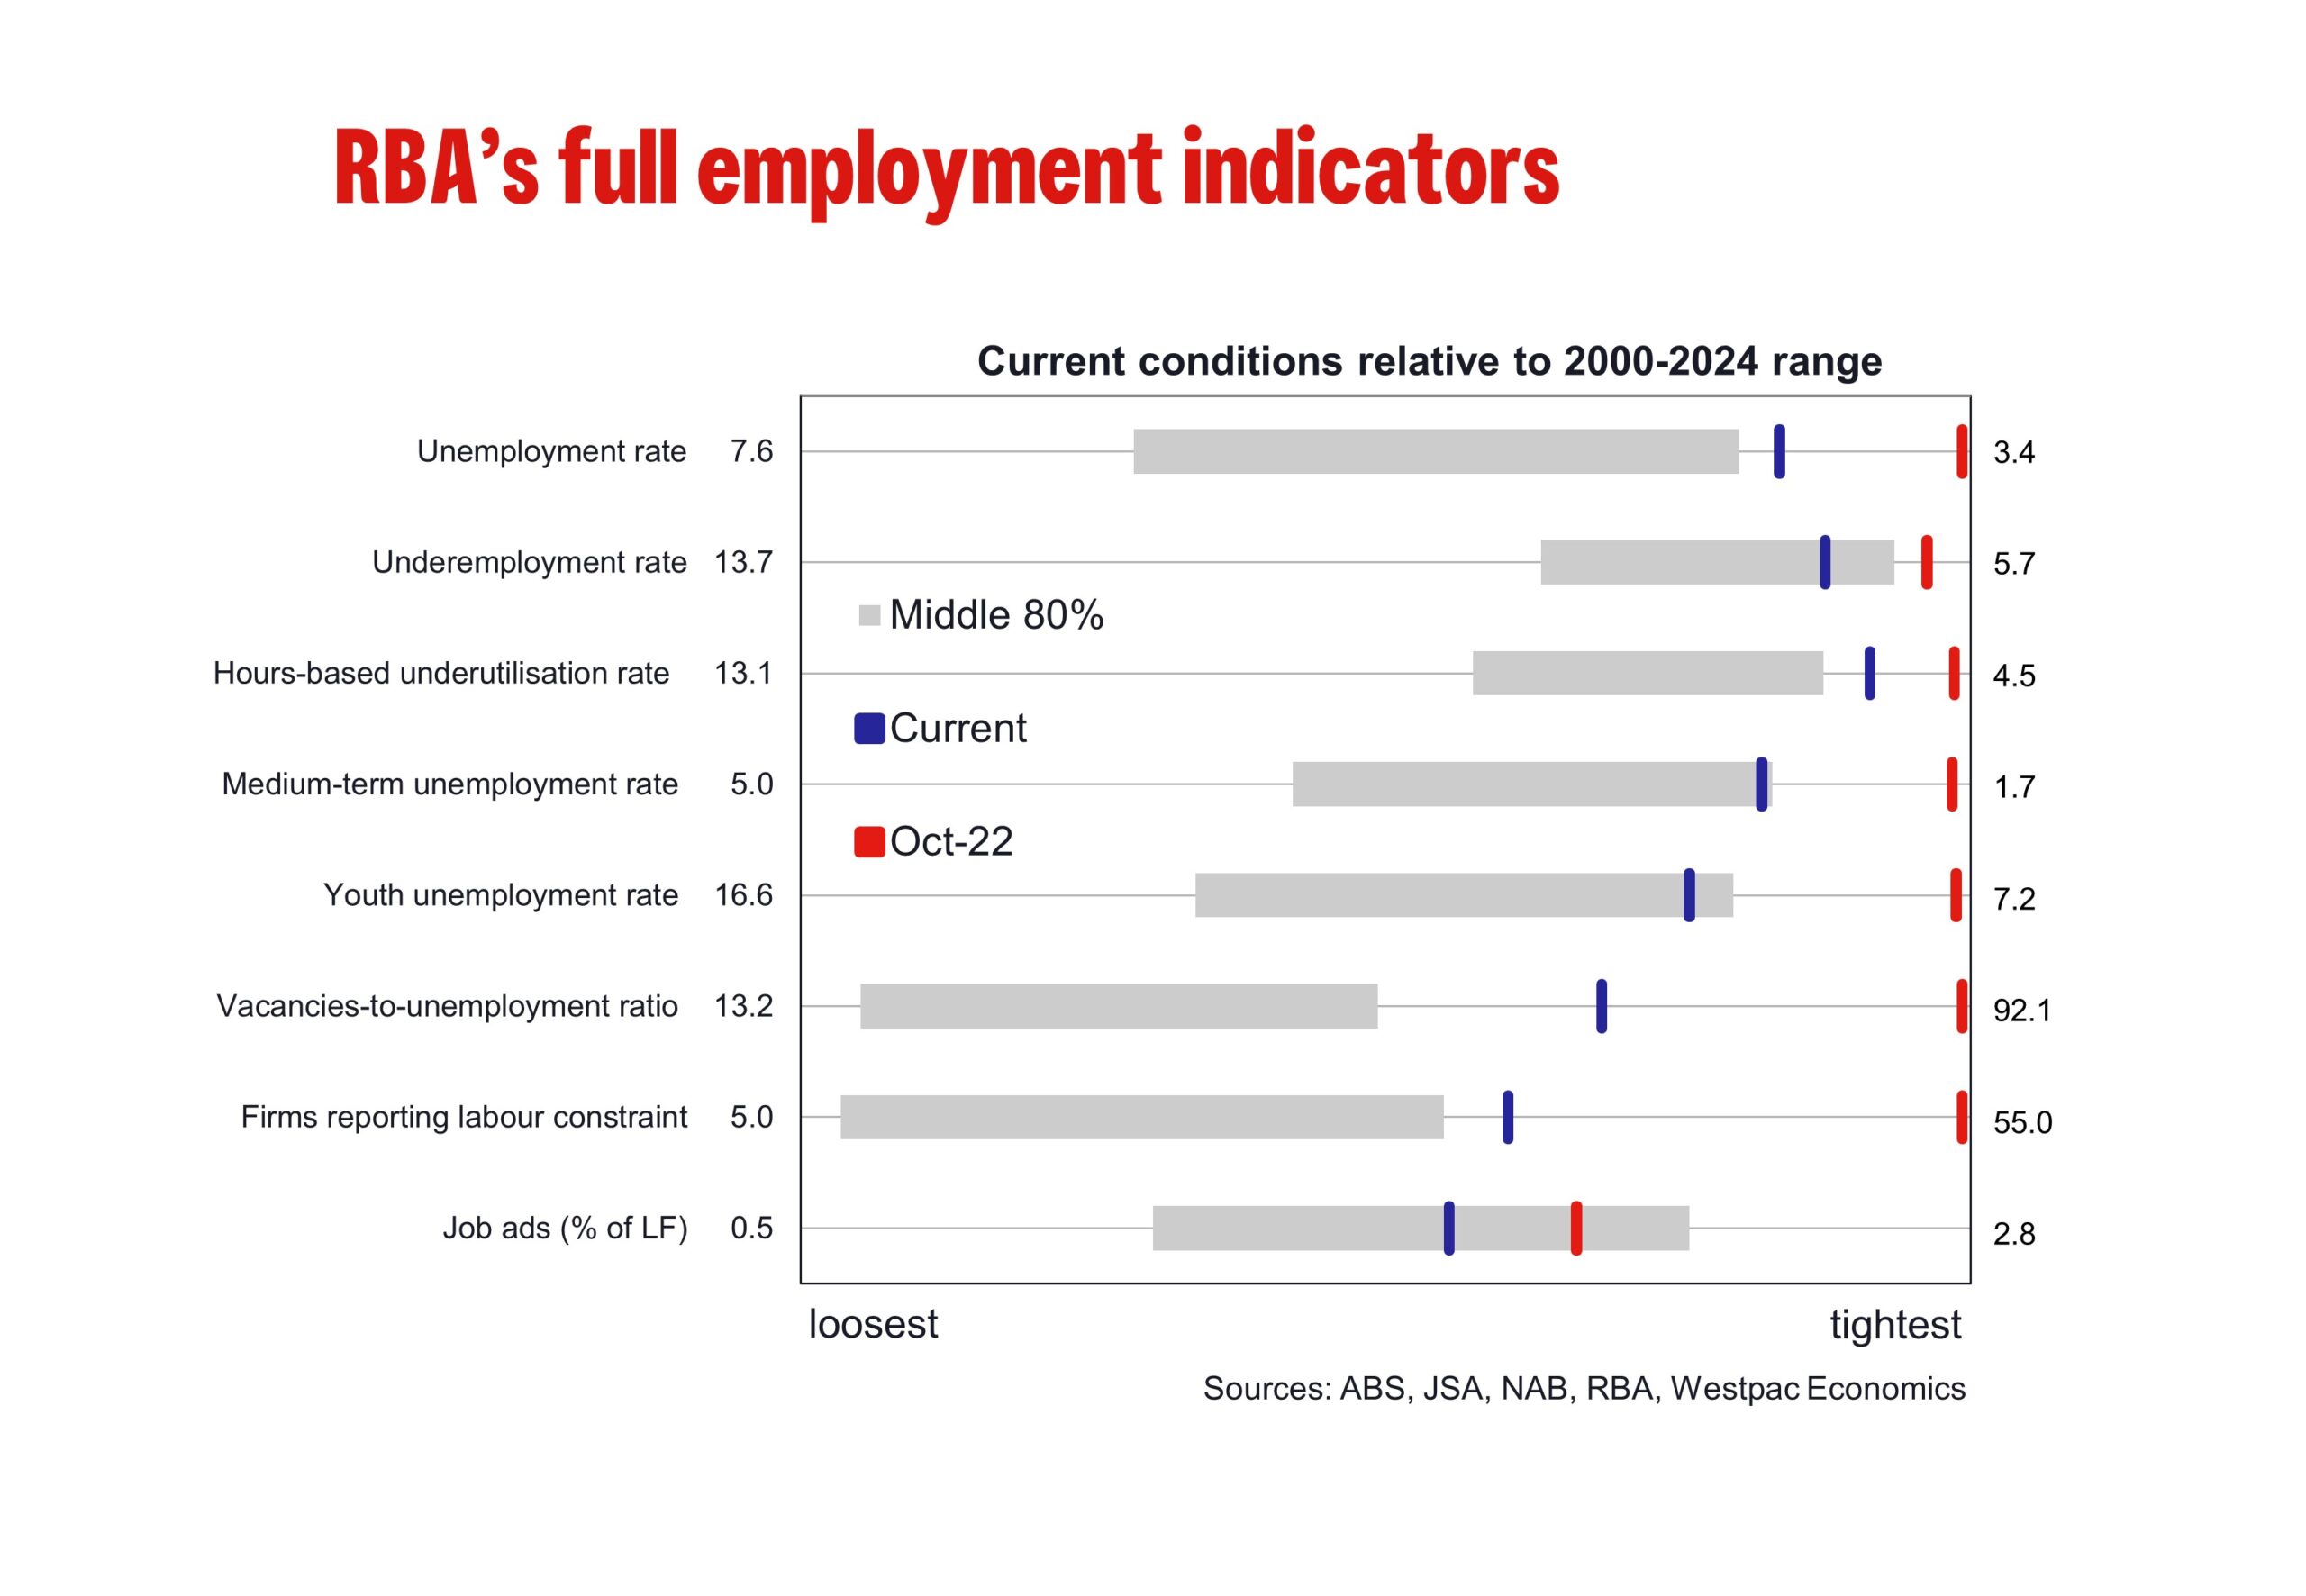
Australia January Labour Force: Seasonality Amplifies a Weak Underlying Trend
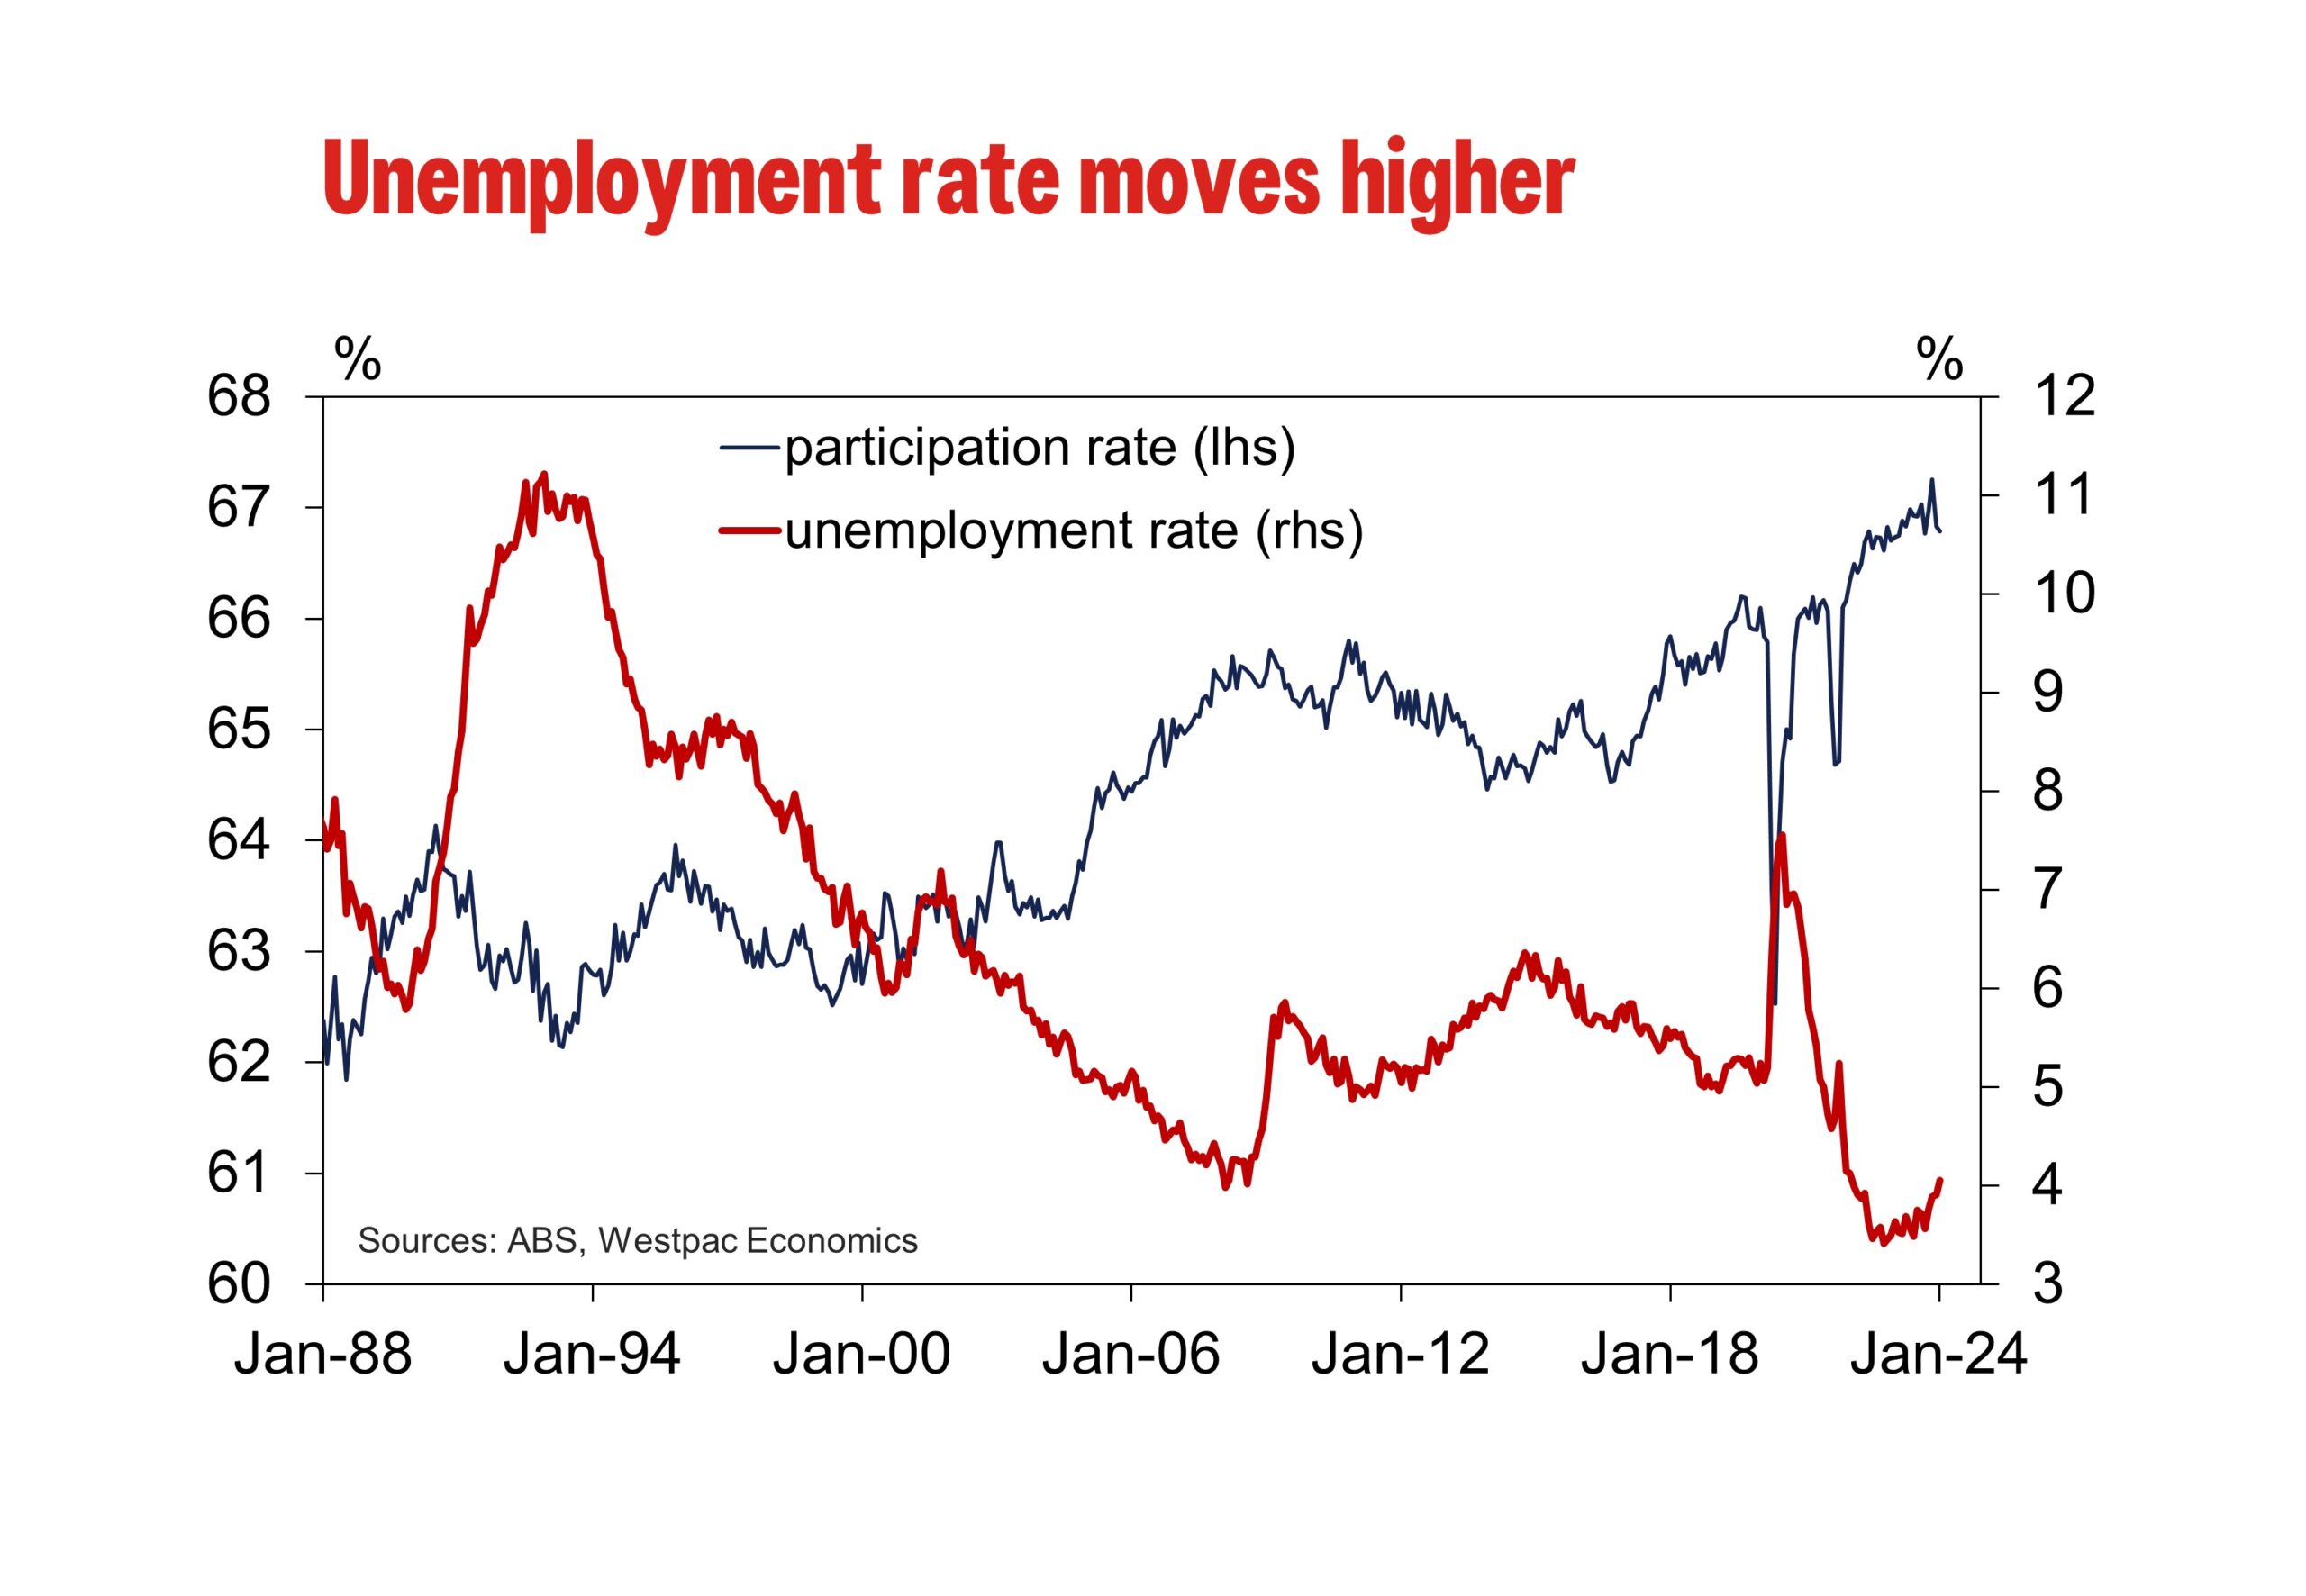
Employment: +0.5k (from –62.7k). Unemployment Rate: 4.1% (from 3.9%). Participation Rate: 66.8% (unchanged).
January is the most seasonal time of the year for the labour market, and this year was no exception. As we had anticipated, the softening trend in labour market conditions that extended into the new year was amplified by shifting seasonal dynamics that have become increasingly apparent in the years since the pandemic. The ABS are not yet able to completely remove the influence of these dynamics in its seasonally adjusted estimates, so the results from this month’s survey should be read with caution.
In the media release, the ABS made note of two distinct dynamics which we expected to appear again. Firstly, with regards to hours worked, the ABS noted: “Compared with January surveys before the pandemic, we again saw a higher proportion of employed people working no hours because they were on leave.” This was associated with a 2.5% decline in seasonally adjusted hours worked in January 2024, similar to the 2.3% decline in January 2023.
Secondly, the ABS noted that the increase in the unemployment rate “coincided with a higher-than-usual number of people who were not employed but who said they will be starting or returning to work in the future.” This was similar to what was observed this time last year – in the presence of a tight labour market, individuals may seek more opportunities and look to change jobs (typically over holiday periods), leading to a larger-than-usual (and in the case of last year, temporary) increase in the unemployment rate.
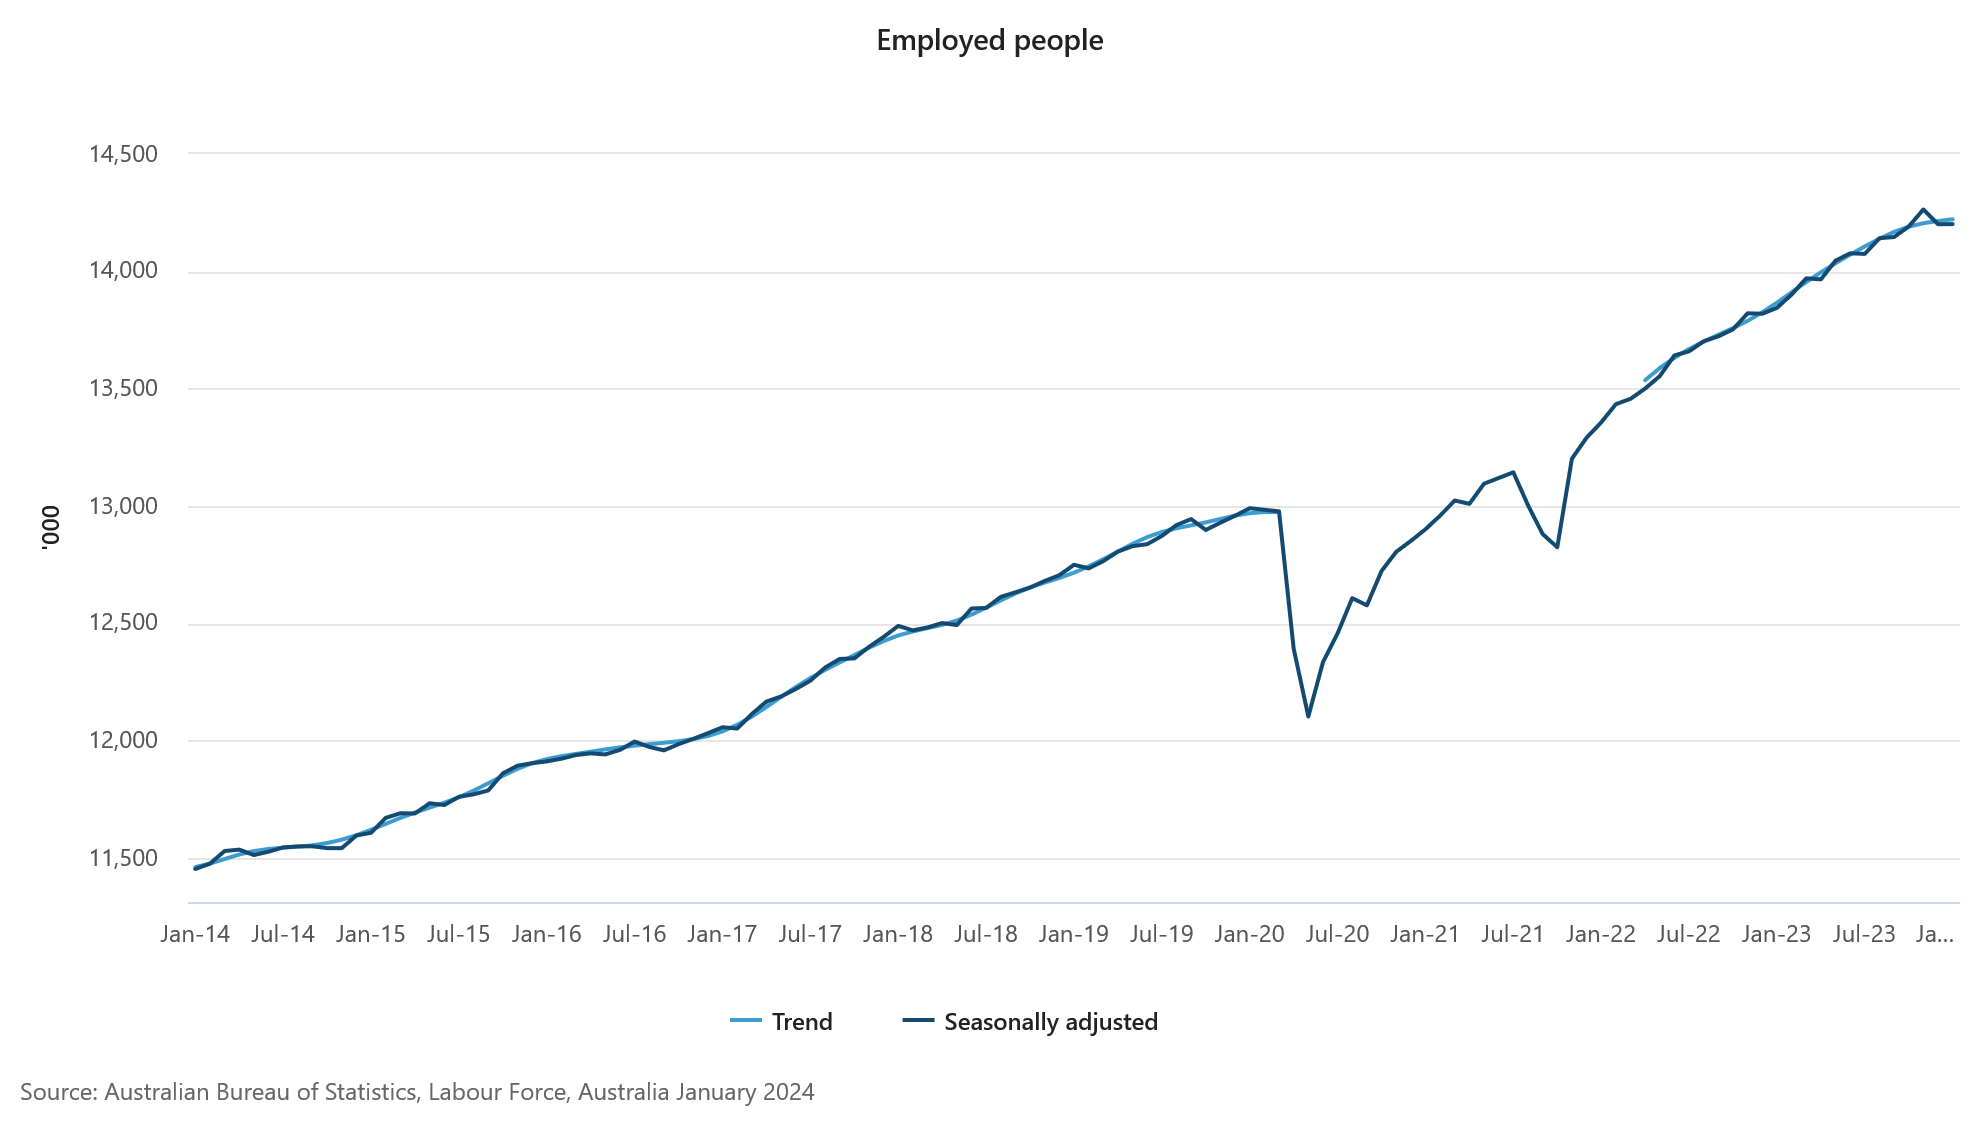
Looking past the volatility associated with shifting seasonal patterns, the headline results were broadly as we had anticipated. Growth in employment flatlined in the month, rising just +0.5k to be up 0.4% on a three-month average basis, the softest pace since the ‘delta’ outbreak in 2021. At a time of rapid population growth, the employment-to-population ratio also continues to moderate, down 0.1ppt to 64.1% in January.
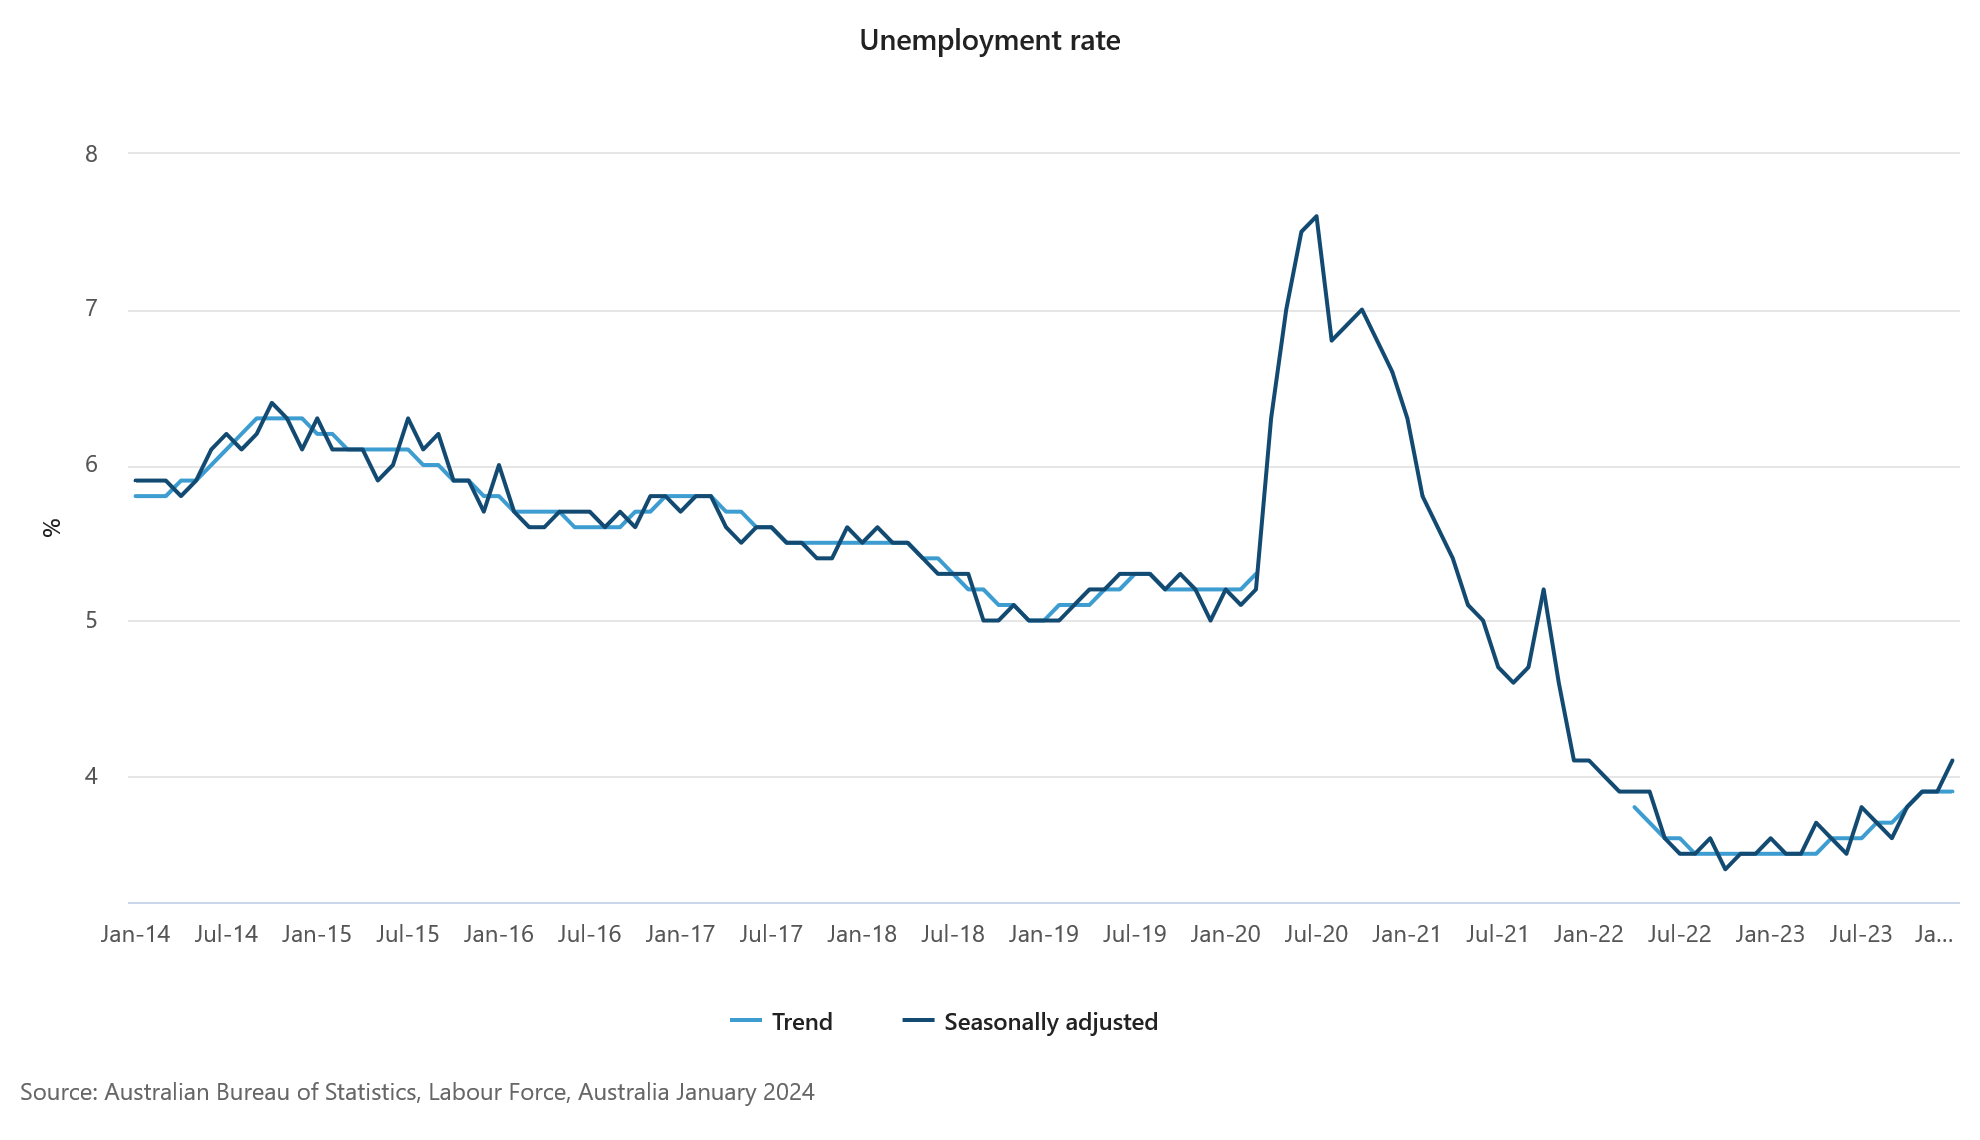
Given the flatness in employment growth, and with participation holding flat at 66.8%, the unemployment rate ticked higher from 3.9% to 4.1%, marking the first time the unemployment rate has been above 4.0% in two years. And, as discussed below, the majority of net employment growth has recently been from part-time work, and those working fewer hours are struggling to gain more, implying a very weak trend for aggregate hours worked.
Overall, the broader picture is of a labour market that is in transition, as softness begins to emerge after a period of historic tightness.
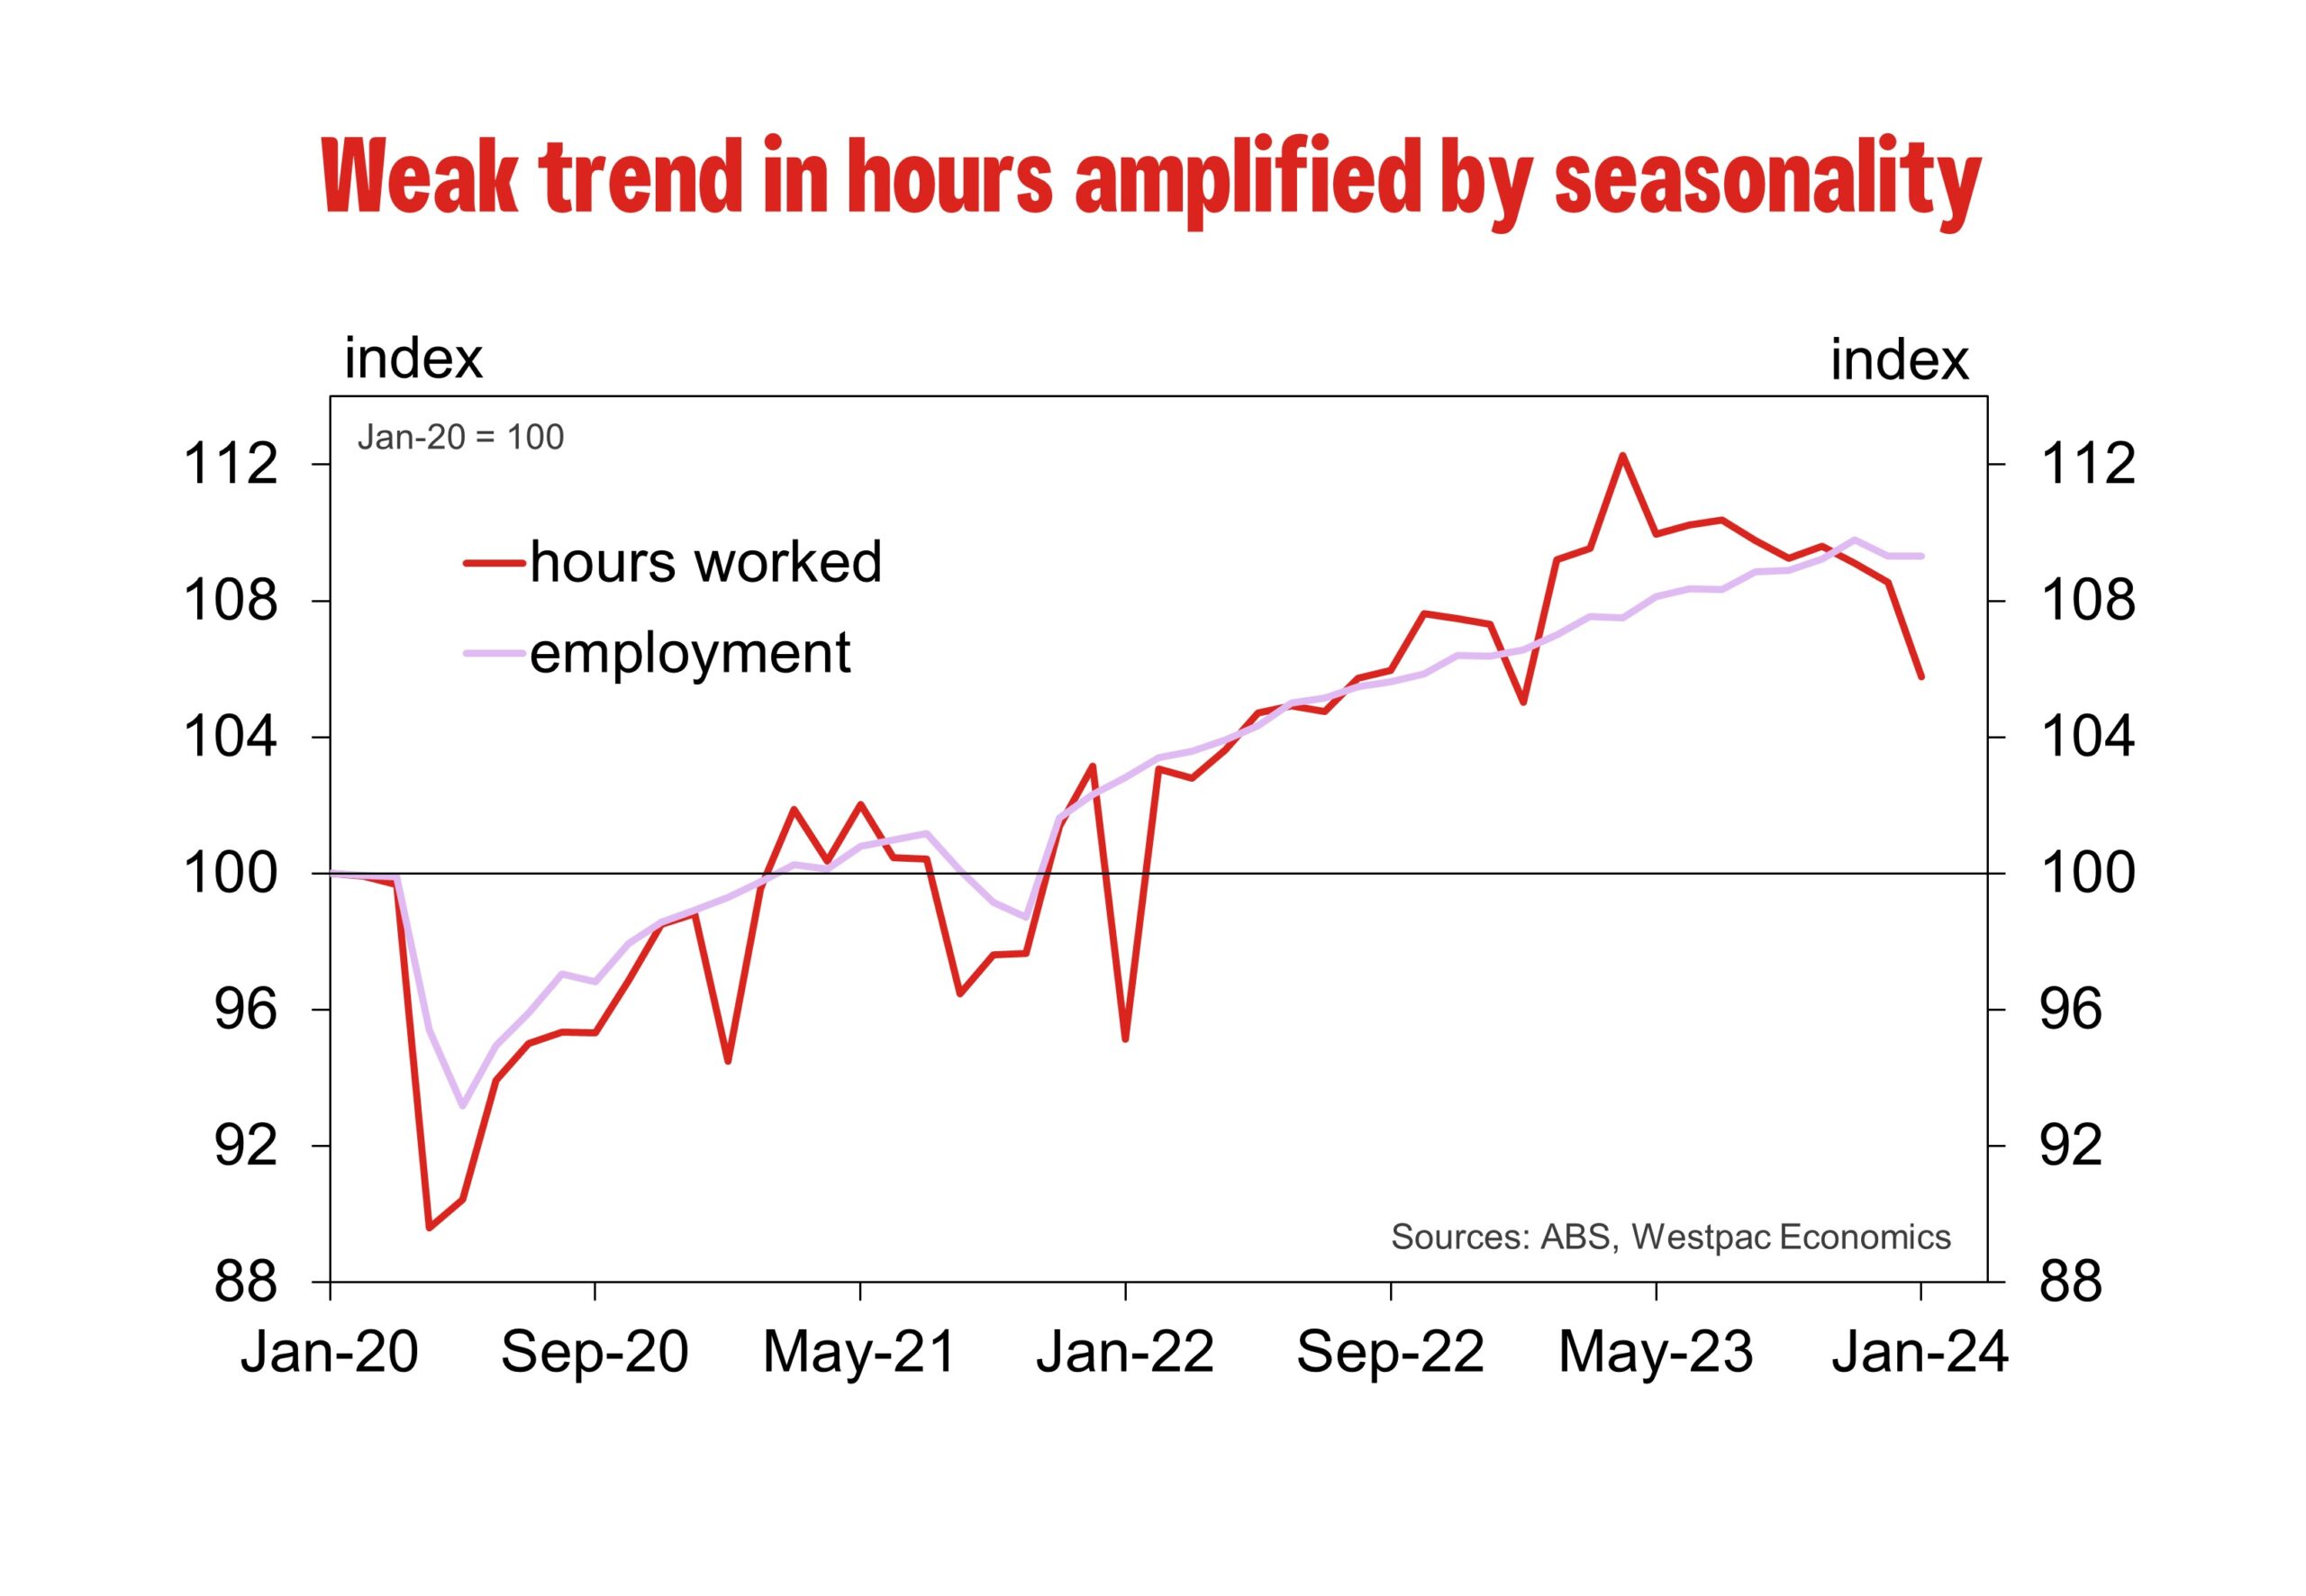
Hours Worked
The number of hours worked declined by 2.5% over the month of January. There were particularly large monthly falls in NSW (–4.1%), South Australia (–3.8%), Victoria (–3.4%), and Western Australia (–2.8%).
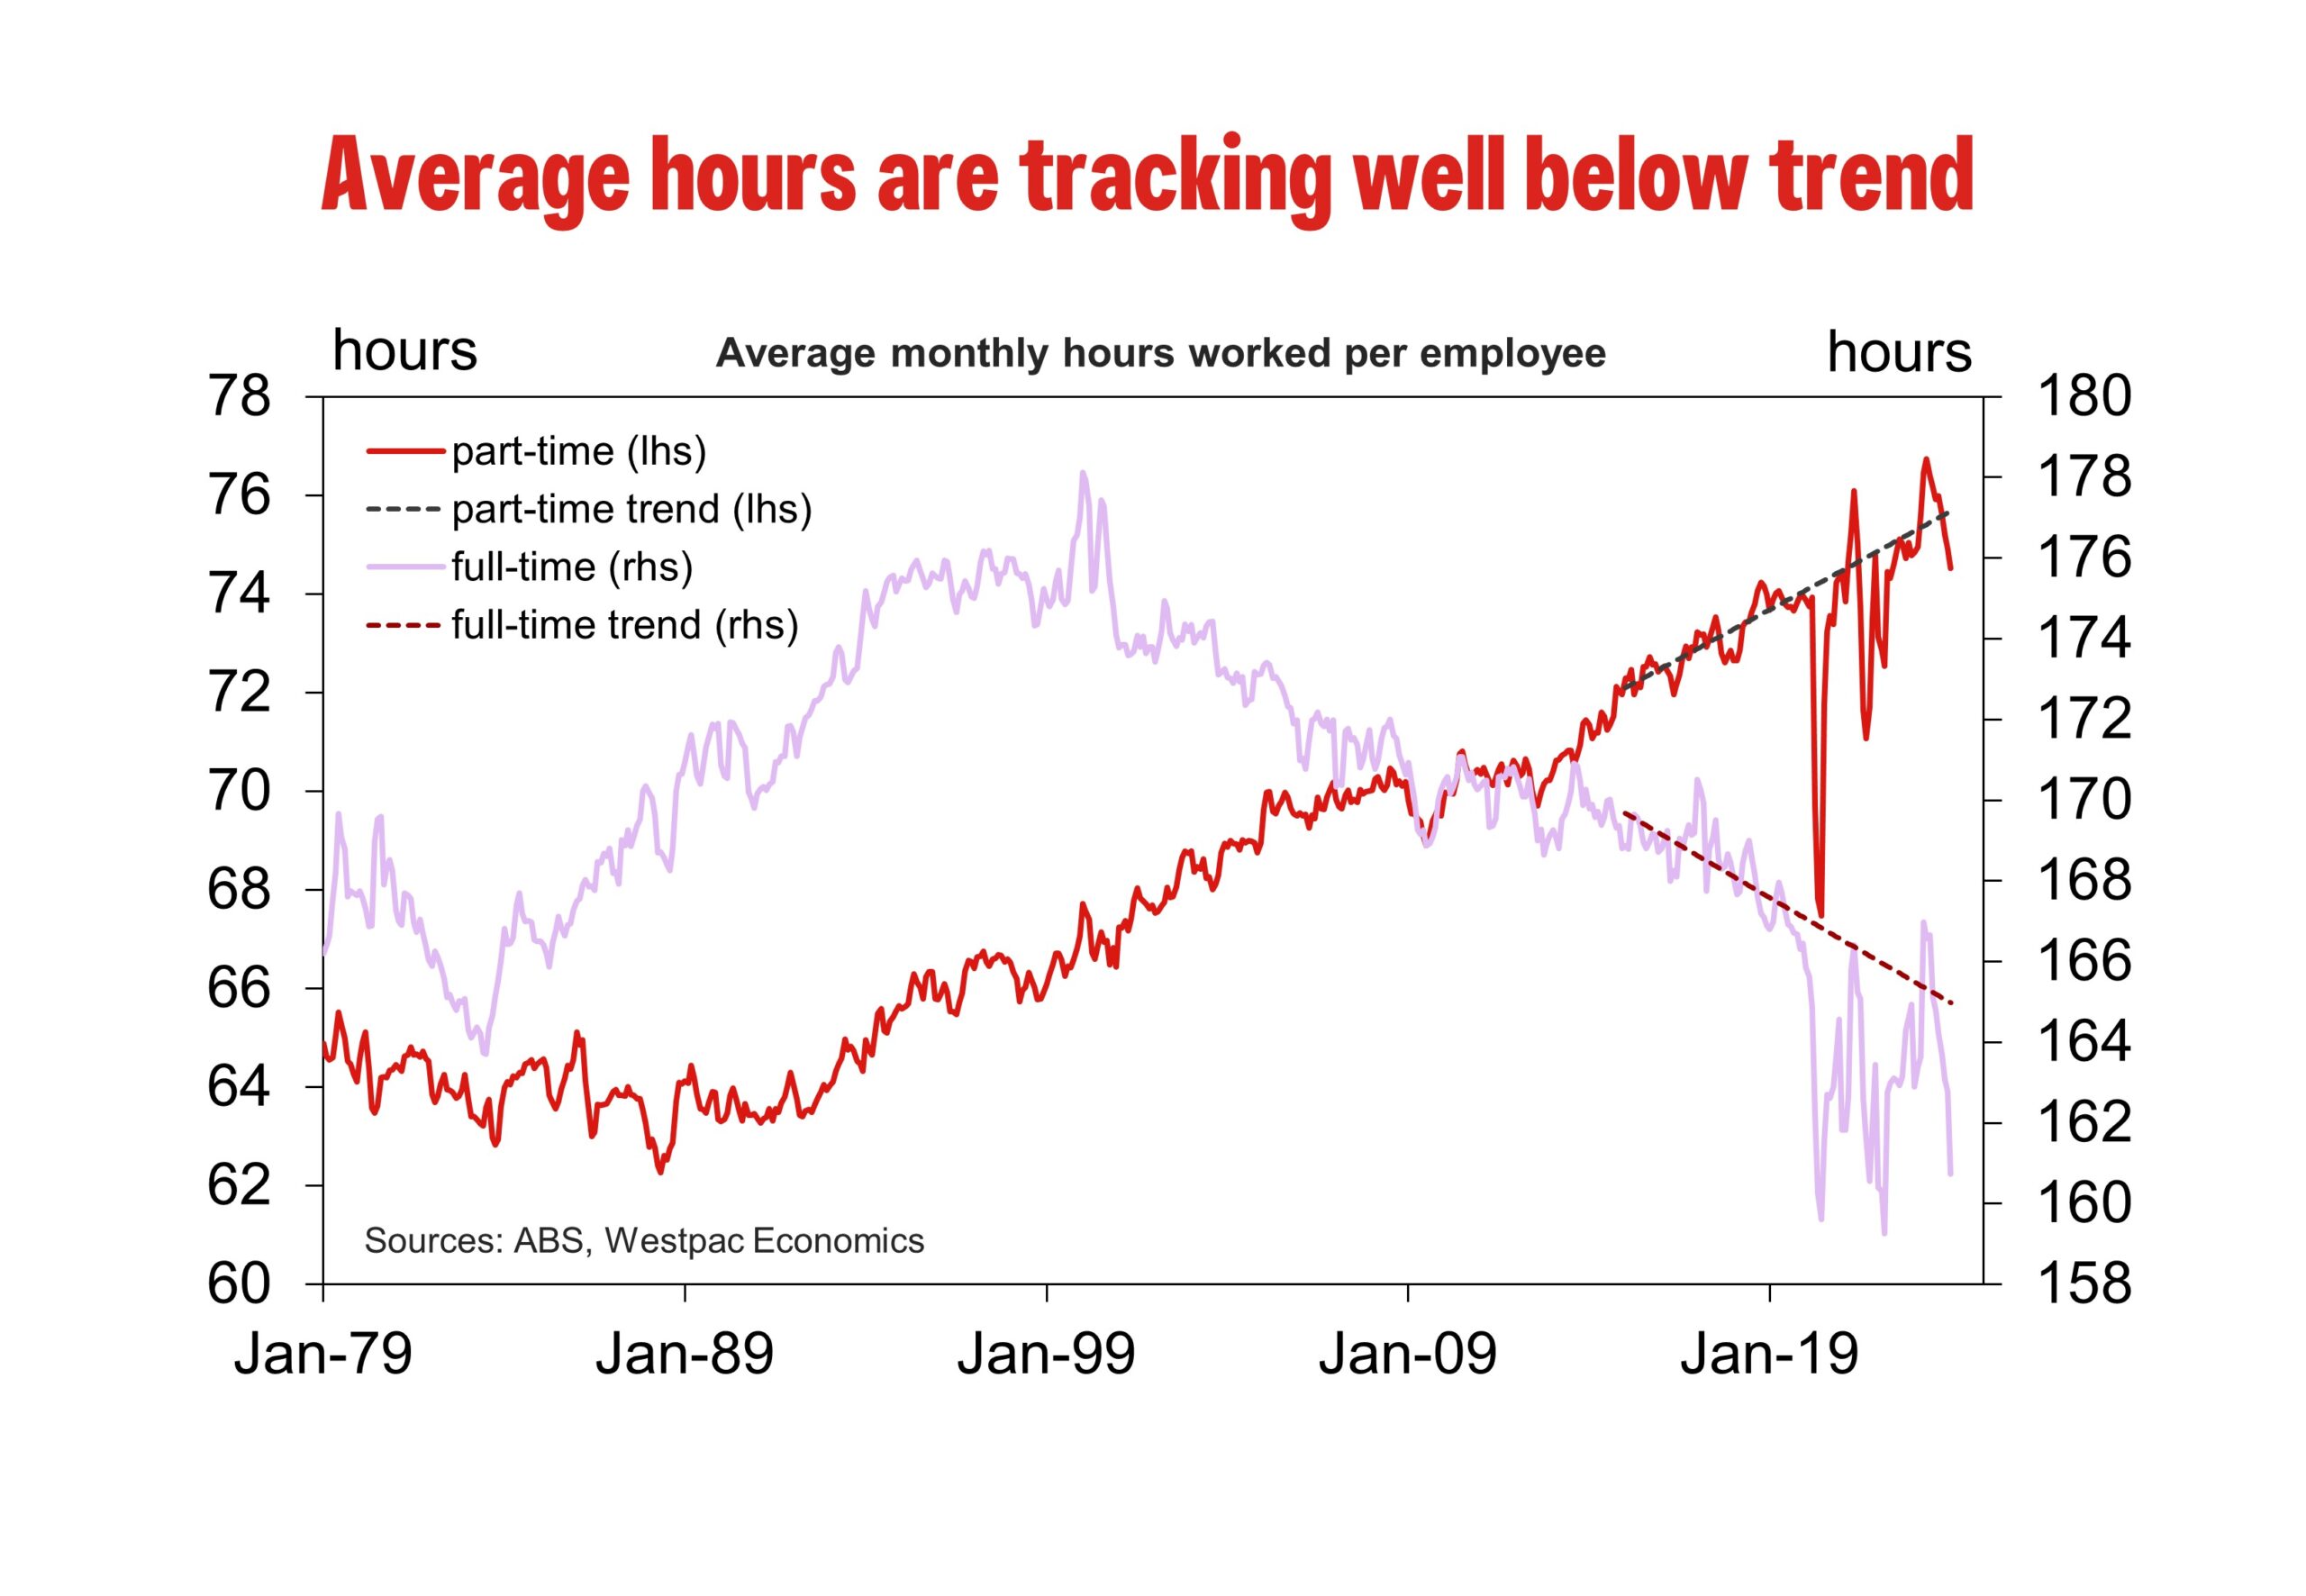
While the very weak monthly read in part reflects difficulty associated with adjusting original data for the evolving seasonal patterns, the underlying trend is unambiguously weak. Over the last six months, in annualised terms, hours worked have declined by 8.2%, the sharpest fall on record (going back to 1979) outside of the pandemic.
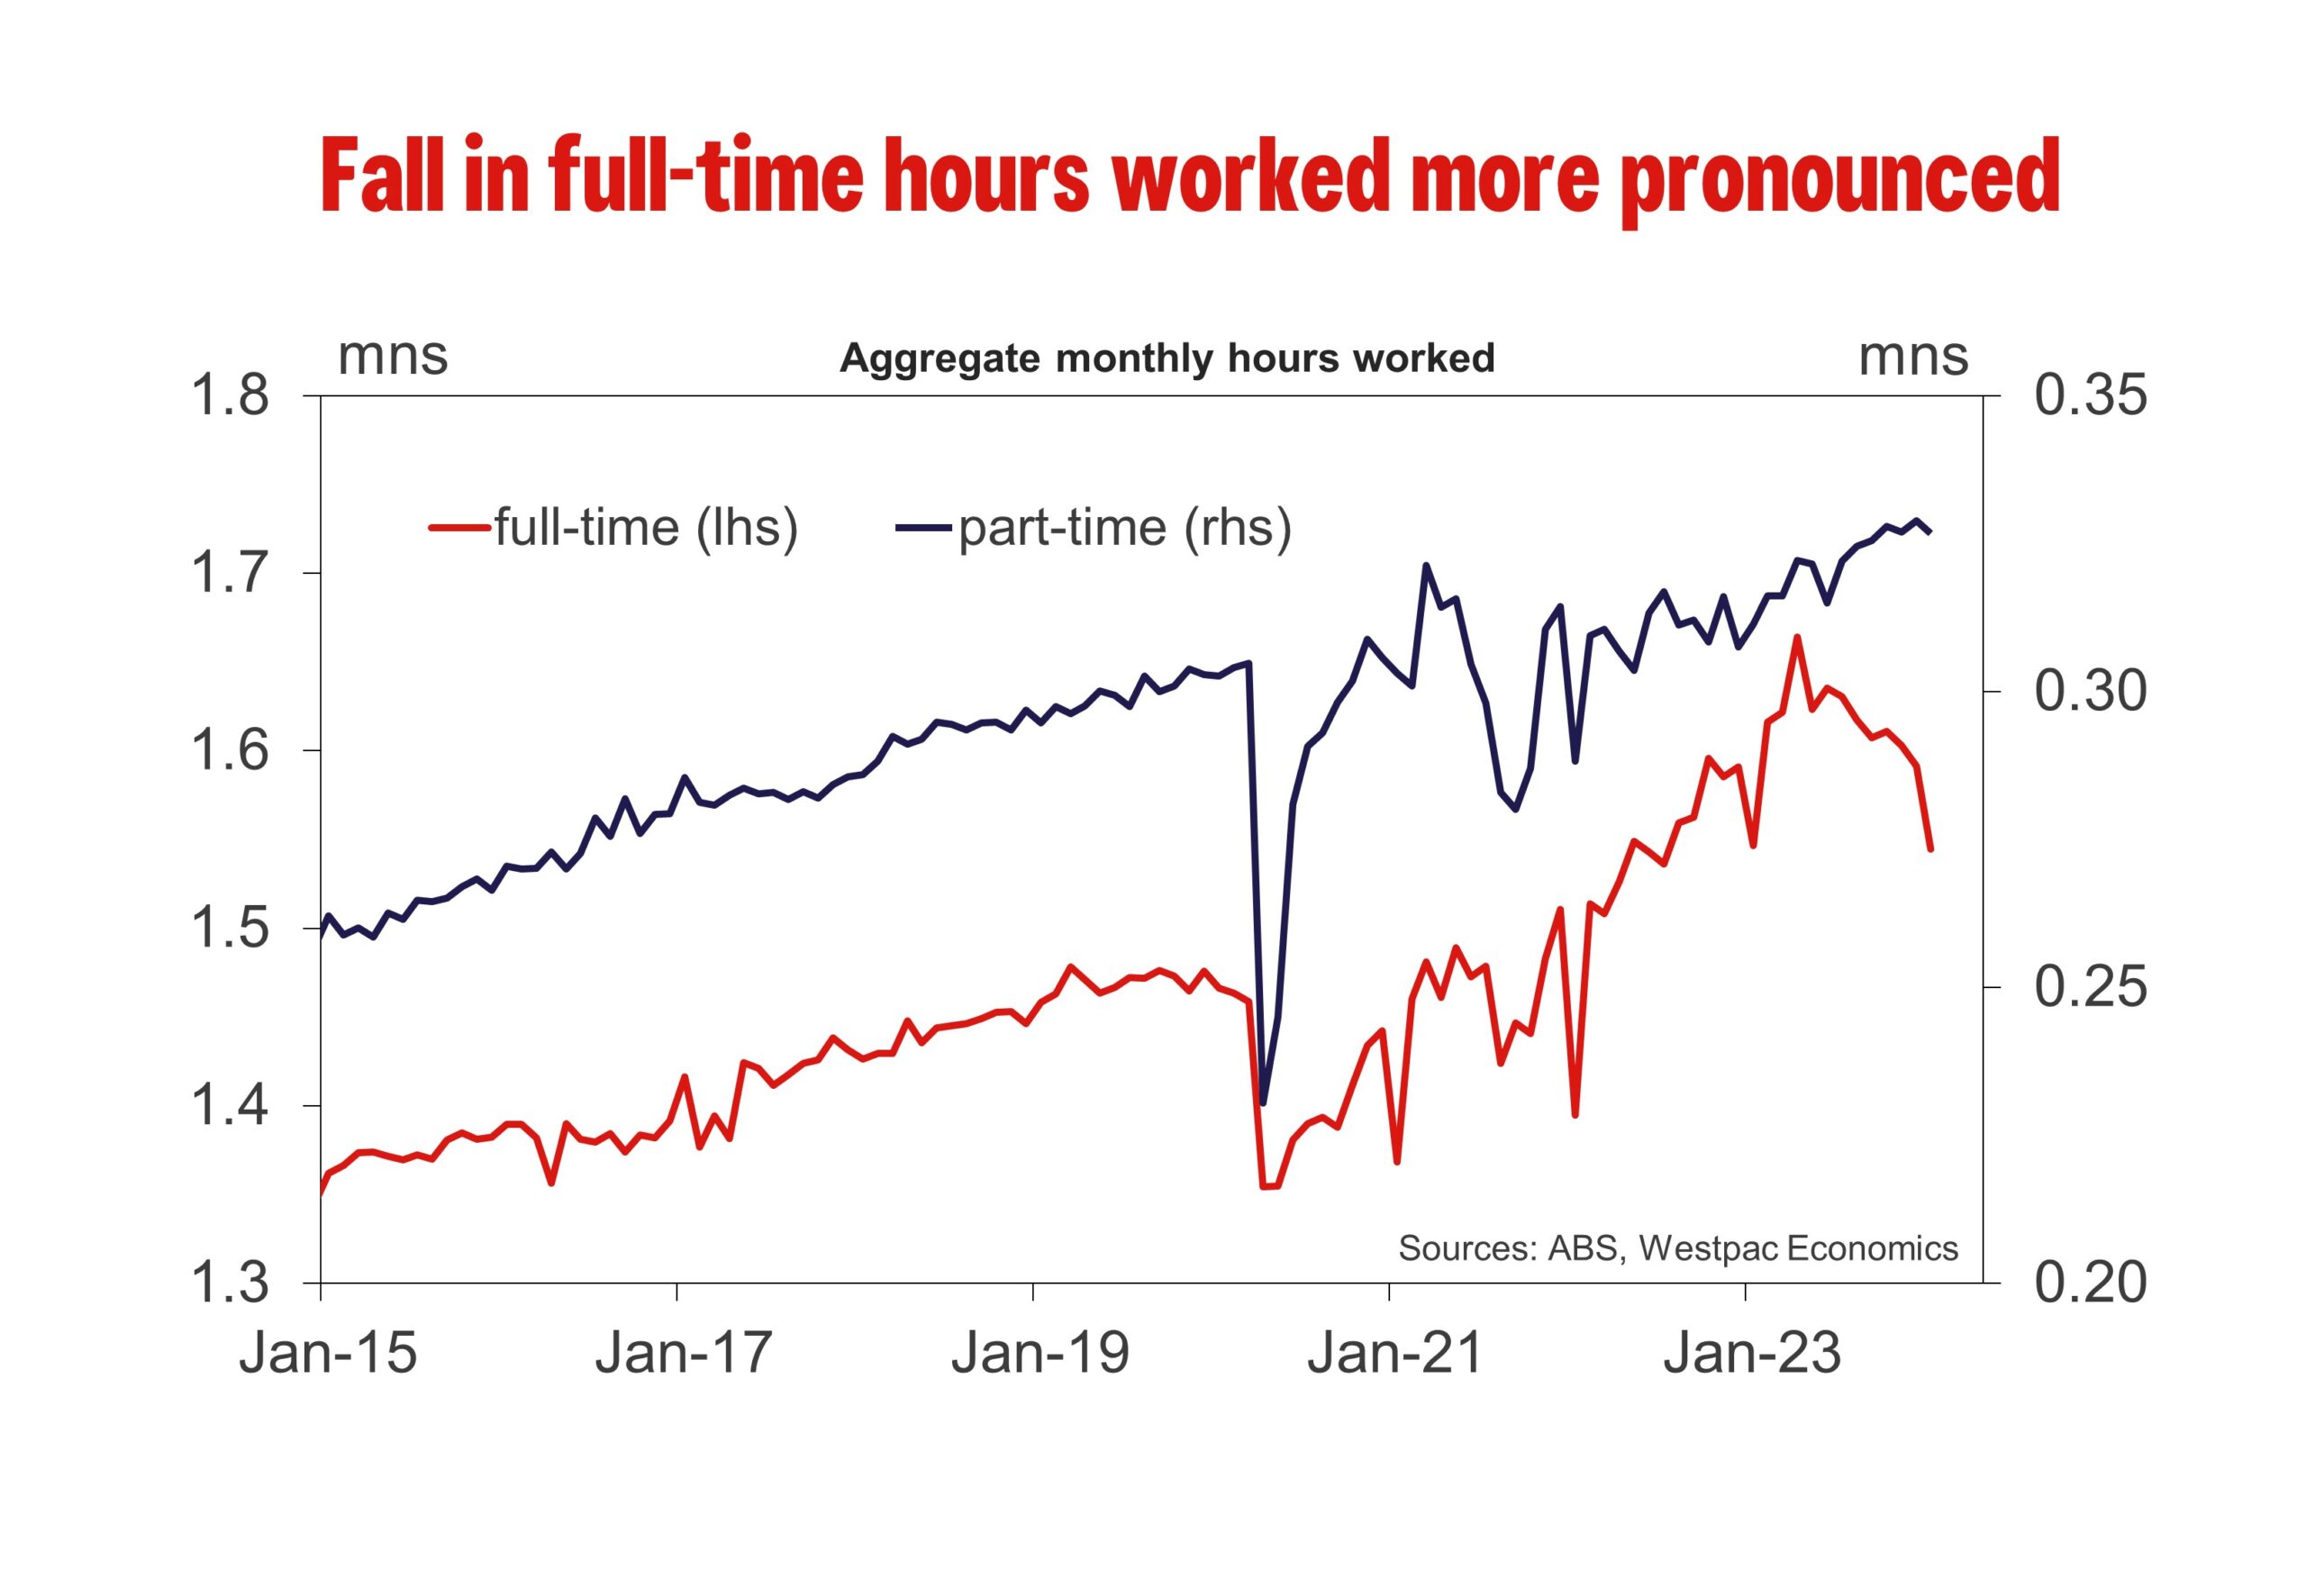
Employers are now clearly responding to the pull back in spending by adjusting the number of hours employees are required to work. With lower demand there is less need for overtime or extra shifts. This is consistent with the sharp falls we have seen in the average number of hours worked by both full time and part time employees. We have also seen a significant fall in the share of part time workers who are able to pick up extra hours and move to full time status (those working 35hrs/wk or more). This has seen the share of full-time employment fall from around 70.0% a year ago to 69.0% today, and trending toward the pre pandemic average of around 68.5%.
As the supply side of the economy continues to adjust from the pandemic and demand slows on the back of tighter macroeconomic policy, employers are likely to continue to pull back on demand for labour. Given how tight the labour market has been during this cycle, employers are understandably wary of letting people go. Instead, they are likely to make this adjustment through demanding fewer hours of their employees.
Other Labour Market Measures
Consistent with the sharp fall in the number of hours worked, other labour market indicators are pointing to a softening in conditions.
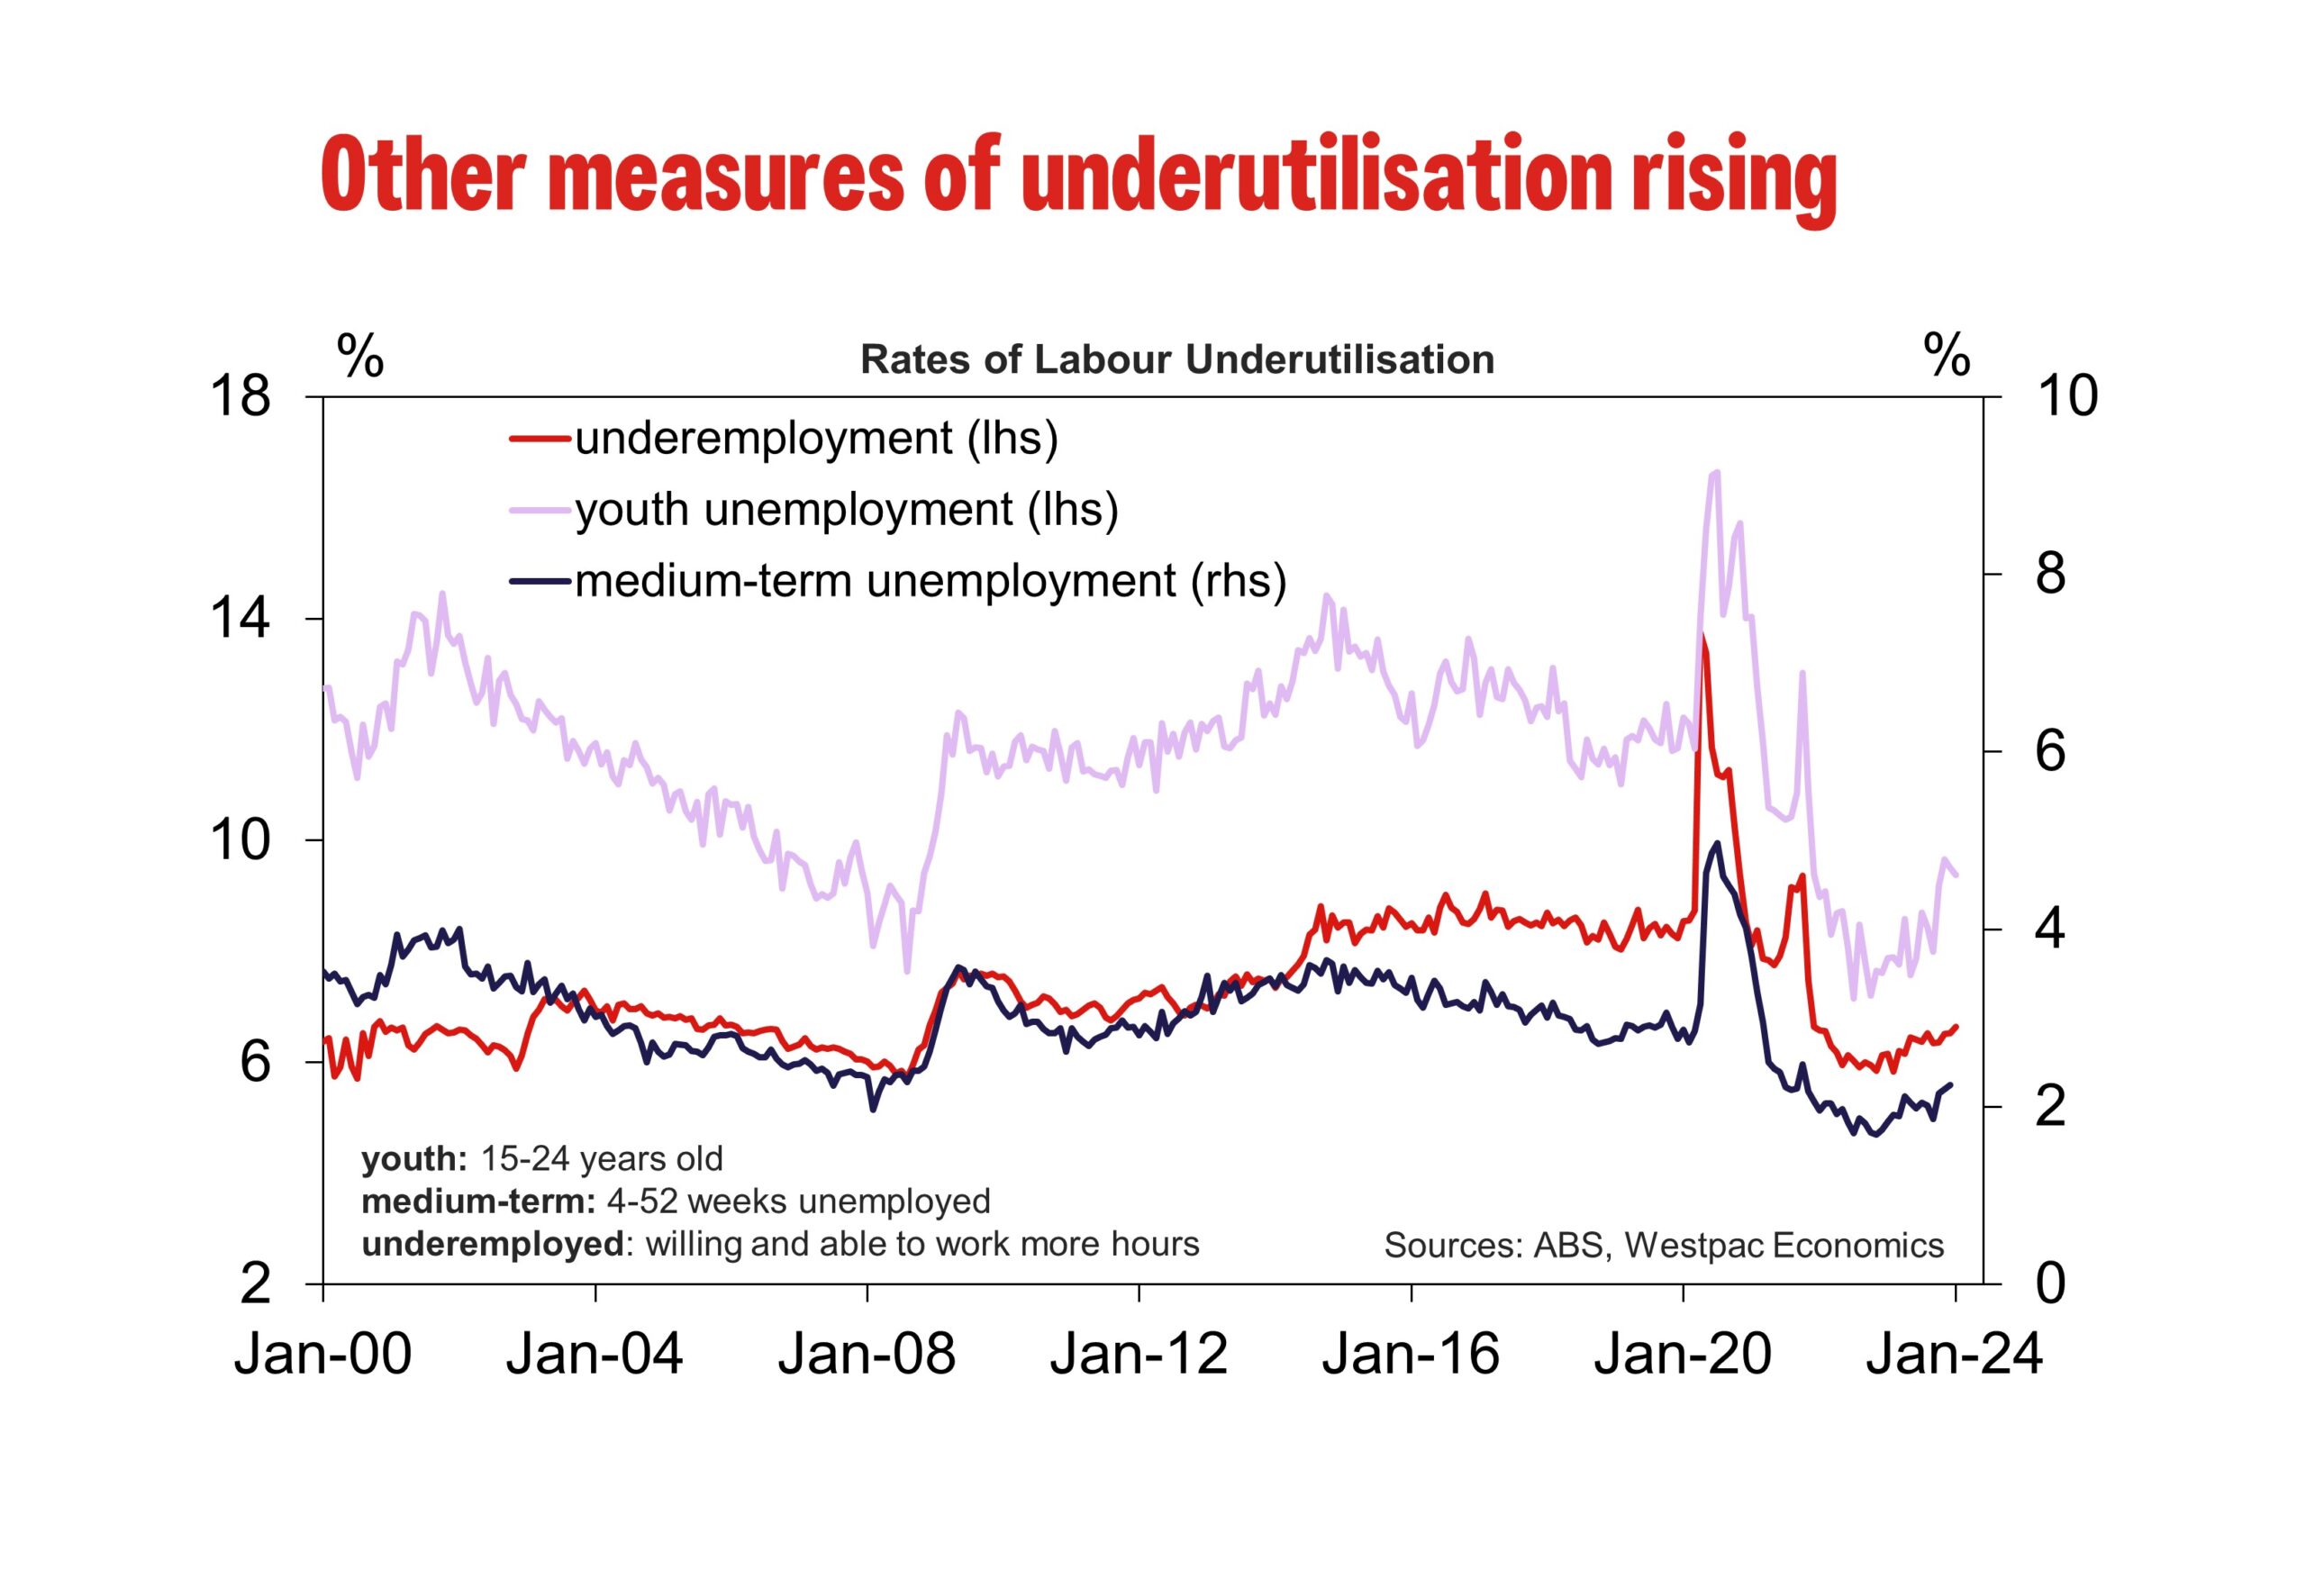
The underemployment rate, which measures the share of employed workers who are willing and able to work more hours, ticked up to 6.6% in January. Over 2023, the underemployment rate has drifted higher in trends terms, coinciding with the slide in the number of hours worked. The underutilisation rate, which combines the unemployment and underemployment rates, increased to 10.7% – highest rate since January 2022.
The youth unemployment rate, which measures the share of unemployed workers between the ages of 15 and 24, ticked lower to 9.4% from 9.5% last month. Some of this fall was driven by a lower participation rate (70.0% in January compared with 70.1% in December). Again, this could reflect difficulties associated with adjusting the data for evolving seasonal patterns. However, the trend is clear – the unemployment rate has moved higher since late 2022, with the participation rate also trending lower over this period. Being a highly sensitive group to changes in labour demand, this provides another signal that softness in labour demand is emerging.
Outlook
All-in-all, the results from the January survey were broadly consistent with our expectations. Shifting seasonal dynamics likely played a role in some of January’s weakness, and similar to last year, this may give way to something of a rebound with respect to employment and hours worked in February.
That said, the underlying tone of the data continues to speak to a softening labour market, predominately presenting through a notably weak trend for hours worked, slowing employment growth, and a gradually rising unemployment rate.
Looking ahead, as labour demand and supply continue to move into balance, tightness in the labour market will continue to fade. Given just how sharp the turnaround in hours worked has been over the past six months – as businesses respond to a weakening backdrop for domestic demand – there is increasingly limited scope for labour demand adjustment to come purely from hours worked alone. This will likely lead to weakness in employment growth and a further rise in the unemployment rate, to a forecast 4.5% by year-end.
For the RBA, today’s update provides further confirmation that the labour market is indeed easing. That said, in its February Statement on Monetary Policy, the RBA continued to assess the labour market as “tight relative to what is consistent with full employment”. More updates on the state of the labour market will be necessary before any material adjustment to that assessment occurs, especially given the seasonality associated with January’s figures.
Bitcoin Price Extend Rally, Ethereum and Altcoins Follow
Key Highlights
- Bitcoin price extended its rally above $50,000 and $51,000.
- BTC is trading above a key bullish trend line with support at $49,650 on the 4-hour chart.
- Ethereum also rallied above the $2,650 and $2,700 resistance levels.
- XRP and SOL are also showing signs of bullish bias.
Bitcoin Price Technical Analysis
Bitcoin price corrected lower after it spiked above the $50,000 resistance. BTC tested the $48,250 zone and recently started a fresh rally.
Looking at the 4-hour chart, the price is trading above a key bullish trend line with support at $49,650. There was a strong increase above the $50,000 level. BTC settled well above the 100 simple moving average (red, 4 hours) and the 200 simple moving average (green, 4 hours).
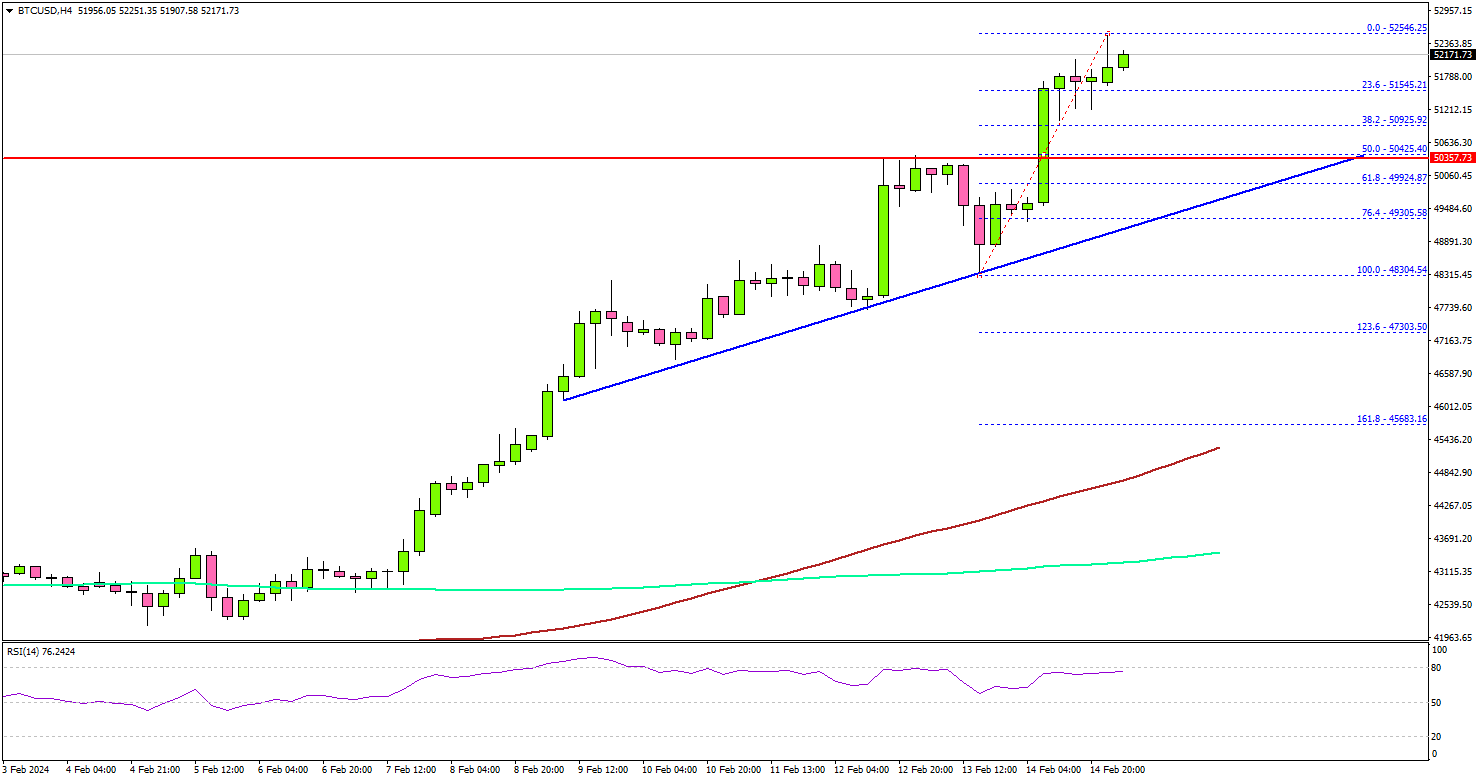
The bulls were able to pump Bitcoin above the $52,000 level. Immediate resistance is near the $52,450 level. The next resistance is near $53,200. A successful close above the $53,200 level might start another steady increase.
In the stated case, the price may perhaps rise toward the $55,000 level. Any more gains might send Bitcoin toward the $56,200 level in the near term.
If not, the price might start a downside correction. Immediate support is near the $50,800 zone. The next major support is $50,000 or the trend line. Any more losses might send the price toward the $49,200 support zone.
The next key support is near the $48,800 level, below which there is a risk of a drop toward the $46,500 level in the coming days.
Economic Releases
- US Initial Jobless Claims - Forecast 220K, versus 218K previous.
- US Retail Sales ex Autos for Jan 2024 (MoM) – Forecast +0.2%, versus +0.4% previous.
Japan enters technical recession amid falling consumption and investment
Japan's economy has entered a technical recession as GDP unexpectedly contracted by -0.1% qoq in Q4, much worse than expectation of 0.3% qoq growth. That also marked a continuation from -0.8% contraction seen in Q3. On annualized basis, the downturn was -0.4%, a stark contrast to the anticipated 1.4% growth and following -3.3% contraction in the previous quarter.
The contraction is attributed primarily to decline in private consumption, which accounts for over half of the Japanese economy, falling by -0.2% qoq. Capital expenditure, another significant driver of private-sector growth, also decreased by -0.1% qoq. However, external demand, as indicated by the net exports, provided a slight buffer, contributing 0.2 percentage points to GDP, with exports growing by 2.6% qoq.
Economy Minister Yoshitaka Shindo emphasized the importance of solid wage growth to support consumer spending, which he noted is currently "lacking momentum" amidst rising prices. He also pointed out that BoJ considers a broad range of data, including consumption patterns and risks to the economy, when formulating monetary policy.
Australia’s employment grows 0.5k in Jan, unemployment rate rises to 4.1%
Australia's job market showed further signs of cooling in January, as the latest employment data reveals a modest increase of just 0.5k jobs, significantly below expectation of 20.7k growth. Looking at the details, full-time employment saw an uptick of 11.1k, counterbalanced by reduction in part-time job by -10.6k.
Unemployment rate unexpectedly rose from 3.9% to 4.1%, above expectation of 4.0%. That also marked the first occasion in two years since January 2022 that the rate has breached the 4% threshold. Participation rate held steady at 66.8%, but a notable decrease in monthly hours worked by -2.5% mom paints a picture of a slackening labor market.
RBA’s Bullock highlights inflation persistence and demand-supply imbalance
In today's Senate Estimates appearance, RBA Governor Michele Bullock underscored the "persistent" nature of inflationary pressures within the Australian economy.
She pointed out the crucial distinction between demand growth rates and overall demand levels, emphasizing "growth rates are slowing, but aggregate demand is still above aggregate supply, and that's what's generating inflationary pressures."
Bullock remained optimistic about RBA's ability to manage inflation effectively without jeopardizing employment growth. "We think we're in a good position to get inflation down in a reasonable amount of time while still keeping employment growing," she noted.
Fed’s Barr: Rate cut decisions hinge on continued good data
In a speech overnight, Fed Vice Chair Michael Barr noted that the FOMC is "confident" that US is "on a path to 2% inflation". However, Barr underscored the importance of seeing "continued good data" before initiating reduction in federal funds rate.
Reflecting on the latest consumer product index inflation report, he acknowledged the potential for a "bumpy" journey back to the target inflation rate, emphasizing the need for a "careful approach" in the current economic climate.
BoE’s Bailey highlights persistent concerns over services inflation and wage trends
During an appearance the House of Lords Economics Affairs Committee, BoE Governor Andrew Bailey highlighted that UK's inflation rates have fluctuated, slightly overshooting last month and slightly undershooting this month. The development balanced out to "pretty much leaves us where we were".
He noted the inflation trend were "obviously encouraging" potential worse outcomes. However, he emphasized that services inflation is at levels that are "not compatible with a 2% sustained inflation target". Meanwhile, pay growth reduction was "just not quite as far as we thought."
Bailey's observations come after the latest CPI data remained steady at 4% in January, with core CPI also unchanged at 5.1%. Bailey's comment suggested that this week's data s unlikely to prompt immediate policy shifts.
XAUUSD: What To Expect Now
Following the CPI data release on Tuesday, the price of Gold dropped from its recent high at $2,000 all the way through to the $1980 region where it is currently sitting. As we anticipate what could be next for the yellow metal ahead of the Retails sales data release from the US. In the meantime, here are my projections for XAUUSD going forward.
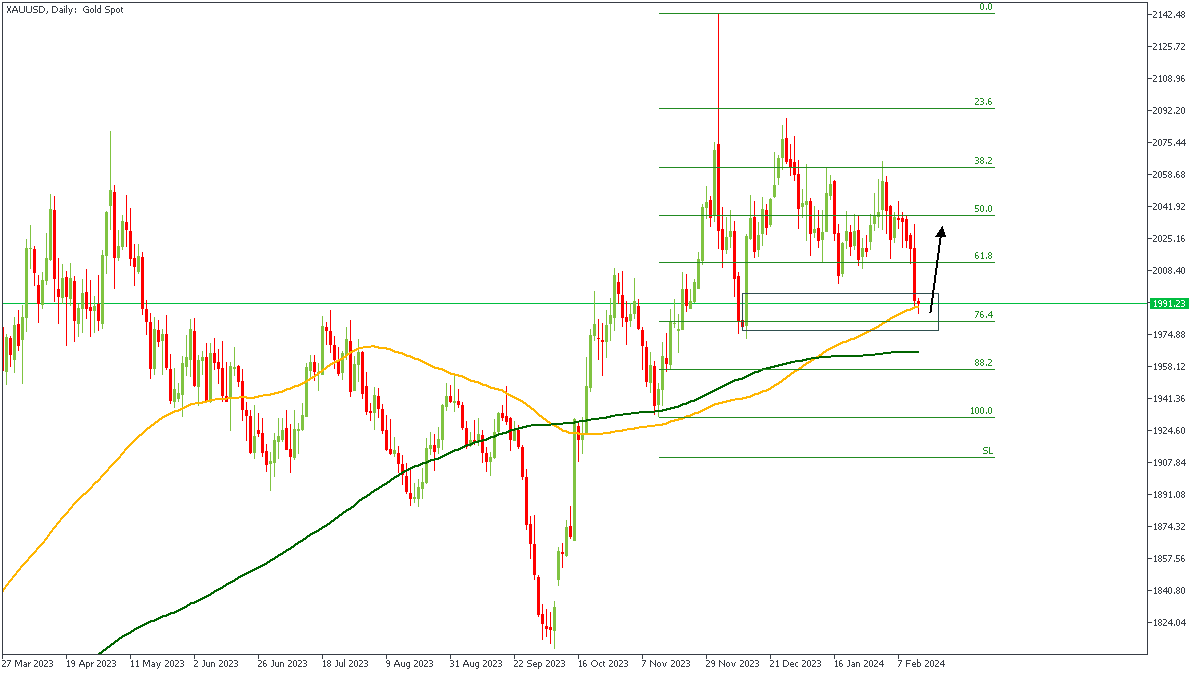
XAUUSD - D1 Timeframe
The analysis on XAUUSD that I shared a few weeks ago; in January, I pointed out the bearish movement that has recently played out flawlessly so far, and now the demand zone that was indicated as my target has been reached. In line with this, I expect to see the confluence of the 100-day moving average, the 76% of the Fibonacci retracement, and the bullish array of the moving averages provide the market with renewed bullish vigor.
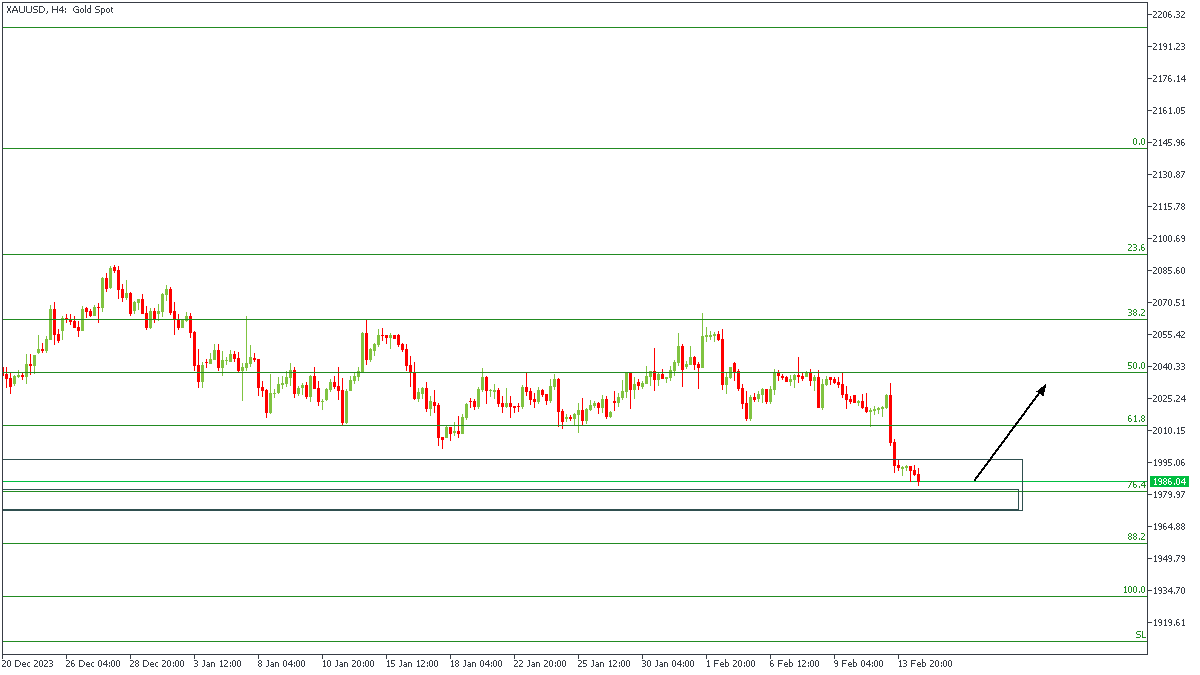
XAUUSD - H4 Timeframe
On the 4-hour timeframe of XAUUSD, we can see price currently trading within the demand zone on the 76% Fibonacci retracement level. It is noteworthy that this demand zone sits right within the demand zone on the daily timeframe, and I consider that a good confirmation for incoming bullish pressure.
Analyst’s Expectations:
- Direction: Bullish
- Target: $2020.95
- Invalidation: $1972.22
CONCLUSION
The trading of CFDs comes at a risk. Thus, to succeed, you have to manage risks properly. To avoid costly mistakes while you look to trade these opportunities, be sure to do your due diligence and manage your risk appropriately.
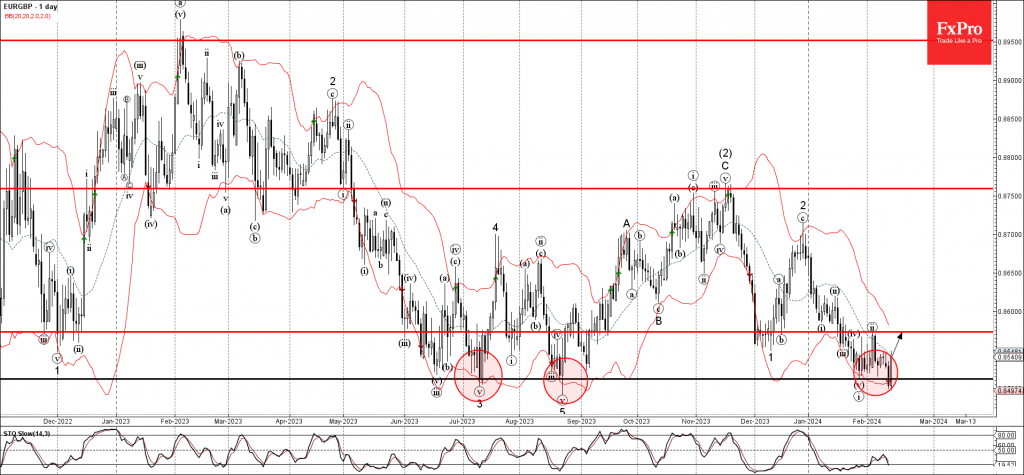
EURGBP Wave Analysis
- EURGBP reversed from support level 0.8510
- Likely to rise to resistance level 0.8575
EURGBP currency pair recently reversed up from the key support level 0.8510 (which has been reversing the price from July), strengthened by the lower daily Bollinger Band.
The upward reversal from the support level 0.8510 created the daily Japanese candlesticks reversal pattern Bullish Engulfing.
EURGBP currency pair can be expected to rise further to the next resistance level 0.8575 (top of the previous minor correction ii).