
Sample Category Title
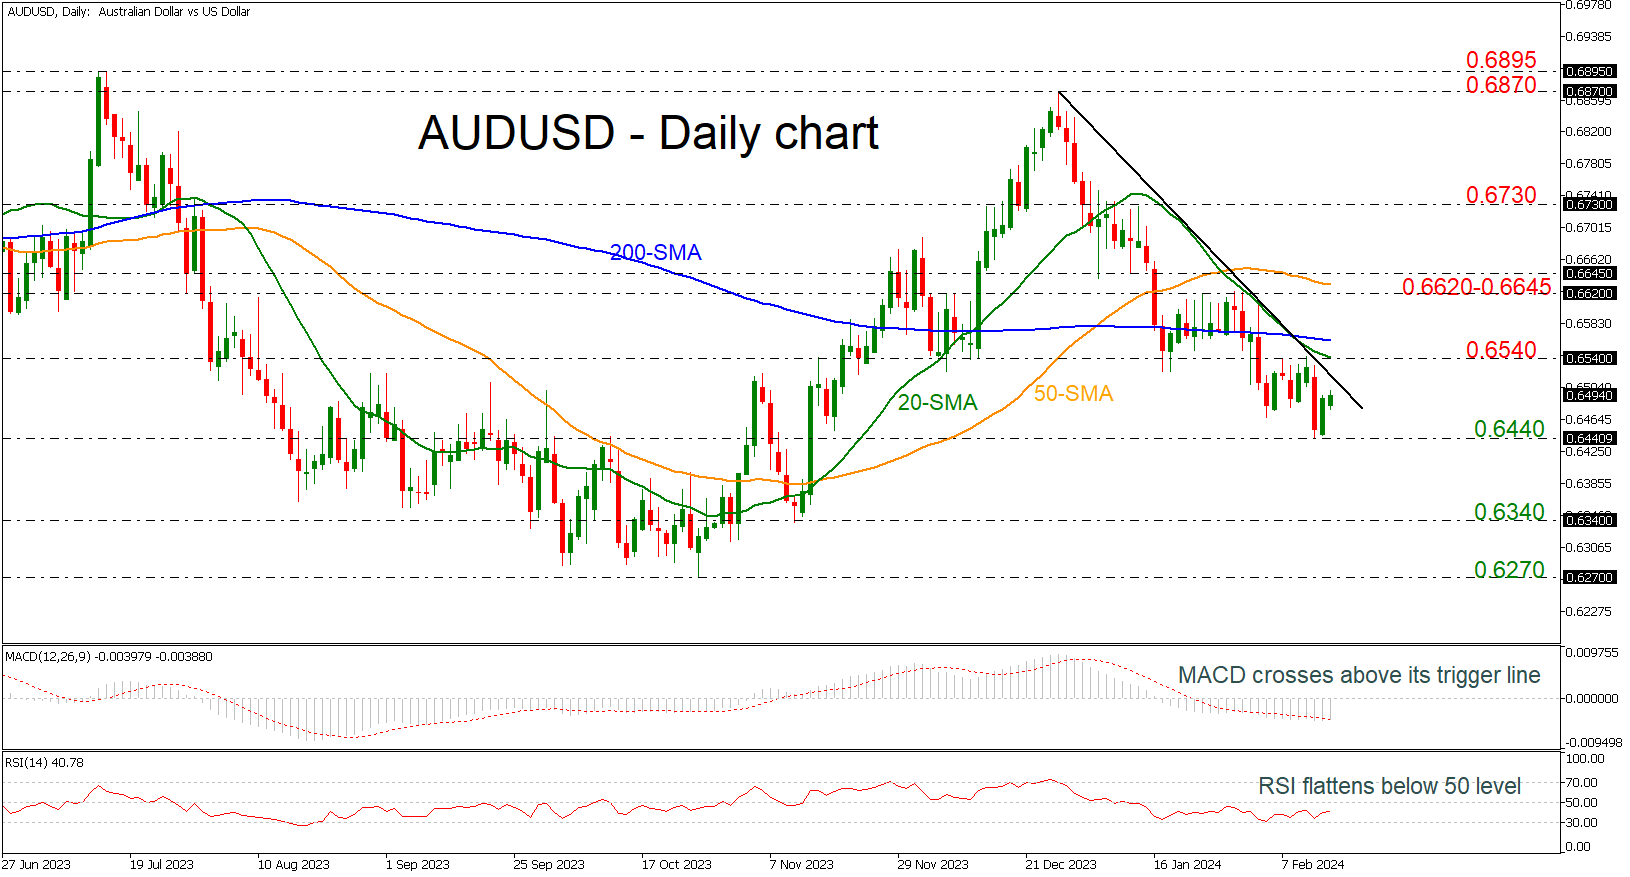
AUDUSD Rises from 0.6440 Bottom
- AUDUSD still holds below the downtrend line
- But MACD and RSI suggest bullish correction
AUDUSD has been overperforming over the last two sessions after the rebound off the 0.6440 support level. However, the market remains beneath the short-term descending trend line, which has been drawn after the price peaked at 0.6870.
Technically, the MACD oscillator is crossing to the upside of its trigger line in the negative territory, while the RSI, following the strong bounce off the 30 level, is currently moving horizontally below the neutral threshold of 50.
If the buying interest persists, immediate resistance could come from the 0.6540 resistance level, which overlaps with the 20-day simple moving average (SMA) and stands slightly above the falling trend line. More aggressive bullish movements could meet the 200-day SMA at 0.6563 ahead of the crucial area of 0.6620-0.6645, which encapsulates the 50-day SMA.
Alternatively, if there is a decline beneath the previous bottom of 0.6440, the pair may challenge the 0.6340 support, registered on November 10, before heading south at 0.6270.
To sum up, AUDUSD has been developing in a descending movement and only a significant climb above the 0.6620-0.6645 resistance zone may switch the outlook to a neutral one.
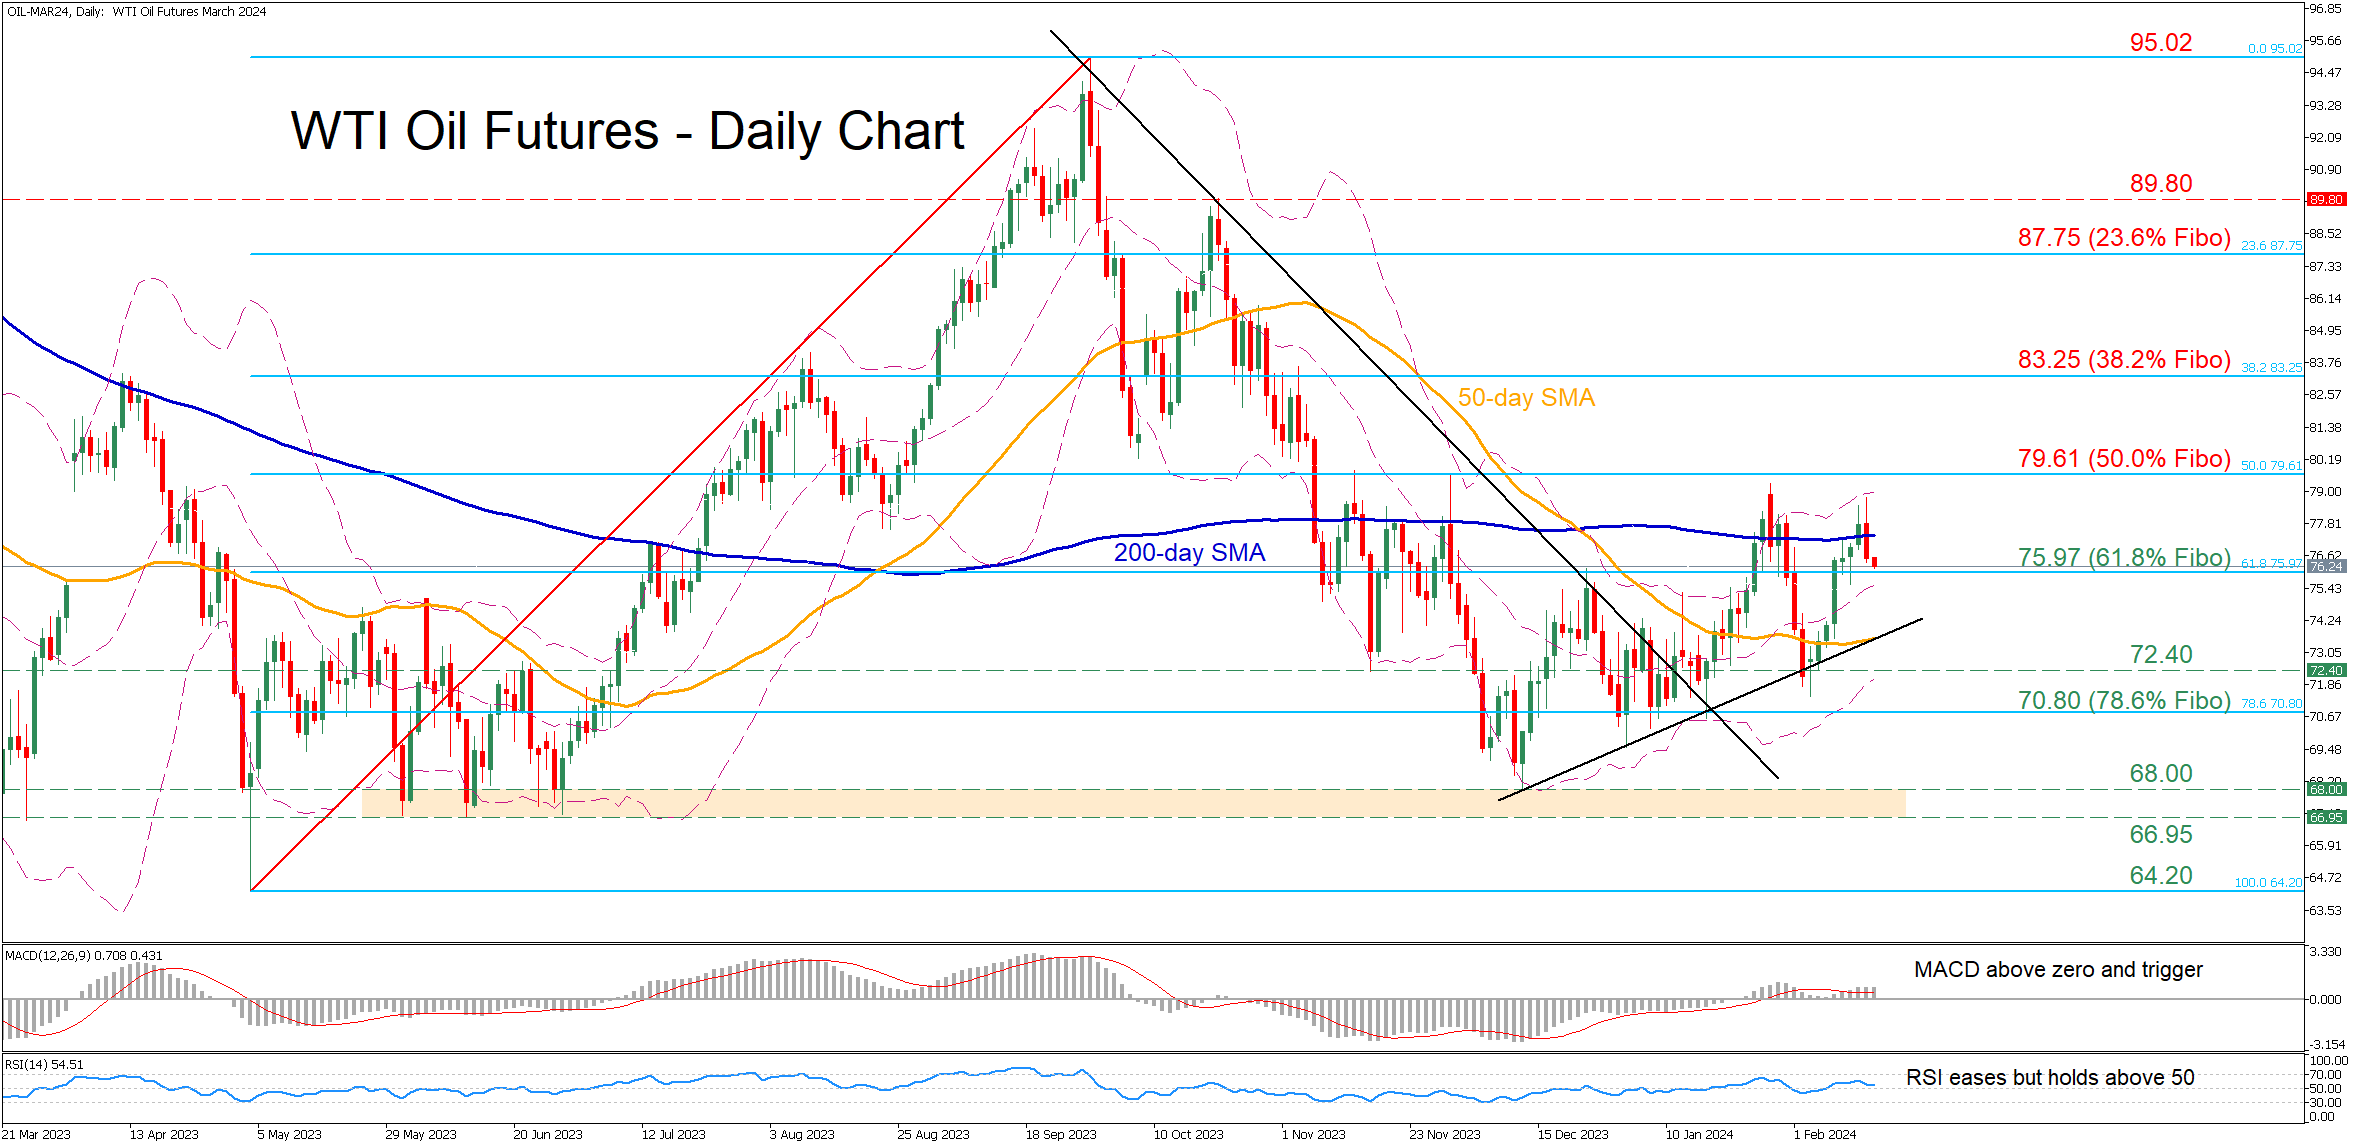
WTI Oil Futures Get Rejected at 200-day SMA
- WTI futures retreat after testing 200-day SMA
- Pattern formation resembles a double top
- Momentum indicators weaken but remain positive
WTI oil futures (March delivery) had been staging a comeback after their decline below the 50-day simple moving average (SMA) came to an end in early February. However, the bulls failed to conquer the 200-day SMA, which led to the price reversing back lower on Wednesday.
Should bearish pressures persist, oil futures could challenge 75.97, which is the 61.8% Fibonacci retracement of the 64.20-95.02 upleg. Lower, the November bottom of 72.40 could act as the next line of defence. A violation of that zone could set the stage for the 78.6% Fibo of 70.80 ahead of the 66.95-68.00 support range defined by June lows and the recent six-month bottom.
On the flipside, if buyers re-emerge and propel oil above the 200-day SMA, immediate resistance could be found at the 50.0% Fibo of 79.61. Further upside attempts could then stall around the 38.2% Fibo of 83.25. Surpassing that zone, the price could ascend to face the 23.6% Fibo of 87.75.
In brief, WTI oil futures lost some ground after getting rejected a tad below their January high, generating a bearish double-top pattern. For the bulls to regain confidence, the price needs to close above the 200-day SMA.
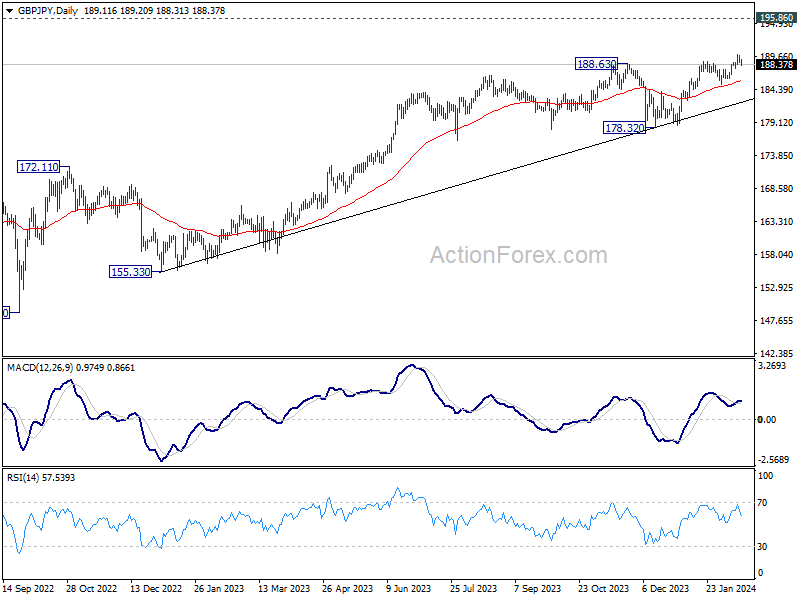
GBP/JPY Daily Outlook
Daily Pivots: (S1) 188.70; (P) 189.31; (R1) 189.87; More...
Intraday bias in GBP/JPY remains neutral at this point, for consolidations below 190.05. Break 190.05 will resume larger up trend. However, break of 187.83 will turn bias to the downside for deeper correction back to 185.21 support instead.
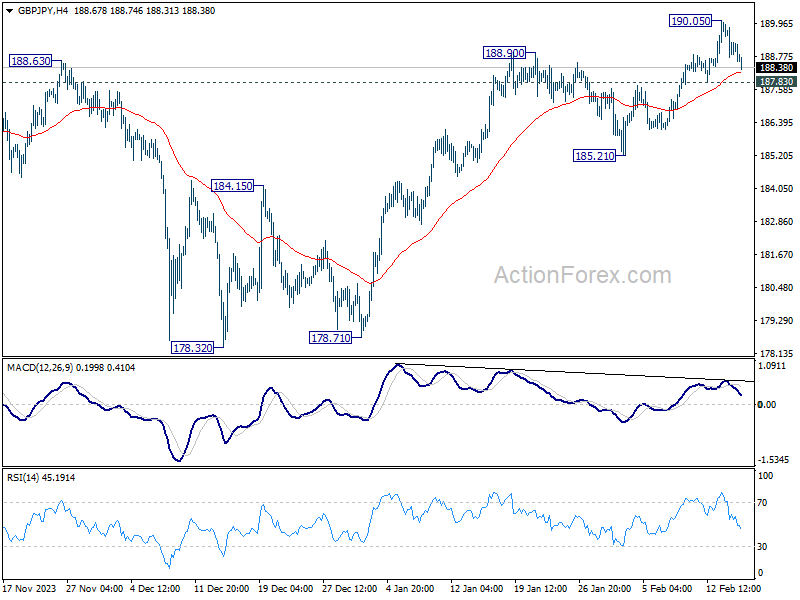
In the bigger picture, up trend from 123.94 (2020 low) in in progress. Medium term outlook will stay bullish as long as 178.32 support holds. Next target is 195.86 long term resistance (2015 high).
EUR/JPY Daily Outlook
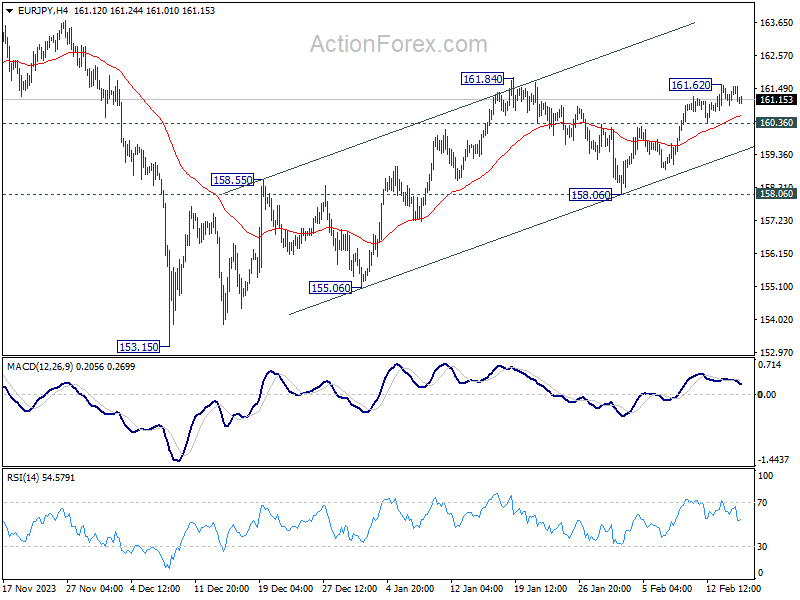
Daily Pivots: (S1) 161.14; (P) 161.37; (R1) 161.77; More...
Intraday bias in EUR/JPY is turned neutral first as it retreated ahead of 161.84 resistance On the upside, firm break of 161.84 will confirm resumption of whole rise from 153.15. Next target is a retest on 164.29 high. On the downside, however, below 160.36 will extend the pattern from 161.84 with another falling leg, and turn bias to the downside for 158.06 support instead.
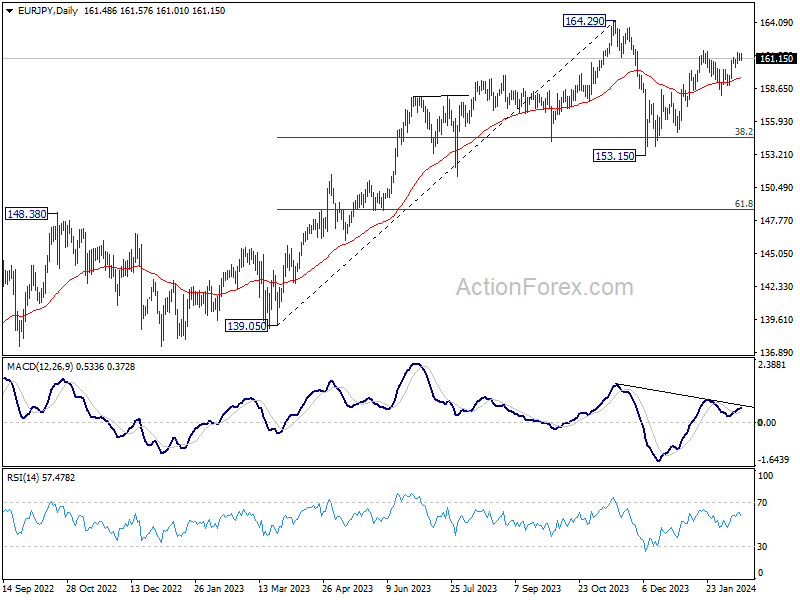
In the bigger picture, price actions from 164.29 medium term top are seen as a correction to rise from 139.05 only. As long as 148.38 resistance turned support holds (2022 high), larger up trend from 114.42 (2020 low) is expected to resume through 164.29 at a later stage. Next target would be 169.96 (2008 high).
EUR/GBP Daily Outlook
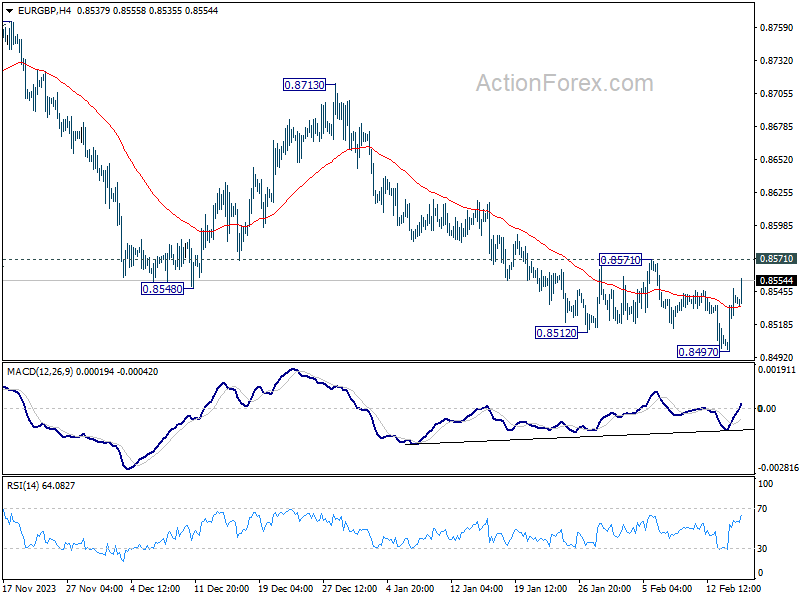
Daily Pivots: (S1) 0.8507; (P) 0.8528; (R1) 0.8558; More...
Intraday bias in EUR/GBP as it's capped below 0.8571 resistance despite extended recovery. On the downside, break of 0.8497 will resume extend recent fall to 0.8464 projection level. Nevertheless, considering bullish convergence condition in 4H MACD, sustained break of 0.8571 will confirm short term bottoming, and turn bias back to the upside for stronger rebound.
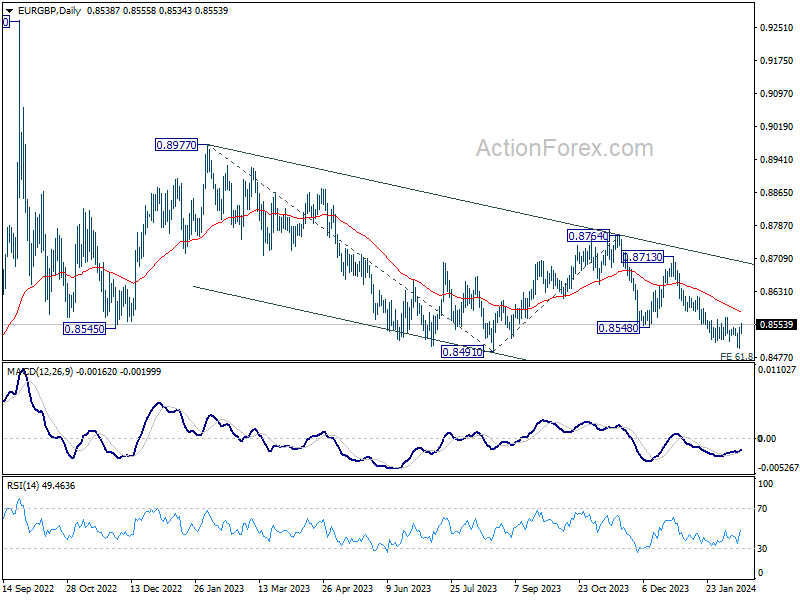
In the bigger picture, fall from 0.8764 is seen as another leg in the whole down trend from 0.9267 (2022 high). Outlook will stay bearish as long as 0.8713 resistance holds. Break of 0.8491 will target 61.8% projection of 0.8977 to 0.8491 from 0.8764 at 0.8464.
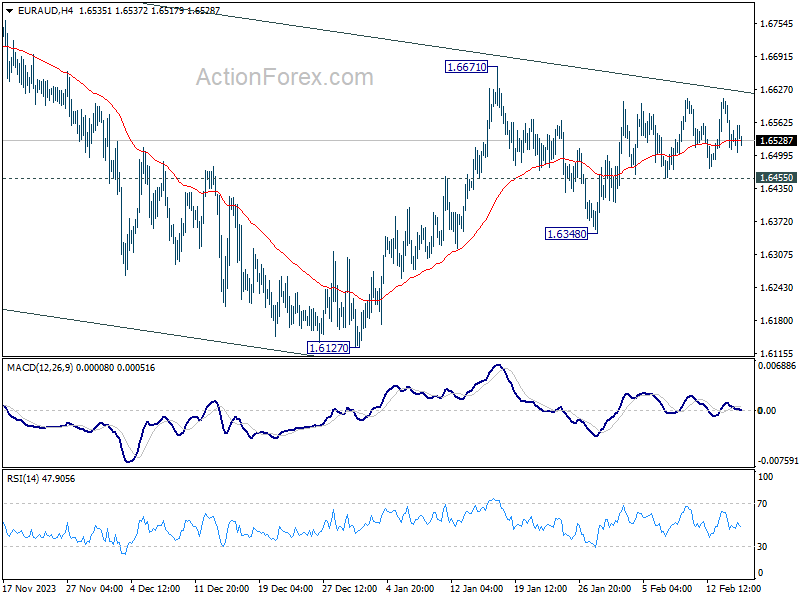
EUR/AUD Daily Outlook
Daily Pivots: (S1) 1.6490; (P) 1.6549; (R1) 1.6584; More...
EUR/AUD is still bounded in sideway trading and intraday bias remains neutral. On the upside, decisive break of 1.6671 will revive the case that whole correction from 1.7062 has completed with three waves down to 1.6127. Further rally should then be seen to 1.6844 resistance for confirmation. Nevertheless, below 1.6455 minor support will turn bias to the downside for 1.6348 and possibly below.
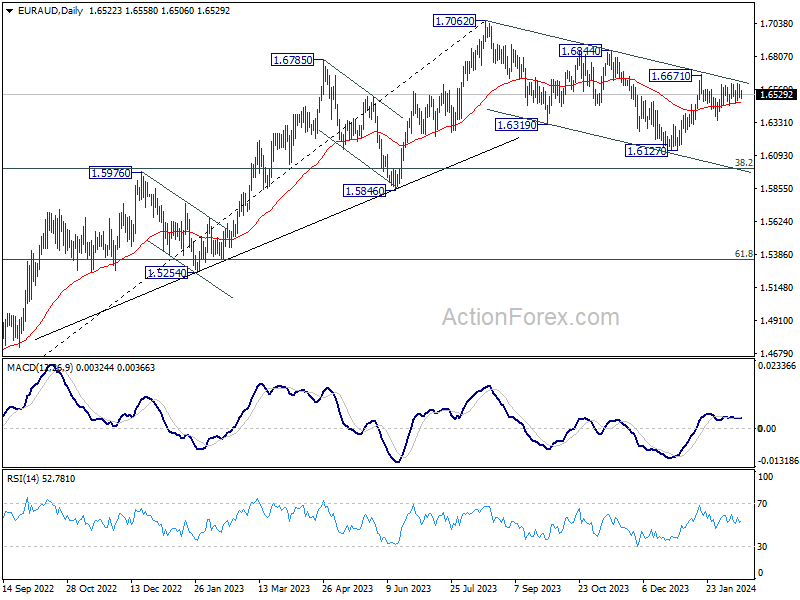
In the bigger picture, fall from 1.7062 medium term top is seen as a correction to the up trend from 1.4281 (2022 low). Break of 1.6844 resistance will argue that this up trend is ready to resume through 1.7062 high. In case of another fall, strong support should be seen around 1.5846 and 38.2% retracement of 1.4281 to 1.7062 at 1.6000 to bring rebound.
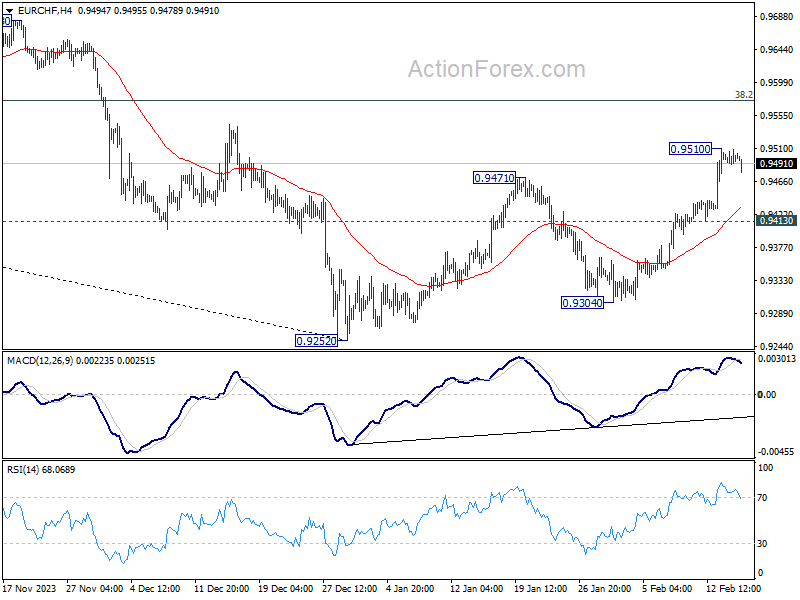
EUR/CHF Daily Outlook
Daily Pivots: (S1) 0.9490; (P) 0.9500; (R1) 0.9513; More...
Intraday bias in EUR/CHF is turned neutral first with current retreat, and some consolidations could be seen first. But downside should be contained by 0.9413 minor support to bring another rally. On the upside, break of 0.9510 will resume the rebound from 0.9252 and target 0.9574 fibonacci level and above.
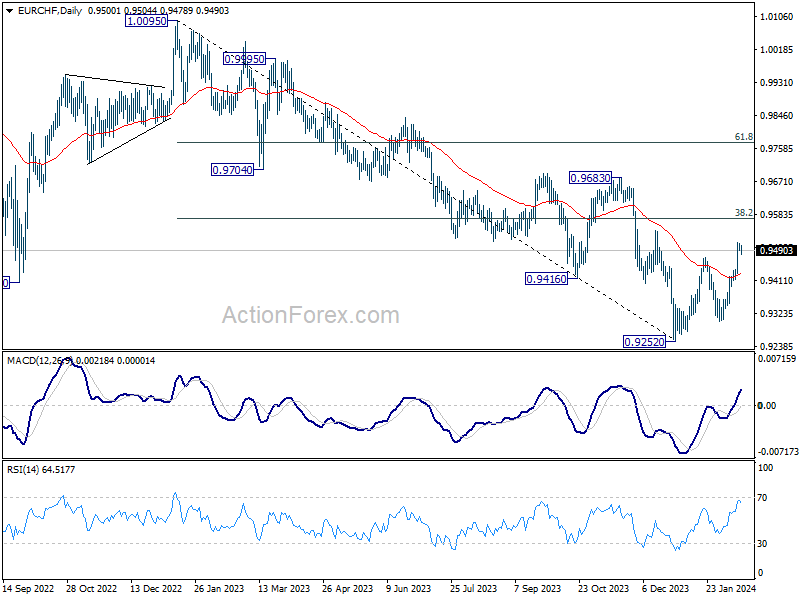
In the bigger picture, price actions from 0.9252 are tentatively seen as a correction to the five-wave down trend from 1.0095 (2023 high). Further rise would be seen to 38.2% retracement of 1.0095 to 0.9252 at 0.9574. But overall medium term outlook will remain bearish as long as 0.9683 resistance holds.
Japanese GDP Unexpectedly Contracted in Q4
Markets
Broader markets recovered from the big post-CPI swings yesterday in absence of new drivers. US Treasuries rebounded, but technical breaks through resistance levels (in yield terms) weren’t undone. US yields eventually returned 8.5 bps (3-yr) to 2.8 bps (30-yr). Dovish Chicago Fed governor Goolsbee downplayed the upshot in monthly inflation dynamics, saying that inflation can be a bit higher while still being on track to 2%. He doesn’t support waiting until the 2% inflation goal before cutting policy rates, labelling monetary policy currently as being quite restrictive. Finally, he emphasized that the Fed’s inflation goal in based on PCE deflators and not on this week’s published CPI inflation. The January stickiness of (CPI) inflation was partly because of shelter which has a far bigger weight in CPI calculations compared to the way PCE deflators are constructed. January PCE data will only be released on February 29. Washington-based Fed governor Barr (vice-chair for supervision) after (US) market close backed the official Fed guidance that more good data are needed before begin the process of reducing policy rate. A careful approach is needed given the limited historical experience with current growth and inflation dynamics. He welcomed goods price deflation which helped pull inflation off peak levels, but suggests that that trend has played out. He hopes on ebbing housing inflation and moderating wage growth to help pull services inflation down. ECB vice-governor de Guindos and Bundesbank Nagel held their respective neutral and hawkish views. Central bank focus will today shift to ECB President Lagarde’s hearing before the Committee on Economic and Monetary Affairs of the European Parliament. US eco data are plenty including retail sales, the empire manufacturing survey, Philly Fed business outlook, weekly jobless claims, export/import prices and industrial production. We expect data on balance to put US Treasuries back under selling pressure.
European and US stock markets recovered as well yesterday, gaining 0.5% to 1%. EUR/USD set a new YTD low at 1.0695 before rebounding towards 1.0730. EUR/GBP went on a two-day rollercoaster ride, testing 0.85 on strong labour market data on Tuesday, but swinging back to 0.8550 yesterday on slightly better inflation figures. Disappointing Q4 GDP data this morning suggest that yesterday’s market direction will be the dominant one today as well. GDP declined by 0.3% Q/Q (technical recession) with investments (+1.4% Q/Q) failing to make up for declining consumption (-0.1% Q/Q) and (net) exports. On top, Q3 GDP data faced downward revisions.
News & Views
Australian employment barely grew in January. Only 0.5k jobs were added, a fraction of the 25k rebound that was expected following a sharp drop in December (-62.7k). A slightly bigger rise in full time employment compensated for a drop in part-timers. The unemployment rate rose from 3.9% to 4.1%, topping the 4% mark for the first time since January 2022. Head of Australia’s labour statistics bureau Jarvis nuanced however, by saying that this “coincided with a higher-than-usual number of people who were not employed but who said they will be starting or returning to work in the future.” The participation rate remained steady at 66.8%, below the 67.3% record high of November last year but well above pre-pandemic levels. Monthly hours worked fell by 2.5%, which Jarvis attributed to changing market dynamics around the summer holiday period (more people taking annual leave). The Australian dollar lost some ground in the wake of the underwhelming report. AUD/USD after touching the 0.65 big figure returned to 0.648 currently. Australian swap yields ease between 6.7 and 7.9 bps across the curve. A first rate cut is for 96% priced in at the June meeting. This compared to over 60% just yesterday.
Japanese GDP unexpectedly contracted in Q4 of last year. Shrinking 0.1% q/q after a -0.8% contraction in Q3 puts the island in a technical recession. Net exports’ contribution was insufficient to make up for weak business spending and private consumption. Waning demand complicates the picture for the Bank of Japan which is looking to exit its ultra-easy monetary policy. While today’s data doesn’t derail those plans per se, it does suggest the window of opportunity may be closing. The Japanese yen advances this morning but that has more to do with intervention speculation after USD/JPY topped the 150 barrier two days ago. The pair is still hovering north of that level as of this morning.
UK slides into technical recession with -0.3% qoq GDP contraction in Q4
UK GDP contracted -0.3% qoq in Q4, worse than expectation of -0.1% qoq. This downturn was a collective result of declines across all primary sectors: services saw a -0.2% dip qoq, production tumbled by -1.0% qoq, and construction experienced a significant -1.3% qoq fall. Following -0.1% qoq contraction in Q3, these figures confirm UK's entry into a technical recession.
December's GDP data offered a slight respite with a marginal -0.1% mom decrease, better than expectation of -0.2% mom. That followed 0.2% mom growth in November, and -0.5% mom contraction in October. Services fell -0.2% mom. Production grew 0.6% mom. Construction fell -0.5% mom.
Reflecting on the entire year of 2023, UK's GDP saw a meager 0.1% growth, a stark contrast to 4.3% expansion in 2022. This marks the weakest annual performance since the 2009 financial crisis, with the exception of the pandemic-stricken year of 2020.

Full UK monthly GDP release and quarterly GDP release.
USD/JPY: Lingering Below 151.40/95 Major Resistance Zone
- JPY weakness failed to materialize after Japan’s Q4 GDP came in way below expectations.
- Fear of looming BoJ’s intervention to put a halt to recent JPY weakness after MoF’s vice finance minister Masato Kanda’s warnings yesterday on the recent rapid moves in the FX markets ex-post hotter than expected US CPI data release.
- Short-term upside momentum of US dollar strength against JPY has started to ease.
Flash Q4 2023 GDP data for Japan has indicated that the Japanese economy slipped into a technical recession as it shrank – 0.1% q/q (-0.4% y/y) in the October to December period over a downward revised -08% q/q (-3.3% y/y) for Q3 2023 that shocked market participants as the consensus was in favour of +0.3% q/q (+1.4% y/y) recovery in Q4.
Interestingly, in the past where most of the time a deterioration in key Japanese economic data tended to inflict a significant intraday sell-off in the JPY as market participants inferred that the Bank of Japan (BoJ) was likely to maintain its decades-long of ultra dovish monetary policy and even evoke unconventional quantitative easing to spur demand growth which in turn resulted in a persistent weak JPY.
JPY did not sell off in light of Japan entering into a technical recession
This time around the JPY does the reverse, it has strengthened by +0.30% on an intraday basis against the US dollar at this time of the writing, and the 10-year Japanese Government Bond (JGB) remained steady at 0.72%, a similar level seen three weeks ago.
Two possible drivers can be explained by such abnormality in the current movement of the JPY.
A weak JPY is likely the indirect main driver of weak domestic consumption
Firstly, private domestic consumption which accounts for more than 50% of the Japanese economy has declined for the third successive quarter amid elevated cost pressures (-0.2% q/q in Q4 23 vs. -0.3% q/q in Q3 23), below the consensus estimate of 0%.
The indirect causation is the persistent weak JPY trend seen in the past two years that could not offset elevated external cost-push-driven global inflationary pressures that eroded consumers’ purchasing power and dampened demand.
This direct correlation can be depicted in the chart (Fig 1) where the monthly Japan Real Consumption Activity Index peaked at +15.27 y/y in April 2021 and declined to -0.66% y/y most recently in December 2023.
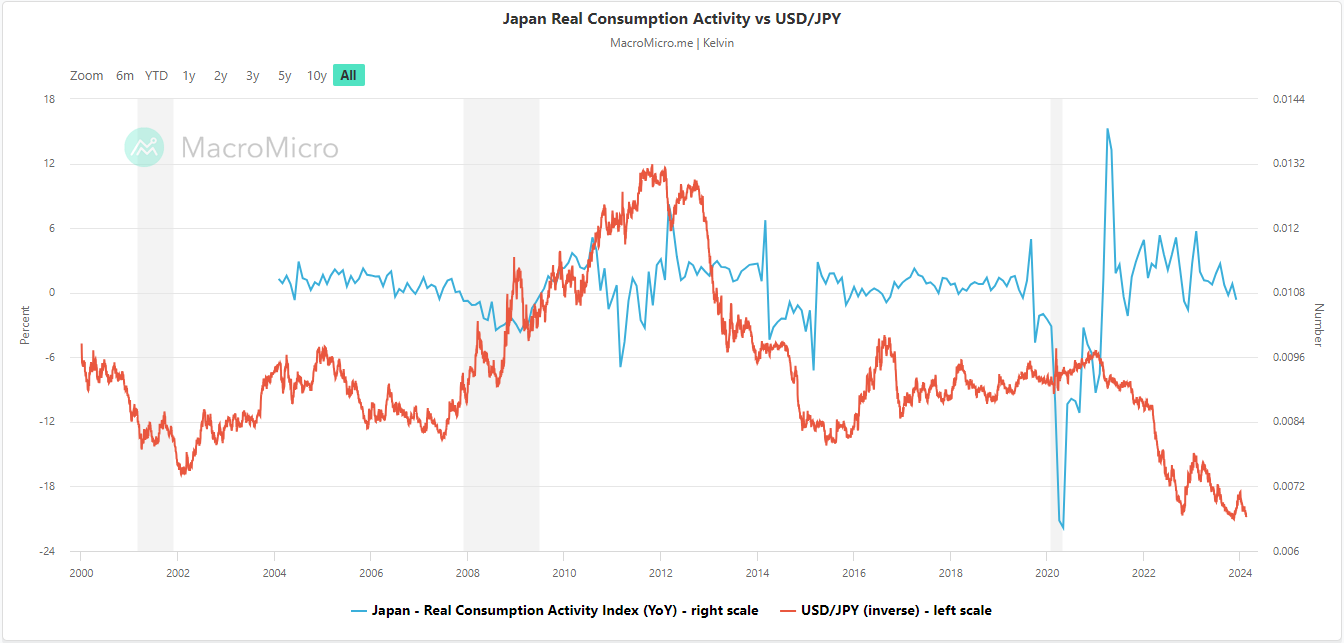
Fig 1: Japan Real Consumption Activity Index vs. USD/JPY (inverse) as of 15 Feb 2024 (Source: MacroMicro , click to enlarge chart)
This trend of real consumption deflation has moved in synch with a weakening JPY by taking the inverse of USD/JPY over the same period.
Hence, a weak JPY is unlikely to be able to spur economic growth at this juncture for Japan which in turn may not yield any marginal benefits for BoJ to keep maintaining its ultra-accommodative monetary policy stance.
Risk of looming FX intervention
Considering the hotter-than-expected US CPI inflation data that shocked the markets on Tuesday, 13 February, the US dollar spiked up across the board, and it strengthened by almost 1% against the JPY.
It has immediately prompted Japan’s top official in charge of foreign exchange matters, Ministry of Finance vice-minister Masato Kanda to issue a remark that he believed that some of the recent movements in the USD/JPY are speculative in nature and undesirable.
He added that authorities are on call 24 hours a day, 365 days a year, and are always ready to take appropriate steps as needed. Given such “stern” verbal intervention, we cannot rule out that actual intervention may take place soon if USD/JPY continues to march northwards rapidly.
Short-term upside momentum is losing inertia for USD/JPY
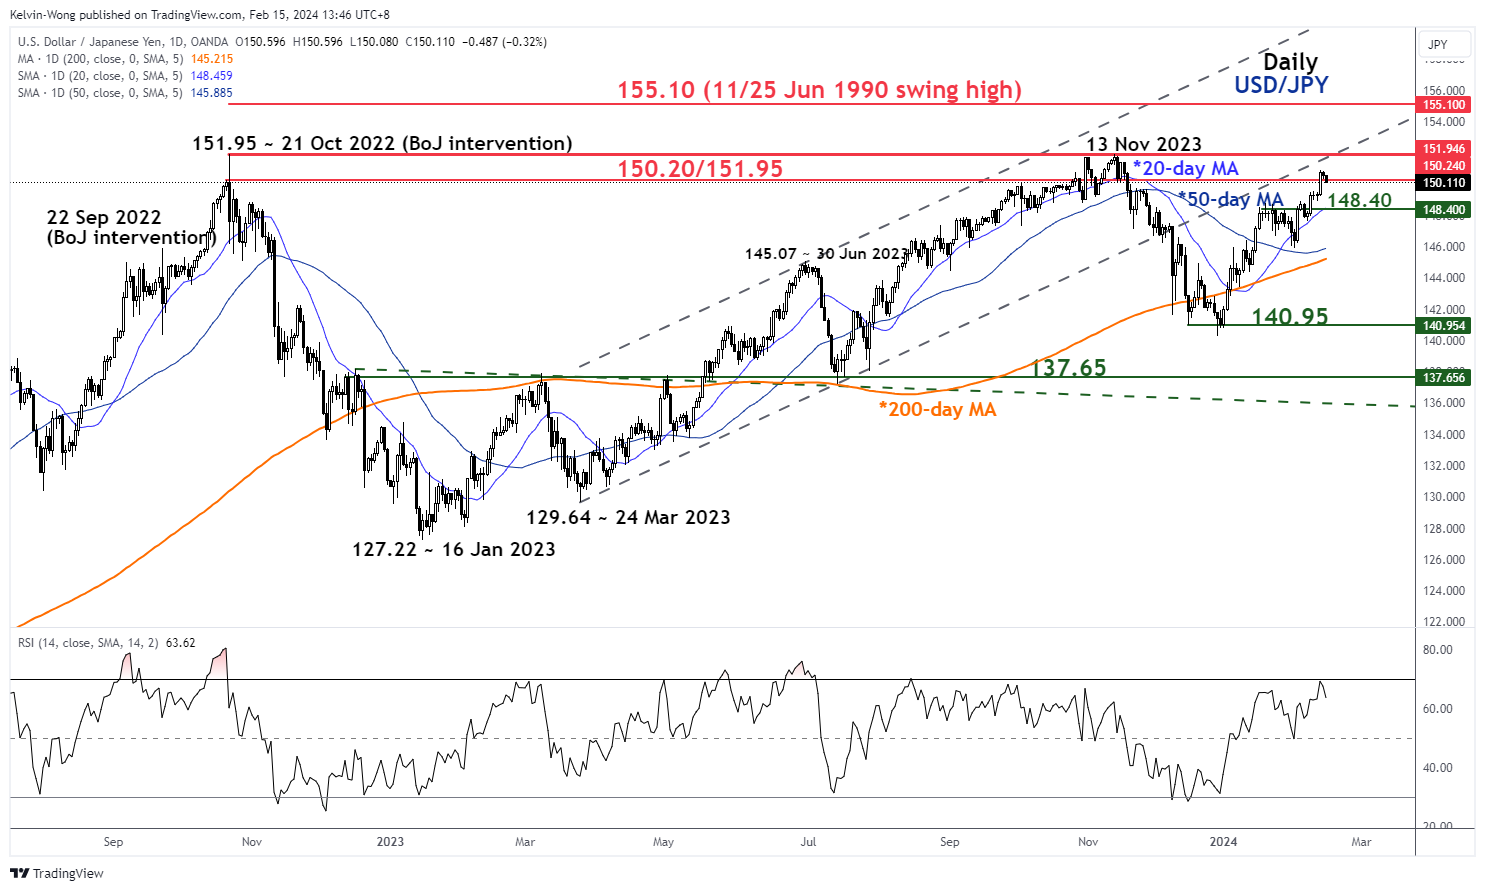
Fig 2: USD/JPY medium-term trend as of 15 Feb 2024 (Source: TradingView, click to enlarge chart)
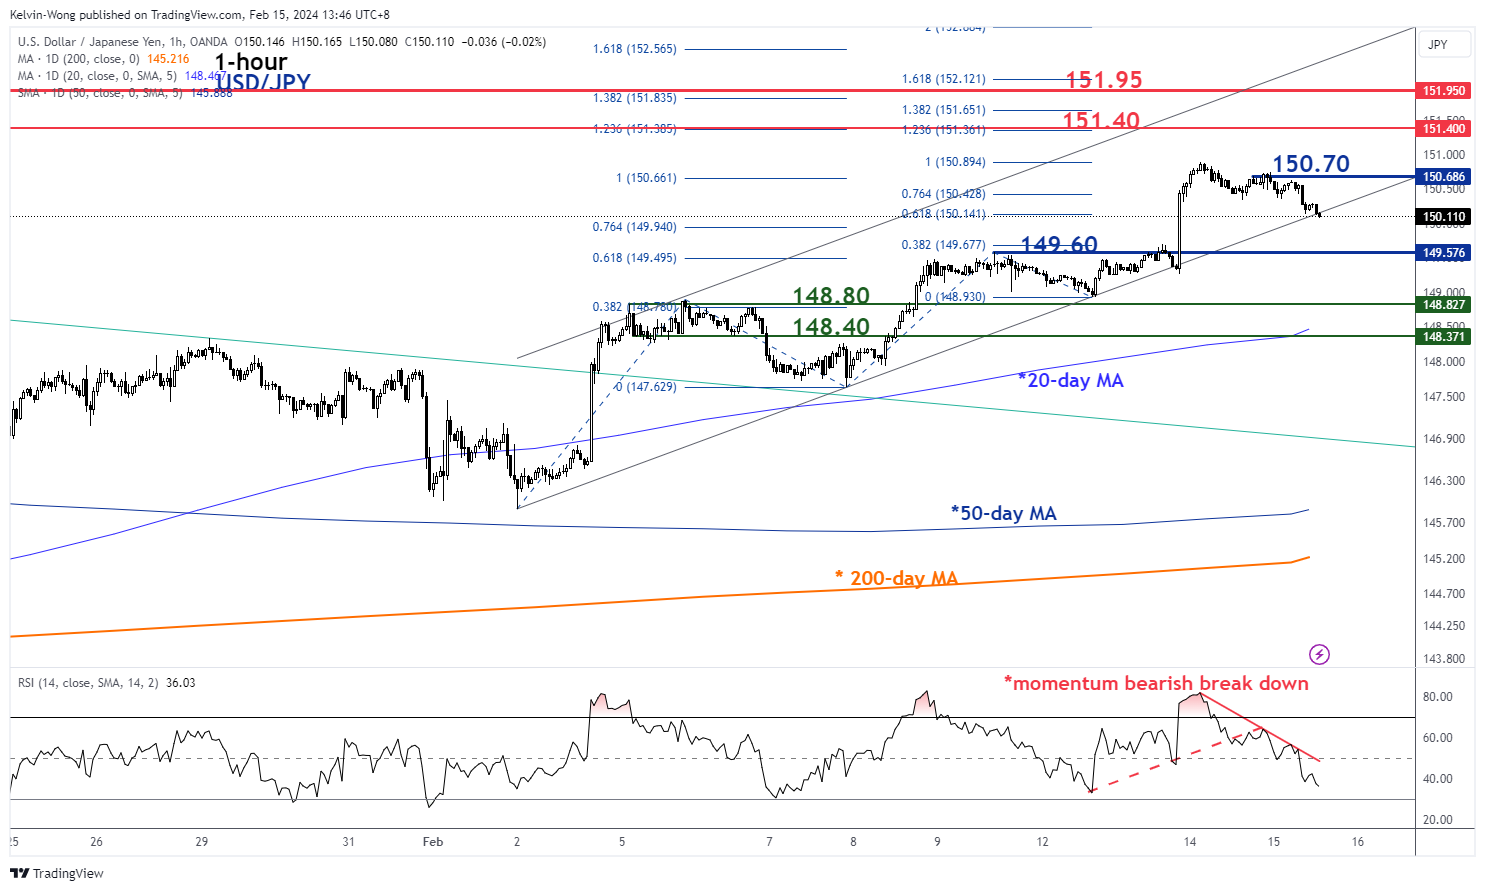
Fig 3: USD/JPY short-term trend as of 15 Feb 2024 (Source: TradingView, click to enlarge chart)
The recent bullish momentum seen in the USD/JPY since the start of this week, 12 February has started to lose inertia.
The hourly RSI momentum indicator has staged a momentum bearish breakdown after it hit an extreme overbought condition on Wednesday, 14 February (ex-post US CPI).
These bearish observations have taken form right below the risk and major resistance zone of 151.40/151.95.
A break below the lower neutrality range level of 149.60 may see further near-term weakness to expose the next intermediate support zone of 148.80/40 (also the 20-day moving average).
On the flip side, a clearance above 150.70 (upper neutrality range) may see the major resistance zone coming in at 151.40/95.