Sample Category Title
Has Japanese Yen Missed the Recovery Train?
- Yen down more than 6% against US dollar this year already
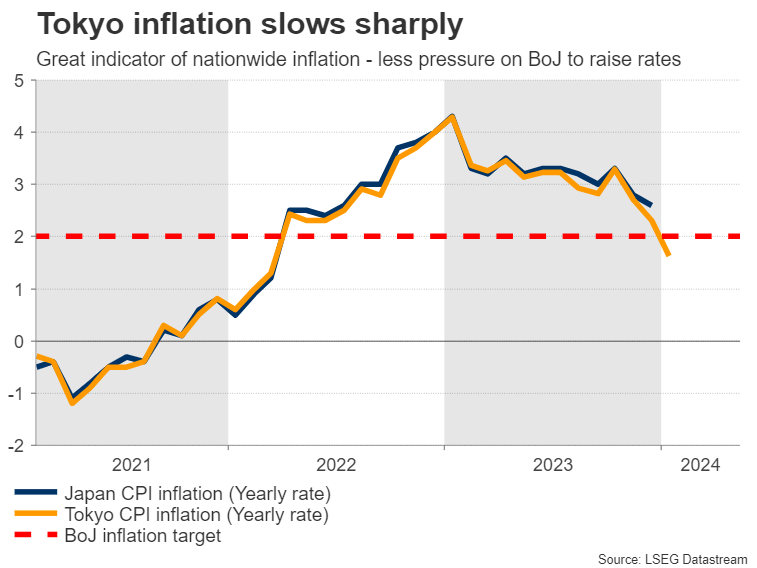
- Traders less confident Japan will raise rates, as inflation slows
- For the yen to recover, global economy needs to weaken
Yen feels the blues
Another year, another meltdown for the Japanese currency. A combination of worsening economic data and some cautious messages by the Bank of Japan (BoJ) have raised doubts about whether a cycle of rate increases lies ahead, inflicting heavy damage on the yen.
Specifically, inflation and wage growth have slowed sharply. Inflation in Tokyo fell to an annual rate of just 1.6% in January, foreshadowing a similar cooldown on a nationwide level. Similarly, wage growth has stalled and household spending is contracting, both indications of even softer inflationary pressures ahead.
Reflecting the weaker economic data pulse, some senior BoJ officials have downplayed the prospect of raising interest rates significantly. Deputy Governor Uchida signaled that even if the central bank raises rates out of negative territory, it's still difficult to imagine a scenario where it would continue raising them rapidly.
In other words, there is a clear risk the BoJ won't embark on a proper rate hike cycle, but is instead looking at a one-off increase out of negative rates.
Is FX intervention imminent?
Amplifying the yen's problems has been the strength in the dollar. Incoming data has painted a picture of a resilient US economy, forcing traders to unwind bets of rapid-fire Fed rate cuts, which has boosted the dollar. This helps explain why the yen has lost over 6% against the dollar this year, but only 3.5% against the euro.
With the yen sinking towards multi-decade lows again, Japanese authorities have resumed their verbal warnings, reminding investors that another round of FX intervention to defend the currency is still an option.
That said, Tokyo has not used language that would suggest intervention is imminent, such as describing FX moves as "disorderly" or "one-sided". This is a tell that actual intervention is still some distance away.
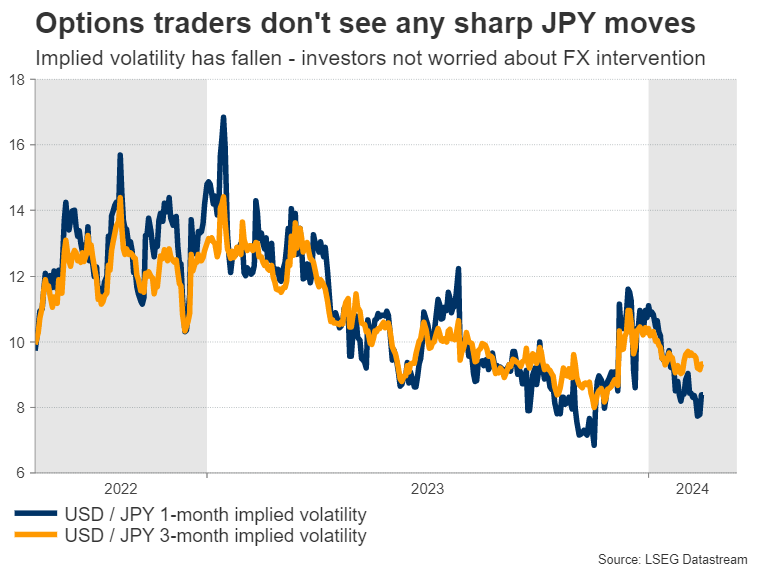
Options traders share this view, as implied volatility in short-dated USD/JPY options has declined substantially this year. Therefore, big players are not hedging so much against any massive yen moves.
That said, this calculation could change if the yen slices below the 152.00 region against the dollar, which is where Tokyo intervened back in 2022. This could be the line in the sand for Japanese authorities. Of course, even an intervention may not be enough to trigger a trend reversal in the yen, if nothing changes on the macro front.
What does the yen need to heal?
Admittedly, there isn't much on the horizon that can turn the tide. With the threat of FX intervention still low and the Japanese economy losing momentum, this is a setup that favors a continuation of the yen's downtrend.
Over the next couple of months, a lot will ride on the outcome of the spring wage negotiations. This event could single-handedly decide whether the Bank of Japan will raise rates, as policymakers consider wage growth an early indicator of how inflation will evolve.
Markets currently assign a 75% probability for the BoJ to raise rates out of negative territory by April. Encouraging signs around the wage negotiations could give the BoJ enough cover to raise rates, but even in this case, it's doubtful that this would mark the beginning of a lasting recovery in the yen as there is little appetite for any tightening beyond that.
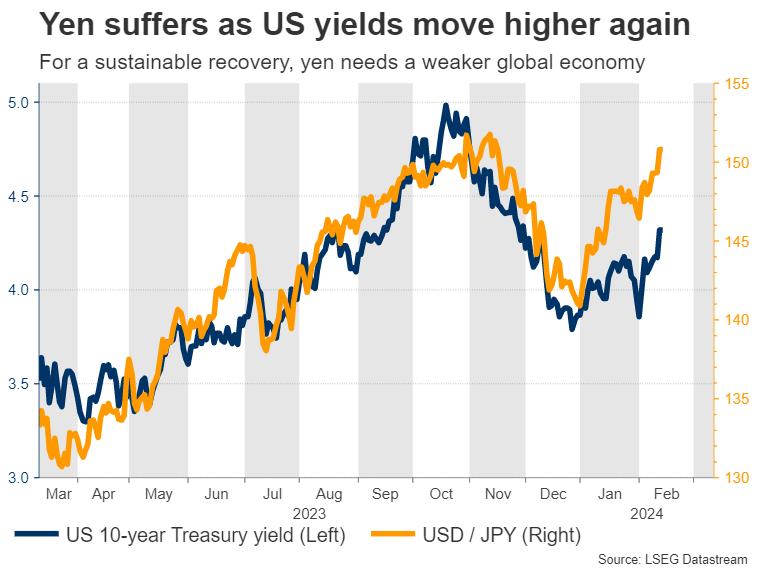
For the yen to mount a sustainable rally, the global economy needs to weaken enough for foreign central banks to slash rates with brute force. That would help yield differentials narrow back in the yen's favor, even without much help from the Bank of Japan.
That's bound to happen eventually, but it could take some time. In the United States for instance, the economy does not seem to be slowing down and inflation continues to burn hot, a combination that could prevent the Fed from touching the rate-cut button for several more months.
In conclusion, the yen's recent collapse reflects a deterioration in Japanese economic data, coupled with a 'higher for longer' outlook for US interest rates that has turbocharged the dollar. It is questionable whether FX intervention or a one-off rate increase by the BoJ would be enough to stop the bleeding and spark a full-blown trend reversal.
Instead, what the yen needs is a sharp slowdown in the global economy that forces foreign central banks to slash rates rapidly, which might be a story for the second half of this year.
EURGBP Reaches Lower Limit of Range
- EURGBP pivots higher at the bottom of a range
- Technical signals not bullish yet
- Eyes on the 0.8540 resistance zone
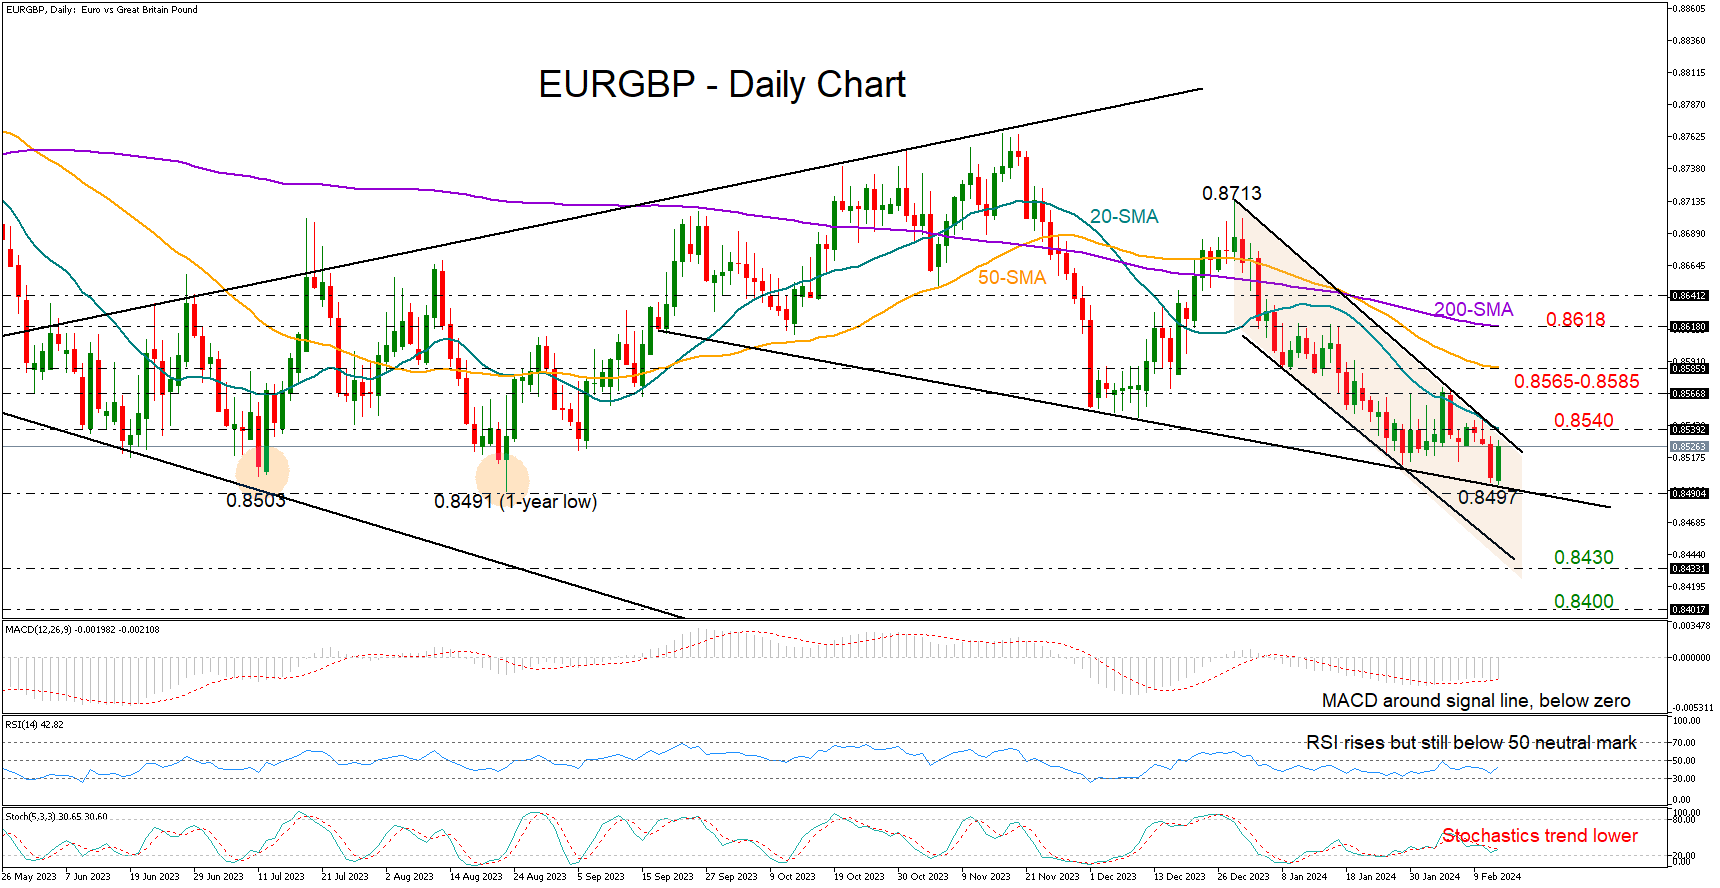
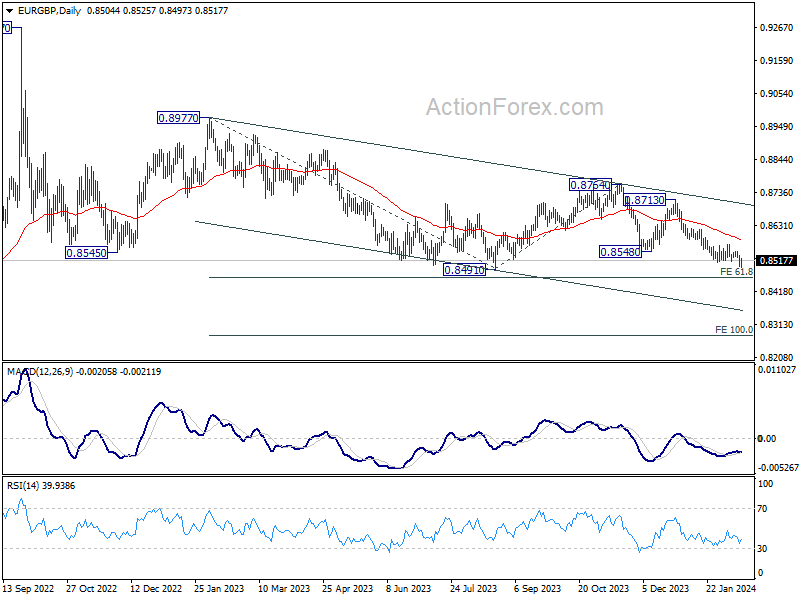
EURGBP switched to recovery mode after almost reaching August’s one-year low of 0.8491 and the bottom of the 2023 range area. While the area looks to be an ideal place for an upside reversal, the technical picture cannot guarantee a sustainable rebound.
According to the technical indicators, there is some persisting skepticism in the market, as the RSI is still some distance below its 50 neutral mark and the stochastic oscillator has yet to post a positive cross. Also, the MACD keeps hovering around its red signal line and remains comfortably below zero.
On the upside, the 20-day simple moving average (SMA) and the upper band of the 2024 bearish channel could pause gains around 0.8540. If the pair manages to climb that border, resistance could next develop around February's bar of 0.8566. Then, a break above the 50-day SMA might be required for a continuation towards the 200-day SMA at 0.8618.
Otherwise, if the current positive mood in the market evaporates, the bears may push for a close below the 0.8490 support level with scope to reach the 0.8430 constraining zone and the 0.8400 psychological mark. Additional losses from there could stabilize around the August 2022 barrier of 0.8340.
In summary, EURGBP may experience some bullish movement in the coming sessions, though only a clear extension above the 20-day SMA and the 0.8540 region could strengthen the positive momentum in the price.
Dollar Index: Bulls Regained Control After Hotter Than Expected US January Inflation
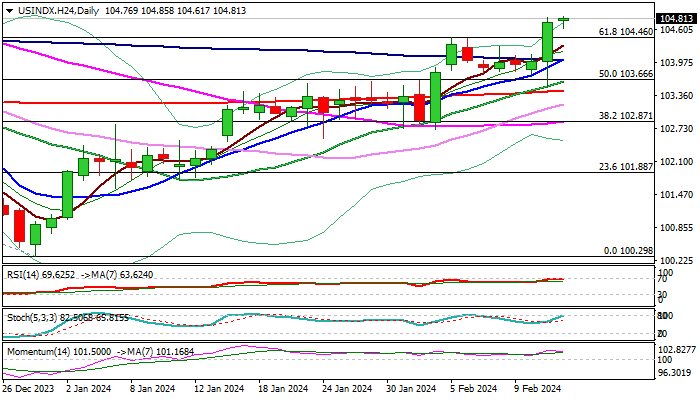
The dollar index is trading near three-month high in early Wednesday, following sharp rise (0.7%) on Tuesday, sparked by higher than expected US January inflation, which cooled bets for the first Fed rate cut.
Fresh advance generated bullish signals on break above near-term consolidation range and close above pivotal Fibo barrier at 104.46 (61.8% retracement of 107.03/100.29 downtrend).
Daily studies improved further, as positive momentum remains strong and rising moving averages created several bull-crosses, underpinning the action.
Bulls eye targets at 105.00/44 (psychological / Fibo 76.4%) though overbought conditions may prompt traders to collect some profits and position for fresh push higher.
Broken Fibo 61.8%, also former tops of Feb 5/6 (104.46) reverted to solid support, followed by converged 10/100DMA’s (104.02) which should contain dips and provide better buying opportunities.
Broken 20 and 200DMA’s (103.62/45) mark lower pivots, loss of which will be bearish.
Res: 105.14; 105.44; 105.87; 106.55.
Sup: 104.46; 104.24; 104.02; 103.62.
Gold Price Takes Hit While Crude Oil Price Extends Rally
Gold price is declining below the $2,010 support zone. Crude oil price is rising and it could climb further higher toward the $80 resistance.
Important Takeaways for Gold and Oil Prices Analysis Today
- Gold price failed to clear the $2,032 resistance and corrected lower against the US Dollar.
- It traded below a short-term rising channel with support at $2,020 on the hourly chart of gold at FXOpen.
- Crude oil prices are moving higher above the $76.10 resistance zone.
- There is a key bullish trend line forming with support near $77.40 on the hourly chart of XTI/USD at FXOpen.
Gold Price Technical Analysis
On the hourly chart of Gold at FXOpen, the price was able to climb above the $2,020 resistance. The price even broke the $2,030 level before the bears appeared.
The price traded as high as $2,032 before there was a fresh decline, as mentioned in the previous analysis. There was a move below the $2,020 pivot zone. The price settled below the 50-hour simple moving average and RSI dipped below 30. Finally, it tested the $1,988 zone.
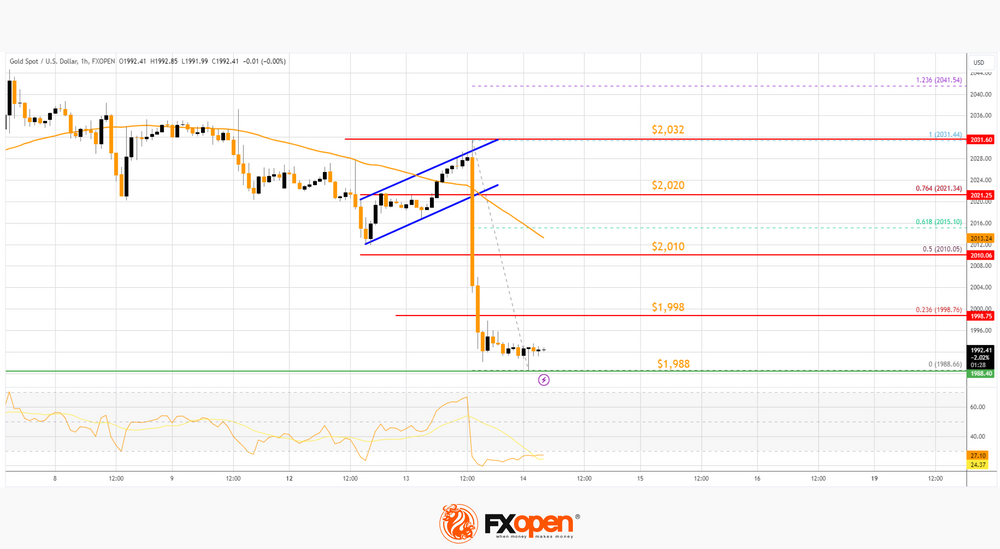
The price is now consolidating losses near the $1,990 level. Immediate resistance on the upside is near the $1,998 level or the 23.6% Fib retracement level of the downward move from the $2,031 swing high to the $1,988 low.
The next major resistance is near the 50-hour simple moving average and the 50% Fib retracement level of the downward move from the $2,031 swing high to the $1,988 low at $2,010.
An upside break above the $2,010 resistance could send Gold price toward $2,020. Any more gains may perhaps set the pace for an increase toward the $2,032 level. If there is no recovery wave, the price could continue to move down.
Initial support on the downside is near the $1,988 level. The first major support is $1,980. If there is a downside break below the $1,980 support, the price might decline further. In the stated case, the price might drop toward the $1,962 support.
Oil Price Technical Analysis
On the hourly chart of WTI Crude Oil at FXOpen, the price started a decent increase against the US Dollar. The price gained bullish momentum after it broke the $74.30 resistance.
There was a sustained upward move above the $75.50 and $76.10 levels. The bulls pushed the price above the 50-hour simple moving average and the RSI climbed toward 65. A high was formed near $78.107 before there was a downside correction.
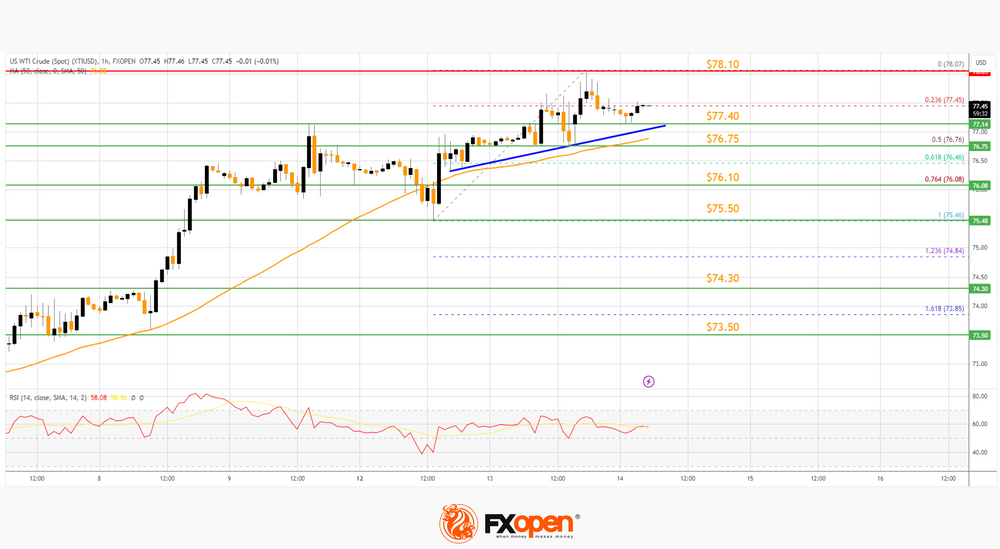
The price declined below the 23.6% Fib retracement level of the upward move from the $75.46 swing low to the $78.07 high. However, the bulls are active above a key bullish trend line with support near $77.40.
Immediate resistance is near the $78.10 level. If the price climbs further higher, it could face resistance near $78.80. The next major resistance is near the $80.00 level. Any more gains might send the price toward the $82.00 level.
Conversely, the price might correct gains and retest the 50-hour simple moving average and the 50% Fib retracement level of the upward move from the $75.46 swing low to the $78.07 high at $76.75.
The next major support on the WTI crude oil chart is near $76.10. If there is a downside break, the price might decline toward $74.30. Any more losses may perhaps open the doors for a move toward the $73.50 support zone.
Start trading commodity CFDs with tight spreads. Open your trading account now or learn more about trading commodity CFDs with FXOpen.
This article represents the opinion of the Companies operating under the FXOpen brand only. It is not to be construed as an offer, solicitation, or recommendation with respect to products and services provided by the Companies operating under the FXOpen brand, nor is it to be considered financial advice.
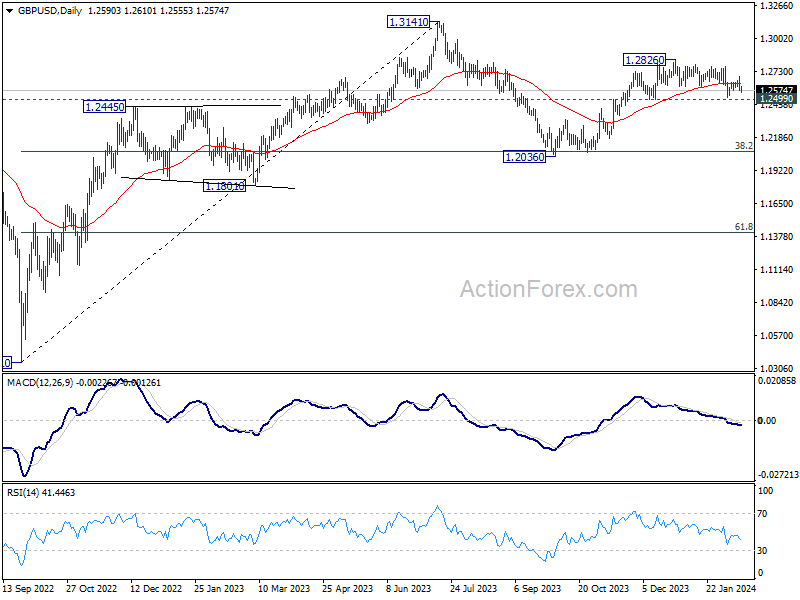
GBPUSD Bears Push for a Breakout
- GBPUSD tests the support set by the 200-day SMA
- Bears are attempting a breakout from the recent trading range
- Momentum indicators tentatively support the correction
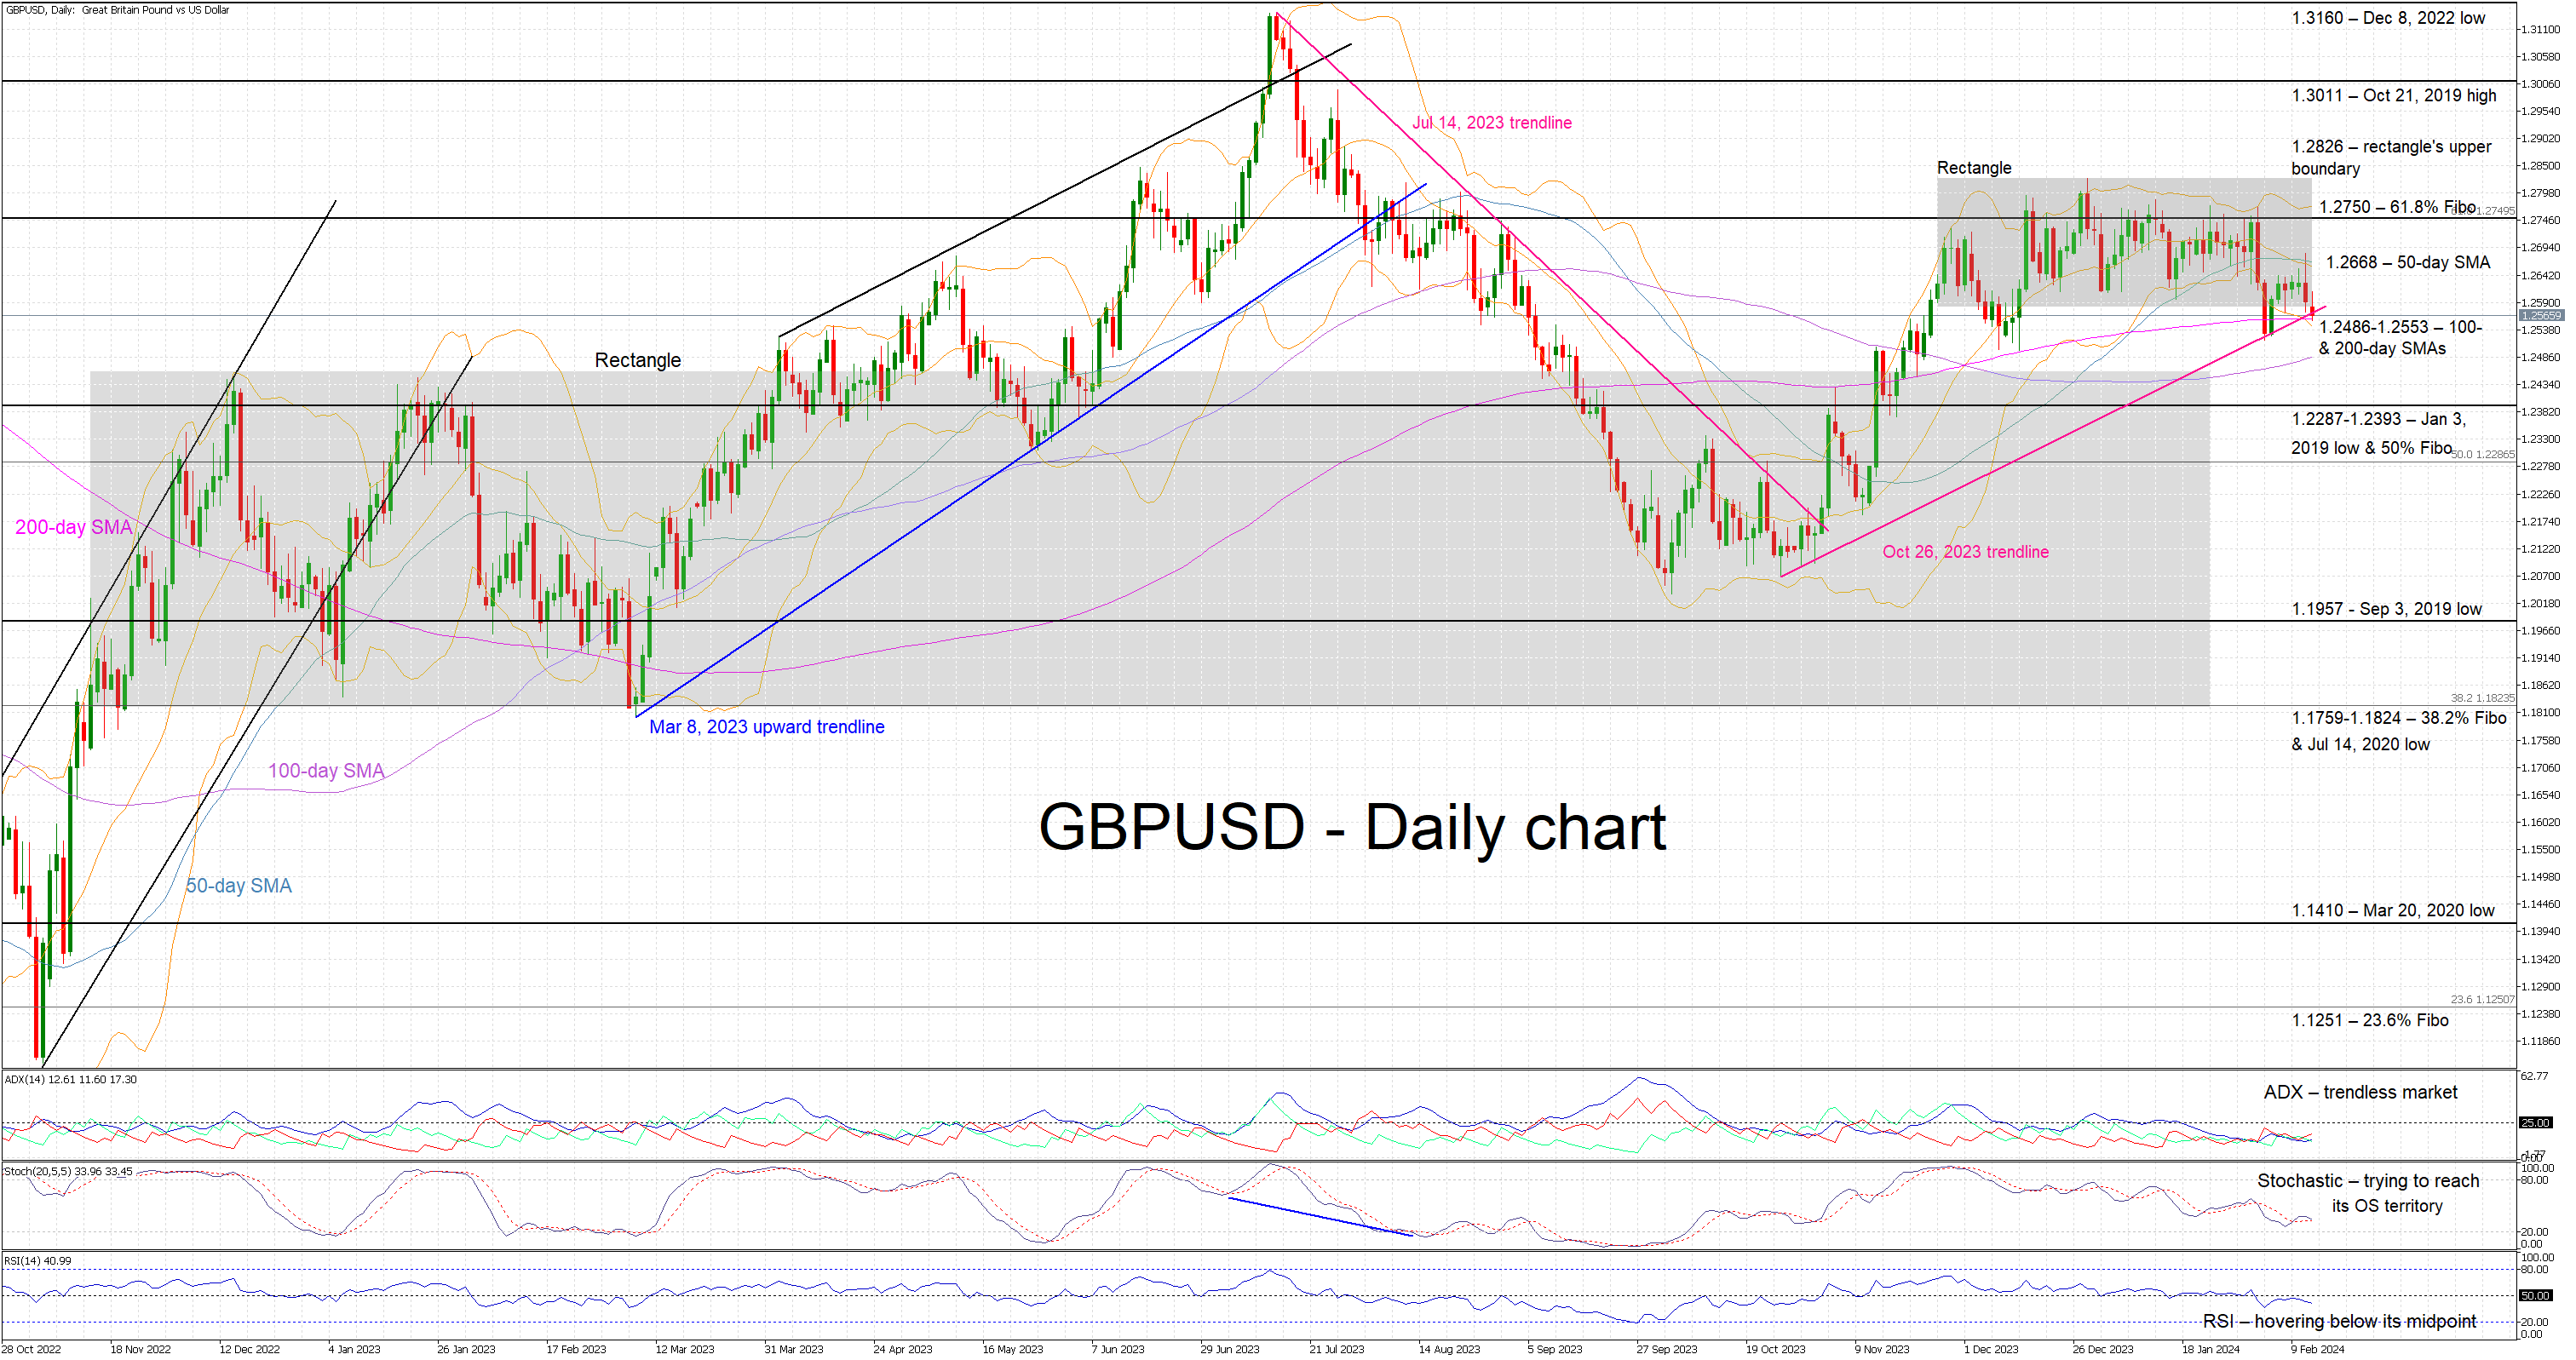
GBPUSD is registering its second consecutive red candle as the bears are trying to push GBPUSD below its recent trading range following yesterday’s US CPI release. The 200-day simple moving average (SMA) and the October 26, 2023 ascending trendline are acting as strong support points at this moment, testing the bear's determination.
Momentum indicators appear to tentatively be on the bears’ side. The RSI is trading below its midpoint and possibly preparing to drop to the lowest point since mid-October. Similarly, the stochastic oscillator is trying to edge below its moving average and then set course towards its oversold territory. Only the Average Directional Movement Index (ADX) seems uninterested in the current movement as it remains stuck below its 25-midpoint and thus pointing to a trendless market.
Should the bears stay determined, they could try to push GBPUSD below both the October 26, 2023 trendline and the 1.2486-1.2553 range that is populated by the 100- and 200-day SMAs. Lower, the busy 1.2287-1.2393 area, which is defined by the January 3, 2019 low and the 50% Fibonacci retracement of the June 1, 2021 – September 26, 2022 downtrend, will probably prove stronger to overcome than currently envisaged.
On the flip side, the bulls are probably keen to defend the 1.2486-1.2553 range and gradually lead GBPUSD back inside the recent rectangle. The 50-day SMA at 1.2668 could momentarily trouble the bulls with their next target possibly being the 61.8% Fibonacci retracement level at 1.2750. Even higher, the upper boundary of the recent rectangle at 1.2826 is the last obstacle before recording a bullish breakout.
To conclude, GBPUSD bears are trying to benefit from the recent bullish US data, but they have to cross some key levels without the strong support of the momentum indicators.
USD/JPY Jumping Beyond 150 Triggers Several Verbal FX Warnings from Japan
Markets
Higher than expected US January inflation abruptly ended the low-volatility goldilocks context that dominated trading of late by dashing hopes that the Fed will be in a position to cut rates soon to facilitate a perfect soft landing. Headline inflation proved sticky at 0.3% M/M. Due to base effects, Y/Y inflation still slowed from 3.4% to 3.1%, but the hoped for return below 3% for the first time since March 2021 didn’t materialize. Core inflation even reaccelerated from 0.3% M/M to 0.4%, keeping the Y/Y measure at 3.9%. The move was driven by a broad-based rise in services components (in the first place housing-related inflation). This is almost exactly the opposite of what the Fed is looking for to feel comfortable that inflation is heading to the target soon and in a sustainable way. Markets now think that the May rate cut is becoming unlikely, with a first 25 bps move lower only fully discounted for June. Further down the curve, US yields blew beyond the YTD peak/resistance levels. Yields jumped between 18.4 bps (2-y) and 8.3 bps (30-y), making the curve again more inverse. The US 10-y real yield returned north of the 2% mark for the first time since the Fed December meeting. A fragile economic context forced EMU yields to decouple. German yields added 7 bps for the 2-y but 30-y remained unchanged. Rising uncertainty on when and how much oxygen the Fed will be able to provide in the short-to -medium term overthrew equity investors’ goldilocks narrative. US equities lost up to 1.8% (Nasdaq). Higher (real) yields, better economic prospects and the return of risk-off was a perfect world for the dollar. DXY jumped from the 104 area to just below 105. USD/JPY easily regained the 150 barrier (close 150.80). EUR/USD is at risk of losing the 1.0712/24 support. (close 1.0709).
Asian equities are ceding ground after the WS setback, but losses mostly are contained to 1% (or even less). USD/JPY jumping beyond 150 (150.5) triggered several verbal FX warnings from Japanese officials. Later today, the calendar in US and EMU is thin, but markets will look out for the assessment of Fed governors after the US CPI beat. Tomorrow’s US retail sales is the next real highlight. Still we assume that a EUR/USD break below 1.07 be difficult to avoid. UK January price data were slightly softer than expected this morning. Headline inflation declined 0.6% M/M (vs +0.4% in Dec), keeping the Y/Y-measure at 4%. Core inflation was unchanged at 5.1% (5.2% expected) with a similar picture for service inflation (6.5% from 6.4%, but 6.8% expected). In a first reaction, sterling weakens with EUR/GBP rebounding to 0.852. However, today’s data still suggest that the BoE needs time to consider starting rate cuts. Euro weakness probably also will prevent a sustained EUR/GBP rebound.
News & Views
The Belgian Debt Agency (BDA) in an emailed statement announced it will issue two new retail bonds on March 4. They will carry a one-year and three-year maturity with the coupon to be determined on February 20. The maximum amount raised will be capped at €6bn. The BDA’s funding plan projects to raise €2bn via retail bonds with a minimum maturity of three year. This means the bulk of that €6bn will be concentrated in the one-year Note, with which the agency plans to raise a total of €13.5bn this year to compensate for the sharp outflow when the September 2023 (€22bn) Note expires later this year. The discussion to retain the fiscal-friendly regime as proposed by Finance Minister van Peteghem is ongoing. Budget Secretary Bertrand needs to approve the suggestion no later than Monday but already said she wouldn’t do so as it is fiscally not prudent.
Japan issued the world’s first sovereign transition bond this morning. The country sold JPY800bn of 10-year Climate Transition Bonds at a yield slightly lower than the one on regular government debt. This so-called greenium is generally seen in environmental bonds. But that it was also the case for CTBs was remarkable. CTBs help finance the shift to cleaner technology without specifying what project the proceeds are used for exactly (unlike green bonds). Investors for this reason have previously expressed reluctance to swoop in on them and it was a key reason for CTB issuance to have stalled elsewhere in the world. The relatively small size (about a third of a regular 10-y bond sale) and the fact that it is eligible to be sold at the BoJ’s debt operations were seen as supporting the sale. The Japanese government plans to raise about JPY20tn over the next 10 years with CTBs.
A Heartbreaking Blow for Investors
Uh oh! Yesterday’s inflation data from the US didn’t go smoothly down the market’s throat. Instead, the stronger-than-expected set of inflation data dashed hopes of seeing the Federal Reserve (Fed) cut rates anytime in the first half of this year.
The US 2-year yield jumped past 4.60% and returned to the levels before the Fed’s pivot hint in December – when they had revealed a dot plot predicting 75bp cut this year. The US 10-year is back to 4.30%. There is no way the Fed cuts its rates in March. The probability of a May rate cut tanked from 56% to around 40% in a single session. Markets now see the first Fed cut happen in June, with around 75% chance. That’s such a wild ride in market expectations; we began this year pricing 80% chance for a March rate cut, and we came all the way to pricing a 75% chance for a June rate cut.
No wonder, equities are not happy. The S&P500 fell 1.37% yesterday from an ATH and Nasdaq dived 1.58%. Small caps, which are more sensitive to financing costs, tanked almost 4%. Although some insist that the data could be just a blip in the US disinflation trend and should not get everyone panicked and selling, the overbought market conditions which resulted from overstretched rate cut expectations should find a more balanced place to sit. It would only be healthy for the S&P500 and Nasdaq to consolidate and give back some of the latest advance. Otherwise, the valuations become excessive and unsustainable, anyway.
Regarding the rate cuts, no one can tell you if June or July would be a better time for the Fed to start cutting. The data will decide when the time comes. Yet the incoming data shows a surprising strength in the US economy. Atlanta Fed’s GDP estimate, for example, prints a 3.4% growth for the Q1 – far from a number that would push the Fed to start cutting rates. As such, the ‘blip’ in yesterday’s disinflation is more understandable than not given how strongly the US consumers spend.
The US dollar index rallied past its 100-DMA and tested the 105 level on the back of exhausted Fed doves. Gold slipped below $2000 per ounce on the back of a stronger dollar and rising yields – that increase the opportunity cost of holding the non-interest bearing gold. The EURUSD tested 1.07 to the downside, and the USDJPY rallied past the 150 level. All eyes are now shifting to the Japanese officials who could – anytime – intervene in the FX markets to cool down the selling pressure on the yen.
Disinflation continues elsewhere
For those who didn’t have enough of inflation news, British inflation didn’t rise as expected in January despite a stronger-than-expected jobs data released yesterday. Cable remains under pressure due to a softer-than-expected CPI read and a broadly stronger dollar, but the selloff in EURGBP has potential to extend toward the 0.84 level in the continuation of an ABCD bearish pattern.
And finally, inflation in Switzerland got every single central banker envious as consumer prices in Switzerland rose only 1.3% in January on a yearly basis, down from 1.7% printed a month earlier. The super strong franc helped the Swiss keep their head above water this January – and even climb on a yacht! On a side note, I should admit that economists that put this number together have a better strategy for managing their health insurance costs (that went up by 10% this January on average) than I do, or the weight of insurance costs in the consumer basket doesn’t match the reality. But the good news is, the below-target inflation should encourage the Swiss National Bank (SNB) to cut rates before the others, soften the franc, boost the Swiss economy & exports, and help the SMI index return to the top half of its 2022-to-now trading range. But the bad news is, appetite for SMI will still face a challenging blow to overall investor sentiment if things start getting ugly elsewhere.
GBP/JPY Daily Outlook
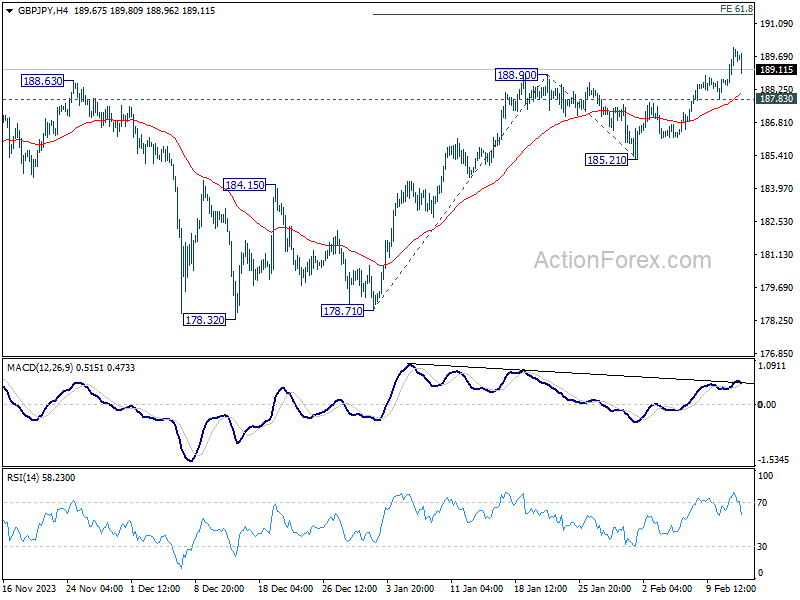
Daily Pivots: (S1) 188.87; (P) 189.48; (R1) 190.50; More...
Intraday bias in GBP/JPY remains on the upside for the moment. Next near term target is 61.8% projection of 178.71 to 188.90 from 185.21 at 191.50. On the downside, below 187.83 minor support will turn intraday bias neutral and bring consolidations first. But outlook will stay bullish as long as 185.21 support holds, in case of retreat.
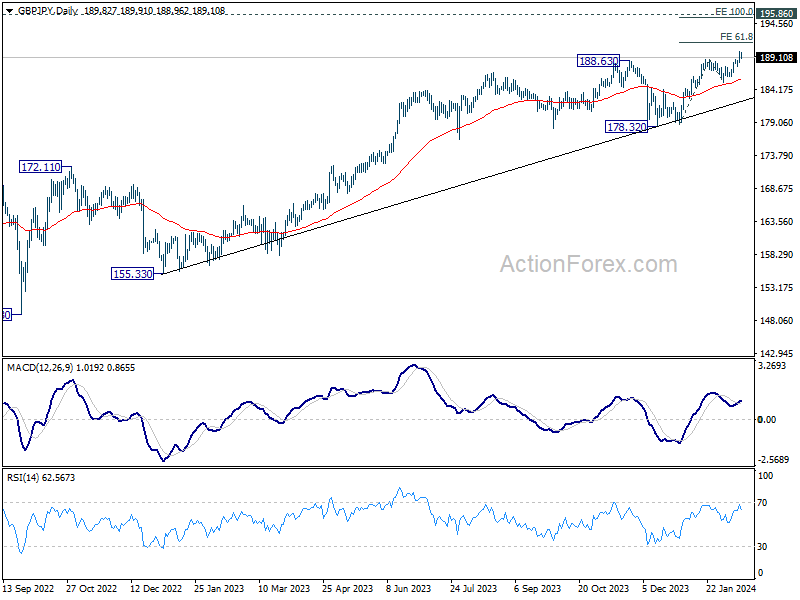
In the bigger picture, up trend from 123.94 (2020 low) in in progress. Medium term outlook will stay bullish as long as 178.32 support holds. Next target is 195.86 long term resistance (2015 high).
EUR/GBP Daily Outlook
Daily Pivots: (S1) 0.8491; (P) 0.8513; (R1) 0.8526; More...
Intraday bias in EUR/GBP remains on the downside at this point. Current fall should be part of the larger down trend and should target 0.8464 projection level. For now, break of 0.8571 resistance is needed to indicate short term bottoming. Otherwise, outlook will stay bearish in case of recovery.
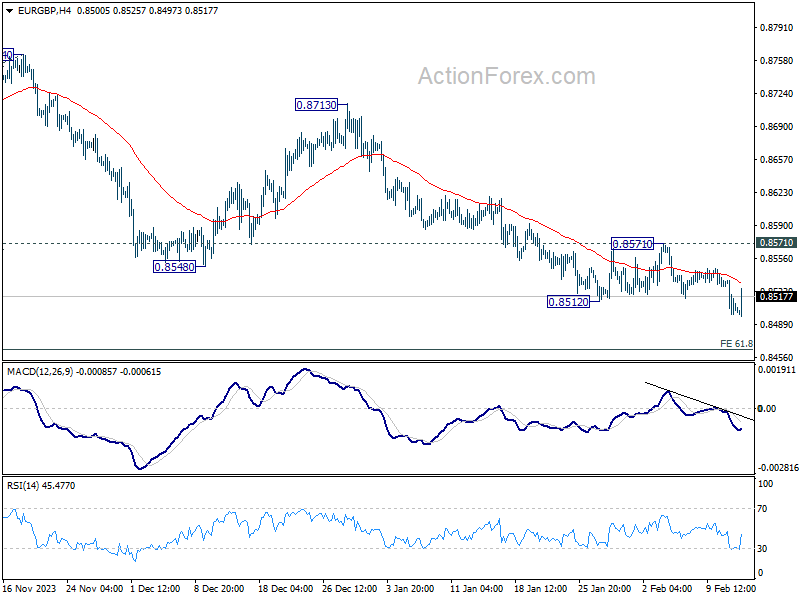
In the bigger picture, fall from 0.8764 is seen as another leg in the whole down trend from 0.9267 (2022 high). Outlook will stay bearish as long as 0.8713 resistance holds. Break of 0.8491 will target 61.8% projection of 0.8977 to 0.8491 from 0.8764 at 0.8464.
GBP/USD Daily Outlook
Daily Pivots: (S1) 1.2549; (P) 1.2617; (R1) 1.2661; More...
Intraday bias in GBP/USD remains neutral at this point. On the upside, firm break of 1.2691 resistance will affirm the case that correction from 1.2826 has completed at 1.2517, after drawing support from 1.2499. Intraday bias will be back on the upside for retesting 1.2826. Nevertheless, decisive break of 1.2499 will argue that whole rise from 1.2036 has completed and turn near term outlook bearish.
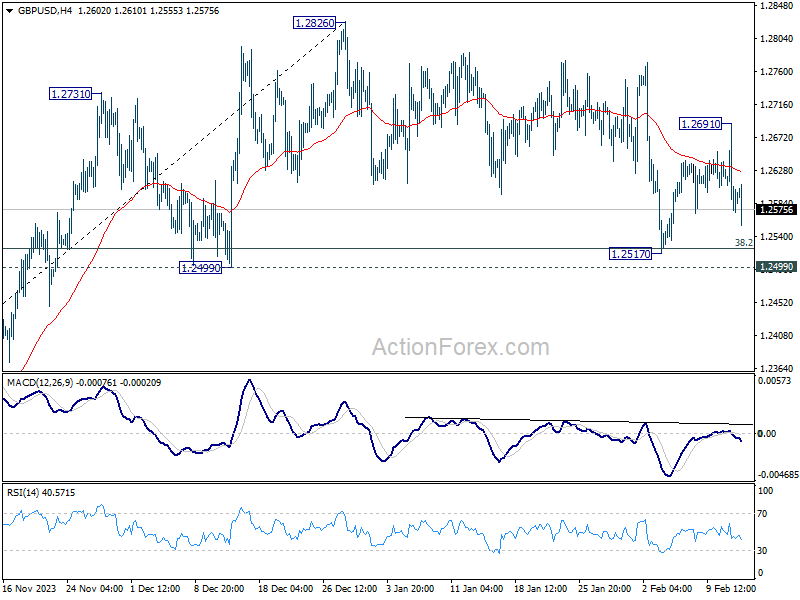
In the bigger picture, price actions from 1.3141 medium term top are seen as a corrective pattern to up trend from 1.0351 (2022 low). Rise from 1.2036 is seen as the second leg, would could be still in progress. But upside should be limited by 1.3141 to bring the third leg of the pattern. Meanwhile, break of 1.2499 support will argue that the third leg has already started for 38.2% retracement of 1.0351 (2022 low) to 1.3141 at 1.2075 again.