Sample Category Title
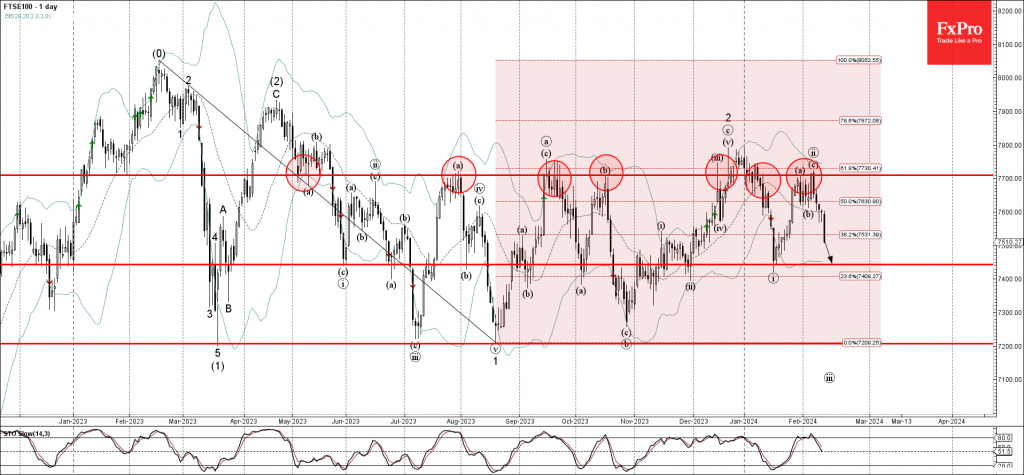
FTSE 100 Wave Analysis
- FTSE 100 index falling strongly
- Likely to fall to support level 7440.00
FTSE 100 index falling strongly after the price failed to break above the major resistance level 7700.00 (which has been repeatedly reversing the index from June of last year).
The resistance level 7700.00 was strengthened by the upper daily Bollinger Band and by the 61.8% Fibonacci correction of the previous downward impulse from February.
FTSE 100 index can be expected to fall further to the next support level 7440.00 (which stopped the two of the pervious waves ii and i).
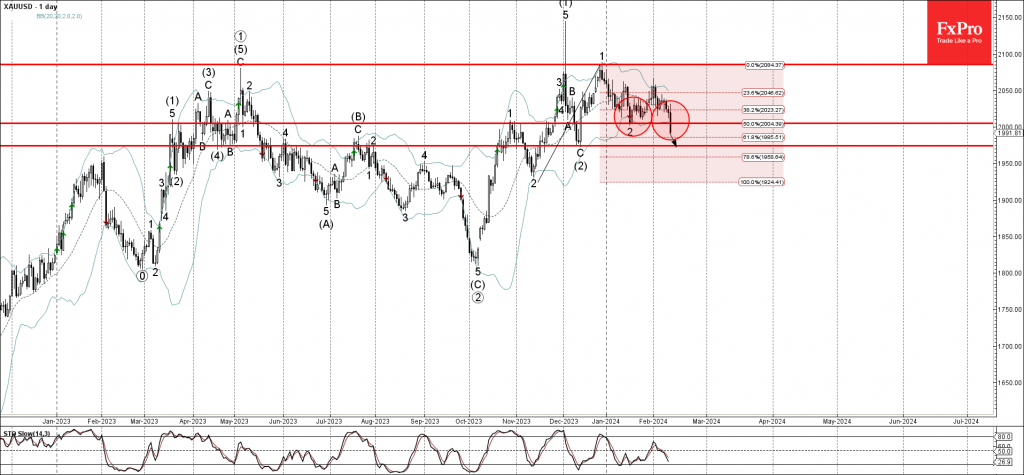
Gold Wave Analysis
- Gold under bearish pressure
- Likely to fall to support level 1975.00
Gold under the bearish pressure after the price broke the key support level 2005.00 (former monthly low from January), intersecting with the 50% Fibonacci correction of the upward impulse from November.
The breakout of the support level 2005.00 continues the active daily correction from the major resistance level 2075.00, which has been reversing Gold over the last few months.
Gold can be expected to fall further to the next support level 1975.00 (former monthly low from December).
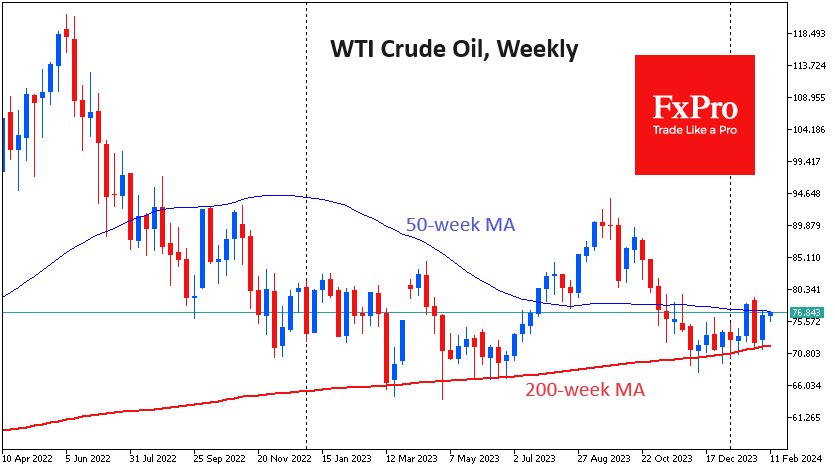
Will Oil Continue iIts Rise This Time?
Oil went on the offensive last week, once again confirming the importance of support at the 200-week moving average. Both robust US economic data and OPEC+ intentions to keep production under control fuelled the rally. All this is on top of growing supply issues across the Red Sea.
Oil is currently undergoing a crucial technical test in the form of the 50-week and almost synchronised 200-day moving averages. This area has acted as significant resistance over the past three months.
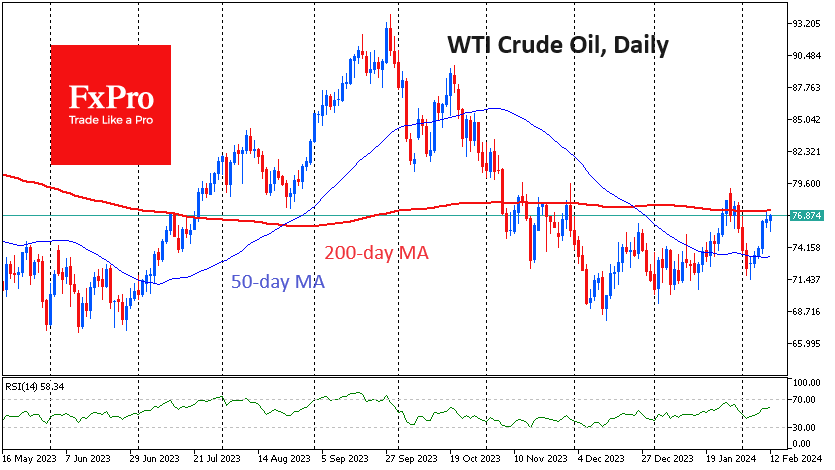
A break above the 200-day would mark a significant shift in trader and investor sentiment, potentially paving the way for more active buying. Failure to do so could be followed by a relatively smooth fall to $72 for WTI and $75 for Brent.
January CPI: A Great Disservice
Summary
The January CPI data came in hotter than expected and did little to give the FOMC the "greater confidence" it needs to start imminently cutting rates. Gasoline prices declined for the fourth month in a row, but an outsized jump in energy services and food prices tempered any enthusiasm from the decline in fuel prices. Excluding food and energy, core CPI rose 0.4% in the month, a tenth stronger than the consensus forecast. Core goods prices remained in deflationary territory amid the ongoing normalization between supply and demand for many of the subcategories, such as used autos. However, core services inflation came in hot at 0.7%, the largest gain in 16 months, amid a move higher in price growth for owners' equivalent rent, medical care services and travel-services such as airfares and hotels.
On a month-to-month basis, the inflation data can be noisy, and this is particularly true in January when businesses adjust prices at the start of the calendar year in a way that may not always be well captured by the seasonal adjustment process. We suspect inflation will resume its downward trajectory in the coming months. That said, today's report is a reminder that the road back to 2% inflation likely will have some potholes, and it reinforces the hawks on the FOMC who have expressed skepticism that an imminent easing of policy is warranted. There are still two more CPI reports between now and the May FOMC meeting, in addition to a slew of other economic data, but the timing of the first rate cut is at risk of slipping to the summer.
Inflation Tops Expectations in January
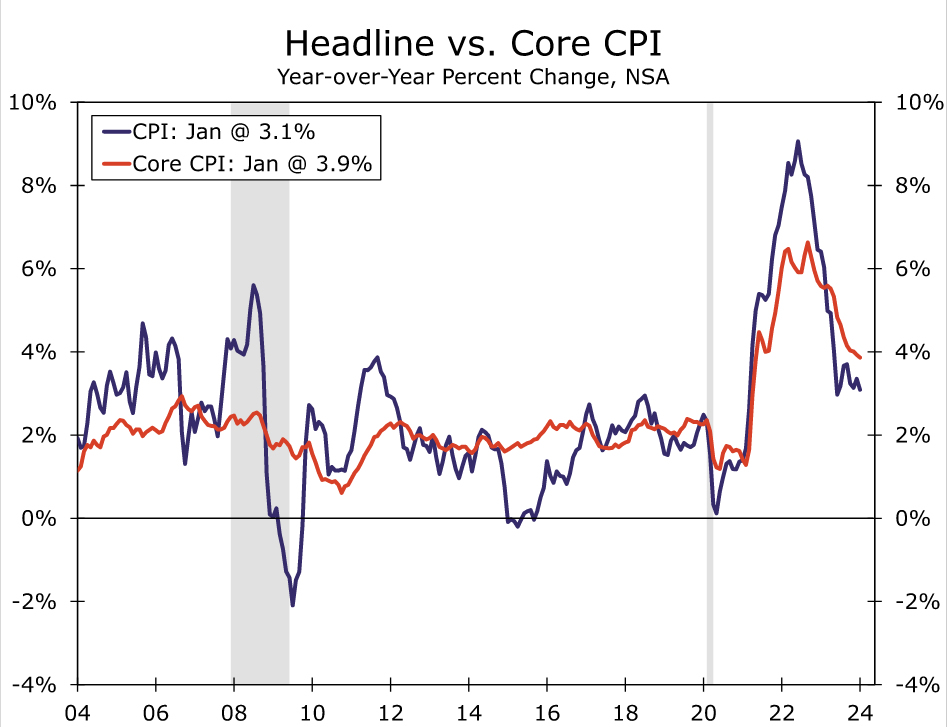
January's Consumer Price Index (CPI) served as a reminder that despite marked improvement over the past year, the battle against inflation is not won yet. The CPI rose 0.3% in the first month of 2024, topping expectations for a 0.2% increase. On a 12-month basis, prices are up 3.1%—better than the 6.4% rise this time last year, but still too strong as far as the Fed is concerned and noticeably higher than the 1.8% average that prevailed over the 2010s.
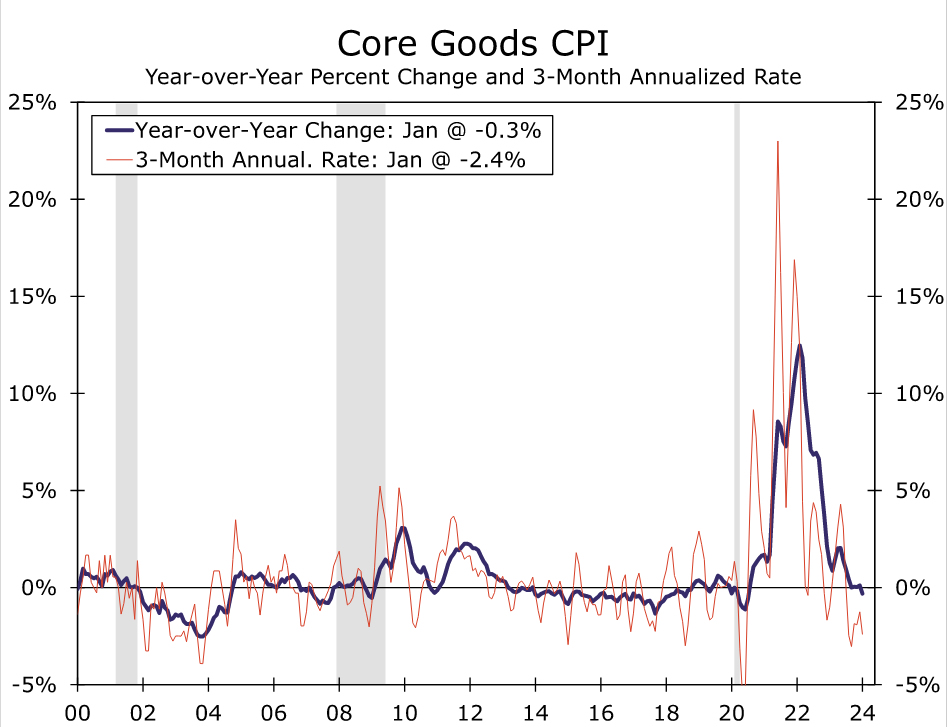
The surprisingly strong print in January can be largely traced to core services. Excluding food and energy, prices rose 0.4%, a tick higher than expected. The pickup came despite a larger-than-expected drop in core goods (-0.3%), fueled by a 3.4% drop in used autos as well as more modest price declines in apparel (-0.7%), medical goods (-0.6%) and household furnishings (-0.1%). Core goods prices are now down 0.3% on a year-over-year basis, the first decline since July 2020.
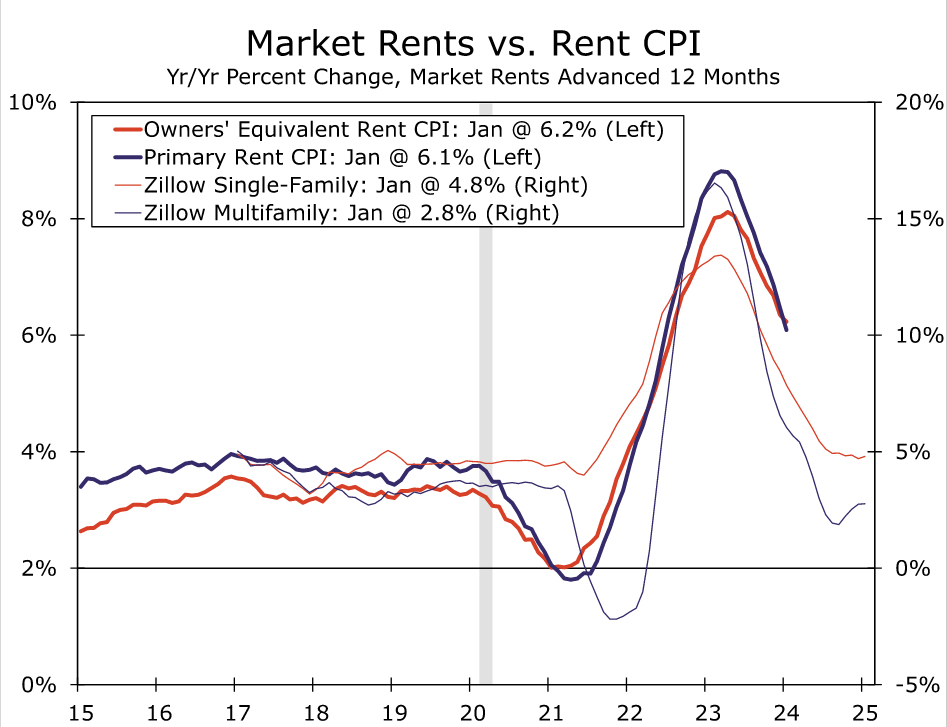
Core services, on the other hand, advanced 0.7% in January, the largest monthly gain in 16 months. Shelter costs were a standout, rising 0.6%. Some of that strength can be attributed to the volatile lodging away from home category (+1.8%), but owners' equivalent growth perked back up with a 0.6% rise (0.56% before rounding). With more timely private sector measures of rent showing cost growth continuing to cool, including for single-family properties, we would expect to see January's strength in OER reversed in the coming months and do not take today's print as an indication that shelter disinflation has run its course. Notably, primary rent continued to cool over the month with the 0.36% increase the smallest since the summer of 2021.
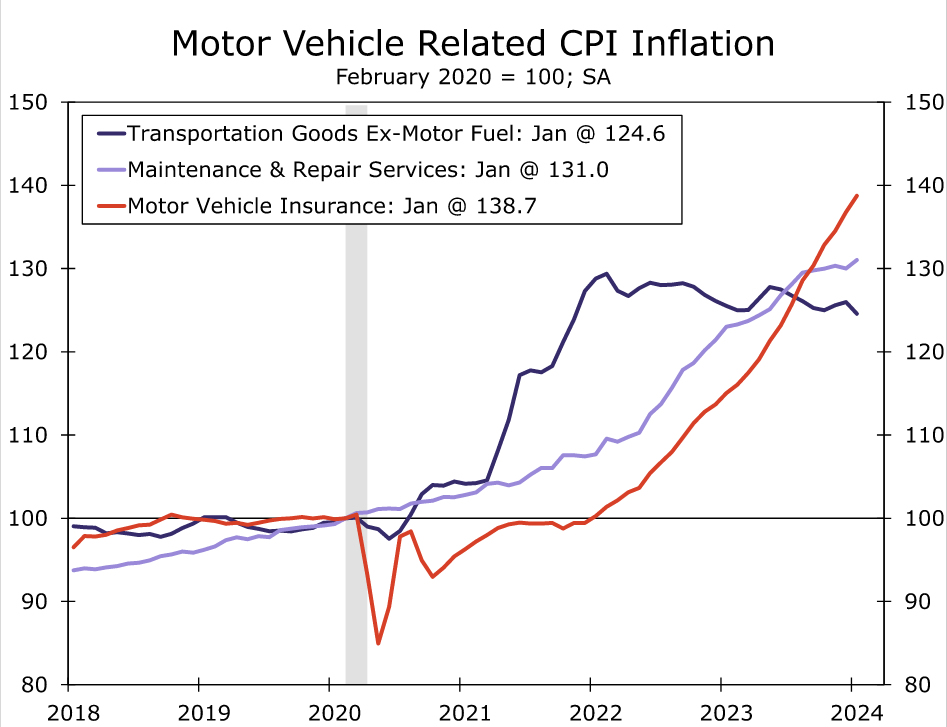
Yet core services inflation was strong in January beyond shelter, with prices also rising 0.6%. Transportation services increased 1.0% thanks to solid monthly hikes in motor vehicle insurance (1.4%), maintenance (+0.8%) and fees (+1.1%), along with a 1.4% rise in airfares. With prices for motor vehicle-related services having now risen as much as vehicles since 2020, we expect to see service-related pricing slow through the year. A 0.7% rise in medical care services, the most heavily weighted core category after shelter, also contributed to the hotter than expected print. However, unlike many other categories of the CPI, medical services does not feed into estimates of the Fed's preferred measures of inflation, the PCE deflator, in which healthcare costs carry greater weight.
Another month of lower energy prices helped to keep the CPI's headline rise in check. Gasoline prices fell 3.3% on a seasonally adjusted basis and are down 6.4% compared to one year ago. Unlike fuel, energy services prices posted a strong increase of 1.4%, boosted by a 2.0% increase in utility gas and a 1.2% gain in electricity prices. Food inflation also came in a little stronger than expected, rising 0.4%. We doubt gasoline prices will fall much further in the months ahead, but the January bounce in food and energy service prices is at odds with the recent trend in raw materials for these categories, such as foodstuff commodities and natural gas prices. We look for some relief in these categories in the coming months even as the deflation from gasoline prices ebbs.
FOMC: Not Confident Yet
This morning's CPI data are a reminder that the road back to 2% inflation likely will have some potholes. The good news is that core goods inflation is already roughly back in line with its pre-pandemic pace. With supply chain pressures no longer easing, we see more limited scope for goods disinflation without a more marked cooling in demand. Services will therefore need to take the disinflation baton. The bad news is that, for January at least, services inflation dropped the baton.
We believe that core services inflation will resume its slowdown in the months ahead. Despite today's reading, primary shelter prices have room to decelerate based on leading indicators for this series. The jump in prices for travel-services such as airfares and hotels is unlikely to be sustained, particularly as labor compensation growth continues to show signs of returning much closer to its pre-pandemic pace. That said, the FOMC made clear at its previous meeting that it would need to see further improvement in the inflation data before it felt comfortable cutting the fed funds rate. In our view, today's report does not qualify as confidence-boosting. There are still two more CPI reports between now and the May meeting, in addition to a slew of other economic data. However, the timing of the first rate cut is at risk of slipping to the summer.
U.S. CPI Growth Shows Underlying Signs of Inflation Reacceleration
The year-over-year rate of CPI growth slowed less than expected in January - to 3.1% from 3.4% year-over-year with core (ex-food and energy) price growth unexpectedly holding steady at 3.9%.
Energy and food price growth both slowed largely as expected - to -4.6% for energy prices and +2.6% (from 2.7% in December) for food prices year-over-year growth rates.
A 0.4% month-over-month increase in core prices was the largest since May 2023. Shelter prices are still disproportionately pushing core prices higher, with home rents accounting for over half of the January month-over-month rise.
But price pressures showed signs of broadening under the surface. Non-energy commodity prices continued to decline, but prices for core services ex-rents - one of the Federal Reserve's preferred measures of domestically driven inflation - surged 0.8% month-over-month in January (and is up an annualized 6.7% over the last three months).
The share of products growing at above a 3% annualized rate over the last three months rose to 47%, the highest share since May 2023 by our count.
Bottom line: A disproportionate share of price growth is still coming from the lumpy shelter/rent component. But broader signs of reacceleration in inflation pressures coming in the wake of another surge in employment and faster wage growth in January are reinforcing the risk that the Fed won't need (or be able to) pivot to interest rate cuts as quickly or aggressively as previously expected. No members of the Fed's policy setting committee expect to hike interest rates further, and our own base case has long assumed the central bank will pivot to gradual rate cuts by mid-year. But that outlook is contingent on a softening economic backdrop and easing inflation pressures, with risks tilting to a later and/or slower pace of cuts should the run of resilient inflation and economic growth numbers persist.
Sunset Market Commentary
Markets
Trading in Asia and during the morning session in Europe was one long-drawn countdown to US inflation data released this afternoon. Over the previous days we often had to mention that there wasn’t really much of hard news to guide trading, but this obviously changed this afternoon. US January inflation data brought a substantial upward surprise, suggesting that the easiest part in the inflation deceleration might have passed. US headline inflation accelerated from 0.2% M/M to 0.3% (0.2% was expected), slowing the Y/Y measure from 3.4% to 3.1% (vs 2.9% hoped for). From a monetary policy point of view the development in core inflation (0.4% M/M and 3.9% Y/Y from 0.3% and 3.9% vs 3.7% expected) probably should be given even more weight. This underlying dynamic won’t give the Fed the comfort it is looking for that inflation will sustainably return to target fast enough to cut rates anytime soon. In this respect the reacceleration of services inflation (0.7% M/M from 0.4% in December) is worth mentioning. In logical reaction, markets further push back the expected timing of a first Fed rate cut. The probability of a first rate cut in May is scaled down from 70% yesterday to about 40% now. A ‘meagre’ first 25 bps step for June is just left intact. Further out US yields are decisively jumping beyond the YTD peak/resistance levels, adding between 11 bps (2 & 5-y) and 6.0 bps (30-y). German yields only follow the US at a long distance, rising between 6 bps (2-y) and 0.5 bps (30-y). The return of the higher for longer narrative also caused a blow to the perfect soft landing scenario that equity investors were embracing. The EuroStoxx50 was already in correction modus in the run-up to the US CPI release and currently cedes about 1.5%. US indices open up 2.0% lower (Nasdaq). Sentiment turning risk-off and the Fed having plenty of time to wait as the US economy shows much more resilient than the likes of the EMU, proves to be a perfect world for the dollar. DXY breaks above the 104/104.50 area. EUR/USD struggles not the give away the 1.0724/12 area, probably in vain.
This morning. UK labour market data also surprised to the strong side of expectations. The unemployment rate declined from 3.9% to 3.8%. The UK economy continues to add jobs (48k estimated in January) and wage growth slowed less than expected in December (ex bonus 6.2% Y/Y VS 6.0% expected). Resilient UK labour data allow UK yields to trade more or less in lockstep with the US. Cable post the US CPI (more than) reversed intraday gains (currently 1.26). Still, the UK currency outperforms a wounded single currency. EUR/GBP is testing the 0.85 big figure, with the 0.8492 2023 low now at risk of being pierced.
News & Views
The Swiss franc underperforms G10 peers today. EUR/CHF rises to the strongest level since mid-December at 0.948. That’s up from yesterday’s close of 0.943. CHF has been losing ground steadily since end of January amid rising expectations the central bank may cut rates sooner than the likes of the ECB and Fed. Today’s January inflation data reinforced the idea. Headline prices rose by 0.2% m/m only to be up 1.3% in yearly terms. The latter is a further deceleration from the 1.7% in December. It also comes as a surprise, defying expectations for a status quo amid increased regulated prices for electricity and a VAT increase. These were also some of the arguments why the SNB expected inflation to average around 1.8% in the first quarter this year. The January reading sets the stage for another downward revision in the next forecasts. Core inflation fell by 0.3% m/m, bring the y/y reading to 1.2%. It’s the slowest pace since January 2022. While it’s unsure the SNB will effectively start cutting in March already, markets did add to the probability of that happening. The scenario is given a +/- 70% probability compared to 40% just yesterday. A cut in June – the SNB meets quarterly – is in any case more than fully discounted.
The EU yesterday adopted a law to set aside windfall profits made on the frozen Russian central bank assets. Some 300bn euros of Russian central bank assets were blocked following the invasion of Ukraine. Two thirds of that are in the EU with the majority of that held in Belgium’s Euroclear. The law is a first concrete step in funneling Russian money to finance Ukraine’s post-war reconstruction and is estimated to generate about 15bn euros over the next four years. While the likes of the US called for confiscating the assets outright (not just the profits), EU officials consider such a move as legally too risky.
US: Progress on the Inflation Front Grinds to a Halt in January
The Consumer Price Index (CPI) rose 0.3% month-on-month (m/m) in January, ahead of the consensus forecast calling for a more modest gain of 0.2%. CPI rose 3.1% year-over-year, down from 3.4% in December.
- Energy prices fell 0.9% m/m, largely driven by a pullback in prices at the pump (-3.3% m/m). Meanwhile, food prices (+0.4%) jumped by their largest monthly gain since January 2023. On a year-over-year basis, foods prices are up 2.6%.
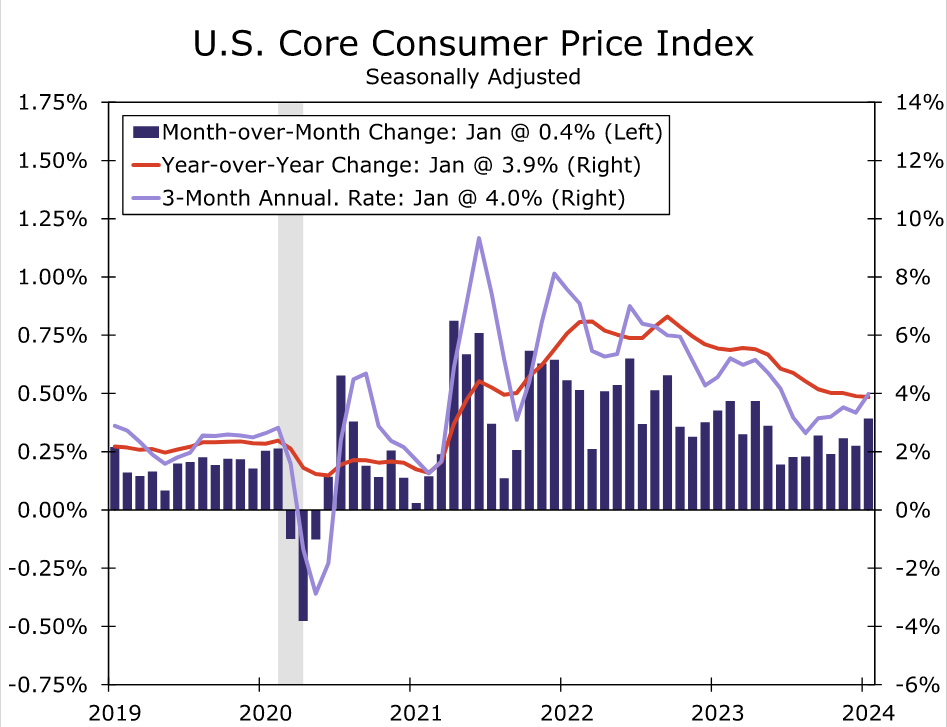
Excluding food & energy, core prices rose 0.4% m/m – also coming in a tick stronger than the consensus forecast. The twelve-month change held steady 3.9%, while the three-month annualized rate of change jumped to 4.0% – the highest reading since June.
Prices for core services rose 0.7% m/m – a sharp acceleration from the month prior. Shelter costs rose 0.6% m/m, as rent of primary residence (+0.4% m/m) matched last month's gain while owners' equivalent rent rose by 0.6% m/m (from 0.4% the month prior). Non-housing services also sharply accelerated, rising 0.8% m/m – the strongest monthly gain since April 2022 – pushing the three-month annualized rate of change up to 6.4% (from 4.4% in December).
Core good prices fell 0.3% m/m, led by a steep decline in used vehicle prices (-3.4% m/m). Apparel (-0.7% m/m), medical goods (-0.6% m/m) and households furnishings (-0.1% m/m) also recorded monthly declines in January.
Key Implications
Progress on the inflation front stalled in January, as a sharp acceleration in core services more than offset a further decline in goods prices. As a result, both the three (4.0%) and six (3.6%) month annualized rates of change on core inflation turned meaningfully higher on the month.
Last Friday the Bureau of Labor Statistics released revised CPI figures for 2023, which incorporated updated seasonal adjustment factors. The revisions showed very little change to the monthly pattern on CPI, however, there were notable changes to category weights. For example, the weight on core goods was reduced by 2.5 percentage points relative to December 2022 (and now sits at 18.9%), in favor of a higher weight on core services – two-thirds of which was allocated to shelter. This means we're likely to see even more stickiness on core CPI over the coming months and potentially lead to a wider gap between it and core PCE inflation.
Recent communication by the Federal Reserve indicates a dichotomy of both patience and a willingness to cut interest rates despite the ongoing strength in economic fundamentals. This morning's numbers underscore the importance of patience, with market participants now pricing for just 100 basis-points of cuts this year. We have long said the last leg lower on inflation will be the hardest, and with the consumer showing few signs of slowing, and the labor market still tight by historical standards, progress on the inflation could slow to a crawl over the coming months. At this point, a May cut seems very unlikely.
USD/CHF Mid-Day Outlook
Daily Pivots: (S1) 0.8732; (P) 0.8752; (R1) 0.8778; More....
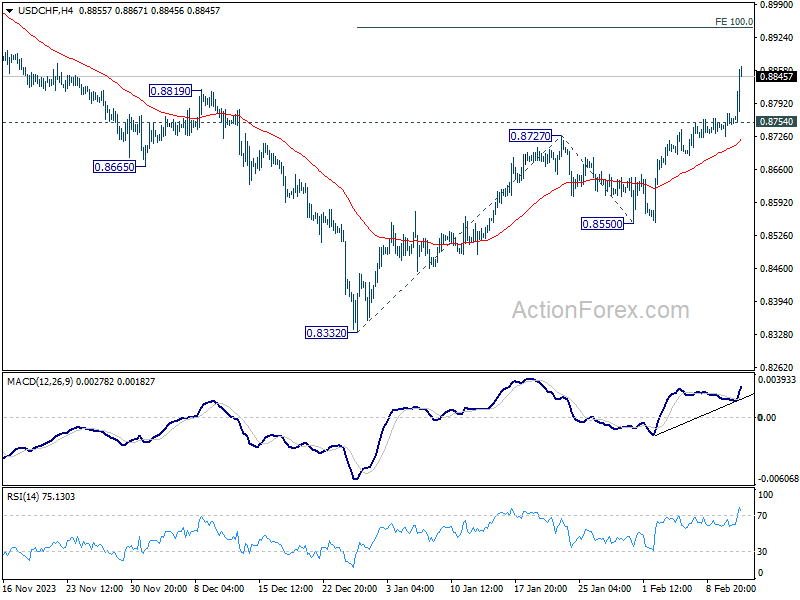
USD/CHF's rally accelerates to as high as 0.8867 so far, and intraday bias stays on the upside. Next target is 100% projection of 0.8332 to 0.8727 from 0.8550 at 0.8954. Firm break there will pave the way to 161.8% projection at 0.9189. On the downside, below 0.8754 minor support will turn intraday bias neutral first. But retreat should be contained above 0.8550 support to bring another rally.
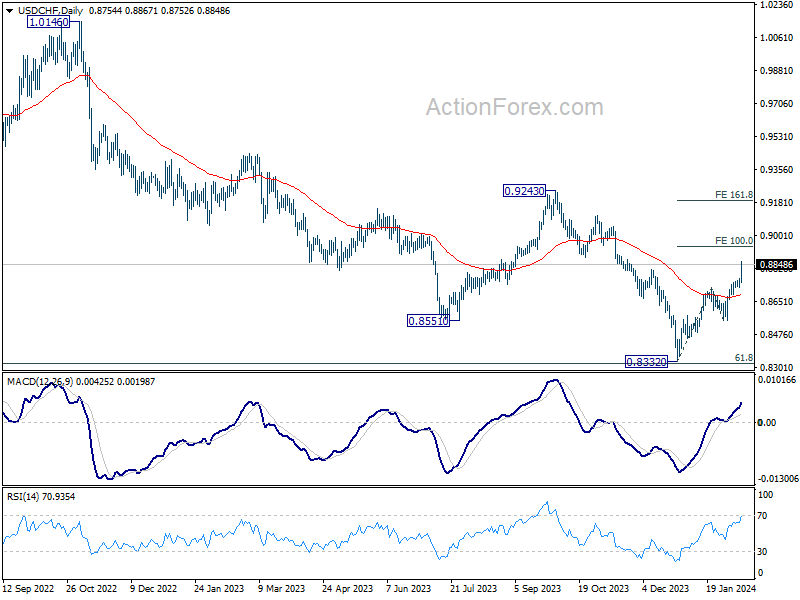
In the bigger picture, sustained trading above 55 D EMA (now at 0.8687) will solidify the case of medium term bottoming at 0.8332, just ahead of 0.8317 long term fibonacci support, on bullish convergence condition in W MACD. Further rise should be seen to 0.9243 resistance, even as a correction to the larger down trend from 1.0146 (2022 high).
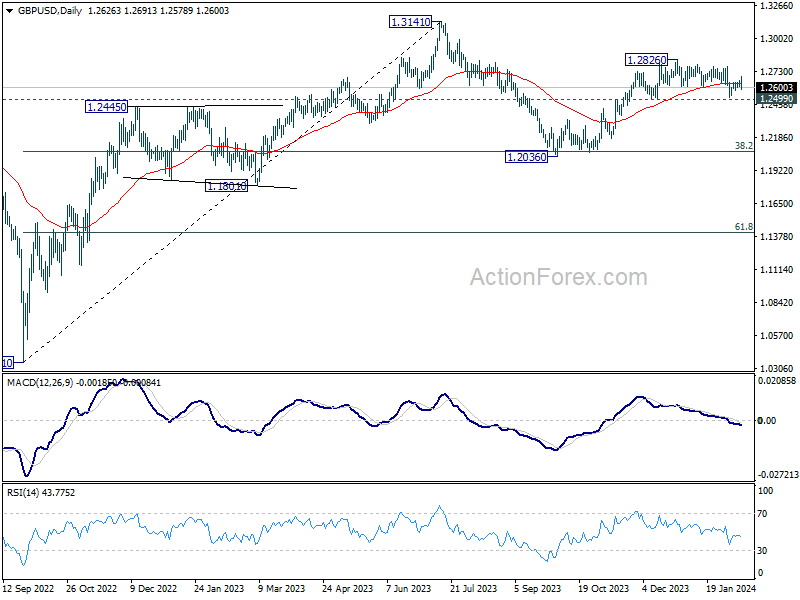
GBP/USD Mid-Day Outlook
Daily Pivots: (S1) 1.2604; (P) 1.2630; (R1) 1.2653; More...
Despite spiking higher to 1.2691, GBP/USD quickly retreated. Intraday bias stays neutral for the moment. On the upside, firm break of 1.2691 resistance will affirm the case that correction from 1.2826 has completed at 1.2517, after drawing support from 1.2499. Intraday bias will be back on the upside for retesting 1.2826. Nevertheless, decisive break of 1.2499 will argue that whole rise from 1.2036 has completed and turn near term outlook bearish.
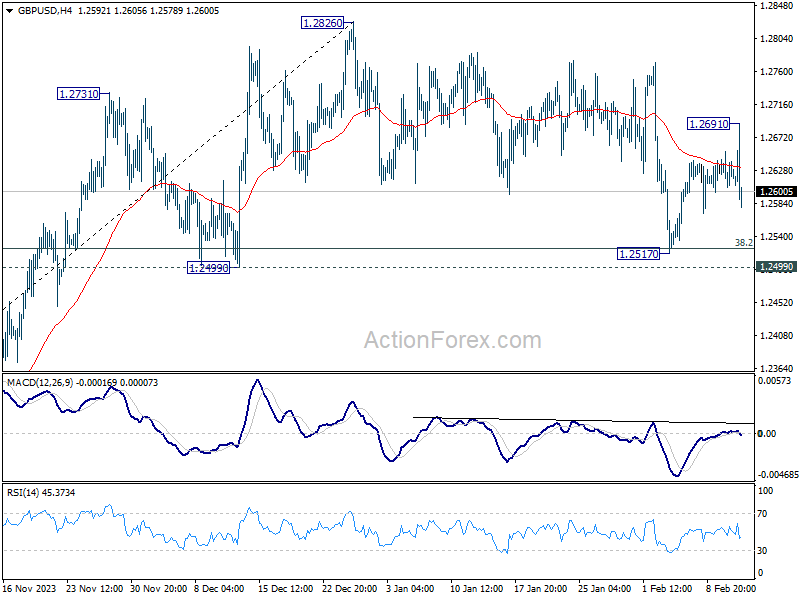
In the bigger picture, price actions from 1.3141 medium term top are seen as a corrective pattern to up trend from 1.0351 (2022 low). Rise from 1.2036 is seen as the second leg, would could be still in progress. But upside should be limited by 1.3141 to bring the third leg of the pattern. Meanwhile, break of 1.2499 support will argue that the third leg has already started for 38.2% retracement of 1.0351 (2022 low) to 1.3141 at 1.2075 again.