Sample Category Title
Fed’s Kashkari sees only two or three rate cuts this year
Minneapolis Fed President Neel Kashkari offered a more conservative outlook on policy loosening compared to market expectations. In a conversation with CNBC today, Kashkari indicated his anticipation of only two or three interest rate cuts throughout 2024, a stance that contrasts sharply with the more aggressive predictions circulating in financial markets, where fed fund futures suggest the possibility of up to five quarter-point cuts before year-end.
"Sitting here today, I would say, two or three cuts would seem to be appropriate for me right now," Kashkari remarked, emphasizing a cautious approach rooted in current economic data.
Kashkari's comments highlight the central role of inflation data in shaping Fed's policy decisions. With recent data trends being "resoundingly positive," the path forward for rate adjustments hinges on continued favorable inflation reports.
"And then the question will simply be, at what pace do we then start to adjust rates back down?" he added.
Moreover, Kashkari introduced the notion of a potentially prolonged environment of elevated interest rates, suggesting that current economic conditions might necessitate higher rates for an extended period. "There are compelling arguments to suggest we could be in a longer, higher rate environment going forward," he remarked.
EUR/AUD Technical: AUD Weakness Stalling after RBA’s Cautionary Stance on Inflation
- Despite a recent slowdown in Australia’s monthly CPI for December 2023, the Australian central bank, RBA has chosen to remain on the cautious side and push back rate cut expectations.
- RBA’s monetary policy statement has stated that service inflation may remain sticky on the high side, and overall inflation may take some time to reach RBA’s target of 2% to 3%.
- Last week’s AUD weakness against the US dollar has started to taper off intraday, supported by the renewed hawkish vibes from RBA.
- The EUR/AUD cross pair may see further short-term weakness, watch the 1.6475 near-term support (potential downside trigger level).
Since our last analysis, the EUR/AUD has rallied as expected in the short term and hit the 1.6655 resistance (printed an intraday high of 1.6675 on 18 January). Thereafter, it traded sideways between 1.6675 and 1.6350 in the past three weeks.
The Australian central bank, RBA has concluded its first monetary policy meeting of 2024 today and maintained its policy cash rate at 4.35% for the third consecutive time as expected.
Despite the recent softness seen in Australia’s inflation data where the monthly CPI indicator has decelerated for the third consecutive month to 3.4% annualized in December 2023 from 4.3% in November and the lowest reading since November 2021, the latest RBA monetary statement is still peppered by hints of hawkish vibes.
Hawkish RBA’s monetary policy statement
The latest statement has indicated an acknowledgment that inflation in Australia is easing but it remains high, and it will take some time yet before it hits RBA’s target range of 2% to 3%. Secondly, service price inflation has declined at a more gradual pace in line with the RBA’s earlier forecasts, and remained high which may be persistent, a similarity with global service price inflation trends. Thirdly, it noted that the economic outlook is uncertain, and the Board remains highly attentive to inflation risk (rather than recessionary risk).
Overall, it applies that the first RBA rate cut may not come in H1 of 2024, and even a chance of a further hike is still on the cards.
Recent AUD weakness has started to taper off
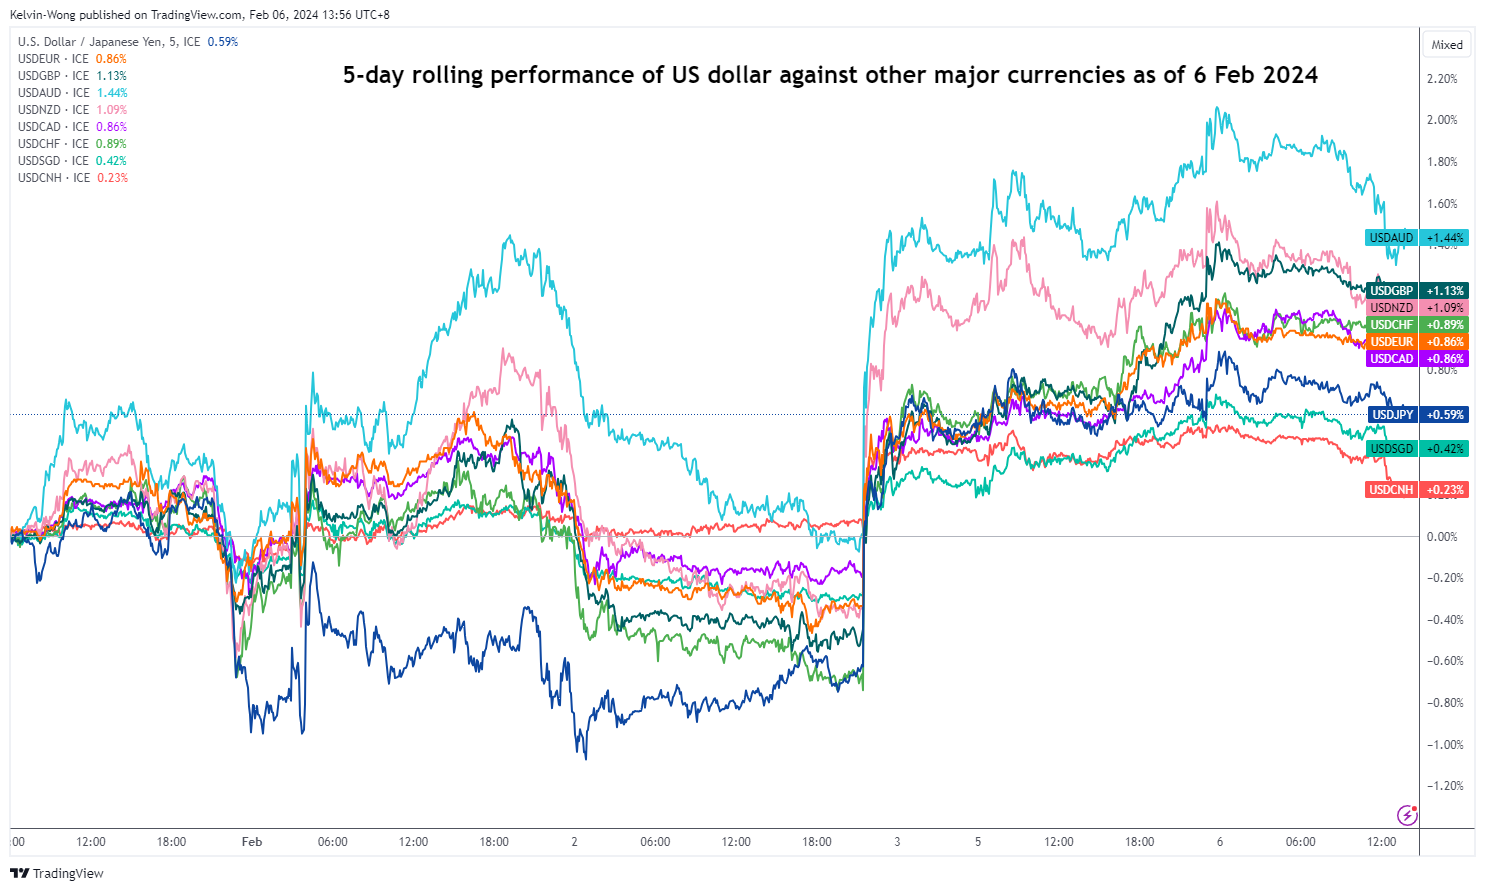
Fig 1: 5-day rolling performances of US dollar against other currencies as of 17 Jan 2024 (Source: TradingView, click to enlarge chart)
The recent significant pace of AUD sell-off that has taken shape after last week’s FOMC and surprisingly strong US non-farm payroll jobs data for January has started to reverse some of its movements; the US dollar is now only showing a gain of +1.4% from a high of +2.05% against the AUD at the start of this week on Monday, 5 February at this time of the writing.
EUR/AUD’s 200-day moving average support looks vulnerable
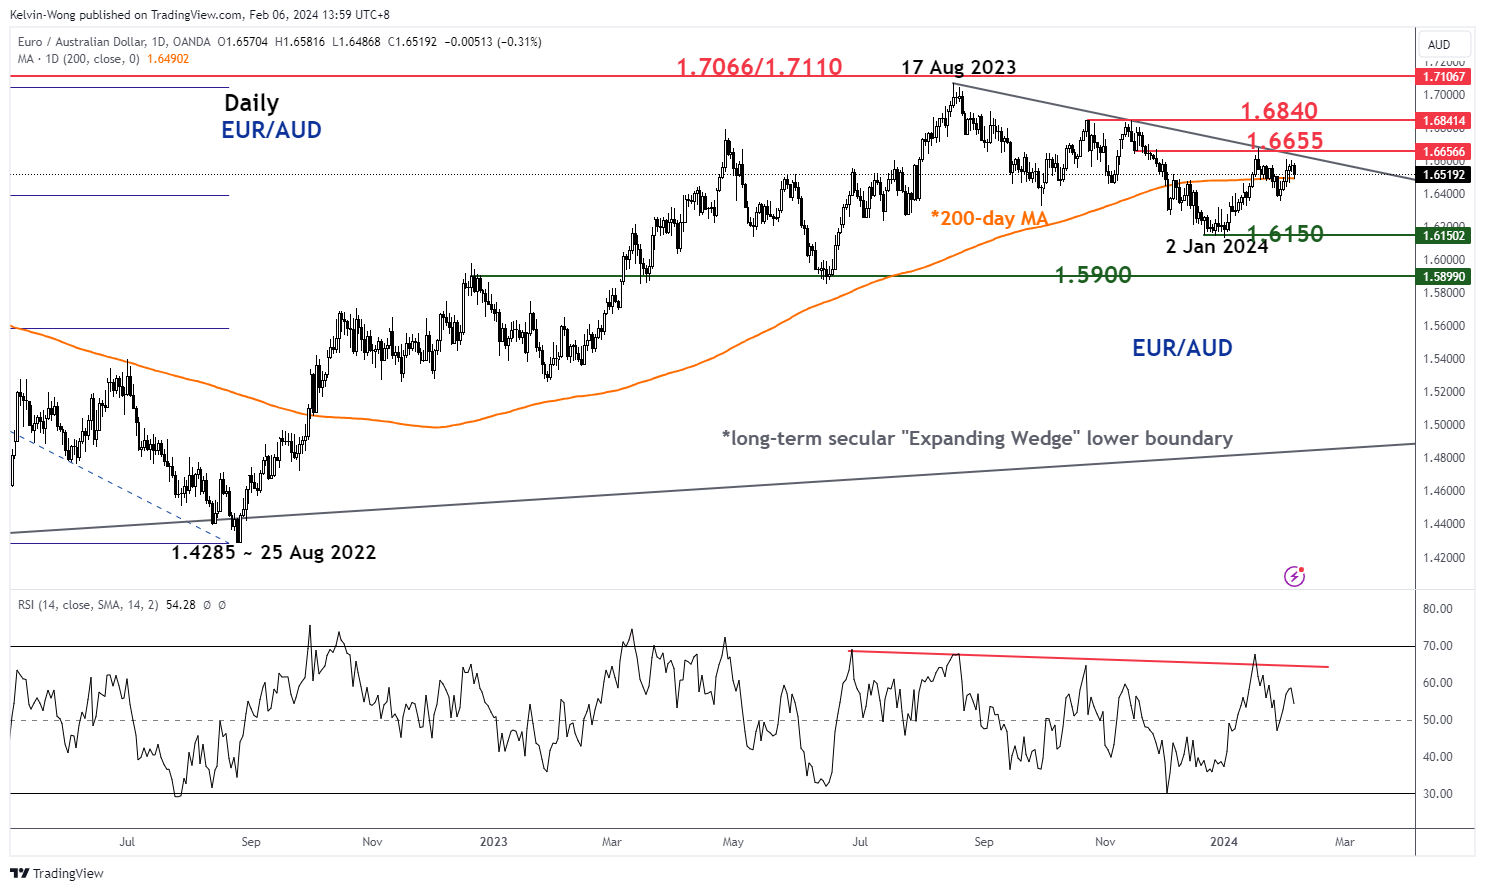
Fig 2: EUR/AUD medium-term trend as of 6 Feb 2024 (Source: TradingView, click to enlarge chart)
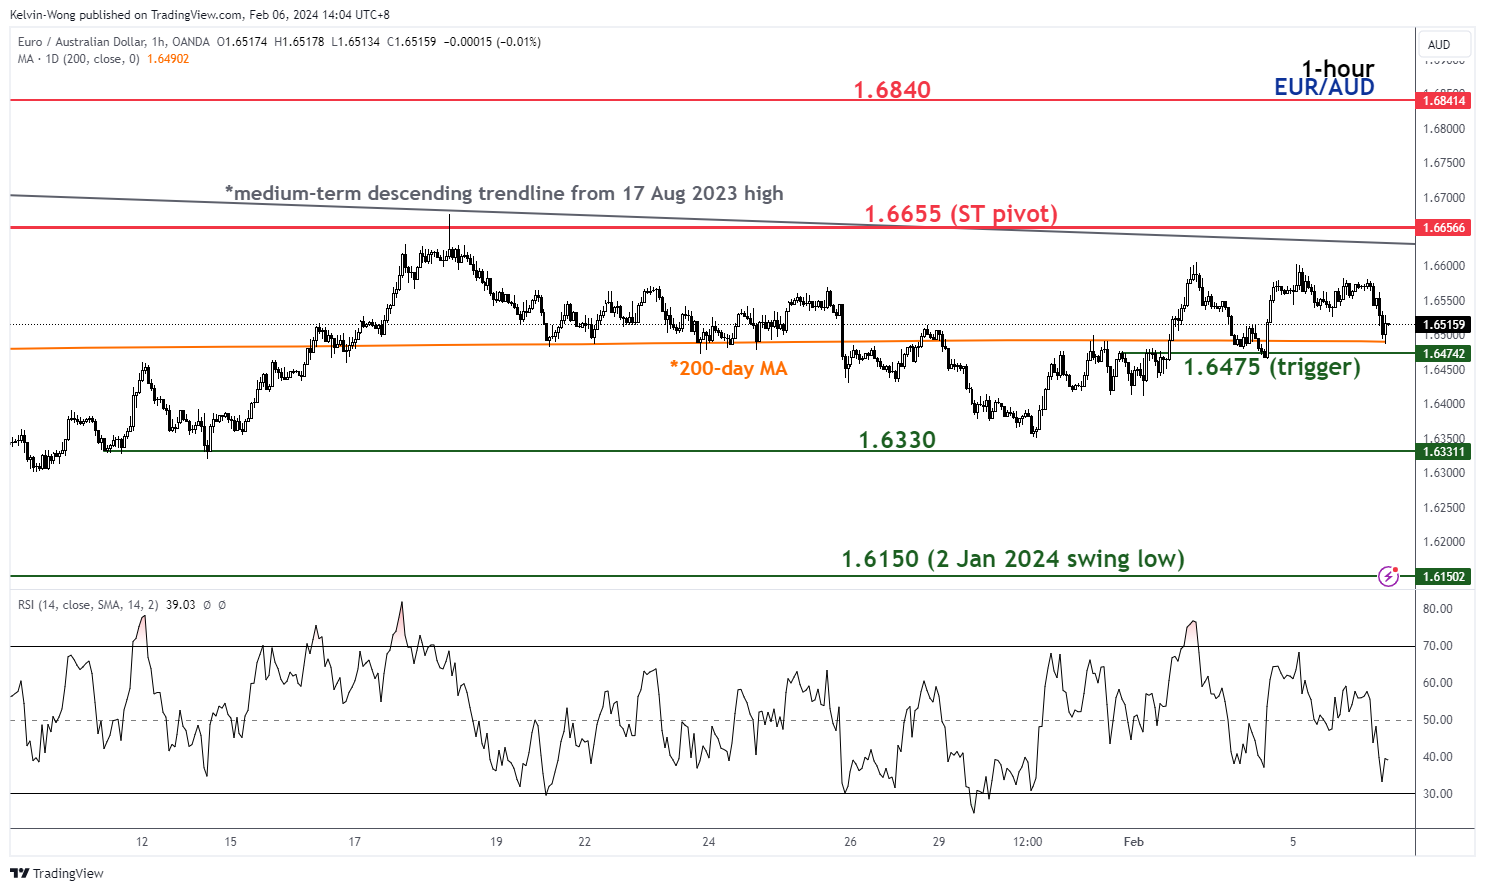
Fig 3: EUR/AUD short-term trend as of 6 Feb 2024 (Source: TradingView, click to enlarge chart)
Today’s intraday rebound seen in the AUD after RBA’s hawkish vibes has put the EUR/AUD on the path of vulnerability for the cross pair to potentially inch lower at least in the short-term horizon.
The short-term up move from the 2 January 2024 low of 1.6129 has stalled at the medium-term descending trendline in place since the 17 August 2023 swing high now acting as a resistance at around 1.6655.
The daily RSI momentum indicator has also threaded lower right below a parallel descending resistance at the 65 level and formed a lower high which suggests medium-term upside momentum is likely to have dissipated (in turn supports lower price actions of EUR/AUD potentially).
Watch the 1.6475 near-term support (also the 200-day moving average), a break below it reinforces a further potential short-term weakness in the EUR/USD to expose the next intermediate supports at 1.6330 and 1.6150.
On the flip side, a clearance above 1.6655 pivotal resistance invalidates the bearish tone for further recovery for the next intermediate resistance to come in at 1.6840 in the first step.
EUR/USD Drops Again While USD/CHF Regains Strength
EUR/USD started a fresh decline below the 1.0810 support. USD/CHF is rising and might aim a move toward the 0.8800 resistance.
Important Takeaways for EUR/USD and USD/CHF Analysis Today
- The Euro struggled to clear the 1.0900 resistance and declined against the US Dollar.
- There was a break above a short-term bearish trend line with resistance near 1.0750 on the hourly chart of EUR/USD at FXOpen.
- USD/CHF is showing positive signs above the 0.8680 resistance zone.
- There was a break below a key bullish trend line with support at 0.8700 on the hourly chart at FXOpen.
EUR/USD Technical Analysis
On the hourly chart of EUR/USD at FXOpen, the pair failed to clear the 1.0900 resistance. The Euro started a fresh decline below the 1.0855 support against the US Dollar, as mentioned in the previous analysis.
There was a move below the 50-hour simple moving average and 1.0810. The bears were able to push the pair below the 1.0765 pivot level. The pair traded as low as 1.0723 and is currently correcting losses.
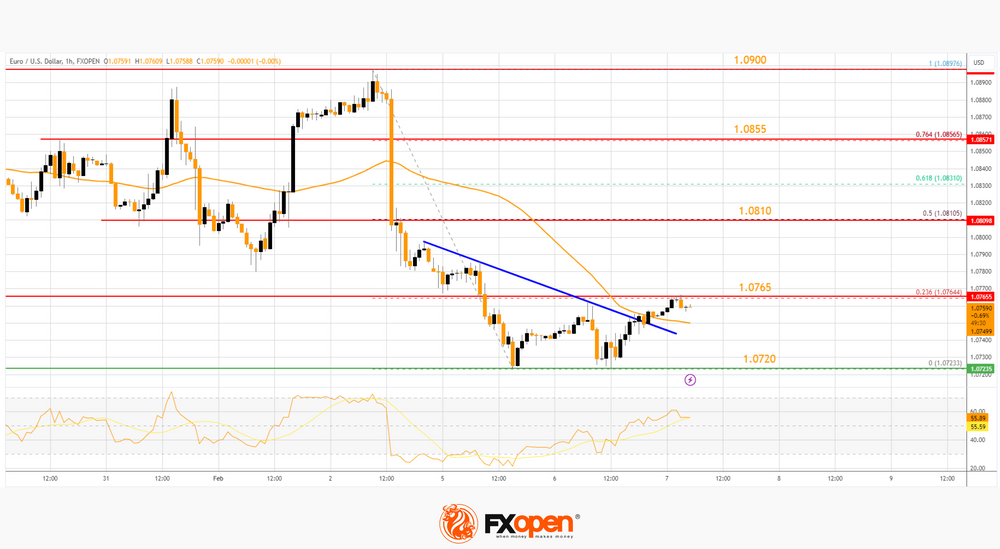
There was a minor move above a short-term bearish trend line with resistance near 1.0750 and the 50-hour simple moving average. Immediate resistance on the upside is near the 23.6% Fib retracement level of the downward move from the 1.0897 swing high to the 1.0723 low.
The next major resistance is near the 1.0810 zone. It is close to the 50% Fib retracement level of the downward move from the 1.0897 swing high to the 1.0723 low.
An upside break above the 1.0810 level might send the pair toward the 1.0855 resistance. Any more gains might open the doors for a move toward the 1.0900 level.
On the downside, immediate support on the EUR/USD chart is seen near 1.0720. The next major support is near the 1.0680 level. A downside break below the 1.0680 support could send the pair toward the 1.0625 level.
USD/CHF Technical Analysis
On the hourly chart of USD/CHF at FXOpen, the pair started a decent increase from the 0.8550 support. The US Dollar climbed above the 0.8625 resistance zone against the Swiss Franc.
The bulls were able to pump the pair above the 50-hour simple moving average and 0.8680. Finally, the pair tested the 0.8740 zone. A high was formed near 0.8740 before there was a minor pullback. The pair declined below the 23.6% Fib retracement level of the upward move from the 0.8552 swing low to the 0.8740 high.
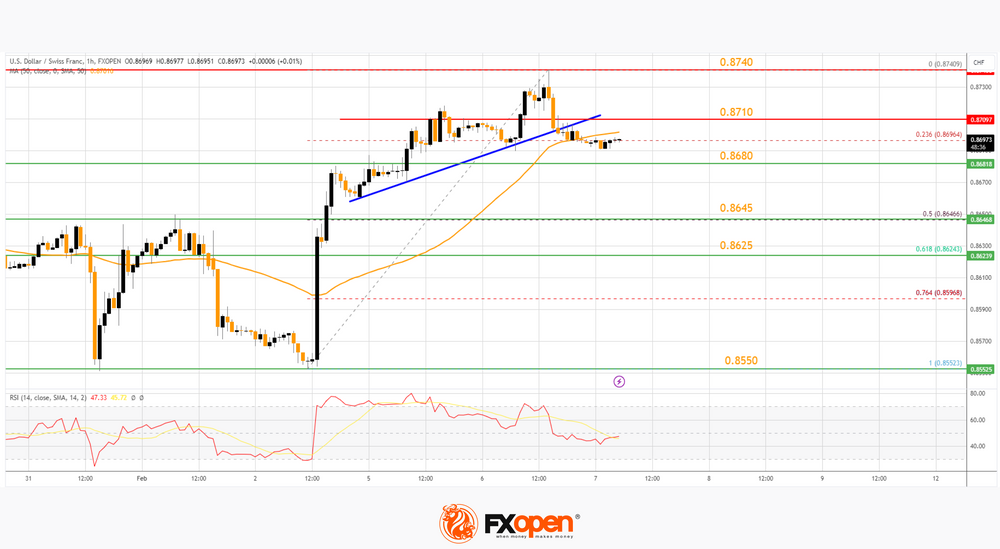
There was also a break below a key bullish trend line with support at 0.8700. The pair is now below the 50-hour simple moving average. On the downside, immediate support on the USD/CHF chart is near the 0.8680 zone.
The first major support is near the 50% Fib retracement level of the upward move from the 0.8552 swing low to the 0.8740 high at 0.8645. A downside break below 0.8645 might spark bearish moves. The next major support is near the 0.8550 pivot level.
Any more losses may possibly open the doors for a move toward the 0.8500 level in the near term. On the upside, the pair is now facing resistance near 0.8710.
The next major resistance is at 0.8740. The main resistance is now near 0.8765. If there is a clear break above the 0.8765 resistance zone and the RSI climbs above 60, the pair could start another increase. In the stated case, it could test 0.8800.
Trade over 50 forex markets 24 hours a day with FXOpen. Take advantage of low commissions, deep liquidity, and spreads from 0.0 pips. Open your FXOpen account now or learn more about trading forex with FXOpen.
This article represents the opinion of the Companies operating under the FXOpen brand only. It is not to be construed as an offer, solicitation, or recommendation with respect to products and services provided by the Companies operating under the FXOpen brand, nor is it to be considered financial advice.
BoE’s Breeden highlights coming months as incredibly important to inflation and wage assessment
BoE Deputy Governor Sarah Breeden indicated in a speech growing confidence that further tightening of rates might not be necessary. She noted a pivotal shift in focus towards "how long rates need to remain at their current level."
Breeden underscored the importance of upcoming pay settlements and corporate responses to rising costs as key determinants of her stance on rate cuts. With pay growth currently running "several percentage points higher than what is consistent with the inflation target were they to persist," the pathway to aligning underlying inflation with the target hinges on "some combination of a further moderation in labor cost growth and firms' margins will be needed."
She noted some encouragement from other economies' advanced progress in managing inflationary pressures but emphasized the need for "further evidence" before applying similar optimism to the UK's situation.
The upcoming months are set to play a crucial role in shaping Breeden's evaluation of wage and price persistence, with a significant portion of the year's wage negotiations expected to "conclude by April". This period will be "incredibly important for my assessment," she remarked, indicating the critical nature of this timeframe in determining the future direction of BoE's monetary policy.
Ethereum Nears Recent Turning Point
Market Picture
The crypto market cap remained at $1.65 trillion. Bitcoin spent another day almost unchanged at $42.8K.
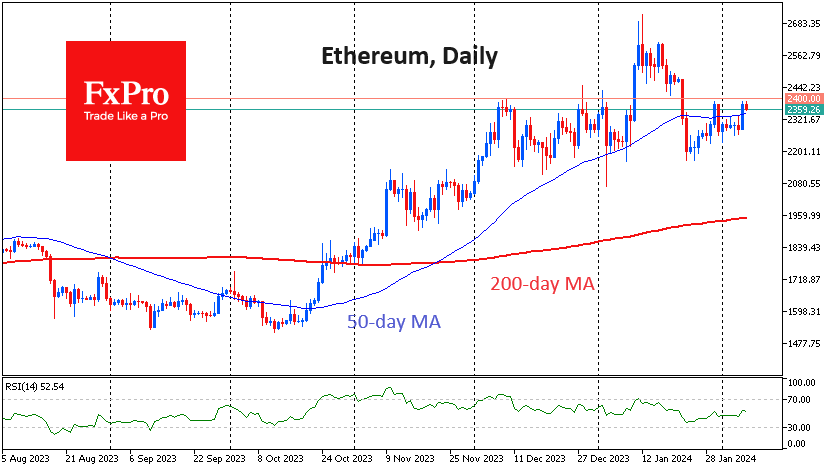
Ethereum was a major growth driver, gaining 1.6% on the day to $2,350 and reversing to the downside as it approached $2,400. This is the same place where we saw a reversal at the end of January and for a month since the beginning of December. In December, the coin managed to hold above this reversal level for almost a fortnight, but with the current lull in the markets, a temporary pullback to the lower end of the range towards $2,200 looks more likely.
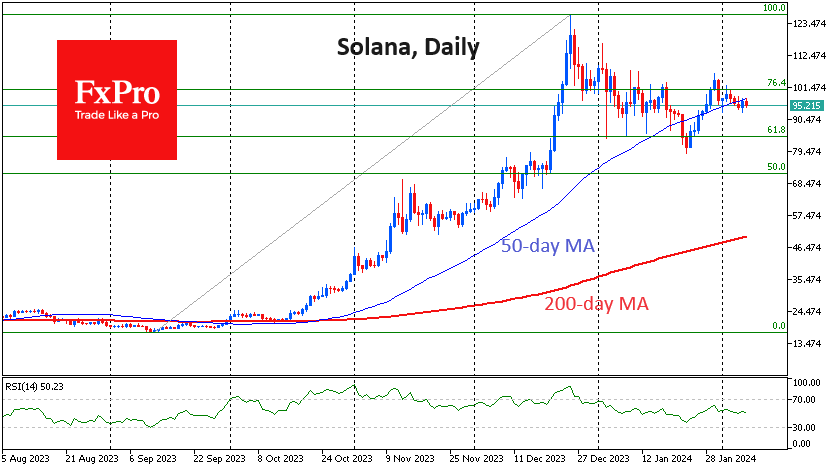
With a loss of 6% over the last seven days, Solana has moved slightly below its 50-day moving average, raising the question of the sustainability of the recent rally. However, the fall to $85 will be within the correction pattern after the September-December rally.
News Background
The Solana blockchain suffered a glitch on the 6th of February when the network stopped processing blocks. Laine, the developer of the Solana blockchain software and validator, clarified that the outage was due to a ‘performance degradation’ of the underlying network.
Anonymous cryptocurrency Monero (XMR) plunged 15% after reports of its delisting on Binance. Monero’s developers said they would never compromise privacy and advised people to trade XMR on other platforms.
A US court ordered Ripple to disclose its 2022-2023 sales of XRP tokens to retail investors. Ripple CEO Brad Garlinghouse criticised the SEC at the World Economic Forum in Davos, calling it hostile to the crypto industry.
Bitcoin is displacing gold as a capital preservation asset in times of economic uncertainty, a situation that will continue thanks to the emergence of ETFs, said Cathie Wood, CEO of ARK Invest. ETFs are an easy and seamless way to buy the first cryptocurrency, she said.
According to CoinGecko, Europe and Canada account for nearly 98% of the $5.7 billion Ethereum ETF market. This could change dramatically with the emergence of spot ETH funds in the US.
NZDUSD Bounces Off 2-month Low
- NZDUSD extends its bearish leg below 200-day SMA
- But manages to rebound strongly from 2-month bottom
- Oscillators remain tilted to the downside
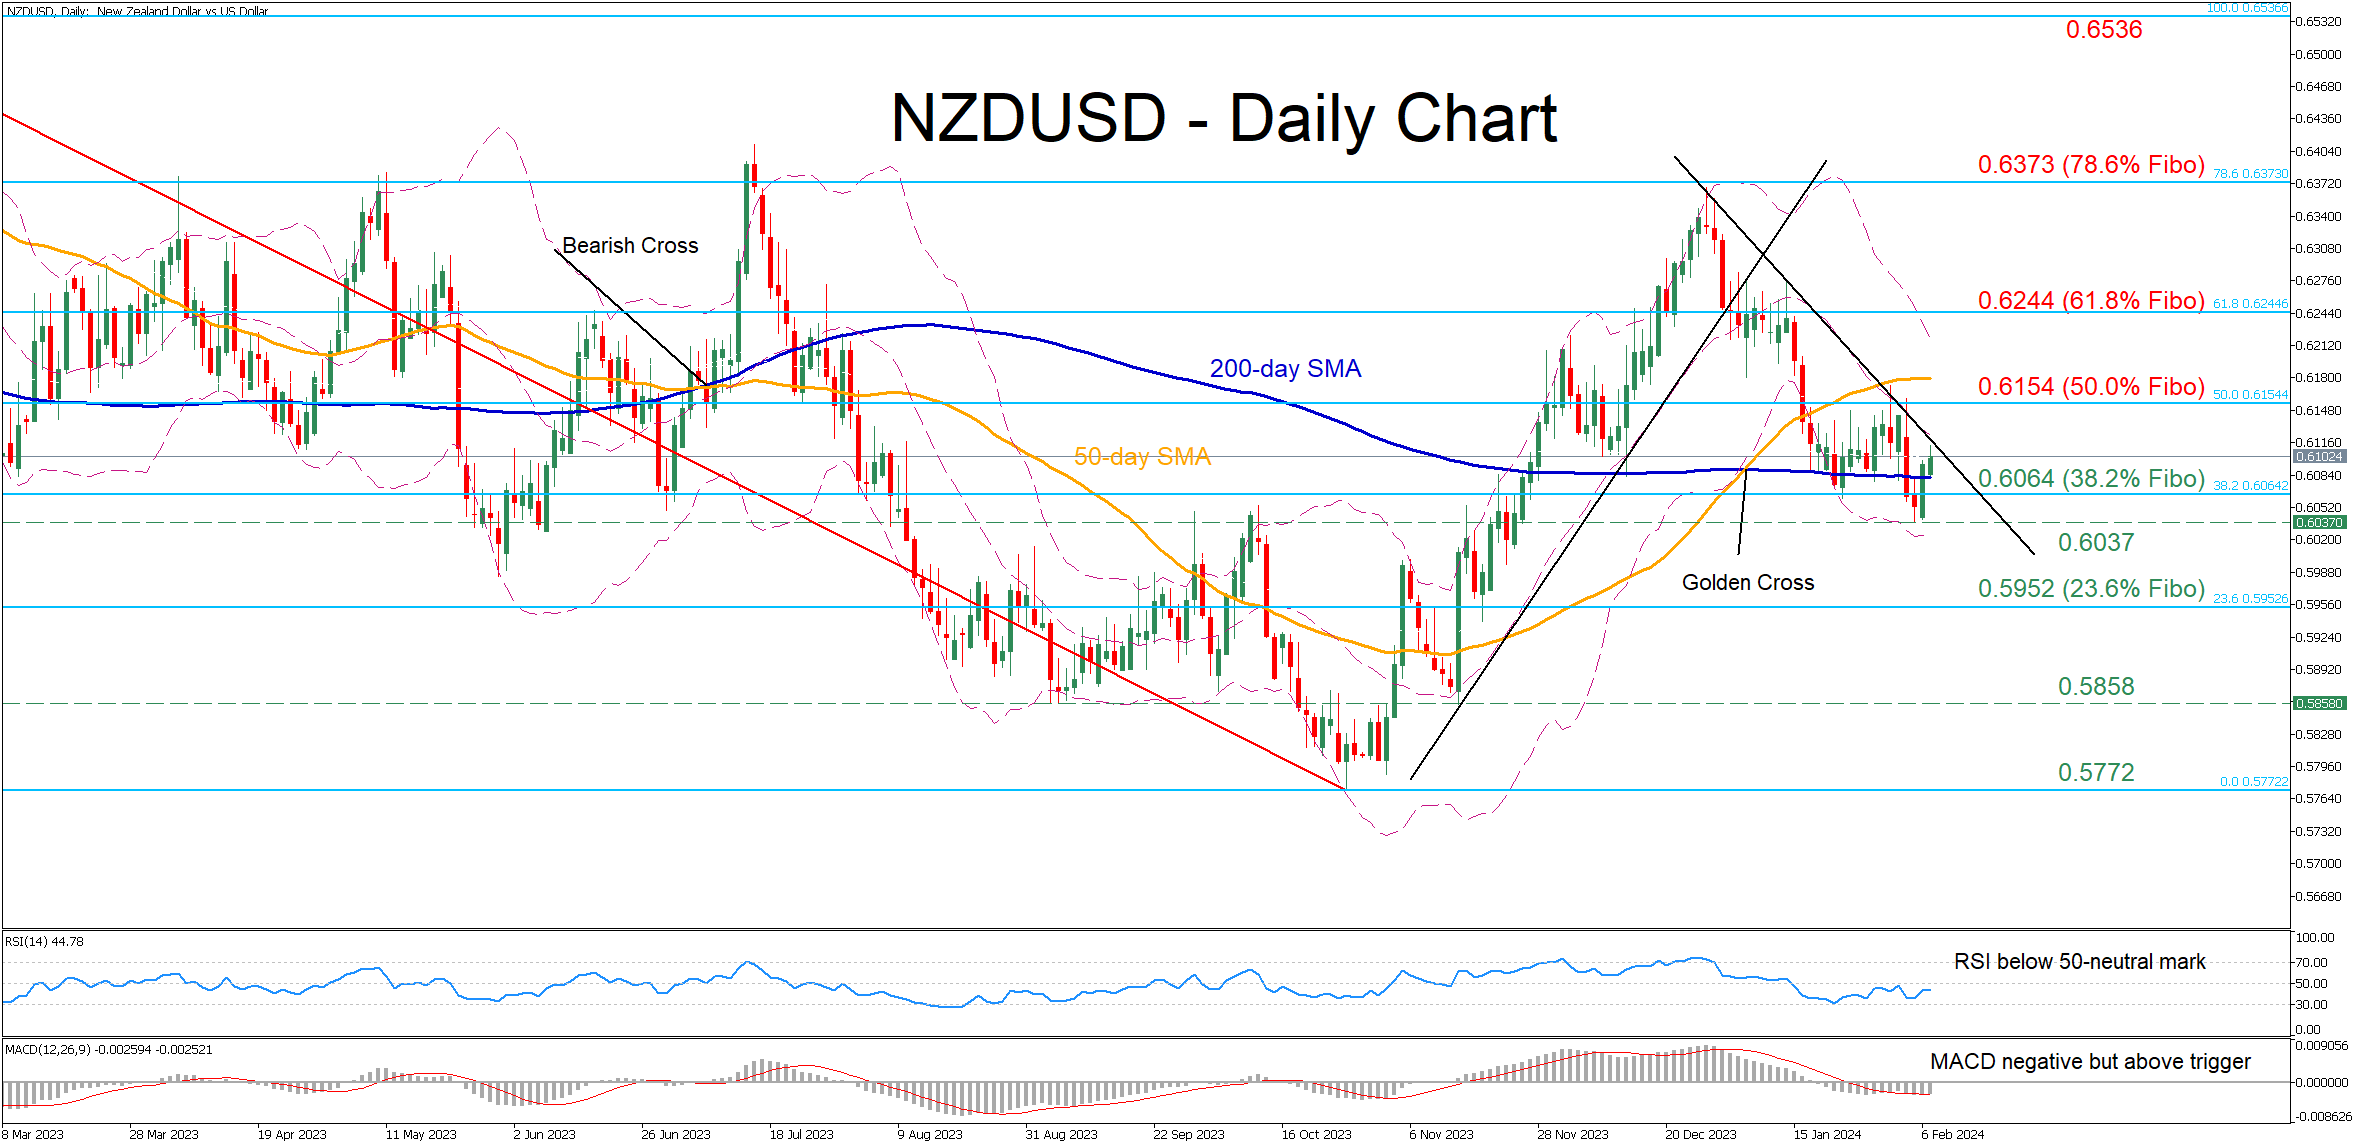
NZDUSD has been in a steady downtrend since its rejection from near 0.6373 in late December, which is the 78.6% Fibonacci retracement of the 0.6536-0.5772 downleg. This week, the pair dropped to a fresh two-month low after violating its 200-day simple moving average (SMA), but the bulls fought back and reclaimed the latter.
Given that both the RSI and MACD are within their negative zones, the price might revisit its 200-day SMA, currently at 0.6082. Diving beneath that floor, the pair could challenge the 38.2% Fibo of 0.6064 ahead of the recent two-month bottom of 0.6037. A violation of that region could pave the way for the 23.6% Fibo of 0.5952.
On the flipside, should the recovery persist, immediate resistance could be found at the 50.0% Fibo of 0.6154. Further advances could then cease around the 61.8% Fibo of 0.6244. Breaking above that hurdle, the price might ascend towards the 78.6% Fibo of 0.6373, a region that capped the pair's advance in December.
Overall, despite NZDUSD’s slide below the crucial 200-day SMA, the bulls managed to strike back and reclaim that barricade. For the rebound to resume, the price needs to break above the downward sloping trendline that connects its lower highs since December.
NZD/USD Shrugs after NZ Employment Report
- New Zealand’s unemployment rises, wages ease
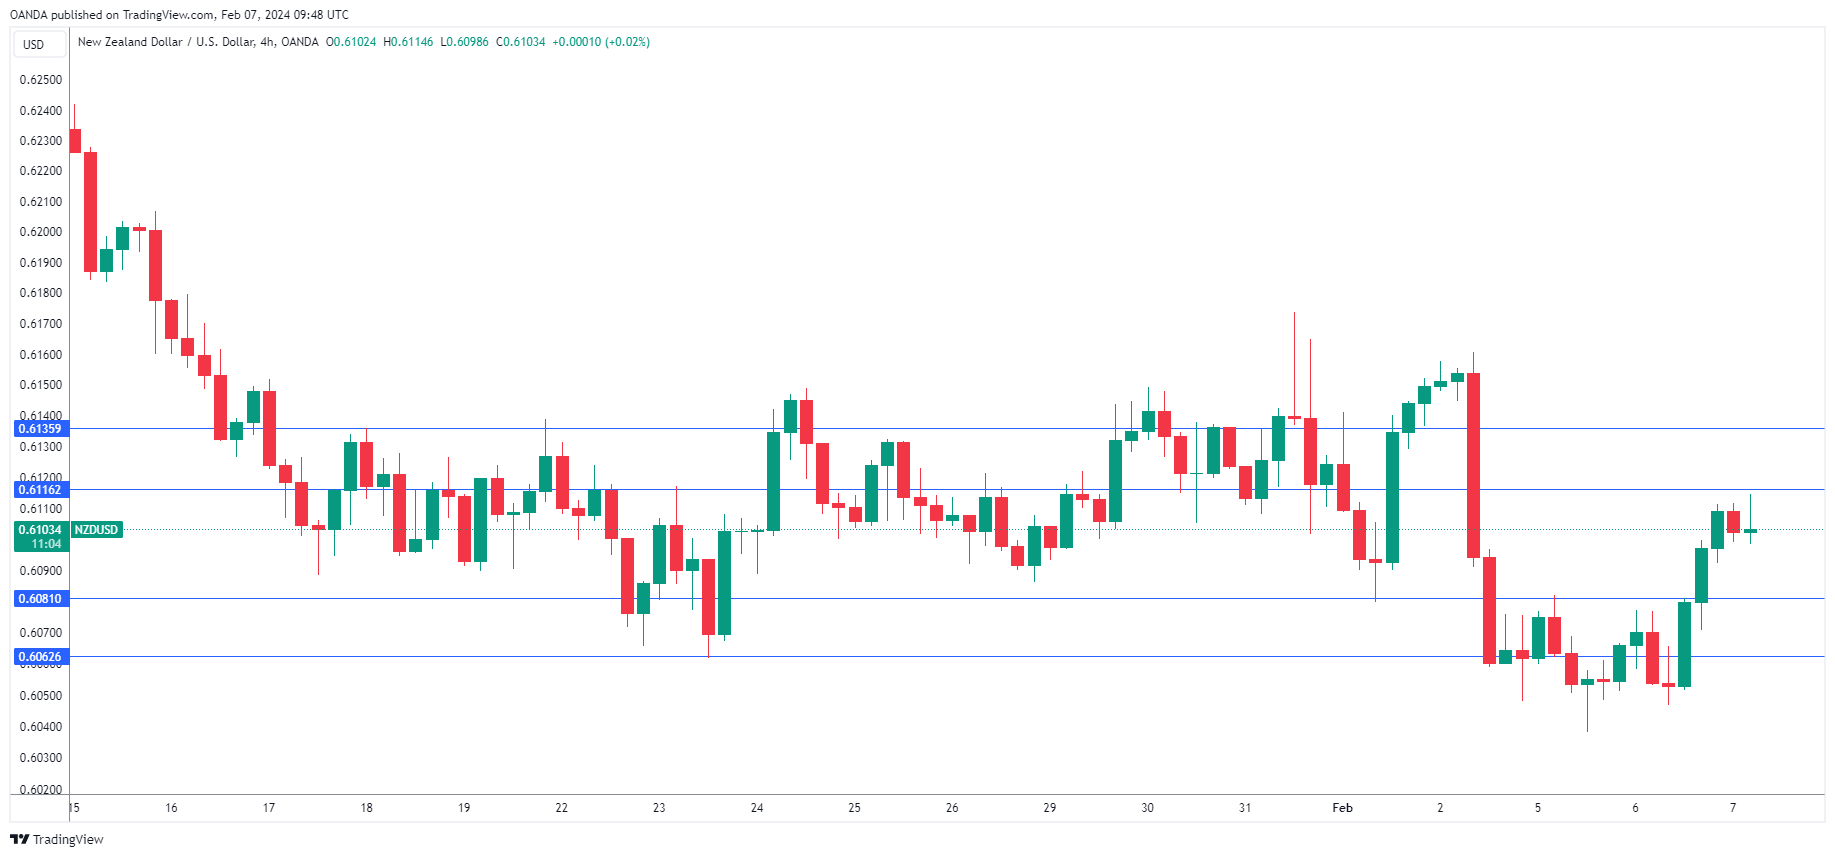
The New Zealand dollar is drifting on Wednesday, after jumping 0.73% a day earlier. In the North American session, NZD/USD is trading at 0.6104, up 0.12%.
New Zealand’s employment change rises
New Zealand’s employment report for the fourth quarter indicated that the labour market remains relatively strong. Employment rebounded with a gain of 0.4% q/q, after a 0.2% decline in the third quarter. This edged above the market estimate of 0.3%. Wage growth eased to 3.9% y/y, down from 4.1% in Q3 and higher than the market estimate of 3.9%. Finally, the unemployment rate crept higher to 4.0%, up from 3.9% but below the market estimate of 4.0%.
It will be interesting to see how the Reserve Bank of New Zealand responds to this latest job data. The name of the game for the central bank is to bring inflation back to the target range of 1 percent to 3 percent. Wage inflation is easing and the labour market is cooling but with inflation at 4.7%, the RBNZ will not be in any rush to start lowering interest rates.
At the last meeting in November, the RBNZ warned that rates could move higher and said it wasn’t planning to lower rates until 2025. However, data revisions have shown that the economy is weaker than previously thought, which has raised expectations of rate cuts in the second half of this year. The RBNZ has kept the cash rate unchanged at 5.5% for five straight times, which likely means that its steep rate-tightening cycle has run its course, despite the Bank’s warnings that rates could rise. Inflation has fallen dramatically since the RBNZ began its rate-tightening cycle in 2021 but it remains sticky and well above the target range. The RBNZ will likely maintain rates until inflation declines further.
NZD/USD Technical
- There is resistance at 0.6116 and 0.6135
- 0.6081 and 0.6062 are providing support
CAD Strengthened After Statements from Head of Bank of Canada
The head of the Bank of Canada, Tiff Macklem, stated yesterday that monetary policy needs more time to ease price pressures.
He noted that the main problem in suppressing inflation is housing costs. “Housing affordability is a significant problem in Canada—but not one that can be fixed by raising or lowering interest rates,” said Tiff Macklem.
It is worth noting that the efforts of the Bank of Canada have reduced inflation in the country from its highest level of 8.1% in June 2022 to 3.4% in December 2023. It is possible that the path to the target rate of 2% may take more time. And then rates will remain high for longer, as the head of the Bank of Canada suggests. Reuters writes that the first rate cut may only come in the summer.
The market reacted with the strengthening of the Canadian dollar to Macklem's relatively hawkish rhetoric.
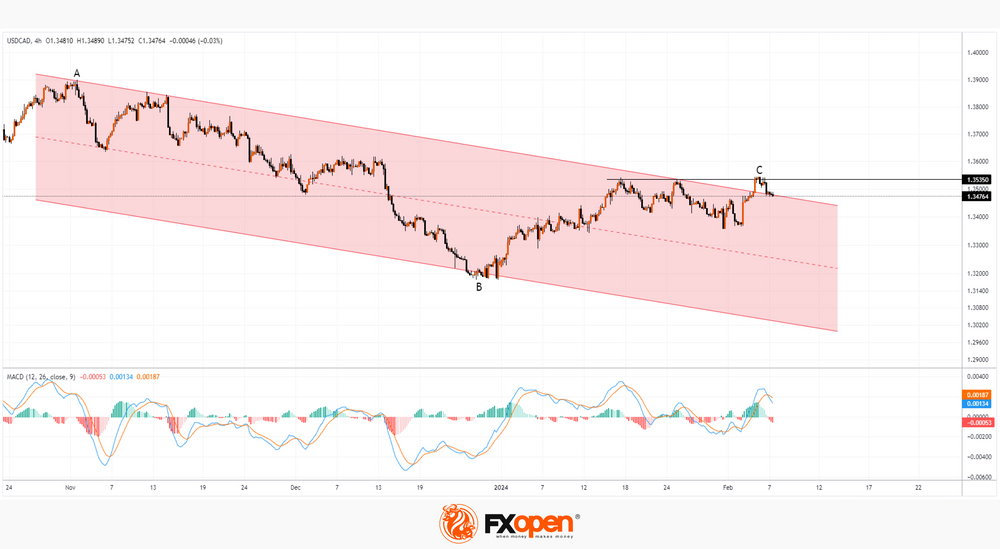
The USD/CAD chart shows that:
→ The USD/CAD price declined, making a false break below the level of 1.3535, which served as resistance in January – this is a sign of insufficient demand.
→ At the same time, point C formed, which is approximately at the 50% level of the decline from A to B.
The MACD indicator demonstrates bearish dynamics, giving reason to believe that bears may become more active and return the USD/CAD price within the framework of the descending trend (shown by the red channel).
Trade over 50 forex markets 24 hours a day with FXOpen. Take advantage of low commissions, deep liquidity, and spreads from 0.0 pips. Open your FXOpen account now or learn more about trading forex with FXOpen.
This article represents the opinion of the Companies operating under the FXOpen brand only. It is not to be construed as an offer, solicitation, or recommendation with respect to products and services provided by the Companies operating under the FXOpen brand, nor is it to be considered financial advice.
ECB’s Schnabel: Incoming data signals tough final stretch in inflation battle
ECB Executive Board member Isabel Schnabel highlighted in an FT interview the challenges facing Eurozone as it approaches what she terms the "last mile" in the fight against inflation. Despite rapid disinflation experienced due to the reversal of supply-side shocks, Schnabel emphasizes that the region is now entering a "critical phase". This phase demands precise calibration and transmission of monetary policy, focusing on curbing "second-round effects" to prevent inflation from becoming entrenched.
"Recent incoming data do not allay my concerns that the last mile may be the most difficult one," Schnabel remarked, pointing to persistent issues such as "sticky services inflation" and a "resilient labour market" that complicate ECB's policy decisions.
Additionally, she noted "notable loosening of financial conditions" driven by market anticipation of a central bank pivot, which could undermine efforts to stabilize prices.
Furthermore, Schnabel expressed concern over potential new supply chain disruptions, spurred by recent developments in the Red Sea, adding another layer of complexity to the inflation outlook.
"This cautions against adjusting the policy stance soon," she stated. "We must be patient and cautious because we know, also from historical experience, that inflation can flare up again."
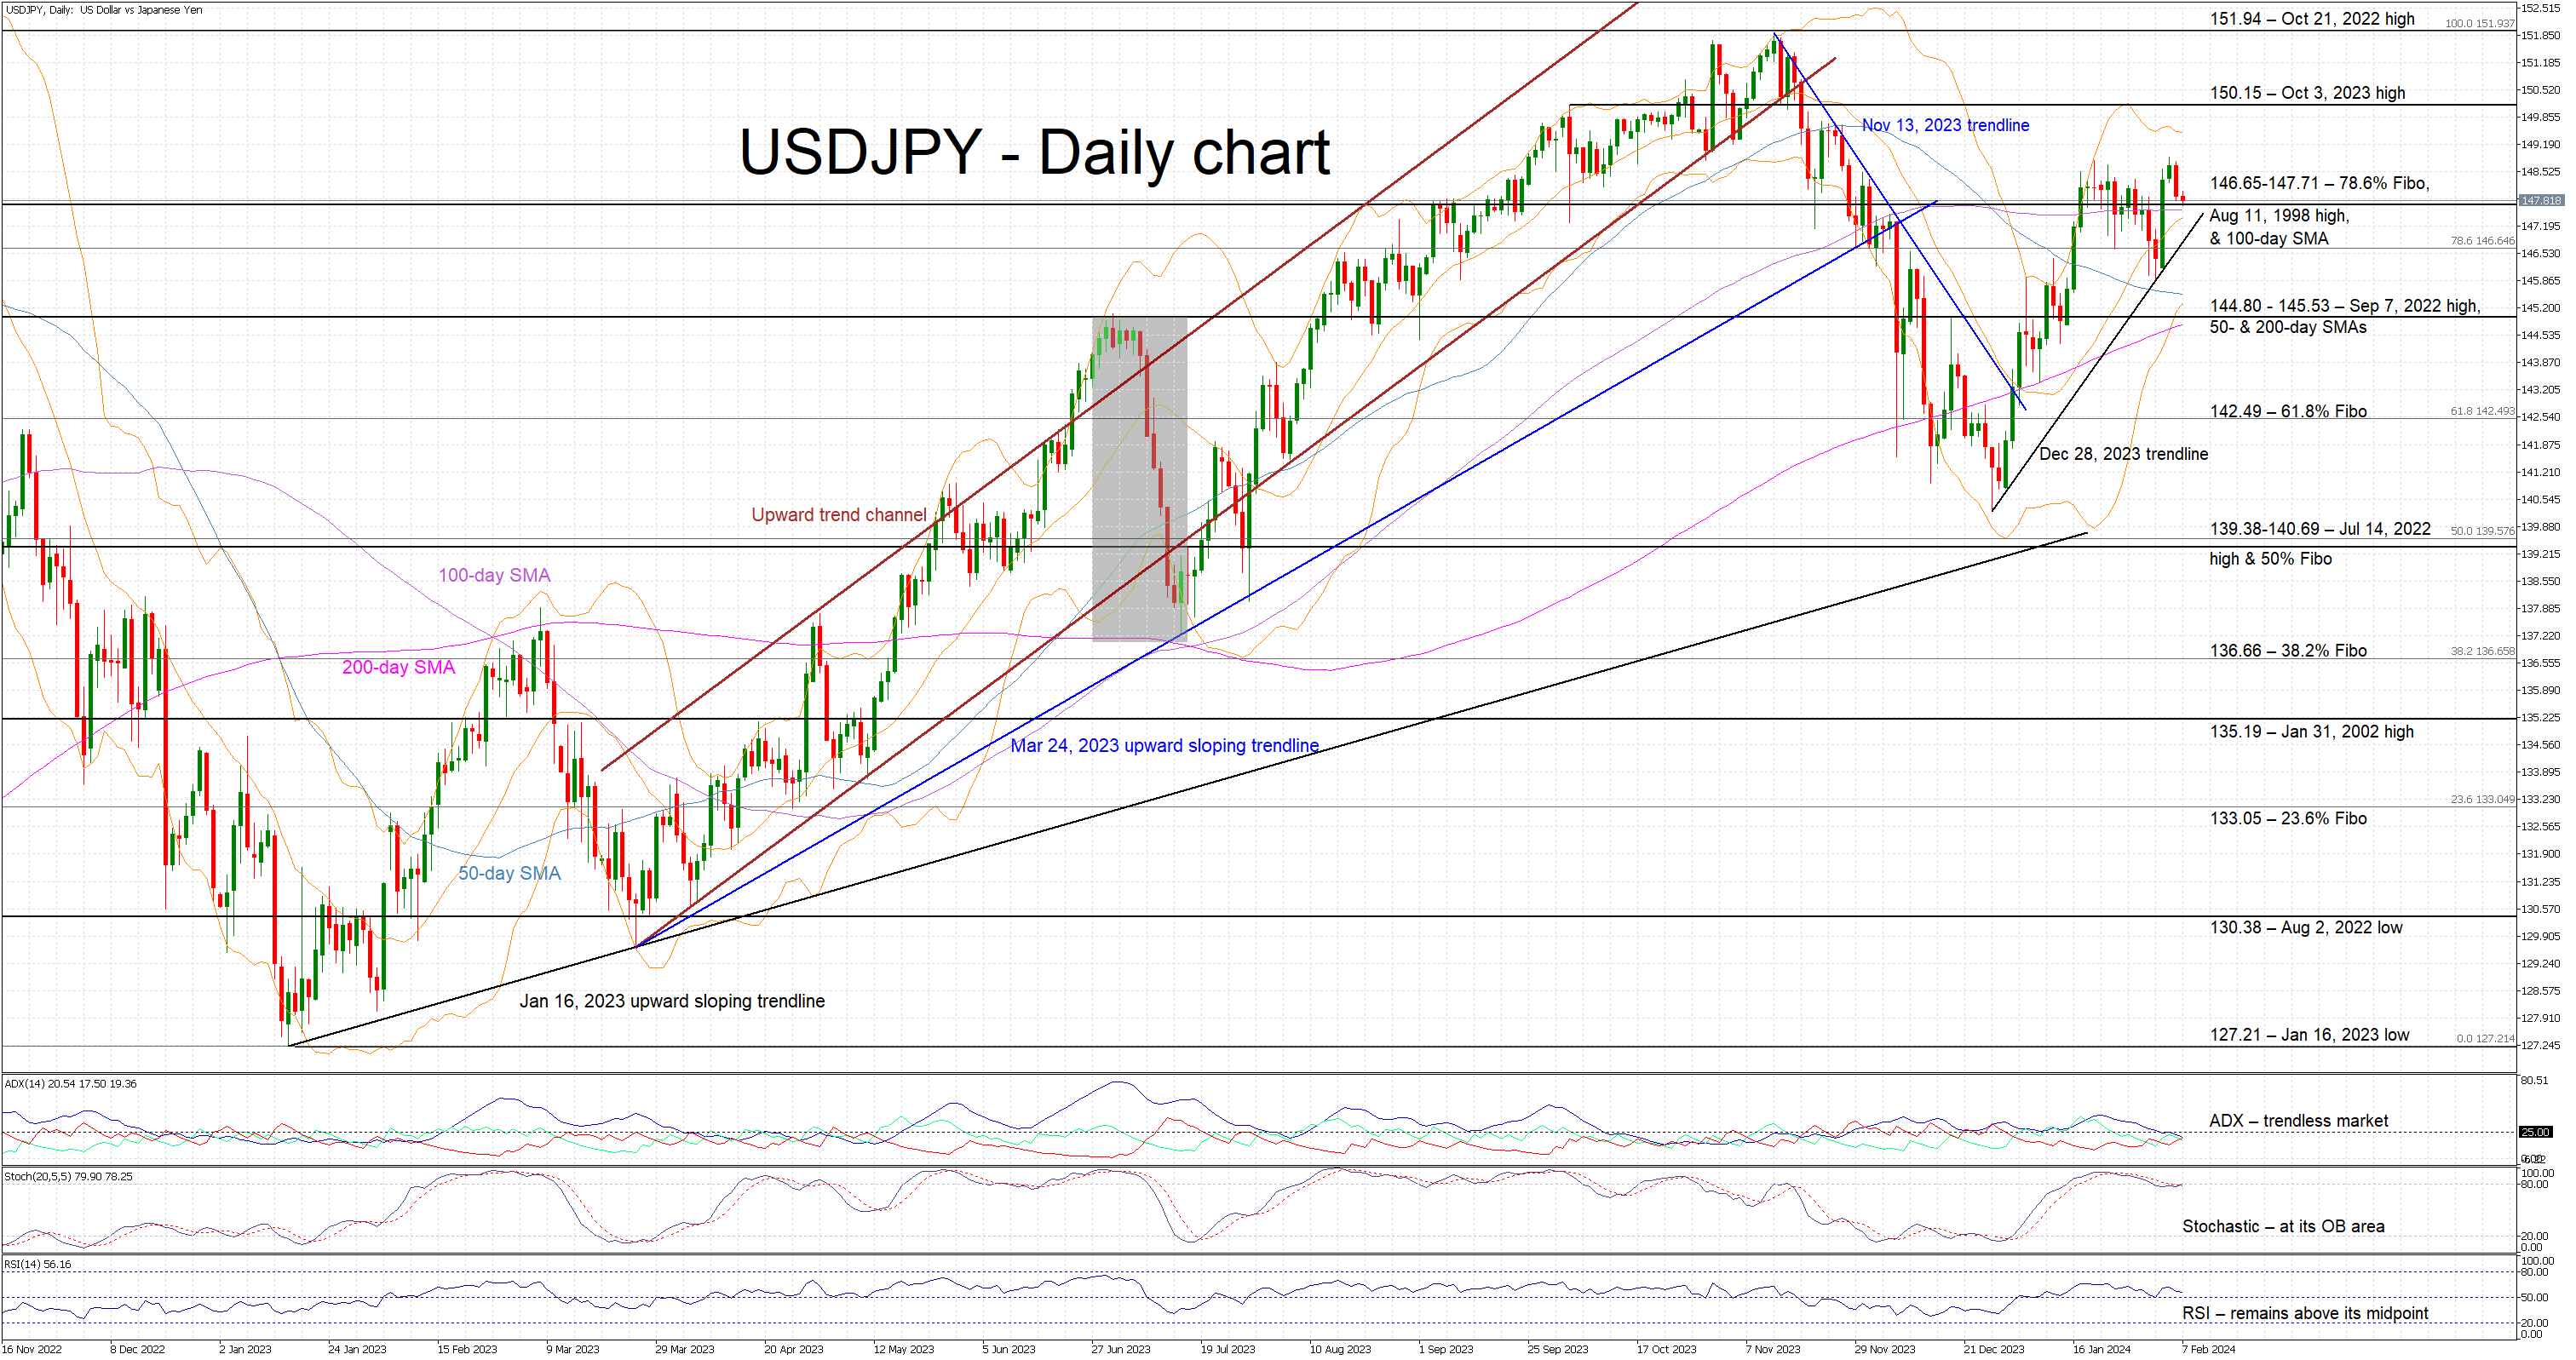
USDJPY Hovers Above a Key Support Area
- USDJPY is in the red again today, reacts to last week's jump
- It continues to hover a tad above its 100-day SMA
- Most momentum indicators tentatively support the ongoing upleg
USDJPY is recording its second consecutive red candle, recouping a good part of last week’s strong gains. USDJPY continues to trade above the busy 146.65-147.71 area with the 100-day simple moving average (SMA) acting as a main support factor. The upward move since the December 28, 2023 trough remains comfortably in place.
In the meantime, the momentum indicators appear mostly supportive of the current upleg. The RSI continues to trade above its 50-midpoint and, more importantly, the stochastic oscillator remains stuck at its overbought territory. A move below this area could be seen as a strong bearish signal. On the flip side, the Average Directional Movement Index (ADX) appears uninterested in the recent moves and it is hovering in trendless territory.
Should the bulls remain hungry, they could try to stage another rally with the October 3, 2023 high at 150.15 possibly being the first target. Even higher, the October 21, 2022 high at 151.94 could be tested, opening the door for a new 30-year high.
On the flip side, the bears are probably keen to push USDJPY below the 146.65-147.71 area, which is populated by the 78.6% Fibonacci retracement of the October 21, 2022 - January 16, 2023 downtrend, the August 11, 1998 high and the 100-day SMA. If successful, the bears could then lead USDJPY towards the 144.80-145.53 region. This appears to be a key support area and would probably prove stronger to overcome than currently envisaged.
To sum up, USDJPY bulls took advantage of the recent US data releases, but they need stronger support from the momentum indicators to push the pair even higher.