
Sample Category Title
USD/CHF Daily Outlook
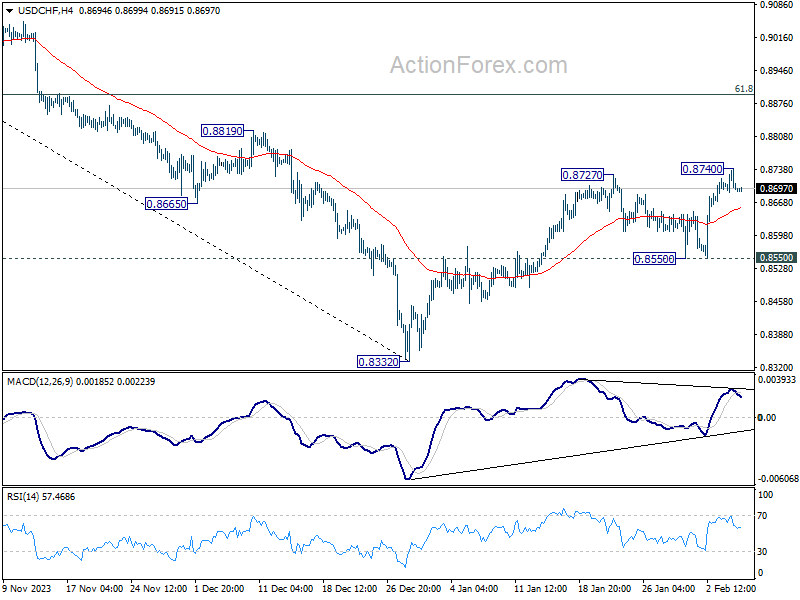
Daily Pivots: (S1) 0.8678; (P) 0.8710; (R1) 0.8729; More....
USD/CHF retreated after failing to sustain above 0.8727 resistance. Intraday bias is turned neutral again. For now, further rally is expected as long as 0.8550 support holds. Break of 0.8740 will resume the rebound from 0.8332 to 61.8% retracement of 0.9243 to 0.8332 at 0.8995 next.
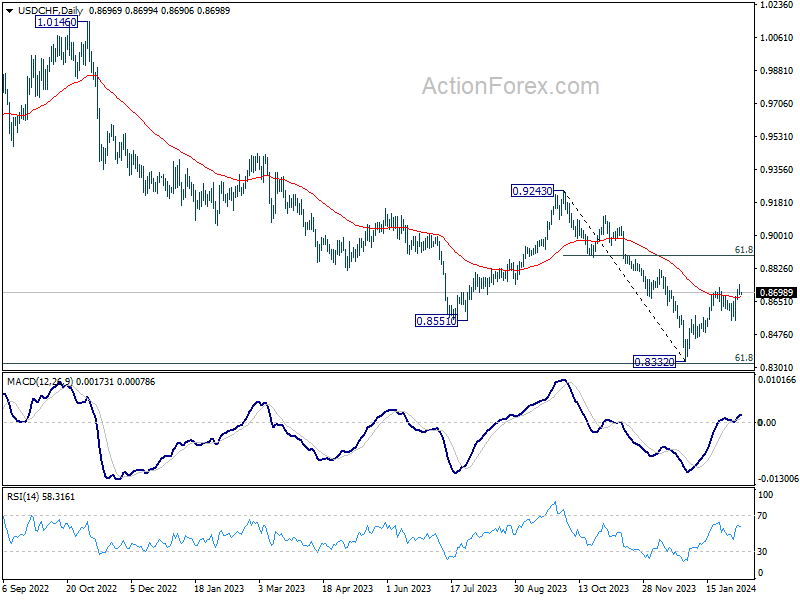
In the bigger picture, there is prospect of medium term bottoming at 0.8332 considering possible bullish convergence condition in W MACD, and the support from 0.8317 long term fibonacci support. Sustained trading above 55 D EMA (now at 0.8672) will affirm this case, and bring stronger rise back towards 0.9243 resistance, even as a corrective move.
USD/JPY Daily Outlook
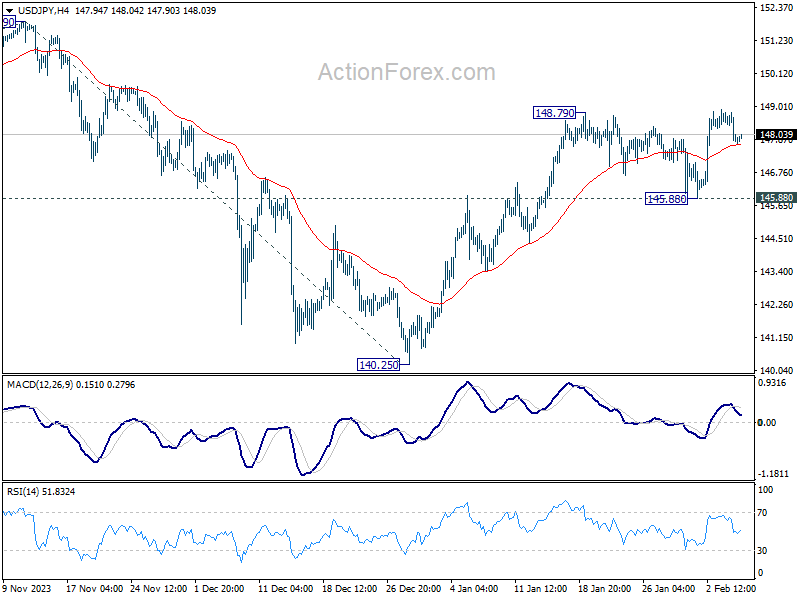
Daily Pivots: (S1) 147.58; (P) 148.19; (R1) 148.55; More...
Range trading continues in USD/JPY and intraday bias remains neutral. Focus remains on 148.79 resistance. Firm break there will resume the rally from 140.25 to 151.89/93 key resistance zone. For now, further rise will remain in favor as long as 145.88 holds, in case of retreat.
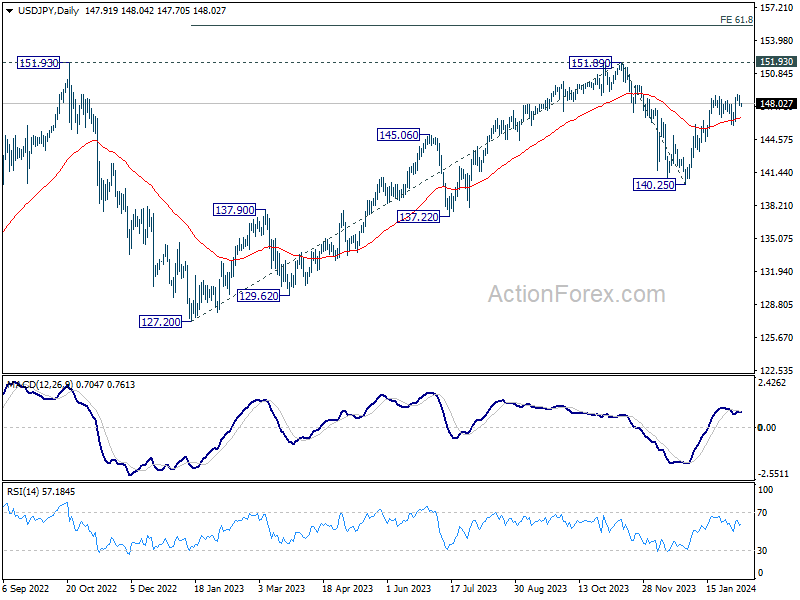
In the bigger picture, fall from 151.89 is seen as a correction to the rally from 127.20, which might have completed at 140.25 already. Firm break of 151.89/93 resistance zone will confirm up trend resumption next target will be 61.8% projection of 127.20 to 151.89 from 140.25 at 155.50. This will now remain the favored case as long as 140.25 support holds.
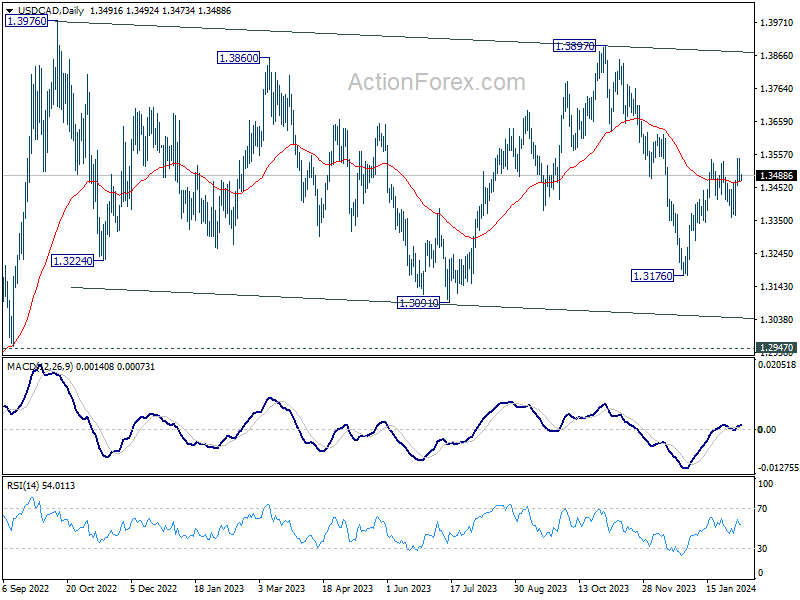
USD/CAD Daily Outlook
Daily Pivots: (S1) 1.3464; (P) 1.3506; (R1) 1.3536; More...
Range trading continues in USD/CAD and intraday bias remains neutral. On the upside, break of 1.3540 will resume the rise from 1.3176. That will also revive that case that whole fall from 1.3897 has completed, and target this resistance. Nevertheless, firm break of 1.3357 support will argue that rebound from 1.3176 has completed, and target this low for resuming whole fall from 1.3897.
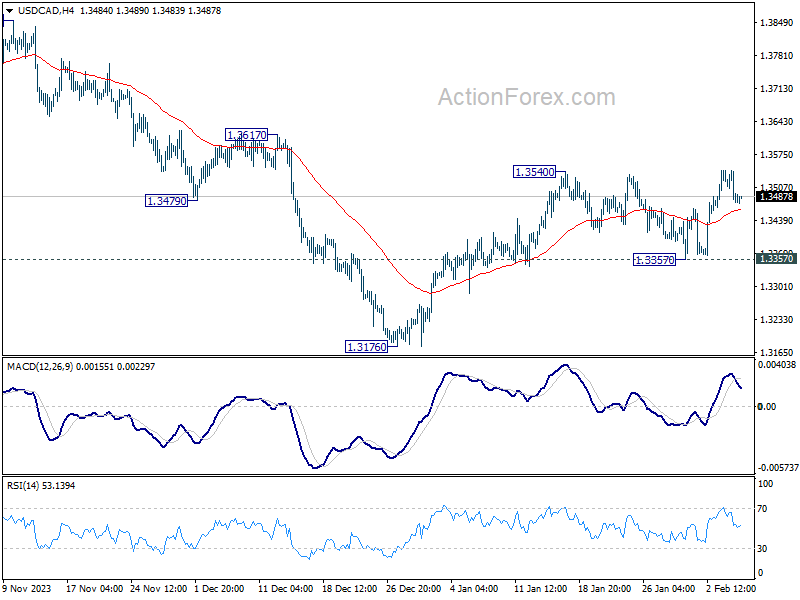
In the bigger picture, price actions from 1.3976 (2022 high) are viewed as a corrective pattern only. In case of another fall, strong support should emerge above 1.2947 resistance turned support to bring rebound. Overall, larger up trend from 1.2005 (2021 low) is still expected to resume through 1.3976 at a later stage.
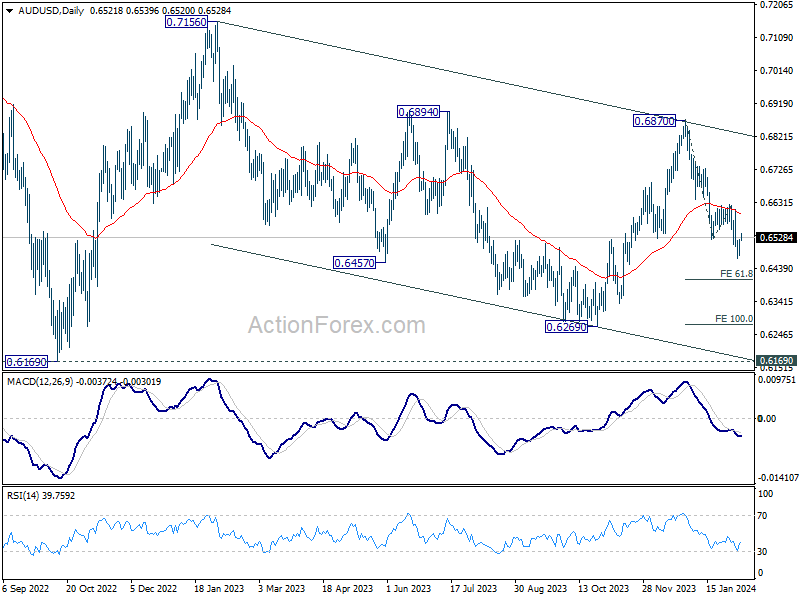
AUD/USD Daily Report
Daily Pivots: (S1) 0.6492; (P) 0.6509; (R1) 0.6539; More...
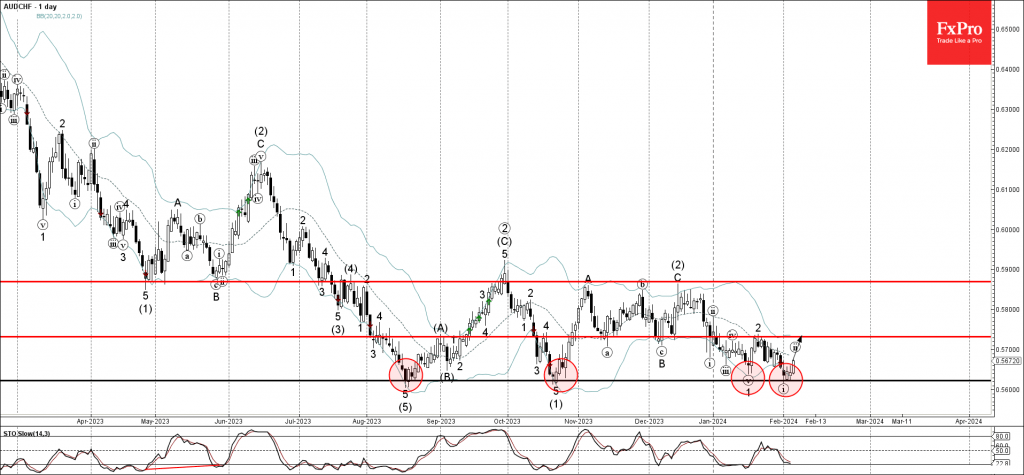
AUD/USD is extending consolidations from 0.6468 and intraday bias remains neutral. Stronger recovery cannot be ruled out, but outlook will stay bearish as long as 0.6621 resistance holds. On the downside, break of 0.6468 will resume the fall from 0.6870, as part of the down trend from 0.7156, to 61.8% projection of 0.6870 to 0.6524 from 0.6621 at 0.6407 next.
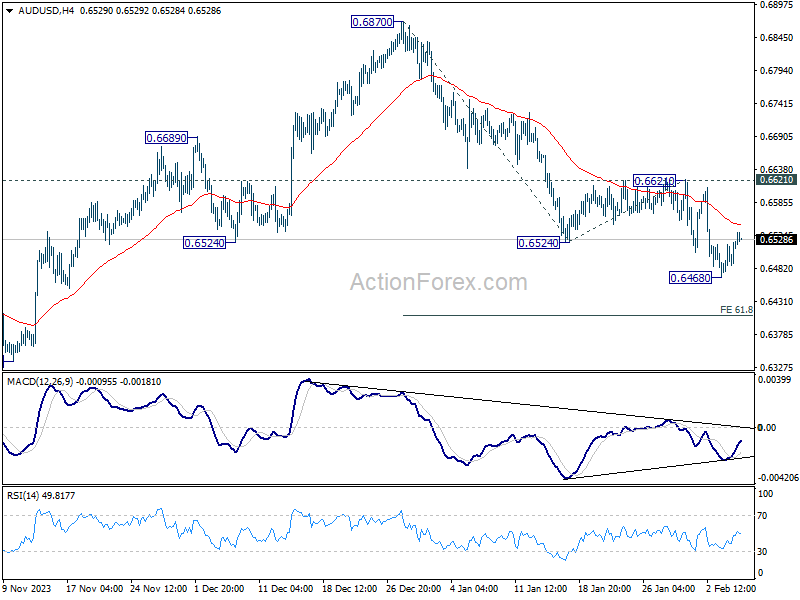
In the bigger picture, price actions from 0.6169 (2022 low) are seen as a medium term corrective pattern to the down trend from 0.8006 (2021 high). Fall from 0.7156 (2023 high) is seen as the second leg, which might still be in progress. Overall, sideway trading could continue in range of 0.6169/7156 for some more time. But as long as 0.7156 holds, an eventual downside breakout would be mildly in favor.
Commodity Currencies in Fragile Rebound, Await Concrete Market Stabilization Moves from China
Commodity currencies are the main movers in Asian markets today, gaining broadly, albeit against a backdrop of continued weak momentum. This situation unfolds as Chinese stocks carry forward their rebound from earlier this week, showcasing a divergence from Hong Kong's market dynamics, where signs of profit-taking are beginning to surface. The anticipation surrounding China's proposed CNY 2 trillion stabilization package for its stock markets has yet to materialize into actionable measures, especially notable as the Lunar New Year holiday draws near. This ongoing uncertainty casts a shadow over the recent gains in commodity currencies, suggesting a potential retraction to their earlier weekly positions unless China substantiates its supportive measures promptly.
The response to New Zealand's employment data has been restrained. The significance of the unemployment rate returning to pre-pandemic levels cannot be understated, as it signals further loosening of the employment market. This development, coupled with the deceleration in private sector wage growth, paints a picture of an economy where labor dynamics are shifting further, albeit not at a pace that could compel RBNZ to pivot to policy loosening yet. As such, New Zealand Dollar's trajectory is likely to be influenced by the broader market sentiment in the short term, until more definitive cues from RBNZ's meeting at the month's end.
On a global scale, Dollar is currently the softer one, digesting its near term gains in consolidation. More Fed officials would offer their views on the economy and monetary policies today. However, the muted market response to Fed communications overnight suggests that up coming speeches may not significantly sway market dynamics. Meanwhile, European currencies are facing some downward pressures, and Japanese Yen shows mixed performance.
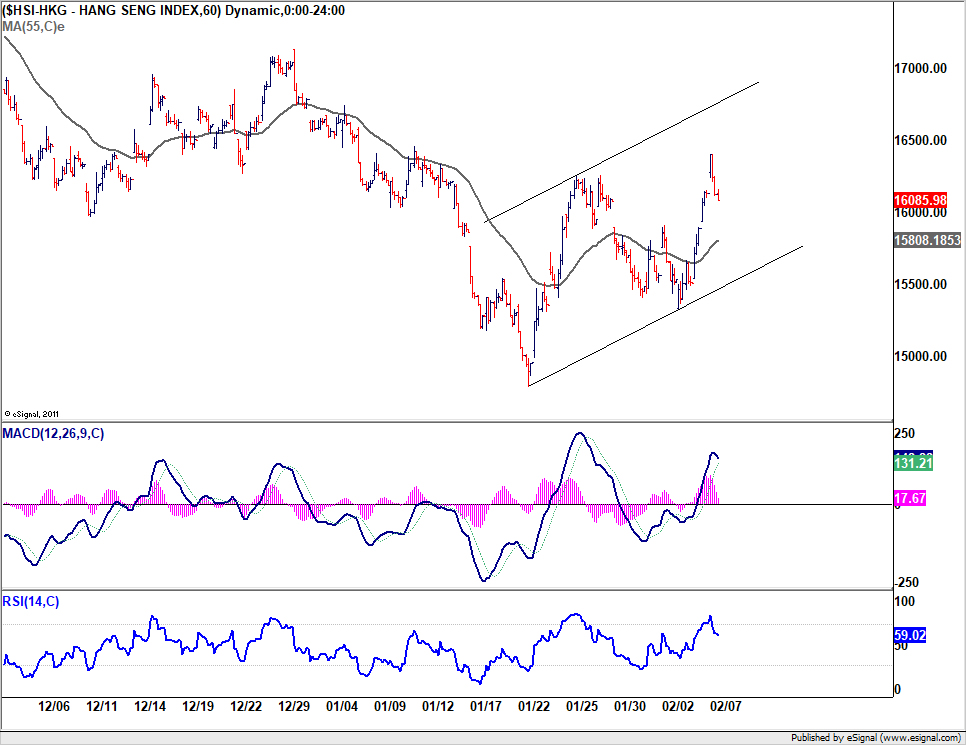
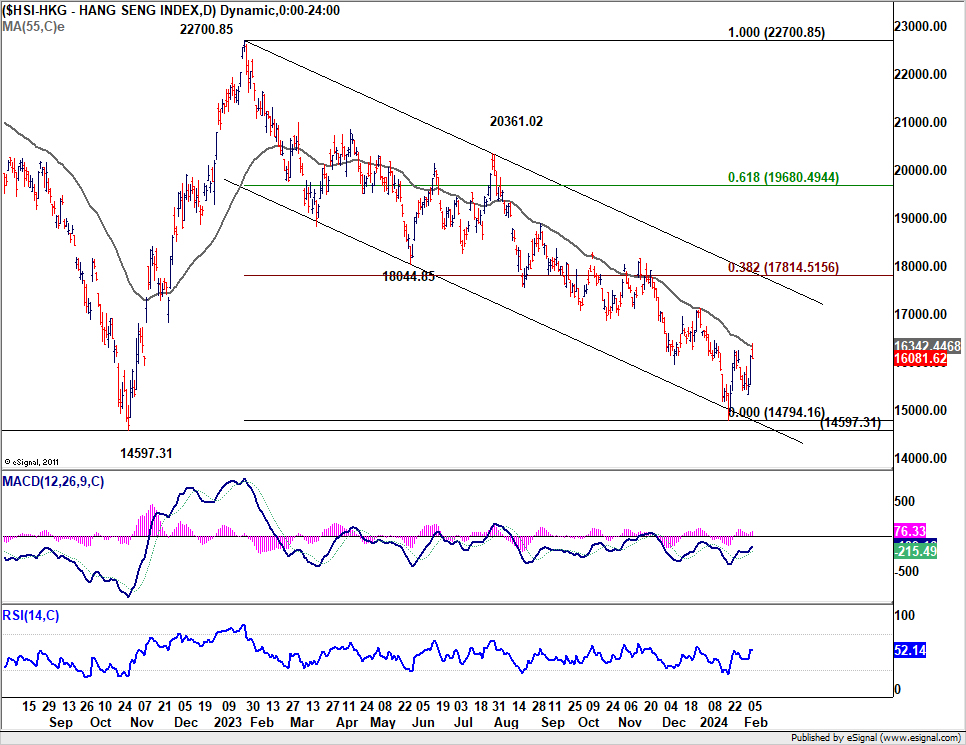
Technically, Hong Kong HSI faced strong rejection by 55 D EMA today after initial attempt to resume its near term rebound from 14794.16. Break of 55 H EMA (now at around 15808) in the next few days will argue that this near term has already completed, and the medium term down trend is ready to resume.
In Asia, at the time of writing, Nikkei is down -0.18%. Hong Kong HSI is down -0.48%. China Shanghai SSE is up 0.64%. Singapore Strait Times is up 0.95%. Japan 10-year JGB yield is down -0.0117 at 0.711. Overnight, DOW rose 0.37%. S&P 500 rose 0.23%. NASDAQ rose 0.07%. 10-year yield fell -0.074 to 4.090.
Fed's Mester warns against premature and rapid interest rate cuts
Cleveland Fed President Loretta Mester underscored the importance of a cautious approach towards adjusting interest rates during an event overnight. Highlighting the necessity of "risk management," Mester articulated concerns over reducing rates "too soon or too quickly," emphasizing the need for concrete evidence that inflation is on a definitive downturn towards Fed's 2% target.
Mester's remarks signal a careful balancing act for the Federal Reserve, which is contemplating when to initiate an easing cycle. "It would be a mistake to move rates down too soon or too quickly without sufficient evidence that inflation was on a sustainable and timely path back to 2%," she stated.
Looking ahead, Mester expressed optimism that the Fed could start to consider easing "later this year," provided that the economy continues to align with current expectations. This shift in policy, however, would likely occur at a gradual pace to ensure the Fed's dual mandate goals of price stability and maximum employment are met without inadvertently reigniting inflationary pressures or unsettling inflation expectations.
"The FOMC's job now is to ensure that the economy reaches an even better place by calibrating monetary policy to achieve our dual mandate goals," Mester emphasized, "Risk management will take center stage."
Fed's Kashkari: Inflation progress made, yet target not fully achieved
Minneapolis Fed President Neel Kashkari acknowledged the strides made towards controlling inflation, yet emphasizing the journey towards 2% inflation target is ongoing.
During an event, Kashkari highlighted, "We're not all the way there yet, but we've made a lot of progress on inflation."
Kashkari pointed to recent inflation data as a sign of encouraging trends, noting that both three- and six-month inflation measures are aligning closely with Fed's target. "The six-month data is basically there and the three-month data is basically there," he observed, indicating that if current patterns persist, Fed is on a track to achieving its inflation objective.
However, Kashkari remains cautiously optimistic, refraining from declaring an outright victory over inflation. "I don't want to say we're necessarily going to just glide past all the way to 2% but fingers crossed, the data is looking positive."
Fed's Harker signals confidence in economic soft landing
Philadelphia Fed President Patrick Harker's speech overnight delivered a dose of cautious optimism regarding US economy's trajectory, suggesting that a "soft landing" could be within reach.
Harker highlighted key indicators supporting his positive outlook: a trend towards disinflation, a labor market moving towards equilibrium, and sustained consumer spending.
These factors, according to Harker, are crucial for achieving the much-discussed soft landing, a scenario where inflation is controlled without causing a recession.
Emphasizing the progress made thus far, Harker also cautioned that the journey is not yet complete, likening the current economic phase to an airplane's final approach but not yet landing.
"Now certainly we haven't touched down, and we're going to have to keep our seatbelts on, but with inflation continuing to fall back to our 2% target, with employment remaining strong, and with consumer sentiment looking up, the runway at our destination is in sight," he elaborated.
BoC's Macklem: Path to 2% inflation slow and risks remain
In a speech, BoC Governor Tiff Macklem underscored the importance of allowing "more time" for monetary policy to take full effect in mitigating inflationary pressures within the Canadian economy. The path to 2% target is "likely to be slow" and "risks remain.
Macklem acknowledged the successes of recent rate hikes in aligning supply with demand, pointing to a discernible decrease in inflation across both goods and services. Shelter inflation, however, continues to pose a significant challenge. He attributed this trend not only to monetary tightening but also to deeper issues in the "structural shortage of housing" that monetary policy alone cannot resolve.
Further complicating the inflation landscape are the volatile oil and transportation costs linked to international conflicts and disruptions. While these factors are beyond the control of BoC, Macklem emphasized the central bank's focus on mitigating any broader inflationary impacts these cost increases might "feed through" to inflation in other goods and services.
Macklem's outlook projects a gradual return to the 2% inflation target, with expectations set for inflation to remain near 3% in the first half of the year, decreasing to about 2.5% by the end of the year, and finally achieving 2% target in 2025.
"Putting this all together, the resulting push and pull on inflation means the path back to 2% inflation is likely to be slow and risks remain," he noted.
NZ employment grows 0.4% in Q4, unemployment rate ticks up to 4%
New Zealand's employment grew 0.4% qoq in Q4, slightly above expectation of 0.3% qoq. Unemployment rate ticked up from 3.9% to 4.0%, below expectation of 4.3%. Labor force participation rate fell from 72.0% to 71.9%.
Labor cost index for salary and wage rates, inclusive of overtime, recorded a 4.3% yoy increase, maintaining the same annual growth rate observed in the preceding three quarters of the year.
The Quarterly Employment Survey revealed a notable 6.9% yoy increase in average ordinary time hourly earnings, with public sector wages leading the charge.
Public sector hourly earnings surged by 7.4% yoy, marking the largest annual increase since March 2006 quarter, up from previous quarter's 5.4%. In contrast, private sector had a slight deceleration to 6.6% yoy, down from 7.1% yoy in previous quarter.
Looking ahead
Germany industrial production, France trade balance; Swiss unemployment rate and foreign currency reserves will be released in European session. Later in the day, US and Canada will release trade balance. BoC will also plublish summary of deliberations of the latest monetary policy meeting.
AUD/USD Daily Report
Daily Pivots: (S1) 0.6492; (P) 0.6509; (R1) 0.6539; More...
AUD/USD is extending consolidations from 0.6468 and intraday bias remains neutral. Stronger recovery cannot be ruled out, but outlook will stay bearish as long as 0.6621 resistance holds. On the downside, break of 0.6468 will resume the fall from 0.6870, as part of the down trend from 0.7156, to 61.8% projection of 0.6870 to 0.6524 from 0.6621 at 0.6407 next.
In the bigger picture, price actions from 0.6169 (2022 low) are seen as a medium term corrective pattern to the down trend from 0.8006 (2021 high). Fall from 0.7156 (2023 high) is seen as the second leg, which might still be in progress. Overall, sideway trading could continue in range of 0.6169/7156 for some more time. But as long as 0.7156 holds, an eventual downside breakout would be mildly in favor.
Economic Indicators Update
| GMT | Ccy | Events | Actual | Forecast | Previous | Revised |
|---|---|---|---|---|---|---|
| 21:45 | NZD | Employment Change Q4 | 0.40% | 0.30% | -0.20% | -0.10% |
| 21:45 | NZD | Unemployment Rate Q4 | 4.00% | 4.30% | 3.90% | |
| 21:45 | NZD | Labour Cost Index Q/Q Q4 | 1.00% | 0.80% | 0.80% | |
| 05:00 | JPY | Leading Economic Index Dec P | 110 | 109.5 | 107.6 | |
| 06:45 | CHF | Unemployment Rate M/M Jan | 2.20% | 2.20% | ||
| 07:00 | EUR | Germany Industrial Production M/M Dec | -0.20% | -0.70% | ||
| 07:45 | EUR | France Trade Balance (EUR) Dec | -6.0B | -5.9B | ||
| 08:00 | CHF | Foreign Currency Reserves (CHF) Jan | 654B | |||
| 09:00 | EUR | Italy Retail Sales M/M Dec | 0.20% | 0.40% | ||
| 13:30 | USD | Trade Balance (USD) Dec | -62.3B | -63.2B | ||
| 13:30 | CAD | Trade Balance (CAD) Dec | 1.1B | 1.6B | ||
| 15:30 | USD | Crude Oil Inventories | 1.7M | 1.2M | ||
| 18:30 | CAD | BoC Summary of Deliberations |
Oil (CL_F) Rally May Fail for More Downside
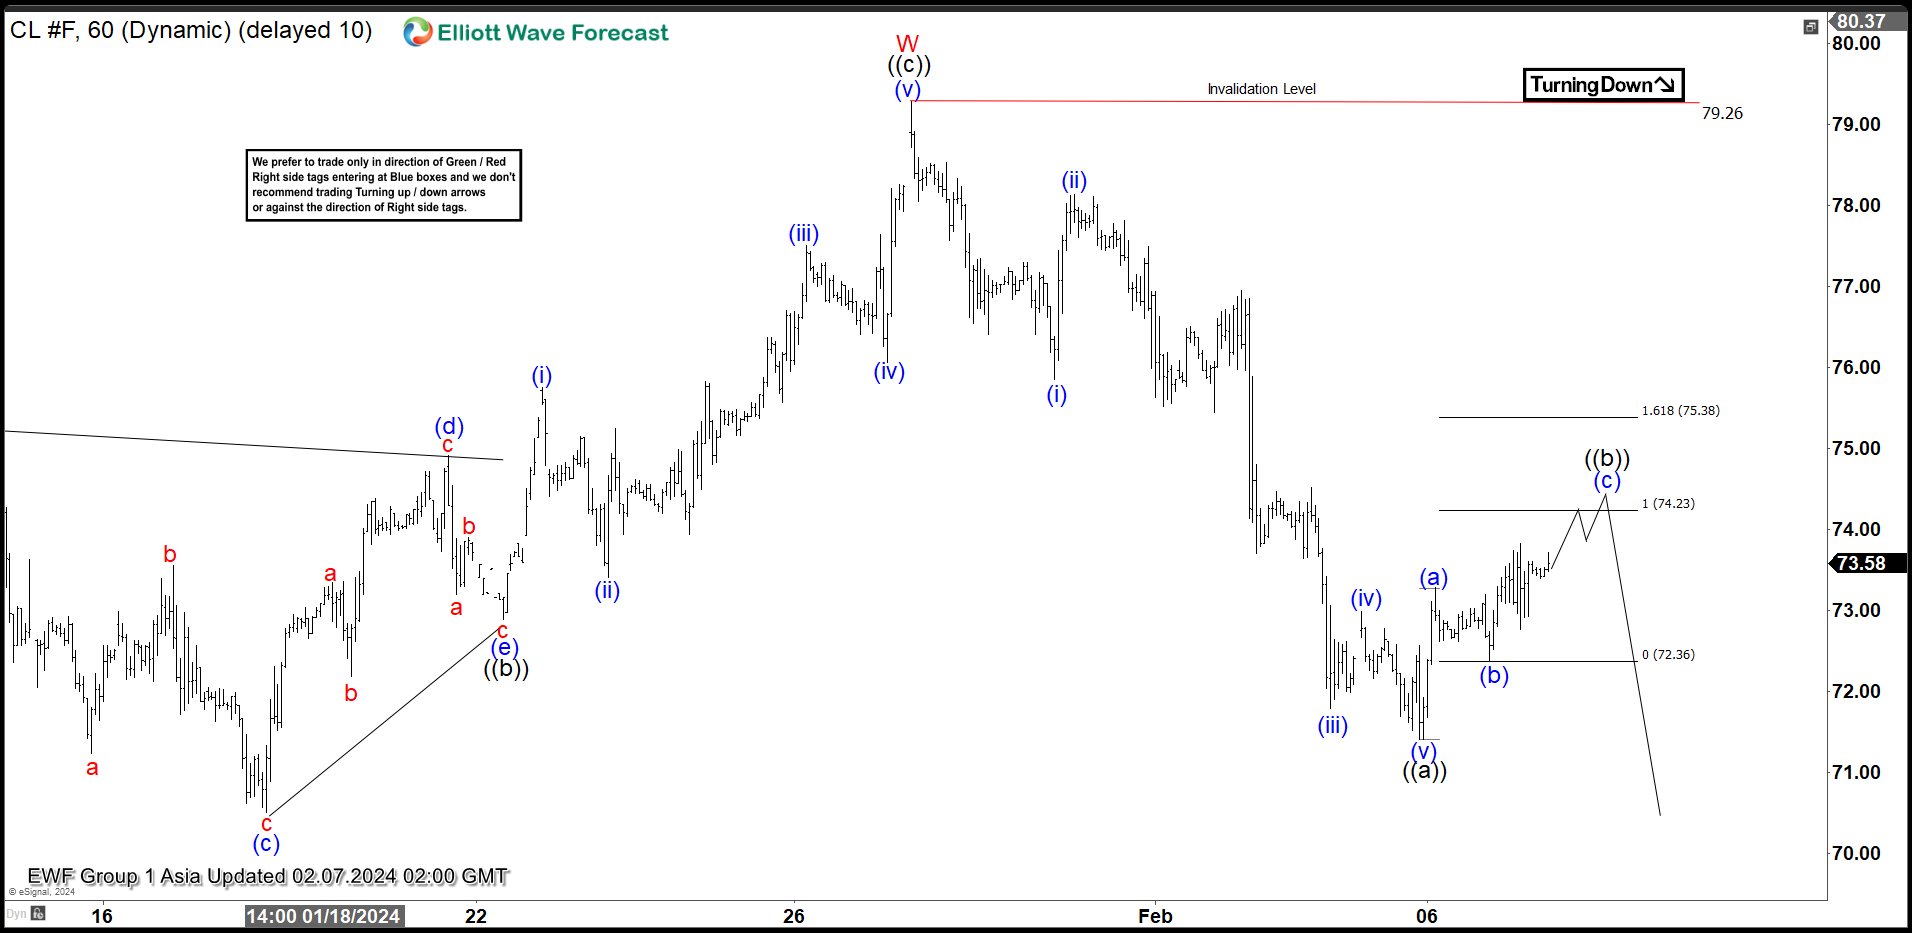
Short Term Elliott Wave view in Oil suggests that rally from 12.13.2023 low is unfolding as a double three Elliott Wave structure. Up from 12.13.2023 low, wave ((a)) ended at 76.18 and dips in wave ((b)) ended at 72.89. Wave ((c)) higher unfolded as a 5 waves where wave (i) ended at 75.75 and wave (ii) ended at 73.41. Rally in wave (iii) ended at 77.51, and pullback in wave (iv) ended at 76.06. Wave (v) higher ended at 79.26 which completed wave ((c)) of W in higher degree.
Pullback in wave X is currently in progress with internal subdivision as a zigzag Elliott Wave structure. Down from wave W, wave (i) ended at 75.85 and rally in wave (ii) ended at 78.14. Oil then extended lower in wave (iii) towards 71.79 and wave (iv) ended at 72.98. Final leg wave (v) ended at 71.41 which completed wave ((a)). Wave ((b)) rally is in progress as a zigzag. Up from wave (a)), wave (a) ended at 73.28 and wave (b) ended at 72.38. Expect wave (c) higher to complete at 74.23 – 75.38 area and this should complete wave ((b)) in higher degree. From this area, expect sellers to appear and Oil to extend lower. Near term, as far as pivot at 79.26 high stays intact, expect rally to fail in 3, 7, or 11 swing for further downside.
Oil 60 Minutes Elliott Wave Chart
Oil (CL_F) Elliott Wave Video
https://www.youtube.com/watch?v=v7SmnArbmmA
Technical Outlook and Reviews
DXY:
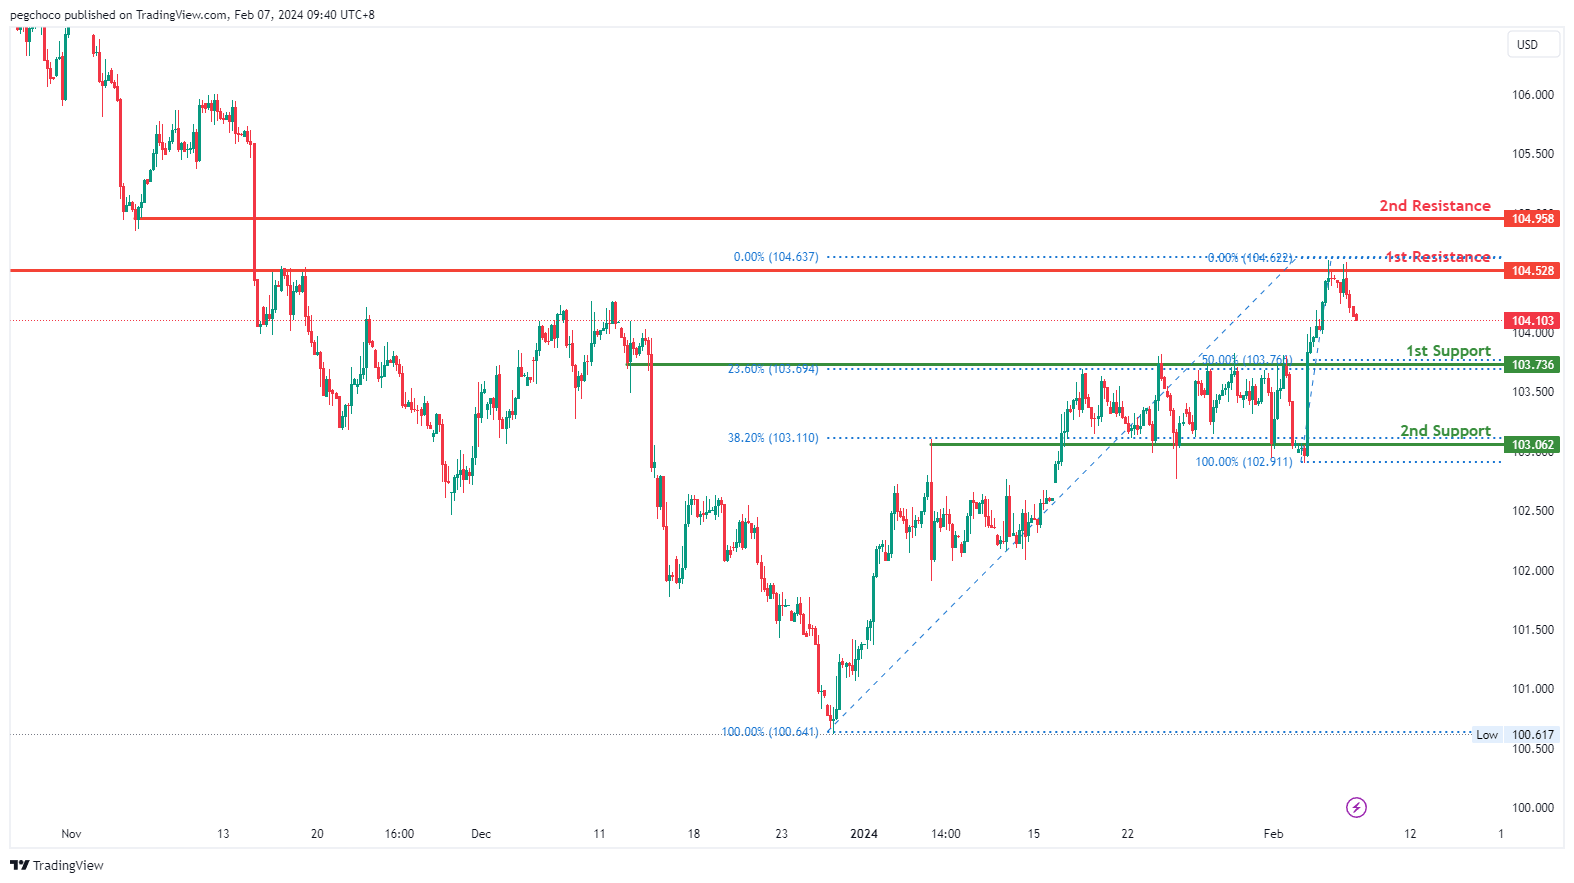
The DXY chart currently exhibits a bearish overall momentum, indicating a downward trend. The price could potentially make a bearish continuation towards the 1st support.
The 1st support level at 103.73 is identified as a pullback support, reinforced by the presence of the 50% and 23.60% Fibonacci Retracement levels, indicating Fibonacci confluence.
There is also a 2nd support level at 103.06, characterized as another pullback support with the 23.60% Fibonacci Retracement, further emphasizing its importance as a potential support zone.
On the resistance side, the 1st resistance level at 104.52 is categorized as an overlap resistance, suggesting historical significance as a point of potential resistance.
Additionally, there is a 2nd resistance level at 104.95, identified as a pullback resistance, indicating a level where selling pressure may emerge.
EUR/USD:
The EUR/USD chart currently shows a bearish overall momentum, indicating a downward trend. The price could potentially experience a rise towards the 1st resistance in the short term before reversing off it and dropping towards the 1st support.
The 1st support level at 1.0725 is identified as an overlap support, coinciding with the 61.80% Fibonacci Retracement level, which suggests it has historical significance and may act as a strong support level.
There is also a 2nd support level at 1.0665, characterized as another overlap support, further reinforcing its importance as a potential support zone.
On the resistance side, the 1st resistance level at 1.0794 is categorized as an overlap resistance, with the presence of the 38.20% Fibonacci Retracement, indicating its historical significance as a potential resistance point.
Additionally, there is a 2nd resistance level at 1.0832, identified as a pullback resistance, coinciding with the 61.80% Fibonacci Retracement, which could act as a barrier for further upside movement.

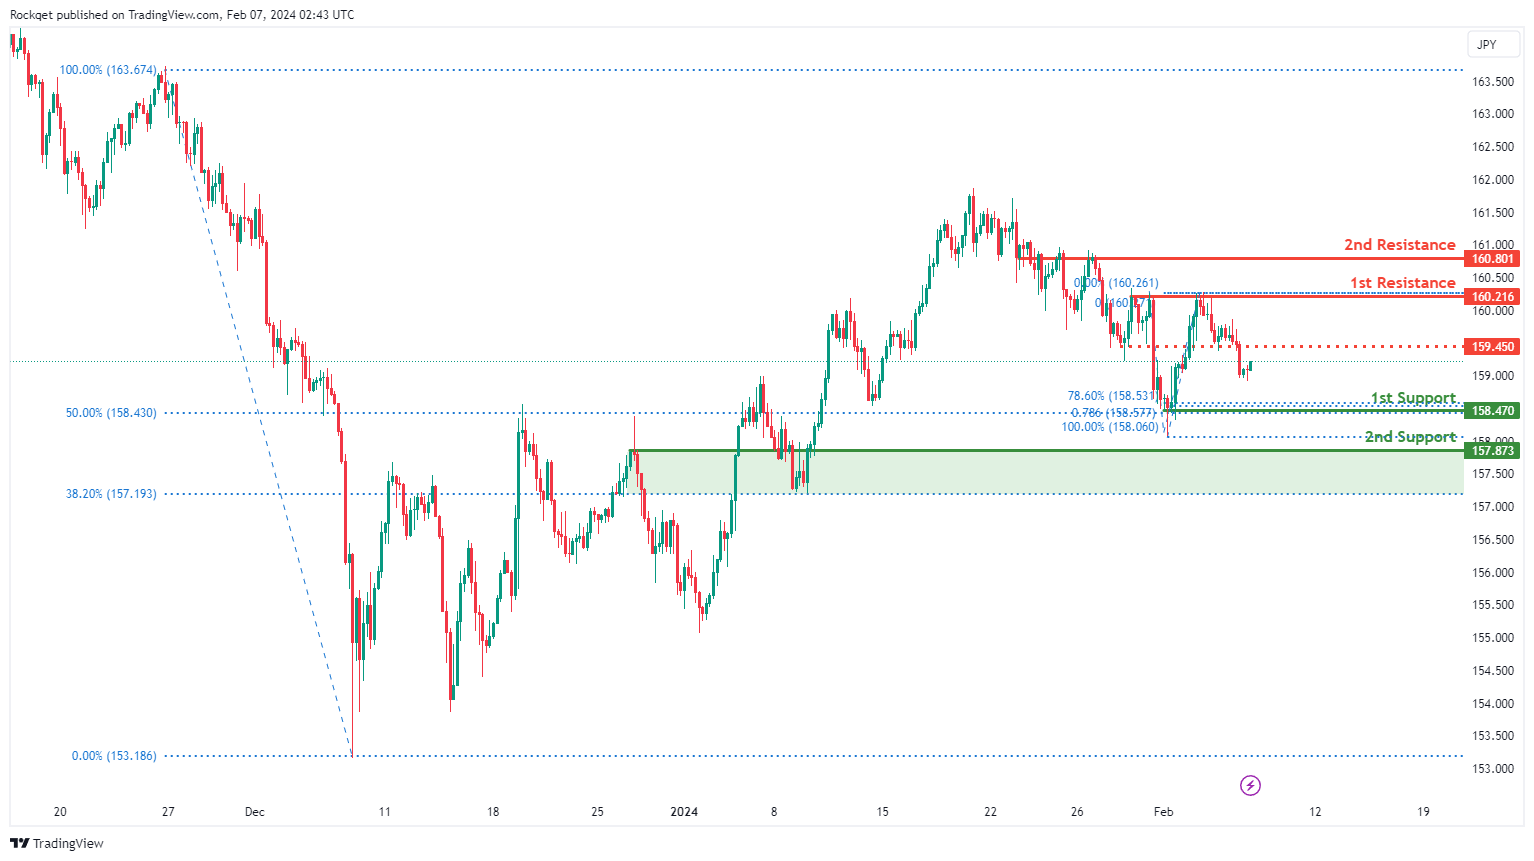
EUR/JPY:
The EUR/JPY chart currently exhibits a bearish overall momentum, indicating a downward trend. Several factors contribute to this bearish sentiment, suggesting the potential for a short-term rise towards the 1st resistance before reversing downwards towards the 1st support.
The 1st support at 158.470 is considered significant for multiple reasons. It aligns with a swing low support, coinciding with the 78.60% and 50% Fibonacci Retracement and the 78.60% Fibonacci Projection, indicating a historical level where buying interest has previously emerged.
The 2nd support at 157.873 is also recognized as an overlap support and aligns with the 38.20% Fibonacci Retracement, providing additional strength to the potential support zone.
On the resistance side, the 1st resistance at 160.216 is highlighted as a level where selling pressure may emerge, representing a pullback resistance.
The 2nd resistance at 160.801 is also recognized, coinciding with an overlap resistance, further reinforcing this resistance level. An intermediate resistance level at 159.45 is identified, aligning with a pullback resistance.
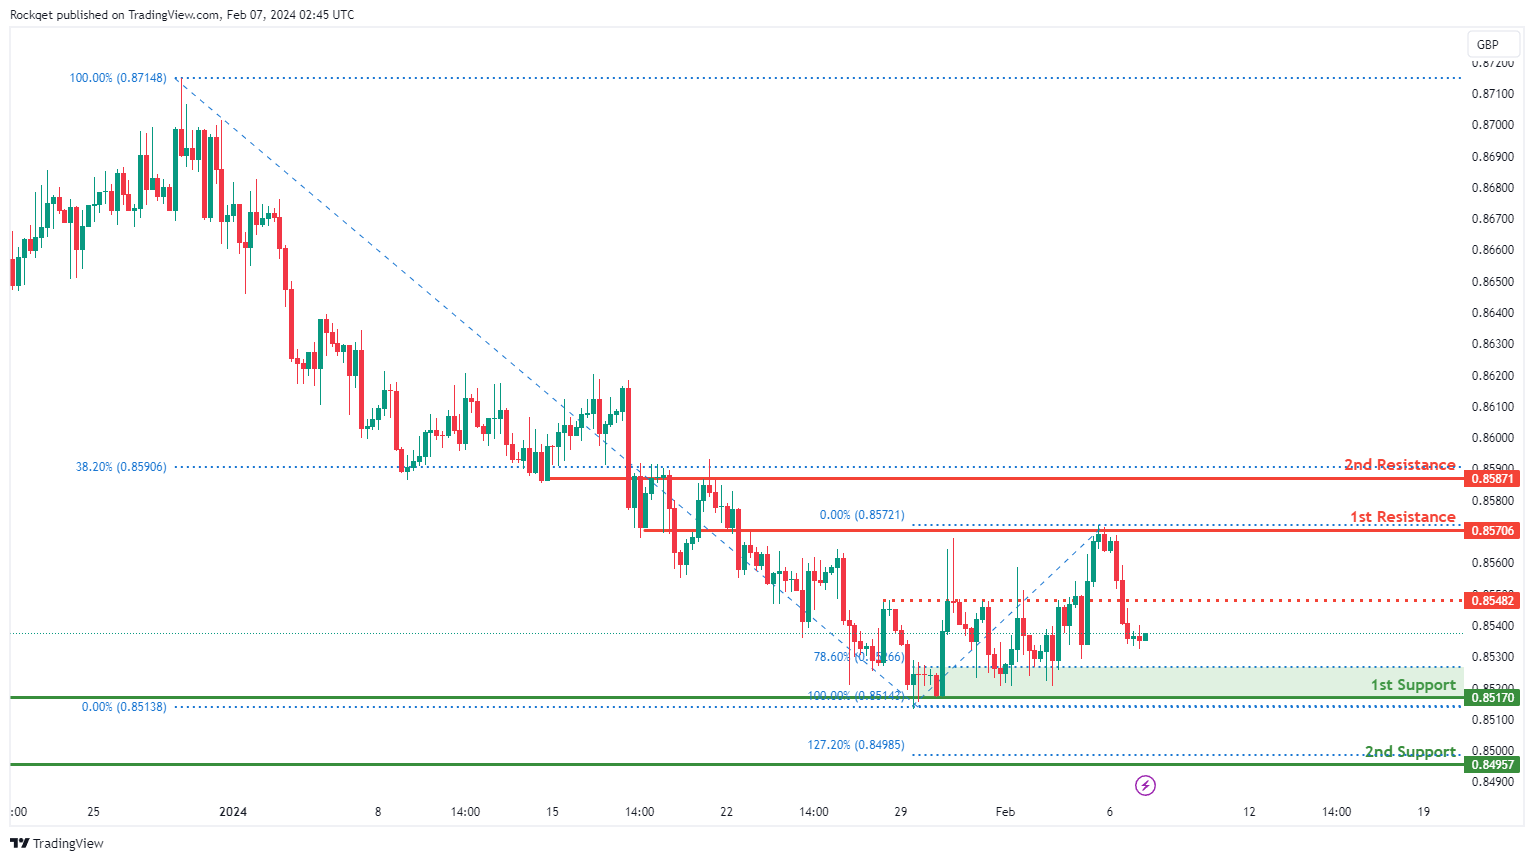
EUR/GBP:
The EUR/GBP chart currently demonstrates a bearish overall momentum, suggesting a downward trend. There are several factors contributing to this sentiment, indicating the potential for a bearish continuation towards the 1st support.
The 1st support at 0.85170 is considered significant for several reasons. Firstly, it is identified as a multi-swing low support, indicating a level where buying interest has historically emerged. Additionally, this support level aligns with the 78.60% Fibonacci Retracement, adding further strength to its significance.
The 2nd support at 0.84957 is recognized as an overlap support and coincides with the 127.20% Fibonacci Extension, providing additional validation to the support zone.
On the resistance side, the 1st resistance at 0.85706 is highlighted as a level where selling pressure may emerge, representing an overlap resistance.
The 2nd resistance at 0.85871 is also recognized, coinciding with both an overlap resistance and the 38.20% Fibonacci Retracement, further reinforcing its significance. An intermediate resistance level at 0.85482 is identified, aligning with an overlap resistance.
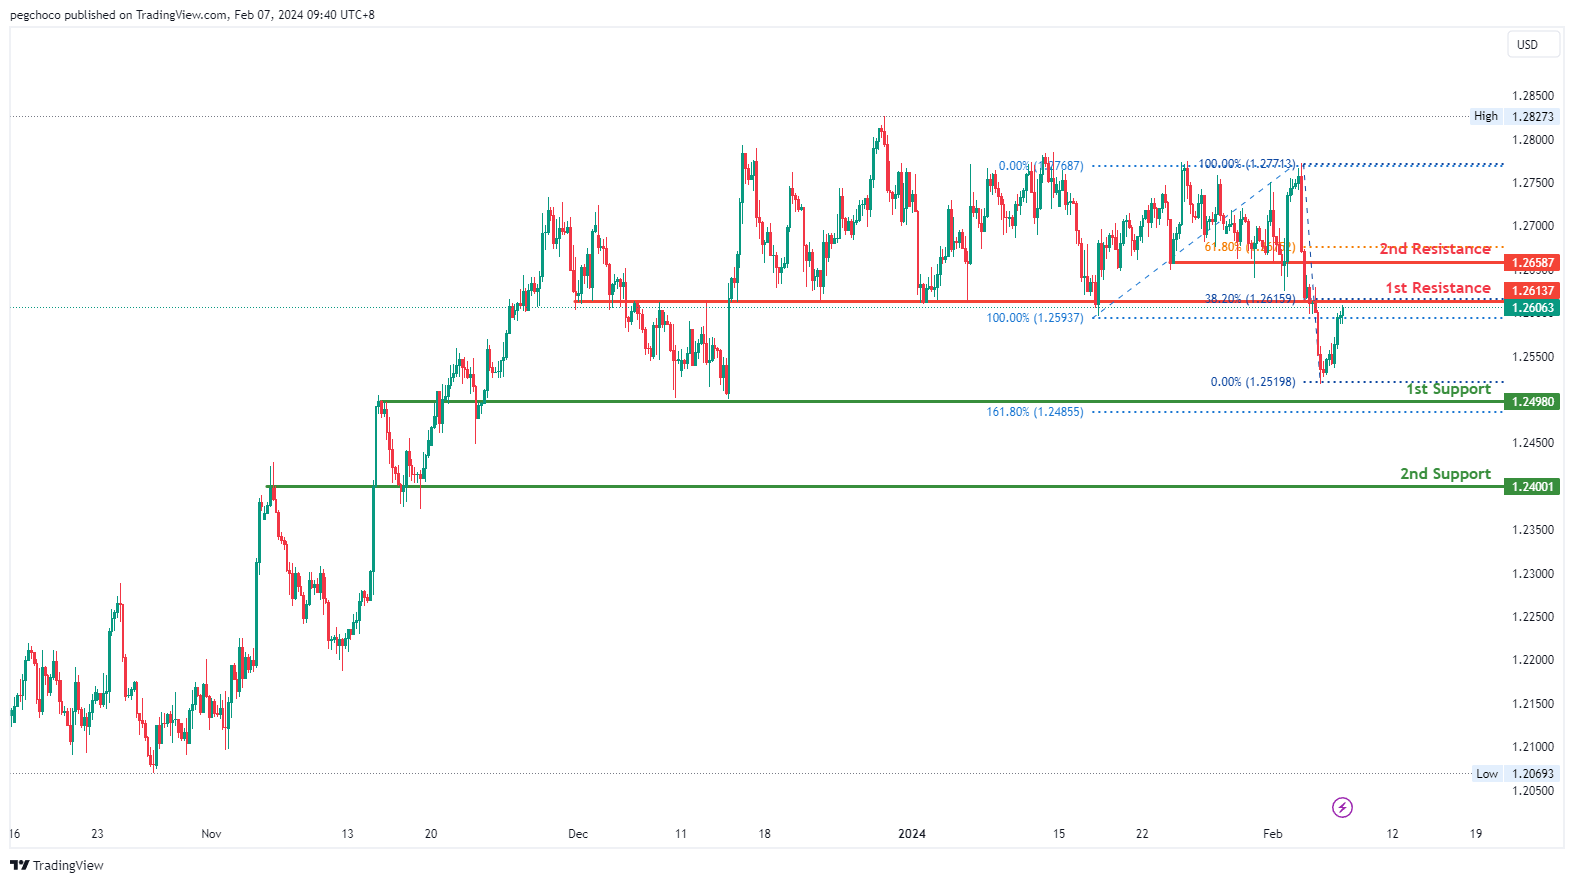
GBP/USD:
The GBP/USD chart currently indicates a bearish overall momentum, suggesting a downward trend. The price could potentially experience a bearish reaction off the 1st resistance and drop to the 1st support.
The 1st support level at 1.2498 is identified as an overlap support, coinciding with the 161.80% Fibonacci Extension, indicating its historical significance as a potential strong support level.
Additionally, there is a 2nd support level at 1.2400, characterized as another overlap support, further reinforcing its importance as a potential support zone.
On the resistance side, the 1st resistance level at 1.2613 is categorized as a pullback resistance, with the presence of the 38.20% Fibonacci Retracement, indicating its historical significance as a potential point of resistance.
Furthermore, there is a 2nd resistance level at 1.2658, identified as a pullback resistance, coinciding with the 61.80% Fibonacci Retracement, which could act as a barrier for further upside movement.
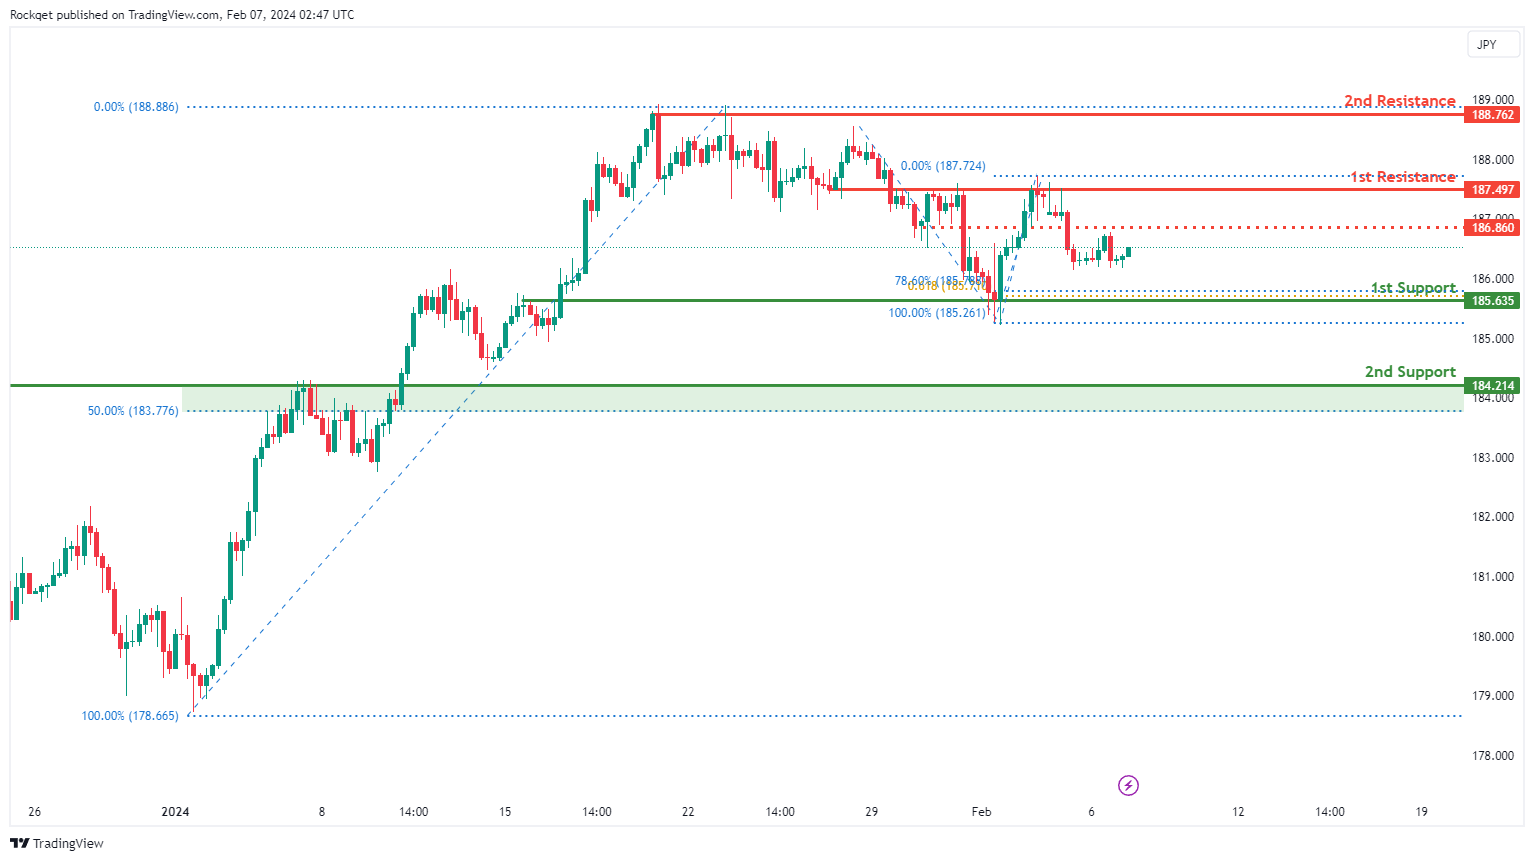
GBP/JPY:
The GBP/JPY chart currently shows a neutral momentum, indicating a lack of clear directional bias. There is a possibility for price to fluctuate between the 1st resistance and 1st support levels.
The 1st support at 185.635 holds significance due to several factors. Firstly, it is identified as an overlap support, indicating a historical level where buying interest has emerged. Additionally, it coincides with the 78.60% Fibonacci Retracement and the 61.80% Fibonacci Projection, adding further confluence to this support level.
The 2nd support at 184.214 is recognized as an overlap support and aligns with the 50% Fibonacci Retracement, reinforcing its significance as a potential support zone.
On the resistance side, the 1st resistance at 187.497 is highlighted as a level where selling pressure may emerge, representing an overlap resistance.
The 2nd resistance at 188.762 is also recognized, coinciding with a swing high resistance level. An intermediate resistance level at 186.86 is identified, aligning with an overlap resistance.
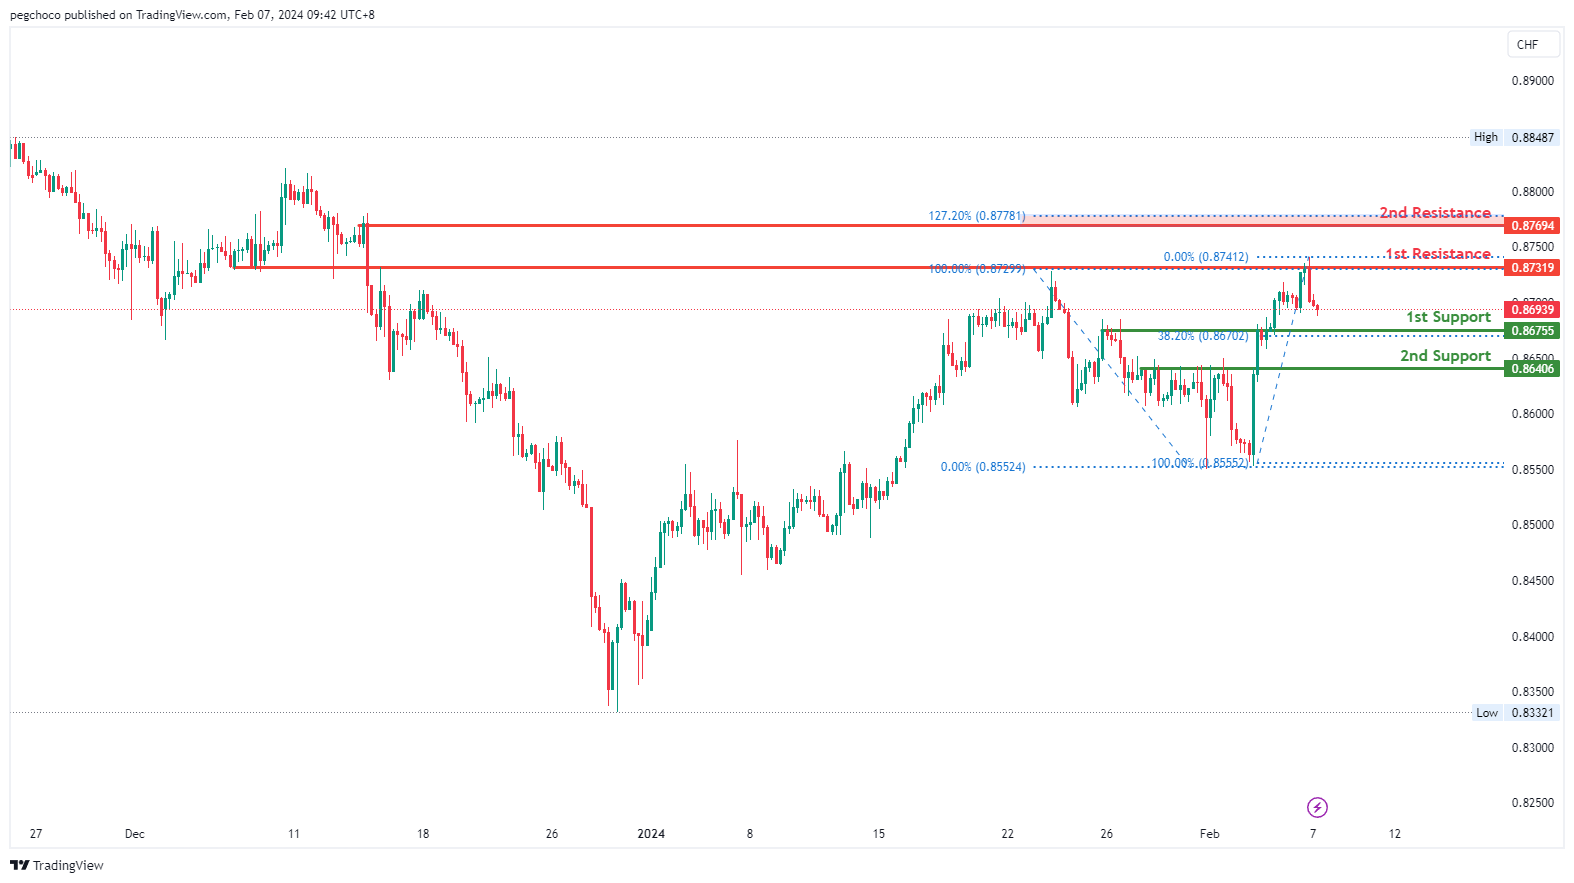
USD/CHF:
The USD/CHF chart currently indicates a bullish overall momentum, suggesting an upward trend. The price could potentially experience a bullish bounce off the 1st support and head towards the 1st resistance.
The 1st support level at 0.8675 is identified as a pullback support, coinciding with the 23.60% Fibonacci Retracement, indicating its historical significance as a potential strong support level.
Additionally, there is a 2nd support level at 0.8640, characterized as another pullback support, further reinforcing its importance as a potential support zone.
On the resistance side, the 1st resistance level at 0.8731 is categorized as an overlap resistance, suggesting historical significance as a point where the price has encountered resistance.
Furthermore, there is a 2nd resistance level at 0.8769, identified as a swing high resistance, coinciding with the 127.20% Fibonacci Extension, which could act as a barrier for further upside movement.
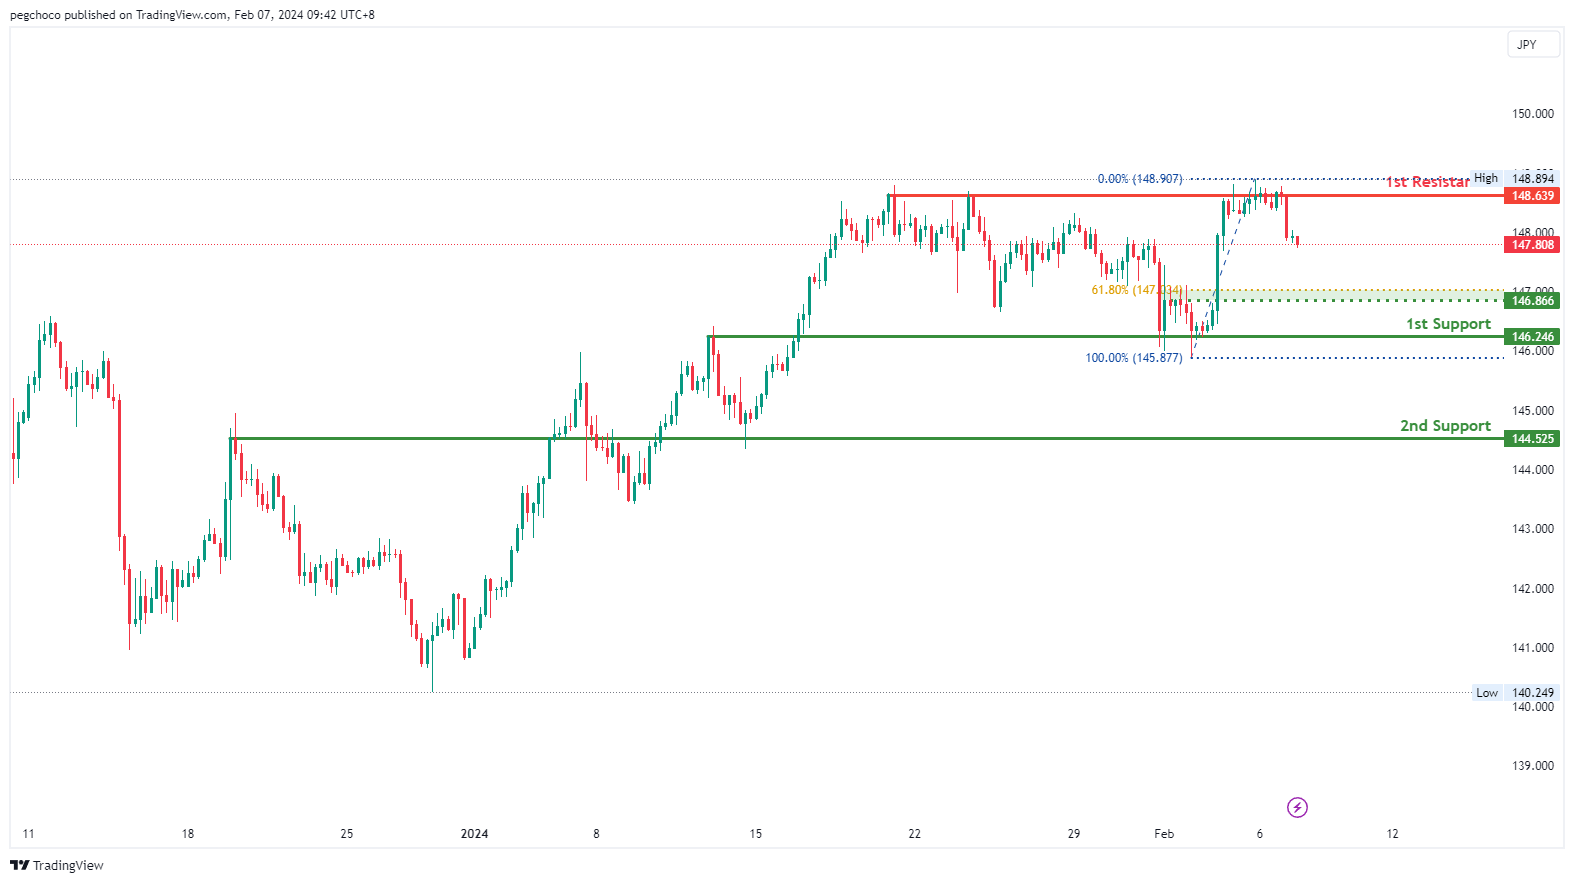
USD/JPY:
The USD/JPY chart currently reflects a bearish overall momentum, indicating a downward trend. The price could potentially continue its bearish movement towards the 1st support level.
The 1st support level at 146.24 is identified as an overlap support, suggesting historical significance as a potential strong support level.
Additionally, there is a 2nd support level at 144.52, characterized as another overlap support, further emphasizing its importance as a potential support zone.
On the resistance side, the 1st resistance level at 148.63 is categorized as a multi-swing high resistance, indicating that it represents a historical point where the price has encountered resistance.
Moreover, the intermediate support at 146.85 is considered a pullback support, coinciding with the 61.80% Fibonacci Retracement, which further reinforces its significance as a potential support level.
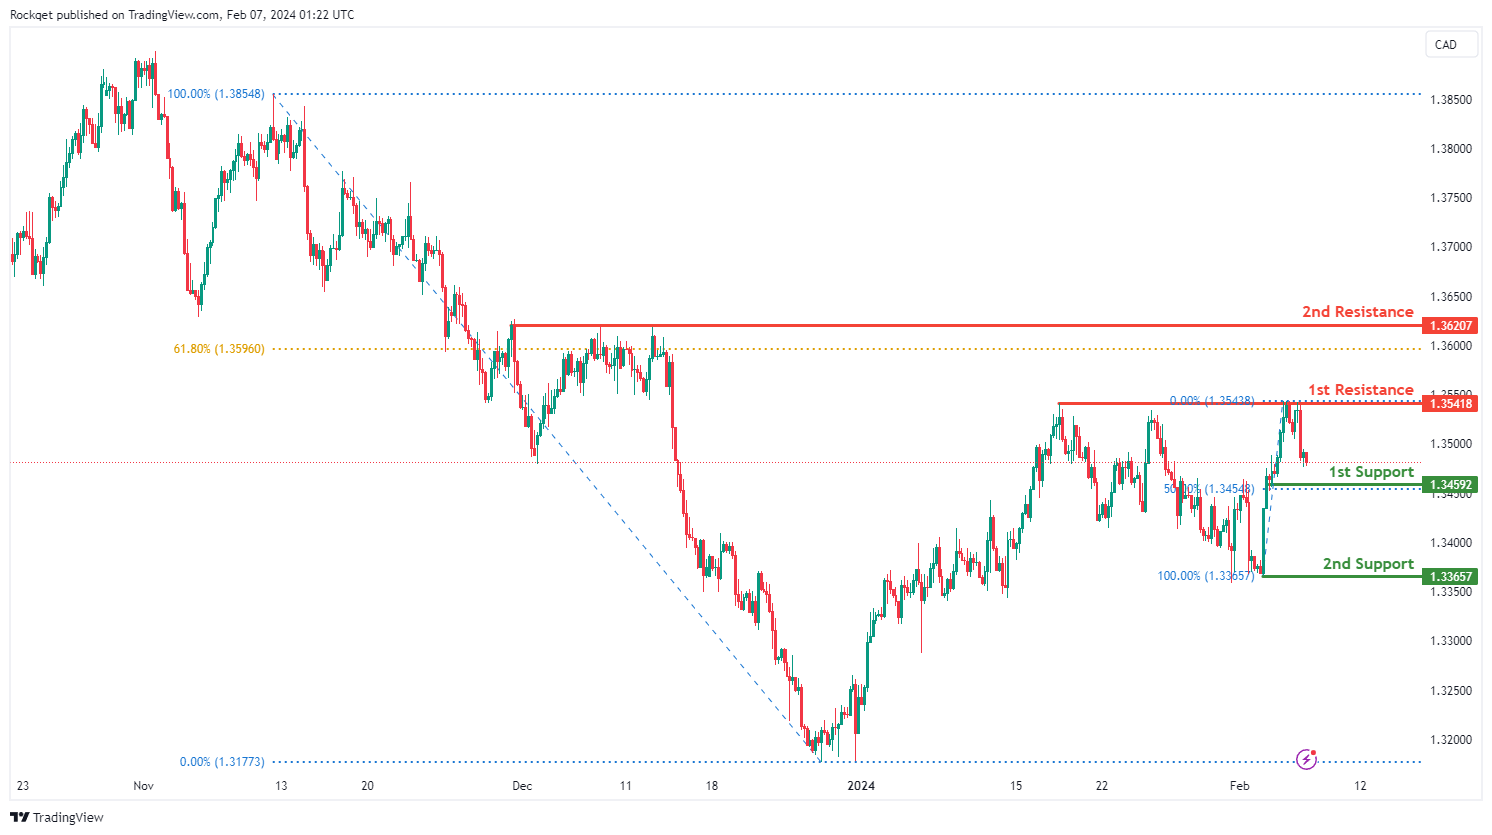
USD/CAD:
The USD/CAD chart currently exhibits an overall bearish momentum. In this context, there is a potential scenario for price to fall towards the 1st support.
The 1st support level at 1.3459 is identified as a pullback support that aligns with the 50.00% Fibonacci Retracement level. Further below, the 2nd support level at 1.3365 is marked as a swing-low support, further emphasizing its importance as a potential support zone.
To the upside, the 1st resistance level at 1.3541 is identified as a pullback resistance. Higher up, the 2nd resistance level at 1.3620 is also noted as a pullback resistance that aligns close to the 61.80% Fibonacci Retracement level, further highlighting its importance as a potential resistance point.
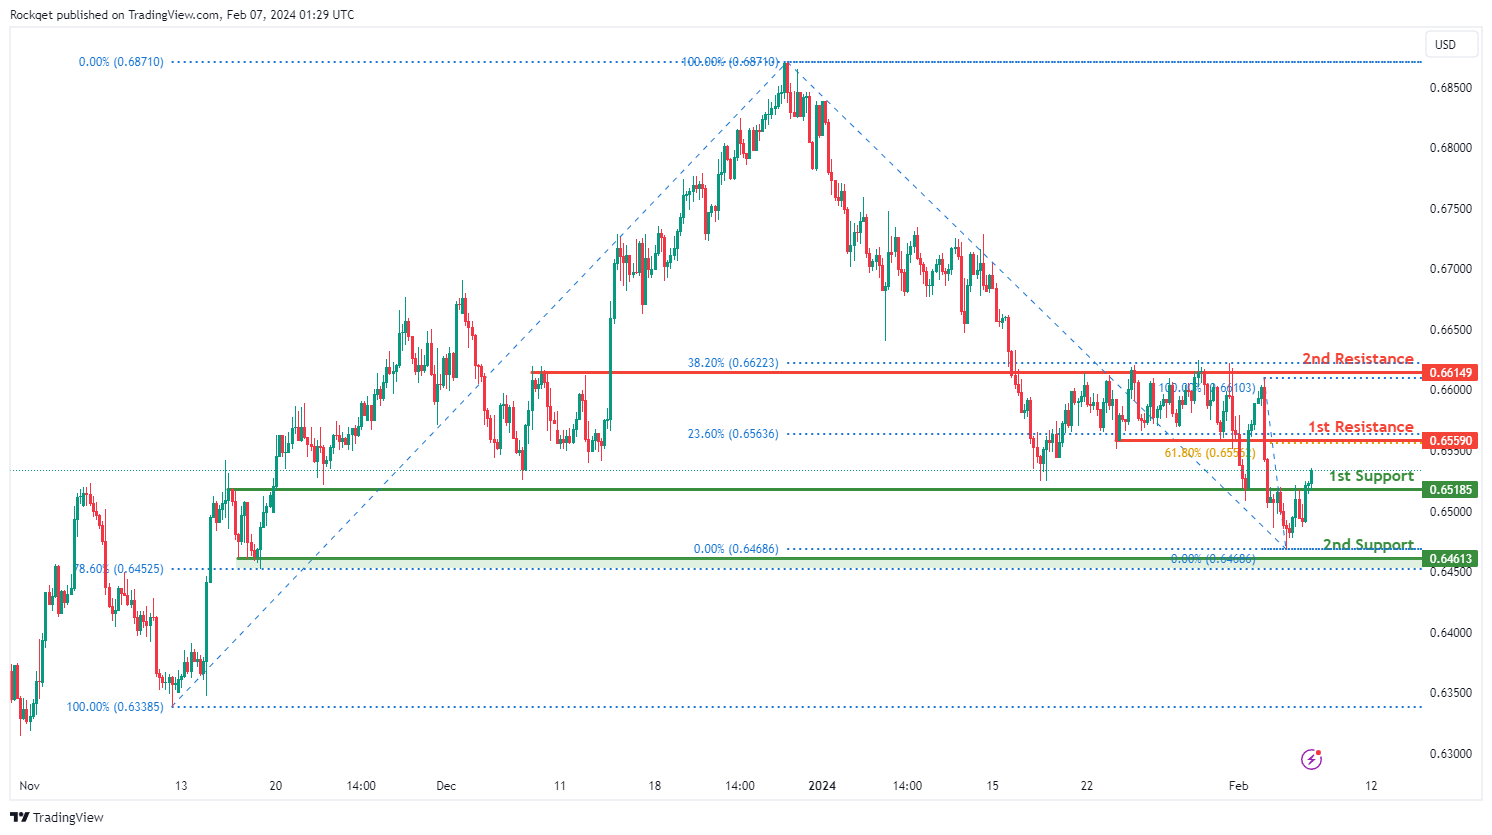
AUD/USD:
The AUD/USD chart currently exhibits an overall bullish momentum. In this context, there is a potential scenario for price to rise towards the 1st resistance.
The 1st resistance level at 0.6559 is identified as a pullback resistance that aligns with a confluence of Fibonacci levels i.e. the 23.60% and the 61.80% Retracement levels. Higher up, the 2nd resistance level at 0.6614 is also marked as a pullback resistance that aligns close to the 38.20% Fibonacci Retracement level, further highlighting its importance as a potential resistance point.
To the downside, the 1st support level at 0.6518 is identified as an overlap support. Further below, the 2nd support level at 0.6461 is noted as a pullback support that aligns close to the 78.60% Fibonacci Retracement level, further emphasizing its importance as a potential support zone.
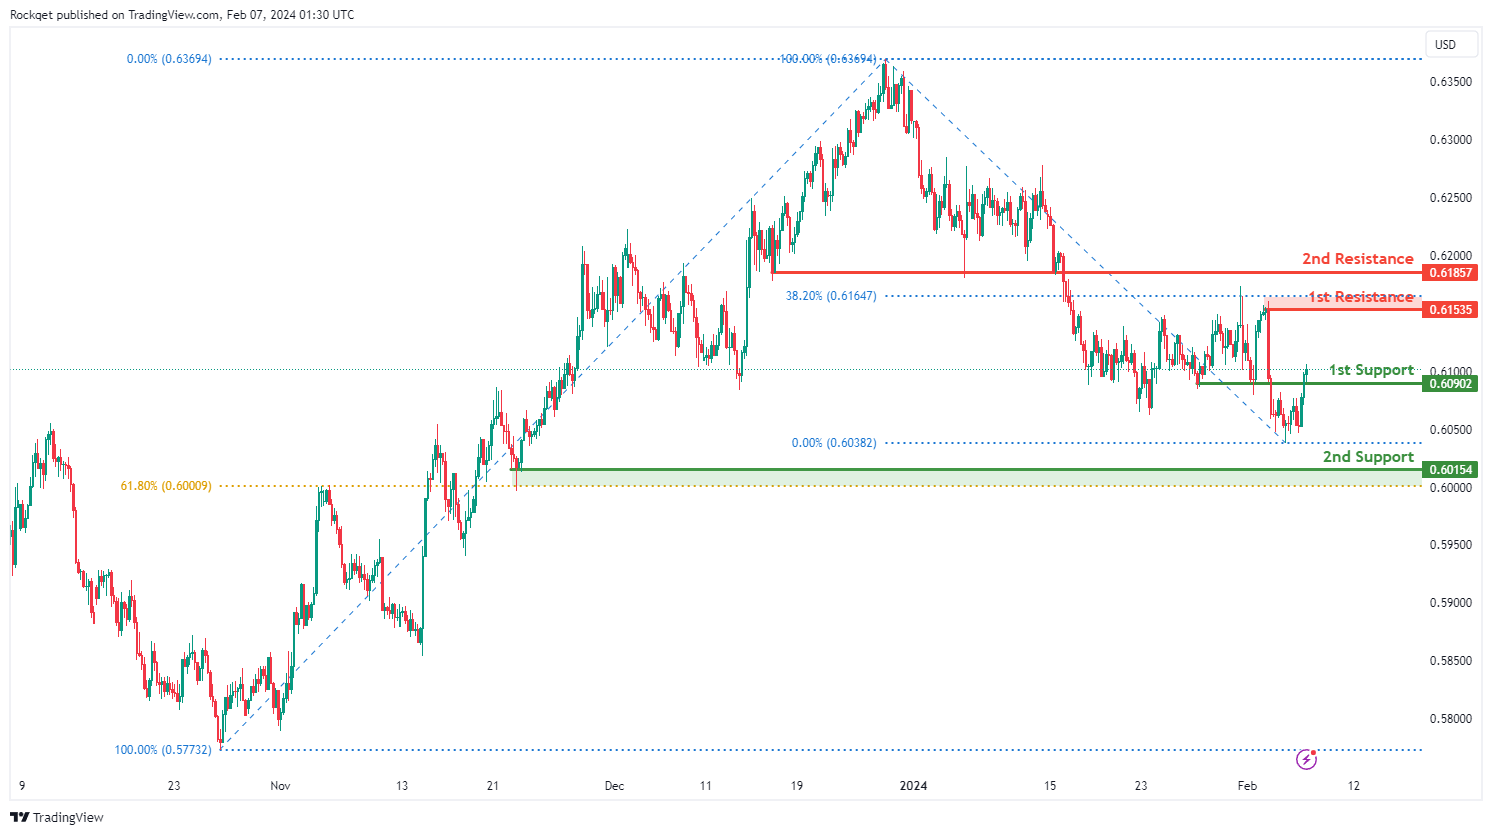
NZD/USD
The NZD/USD chart currently exhibits an overall bullish momentum. In this context, there is a potential scenario for price to rise towards the 1st resistance.
The 1st resistance level at 0.6153 is identified as a pullback resistance that aligns close to the 38.20% Fibonacci Retracement level. Higher up, the 2nd resistance level at 0.6185 is also marked as a pullback resistance, further highlighting its importance as a potential resistance point.
To the downside, the 1st support level at 0.6090 is identified as a pullback support. Further below, the 2nd support level at 0.6015 is also noted as a pullback support that aligns close to the 61.80% Fibonacci Retracement level, further emphasizing its importance as a potential support zone.
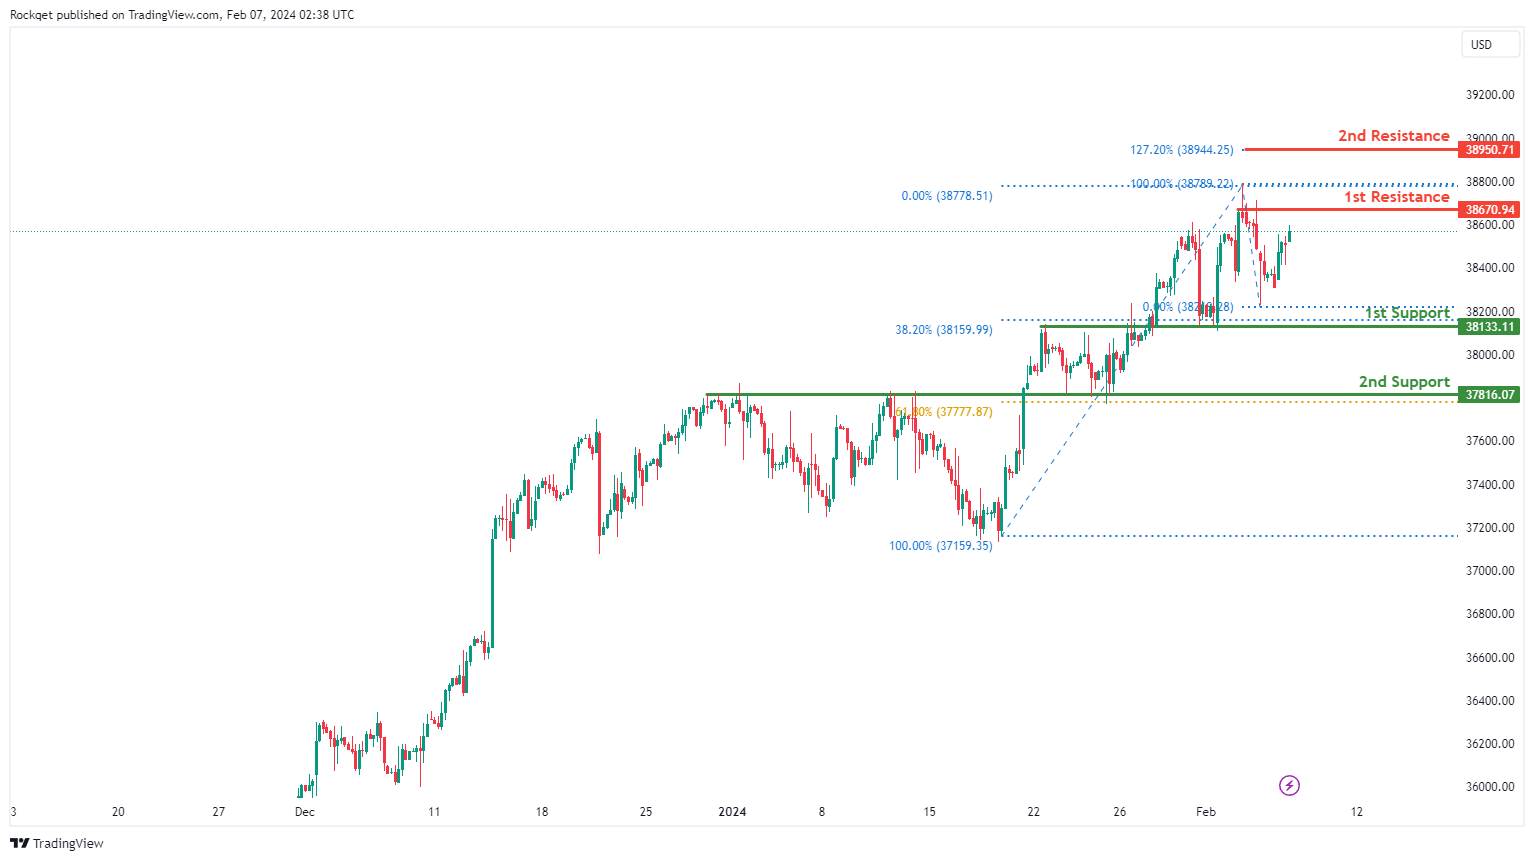
DJ30:
The DJ30 chart currently exhibits a bullish momentum, indicating a prevailing upward trend. There is a potential for a bullish continuation towards the 1st resistance level.
The 1st support at 38133.11 is deemed significant for several reasons. Firstly, it aligns with an overlap support and coincides with the 38.20% Fibonacci Retracement level, suggesting a historical area where buying interest has emerged.
Additionally, the 2nd support at 37816.07 is identified as an overlap support and aligns with the 61.80% Fibonacci Retracement, providing further reinforcement to this potential support zone.
On the resistance side, the 1st resistance at 38670.94 is highlighted as a level where selling pressure may emerge, representing a swing high resistance.
The 2nd resistance at 38950.71 is also recognized, coinciding with the 127.20% Fibonacci Extension.
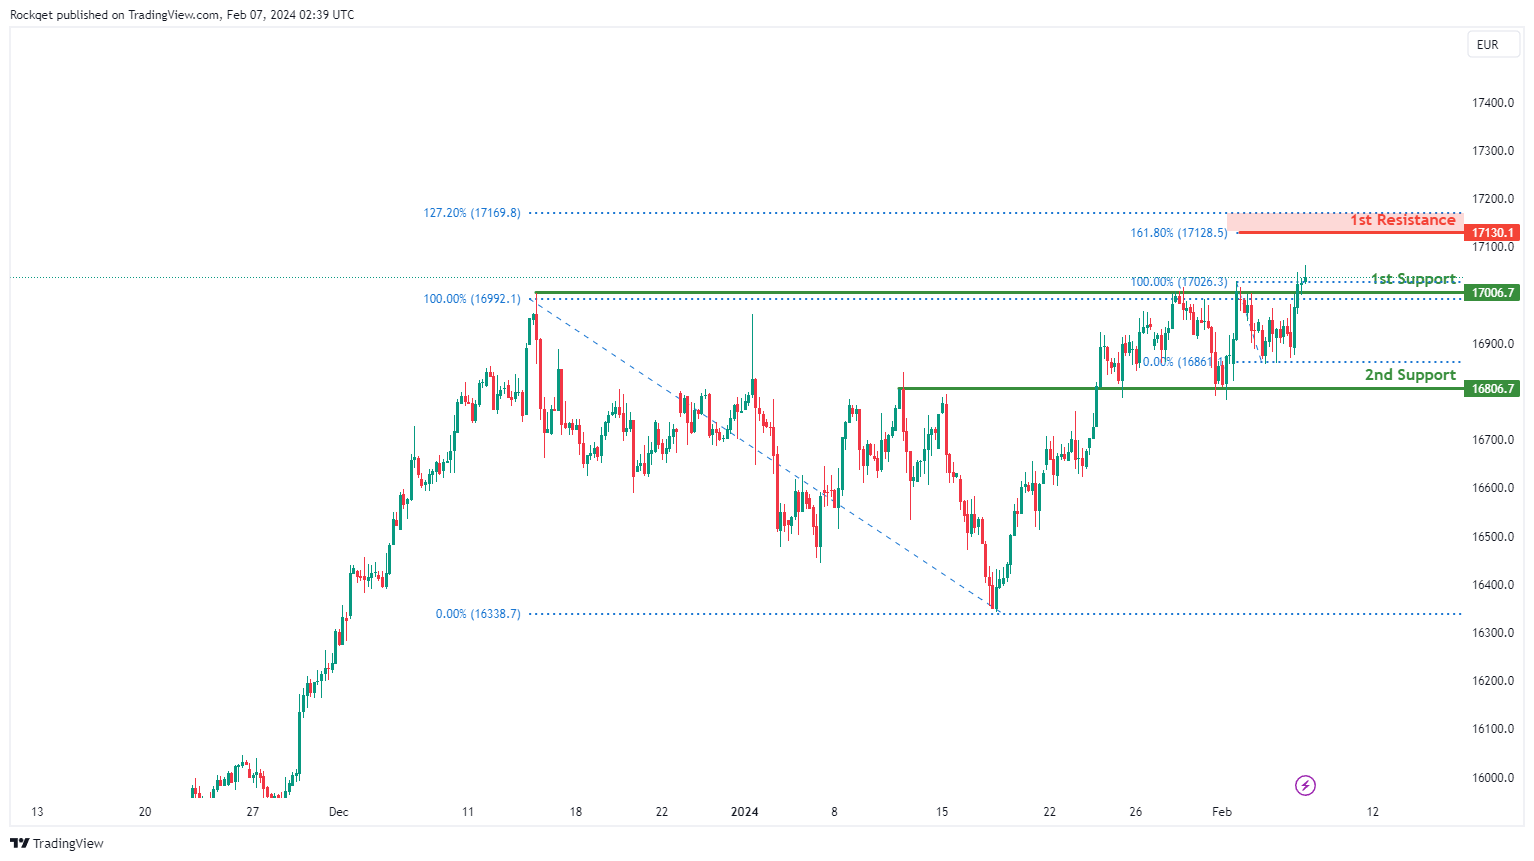
GER40:
The GER40 chart currently shows bullish momentum, indicating a prevailing upward trend. Several factors contribute to this bullish sentiment, supporting the potential for continued upward movement in the price.
The 1st support at 17006.7 is considered significant as it represents a pullback support level. Additionally, the 2nd support at 16806.7 is identified as an overlap support, further reinforcing its significance in potentially maintaining the bullish momentum.
On the resistance side, the 1st resistance at 17130.1 is highlighted, aligning with the 127.20% Fibonacci Extension and the 161.80% Fibonacci Extension. These levels suggest potential barriers to the bullish momentum, where selling pressure may emerge.
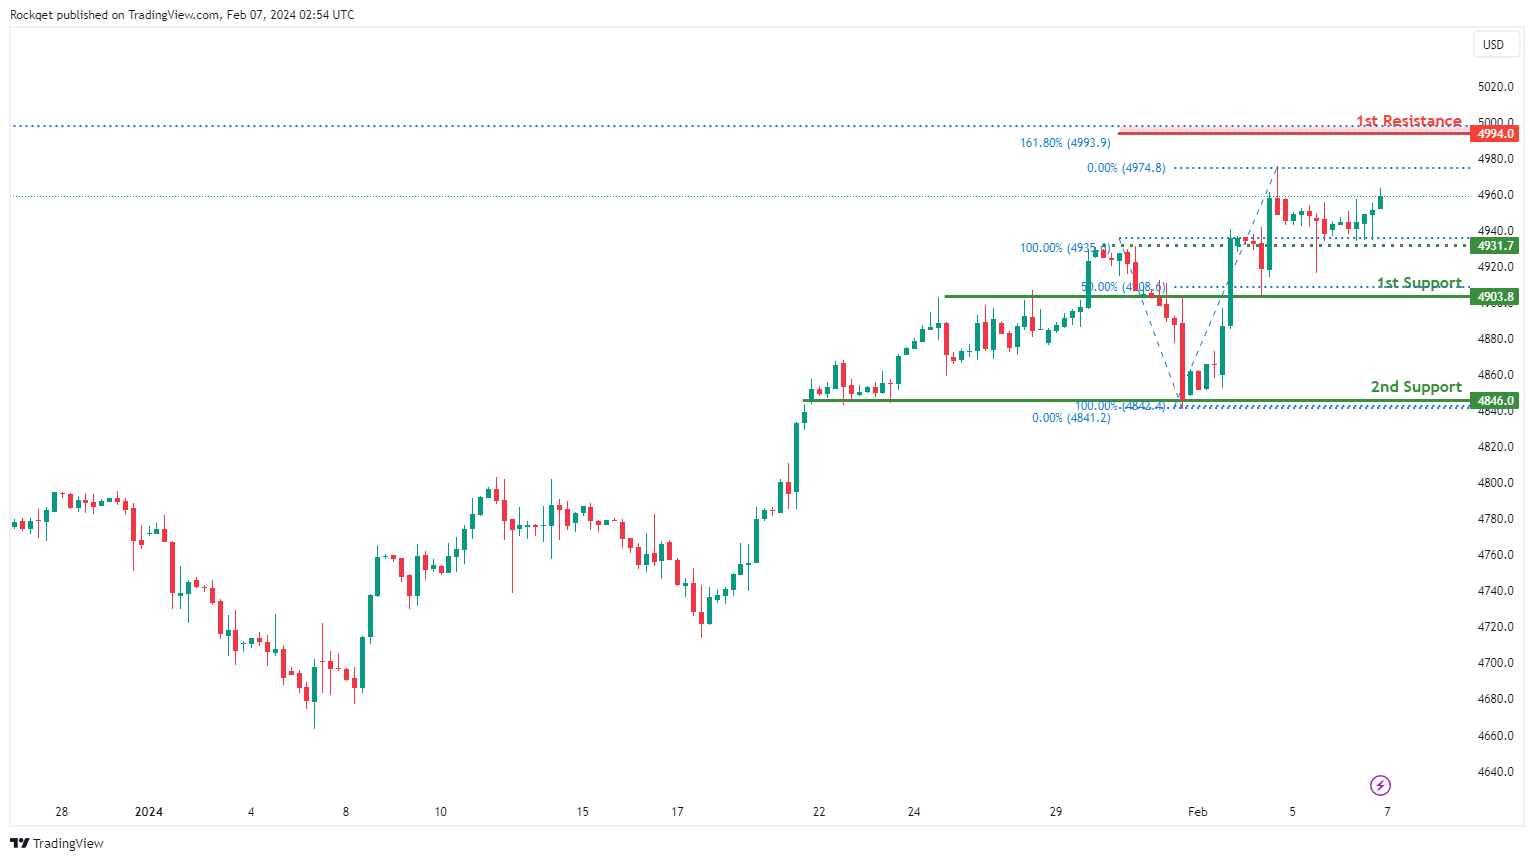
US500:
The US500 chart currently exhibits a bullish overall momentum, indicating a prevailing upward trend. Several factors contribute to this bullish sentiment, supporting the potential for continued upward movement in the price.
The 1st support at 4903.8 is considered significant as it aligns with an overlap support and the 50% Fibonacci Retracement level. This convergence suggests a historical level where buying interest has previously emerged, adding strength to the support zone.
Additionally, the 2nd support at 4846.0 is identified as another overlap support, further reinforcing the potential support level.
An intermediate support level at 4931.7 is also recognized, aligning with an overlap support. This level provides additional reinforcement to the potential support zone.
On the resistance side, the 1st resistance at 4994.0 is highlighted, coinciding with the 161.80% Fibonacci Extension. This level suggests a potential barrier to the bullish momentum, where selling pressure may emerge.
BTC/USD:
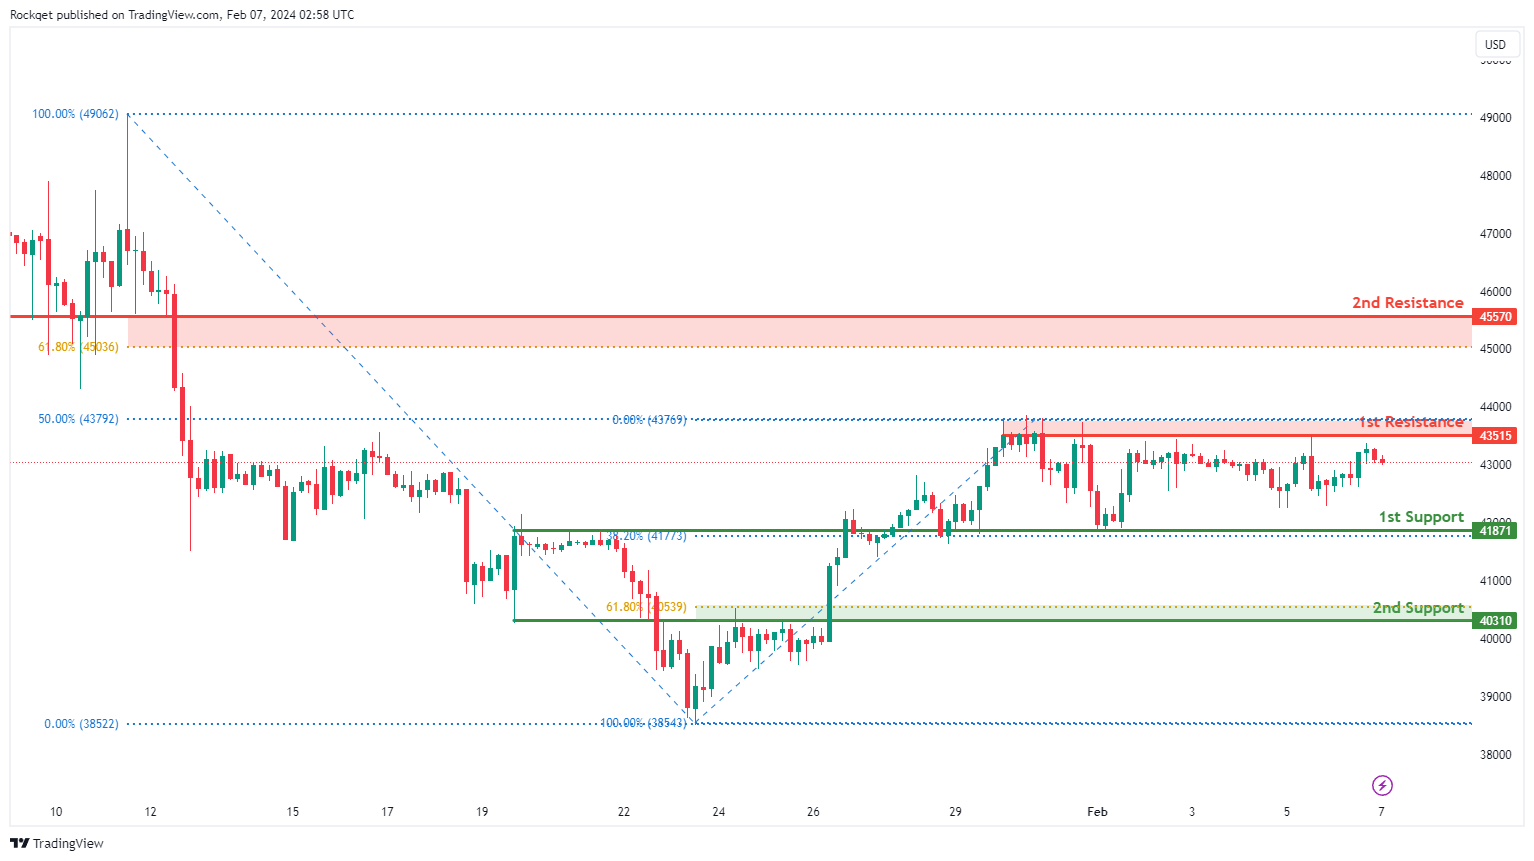
The BTC/USD chart currently indicates a neutral overall momentum, suggesting a lack of clear trend direction. This neutral sentiment implies that the price may fluctuate within a certain range without a strong bias towards either bullish or bearish movement.
The 1st support level at 41871 is identified as significant due to its alignment with an overlap support and the 38.20% Fibonacci Retracement level. This convergence suggests a historical level where buying interest has emerged, potentially providing a strong foundation for the price.
Additionally, the 2nd support at 40310 is recognized as another overlap support, further reinforcing the potential support zone.
On the resistance side, the 1st resistance level at 43515 is highlighted, coinciding with a pullback resistance and the 50% Fibonacci Retracement level. This suggests a level where selling pressure may emerge, potentially limiting further upward movement in the price.
Furthermore, the 2nd resistance at 45570 is identified as an overlap resistance and aligns with the 61.80% Fibonacci Retracement level, adding further significance to this resistance level.
ETH/USD:
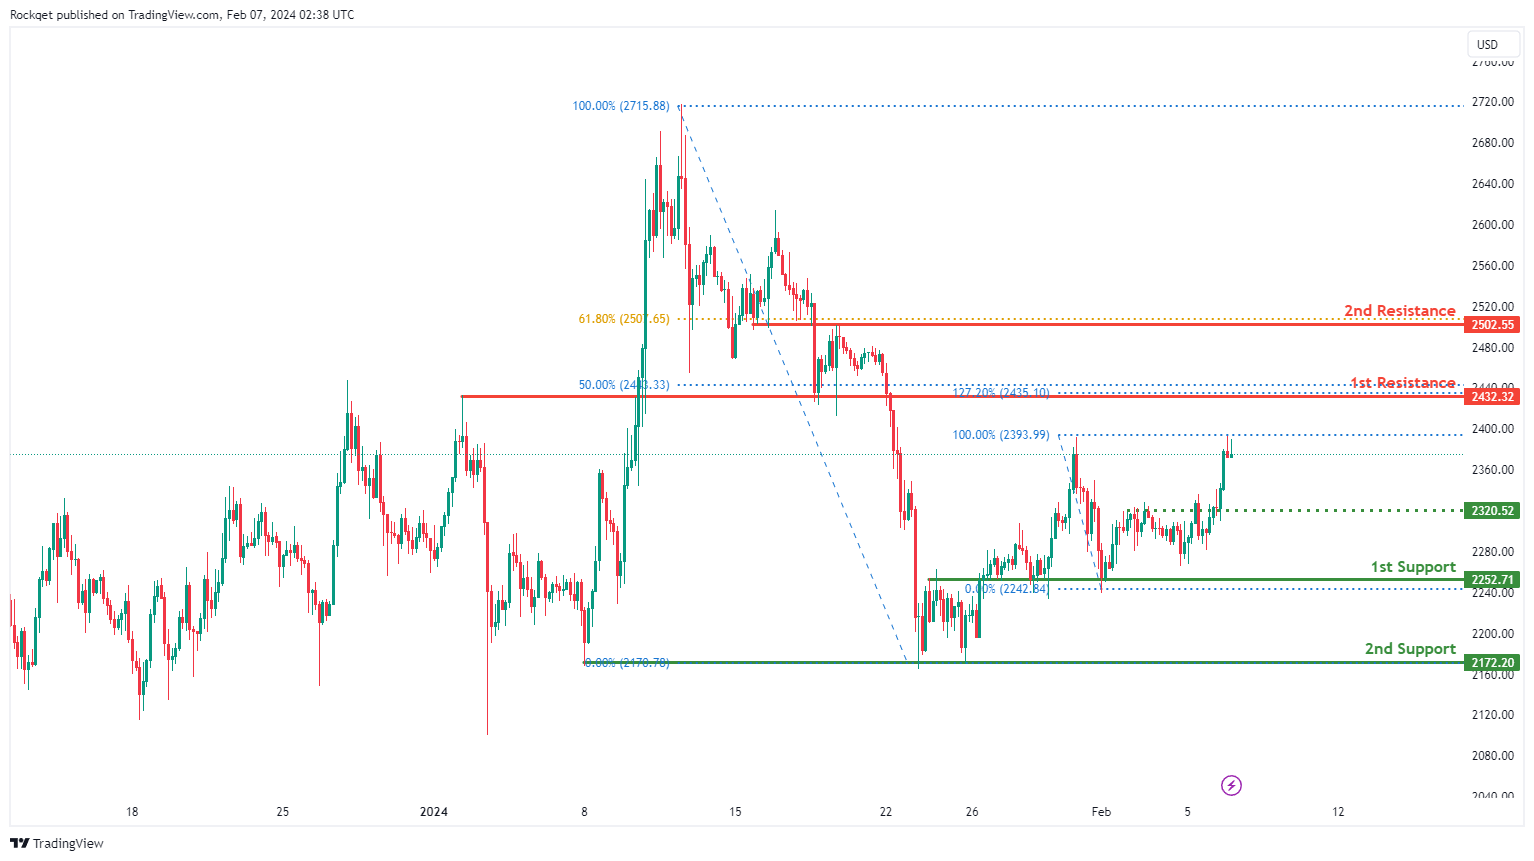
The ETH/USD chart currently demonstrates a bullish overall momentum, indicating a prevailing upward trend. This suggests that buyers have been dominating the market sentiment, potentially leading to further upward movement in the price.
The 1st support level at 2252.71 is considered significant as it aligns with an overlap support, indicating a historical level where buying interest has emerged.
Additionally, the 2nd support at 2172.20 is identified as a pullback support, further reinforcing the potential support zone.
On the resistance side, the 1st resistance level at 2432.32 is highlighted. This level coincides with an overlap resistance, the 50% Fibonacci Retracement, and the 127.20% Fibonacci Extension, suggesting a potential barrier to the bullish momentum.
Furthermore, the 2nd resistance at 2502.55 is identified as an overlap resistance and aligns with the 61.80% Fibonacci Retracement, adding further significance to this resistance level. An intermediate support level at 2320.52 is also recognized, aligning with an overlap support.
WTI/USD:
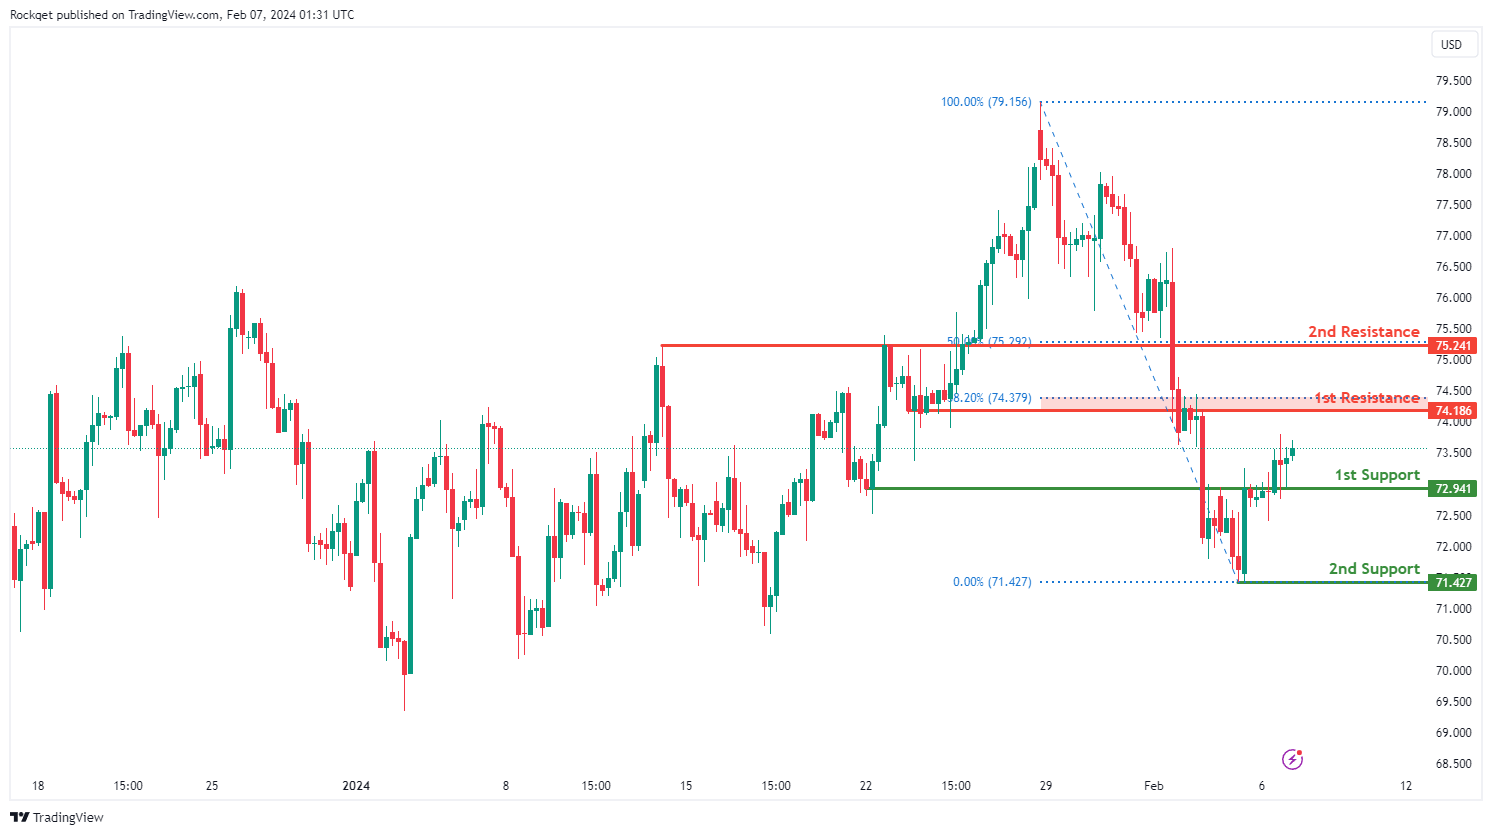
The WTI (West Texas Intermediate) chart currently exhibits an overall bullish momentum. In this context, there is a potential scenario for price to rise towards the 1st resistance.
The 1st resistance level at 74.18 is identified as an overlap resistance that aligns close to the 38.20% Fibonacci Retracement level. Higher up, the 2nd resistance level at 75.24 is marked as a pullback resistance that aligns with the 50.00% Fibonacci Retracement level, further highlighting its importance as a potential resistance zone.
To the downside, the 1st support level at 72.94 is identified as an overlap support. Further below, the 2nd support level at 71.42 is identified as a pullback support, reinforcing its significance as a key support level.
XAU/USD (GOLD):
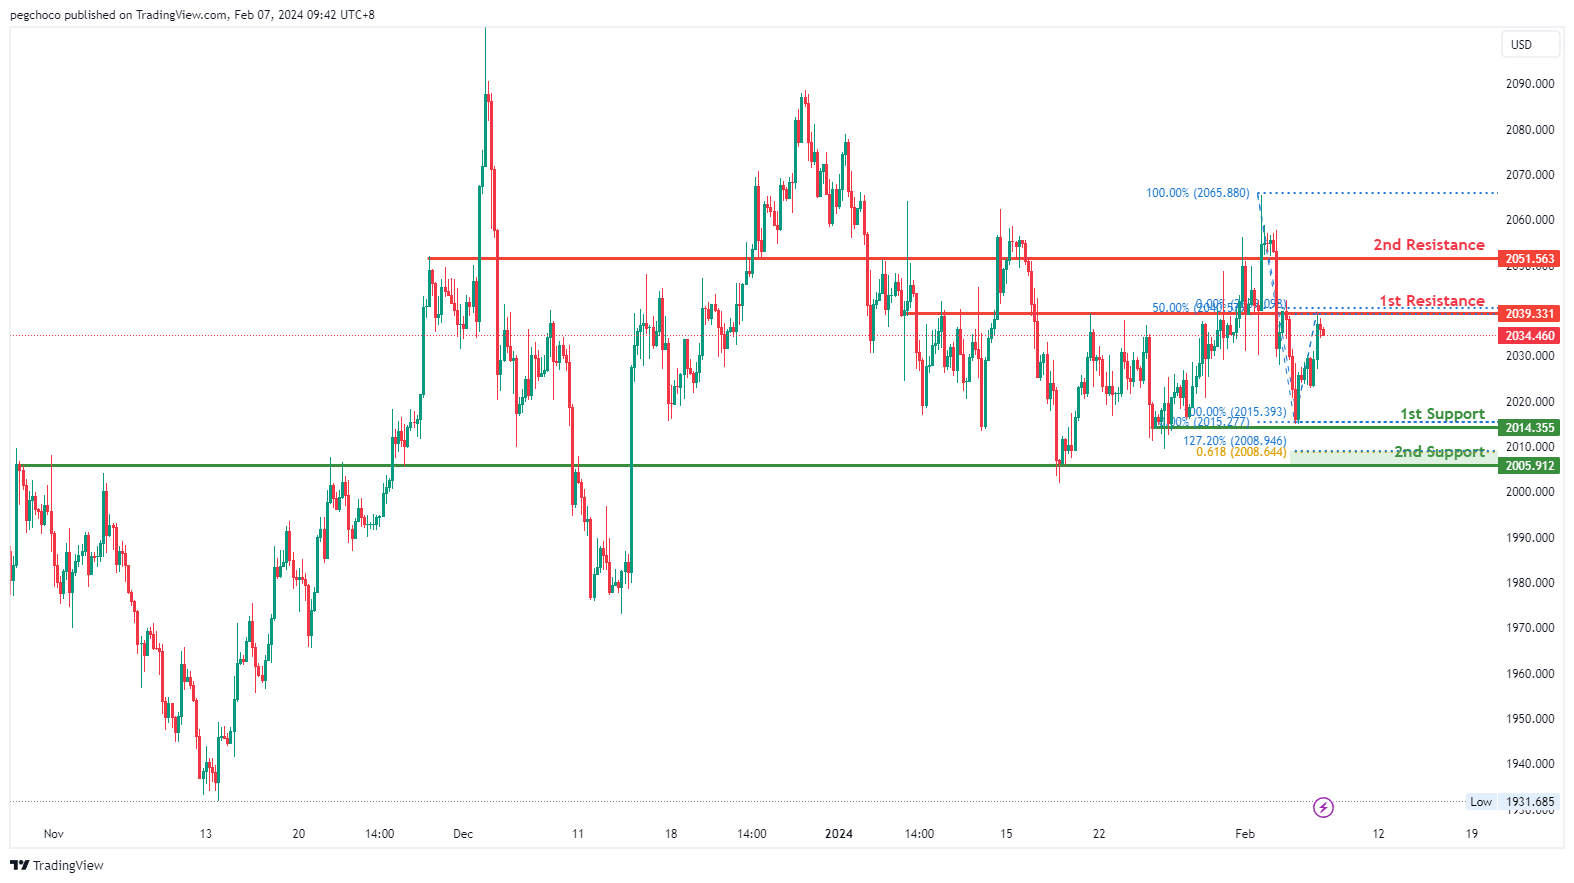
The XAUUSD chart currently shows a bearish overall momentum, suggesting a downward trend. There’s a potential for a bearish reaction off the 1st resistance level, followed by a drop towards the 1st support level.
The 1st support at 2014.35 is recognized as a multi-swing low support, indicating its historical significance as a strong support level.
Additionally, the 2nd support level at 2005.91 is characterized as an overlap support, coinciding with the 61.80% Fibonacci Retracement and 127.20% Fibonacci Extension, indicating Fibonacci confluence and further strengthening its importance as a support zone.
On the resistance side, the 1st resistance level at 2039.33 is identified as an overlap resistance, with the presence of the 50% Fibonacci Retracement, marking its historical significance as a potential resistance point.
Furthermore, the 2nd resistance at 2051.56 is considered a pullback resistance, suggesting its potential role in hindering further upward movement.
Bitcoin Price Eyes Fresh Rally Unless This Support Gives Way
Key Highlights
- Bitcoin price corrected lower and tested the $41,800 support.
- BTC is trading above a key bullish trend line with support at $42,400 on the 4-hour chart.
- The price could start a strong increase if it clears the $43,450 and $44,000 resistance levels.
- Ethereum is aiming for a fresh increase above the $2,440 resistance.
Bitcoin Price Technical Analysis
Bitcoin price found support near the $41,800 zone. BTC formed a base above $42,000 and is currently attempting a fresh increase.
Looking at the 4-hour chart, the price is trading above a key bullish trend line with support at $42,400. The price is also holding gains and positioned well above the 100 simple moving average (red, 4 hours).
The bulls seem to be active, but they are facing many hurdles. Immediate resistance is near the $43,450 level. The next resistance is near $44,000. A successful close above the $44,000 level might start a strong increase.
In the stated case, the price may perhaps rise toward the $45,000 level. Any more gains might send Bitcoin toward the $46,200 level in the near term.
If not, the price might start another decline. Immediate support is near the trend line at $42,400. The next major support is $41,800. Any more losses might send the price toward the 50% Fib retracement level of the upward move from the $38,502 swing low to the $43,853 high.
The next key support is near the $40,000 level, below which there is a risk of a drop toward the $38,500 level in the coming days.
Economic Releases
- US Goods and Services Trade Balance for Dec 2023 - Forecast $-62.2B, versus $-63.2B previous.
NZ employment grows 0.4% in Q4, unemployment rate ticks up to 4%
New Zealand's employment grew 0.4% qoq in Q4, slightly above expectation of 0.3% qoq. Unemployment rate ticked up from 3.9% to 4.0%, below expectation of 4.3%. Labor force participation rate fell from 72.0% to 71.9%.
Labor cost index for salary and wage rates, inclusive of overtime, recorded a 4.3% yoy increase, maintaining the same annual growth rate observed in the preceding three quarters of the year.
The Quarterly Employment Survey revealed a notable 6.9% yoy increase in average ordinary time hourly earnings, with public sector wages leading the charge.
Public sector hourly earnings surged by 7.4% yoy, marking the largest annual increase since March 2006 quarter, up from previous quarter's 5.4%. In contrast, private sector had a slight deceleration to 6.6% yoy, down from 7.1% yoy in previous quarter.
BoC’s Macklem: Path to 2% inflation slow and risks remain
In a speech, BoC Governor Tiff Macklem underscored the importance of allowing "more time" for monetary policy to take full effect in mitigating inflationary pressures within the Canadian economy. The path to 2% target is "likely to be slow" and "risks remain.
Macklem acknowledged the successes of recent rate hikes in aligning supply with demand, pointing to a discernible decrease in inflation across both goods and services. Shelter inflation, however, continues to pose a significant challenge. He attributed this trend not only to monetary tightening but also to deeper issues in the "structural shortage of housing" that monetary policy alone cannot resolve.
Further complicating the inflation landscape are the volatile oil and transportation costs linked to international conflicts and disruptions. While these factors are beyond the control of BoC, Macklem emphasized the central bank's focus on mitigating any broader inflationary impacts these cost increases might "feed through" to inflation in other goods and services.
Macklem's outlook projects a gradual return to the 2% inflation target, with expectations set for inflation to remain near 3% in the first half of the year, decreasing to about 2.5% by the end of the year, and finally achieving 2% target in 2025.
"Putting this all together, the resulting push and pull on inflation means the path back to 2% inflation is likely to be slow and risks remain," he noted.