Sample Category Title
BoE Dhingra urges not to take risk on the economy
In a Financial Times interview, BoE MPC member Swati Dhingra articulated her concerns regarding the UK's economic outlook and inflationary trends. As the sole member to vote for a rate cut in the last meeting, she cautioned against underestimating the downside risks and and urged not to take a risk on them.
Dhingra expressed apprehension about the adverse impacts of past policy tightening on growth, emphasizing the paradox of experiencing "higher-than-historic rates" of wage growth against the backdrop of significantly weakened consumption, which has declined by 5.9% relative to pre-pandemic levels.
This stark drop in consumption, according to Dhingra, is expected to persist, highlighting the "lagged effects" of monetary policy tightening yet to materialize fully. She questioned the rationale behind risking further economic weakening by maintaining high-interest rates when inflation appears to be on a "sustainable path."
The conversation further delved into the challenges posed by the current consumption weakness, which Dhingra believes is unlikely to reverse swiftly enough to trigger a "resurgence in inflation".
Her comments reflect a deeper concern over underestimating the downside risks to the economy, especially as the financial cushion provided by pandemic-era savings begins to diminish. Additionally, the noticeable decline in job vacancies signals further strain on the real economy.
"I don't see why we should be risking that," Dhingra emphasized.
Australian Dollar Yawns as RBA Stands Pat
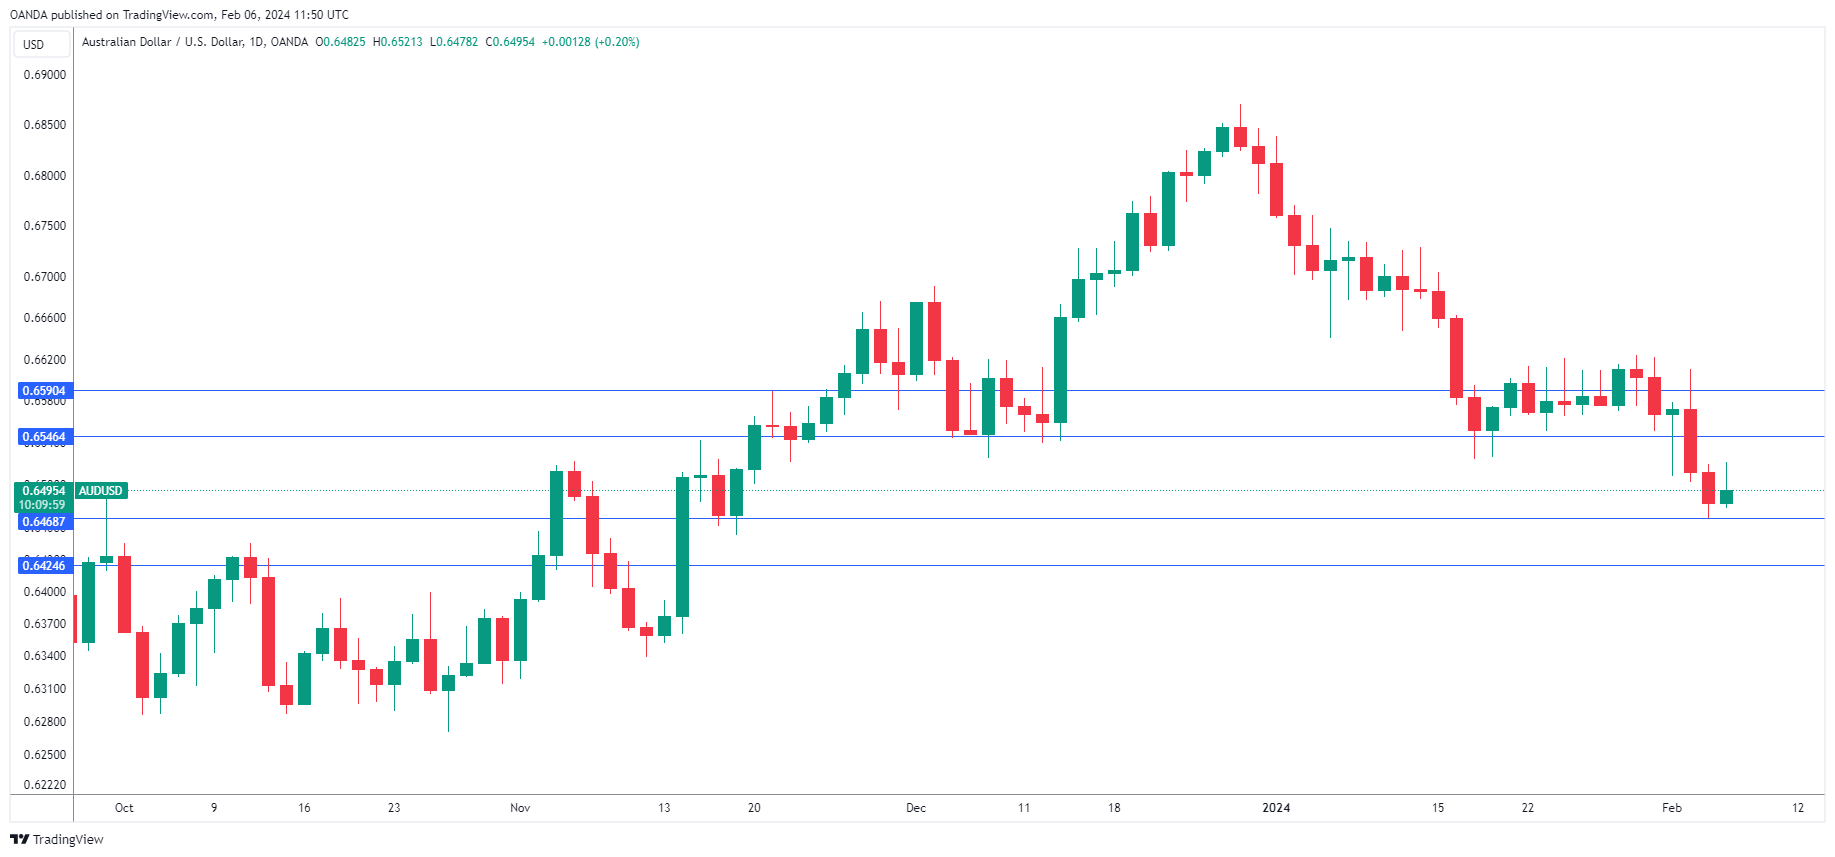
The Australian dollar is showing limited movement on Tuesday, after the Reserve Bank of Australia held interest rates. In the European session, AUD/USD is trading at 0.6493, up 0.61%.
RBA maintains rates
The RBA left interest rates unchanged at 4.35% at its first meeting of 2024. The central bank raised rates by a quarter-point in November but has been reluctant to lower rates, even with inflation continuing to decline. The decision was widely expected and the Australian dollar shrugged, gaining just 0.2% after the meeting.
The RBA statement acknowledged that inflation has been falling but remains too high and that “the board expects that it will be some time before inflation is sustainably in the target range”. The RBA released an updated inflation forecast, which projected that inflation would fall back to the target range of 2 to 3 percent in 2025 but wouldn’t fall to the midpoint of the range until 2026.
The message from the RBA was that inflation remains still elevated and sticky and it is still early to discuss rate cuts. The statement pushed back against rate cut expectations, saying that, “a further increase in interest rates cannot be ruled out”. The RBA is unlikely to raise rates unless inflation suddenly reverses direction and climbs higher, but the central bank remains hawkish in its rate stance and cautious about inflation. The statement noted that members were concerned about the slowdown in China’s economy and conflicts in Ukraine and the Middle East. Members were also worried about the lag in the effect of monetary policy and household consumption.
Governor Bullock used her press conference to reiterate that the RBA’s number one priority was lowering inflation, and that meant keeping rates in restrictive territory. Bullock said she sympathized with mortgage holders who were looking for a rate cut but inflation had to be driven down first and only then could the central bank start to lower rates.
AUD/USD Technical
- 0.6546 and 0.6590 are the next resistance lines
- 0.6468 and 0.6424 and providing support
RBA’s Hawkish Surprise Temporarily Boosted Aussie But Failed to Turn It Around
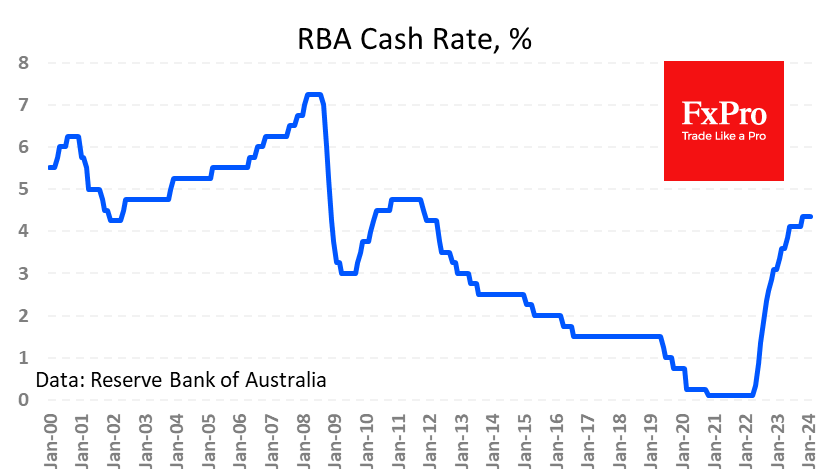
The Reserve Bank of Australia kept its cash rate unchanged at 4.35% for the third consecutive meeting. The markets widely expected the decision, but the tone of the accompanying commentary was more hawkish than the market had anticipated, adding to Aussie buying.
The RBA warned that it still hasn’t ruled out a rate hike. This is a stricter course than we hear from the Fed and the ECB, who are openly saying that the next step is a cut but prefer to wait for a longer pause than market participants want to see.
The difference between expectation and fact explains the initial speculative jump in AUDUSD of 0.5% to 0.6520. However, it will be difficult for the Aussie to sustain these gains.
Australia’s benchmark rate is well below the Fed’s 5.25-5.50% range, as well as the Bank of England’s 5.25% and even the ECB’s 4.5%. Meanwhile, inflation is higher than its listed peers at 4.1% y/y. This combination of factors limits the inflow of capital into the carry trade.
It is also important to note that current interest rates are relatively low for Australia. This is only a 10-year high, while rates in the US and Europe are at the high end of previous tightening cycles and at levels not seen for around 20 years.
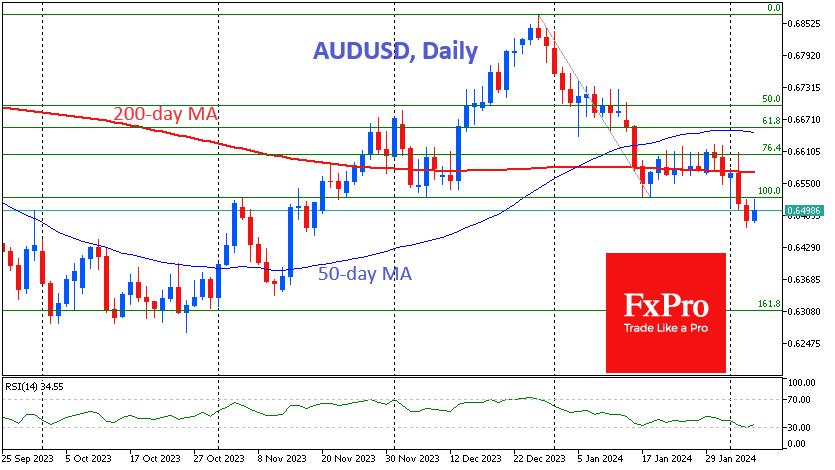
The only potential driver in this environment could be the difference in expected policy easing. However, we can see that the Fed, the ECB and the Bank of England are in favour of delaying the expected start of easing. In this context, the initial rally in AUDUSD looks like a profit-taking bounce after an impressive decline since the end of last month.
The AUDUSD fell sharply below its 200-day moving average on the release of the NFP, further indicating bearish dominance. After a relatively long consolidation period, the ultimate downside target now appears to be the 0.6300 area, where the 161.8% level of the nearly three-week decline since the 28th and last October’s lows meet.
Bitcoin is Looking at Stocks, and That’s Worrisome
Market picture
The crypto market remains stable while waiting for further signals. The crypto cap is up 0.4% in 24 hours to $1.64 trillion.
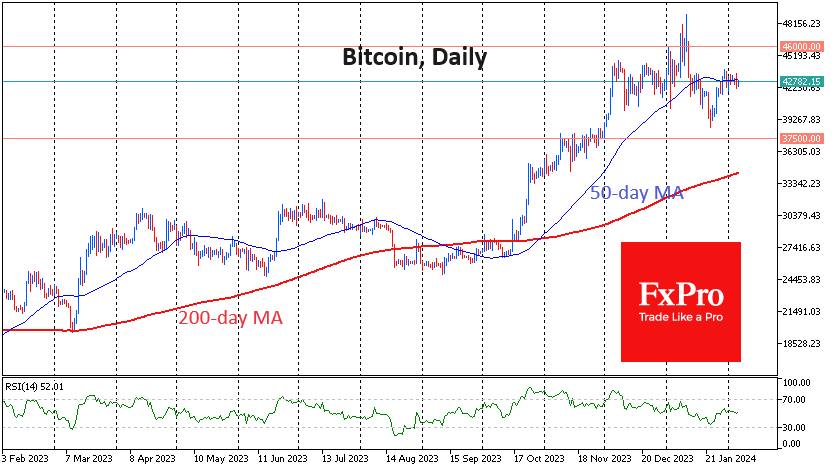
Bitcoin is trading at $42.7K – virtually unchanged in 24 hours, just 1.4% lower than a week ago and a 1.8% decrease over 30 days. Don’t think that the first cryptocurrency has turned into a stablecoin, as December’s stabilisation after growth has been replaced by a January pendulum swing.
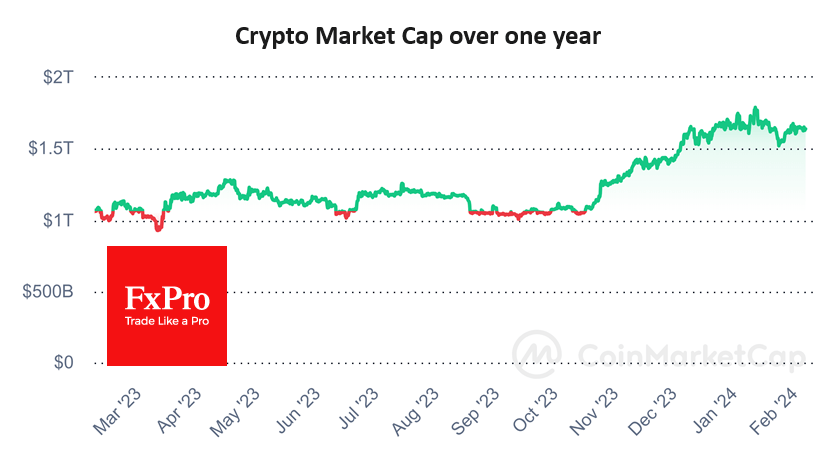
Bitcoin’s correlation with stock market sentiment has risen markedly in recent weeks. This looks like a worrying sign because stocks are in the late stages of a rally, where abnormally sharp moves in some instruments (Meta, Nvidia, Amazon) are juxtaposed with corrections in most securities.
According to CoinShares, crypto funds saw inflows of $708 million last week after outflows of $500 million a week earlier. Investments in Bitcoin rose by $703 million, in Solana by $13 million, and in Ethereum, they decreased by $6 million.
Inflows into recently launched spot ETFs (since 11 January) totalled $7.7bn, offset by outflows from a $6bn futures fund. The total global assets under management are $53 billion, CoinShares said.
News background
According to The Block, the volume of transactions in the BTC network is growing for the fourth consecutive month and reached $1.21 trillion in January, the highest since September 2022. Meanwhile, Bitcoin volatility remains at its lowest since December 2023.
Spot bitcoin ETFs from BlackRock and Fidelity were among the top 10 largest U.S. ETFs in terms of asset inflows in January, according to Morningstar data. The two funds had total net inflows of $4.8 billion, with outflows from the GBTC fund reaching $5.7 billion.
Bankrupt cryptocurrency lender Genesis filed for bankruptcy in New York District Court on Saturday. The company is asking it to approve the sale of its $1.6 billion worth of digital assets placed in Grayscale trusts, which could have a negative impact on the cryptocurrency market.
According to CryptoQuant, mining pool reserves have fallen to their lowest level since July 2021. Miners are selling off BTC in preparation for halving when the reward for mining a block drops by half.
Bitcoin will “test investors’ resolve” with a sell-off after the halving and will only renew its all-time high in the fourth quarter. This is the forecast presented by analysts DecenTrader.
Bitcoin supporter Nayib Bukele was re-elected president of El Salvador. Experts expect an inflow of specialists and capital to the country.
Spain will expand control over the monitoring of crypto assets to confiscate them to pay off tax debts.
Eurozone retail sales falls -1.1%mom, EU down -1.0%
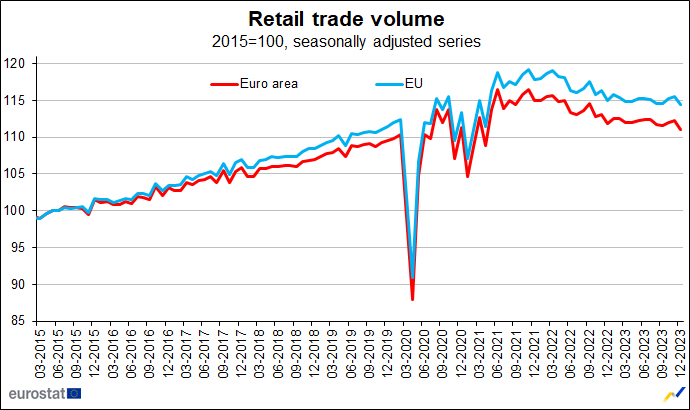
Eurozone retail sales fell -1.1% mom in December, worse than expectation of -1.0% mom. Volume of retail trade decreased by -1.6% mom for food, drinks and tobacco, by -1.0% mom for non-food products and by -0.5% mom for automotive fuels.
EU retail sales fell -1.0% mom. Among Member States for which data are available, the largest monthly decreases in the total retail trade volume were registered in Slovenia (-3.6%), Denmark (-3.2%) and Luxembourg (-3.1%). The highest increases were observed in Slovakia (+2.0%), Croatia and Hungary (both +1.4%) as well as in Portugal (+0.7%).
ECB consumer survey reveals declining inflation expectations
ECB's Consumer Expectations Survey for December highlighted a noteworthy trend in consumer sentiment regarding inflation and economic growth.
In a positive development, consumers' inflation expectations for the next 12 months have decreased for the third consecutive month, with median inflation expectation falling to 3.2%, a drop from November's 3.5% and October's 4.0%.
Conversely, the survey indicated a slight uptick in medium-term inflation expectations, with three-year ahead inflation expectations median rising marginally from 2.4% to 2.5%, although this figure remains below 2.6% observed in October.
On the economic growth front, the survey's findings were relatively stable, with mean growth expectation for the next 12 months remaining unchanged at -1.3%. Furthermore, the survey revealed a slight improvement in unemployment outlook, with expected mean unemployment rate declining from 11.4% to 11.2%, compared to 11.6% in October.
AUD/USD Rate Rises after RBA Decision
This morning the Central Bank of Australia decided to keep the interest rate at the same level = 4.35%, as expected.
However, RBA management said that further rate hikes cannot be ruled out as inflation is still too high. This is a clear signal that policy easing is unlikely in the near future.
AUD/USD has rallied from its 2024 low following this relatively hawkish rhetoric.
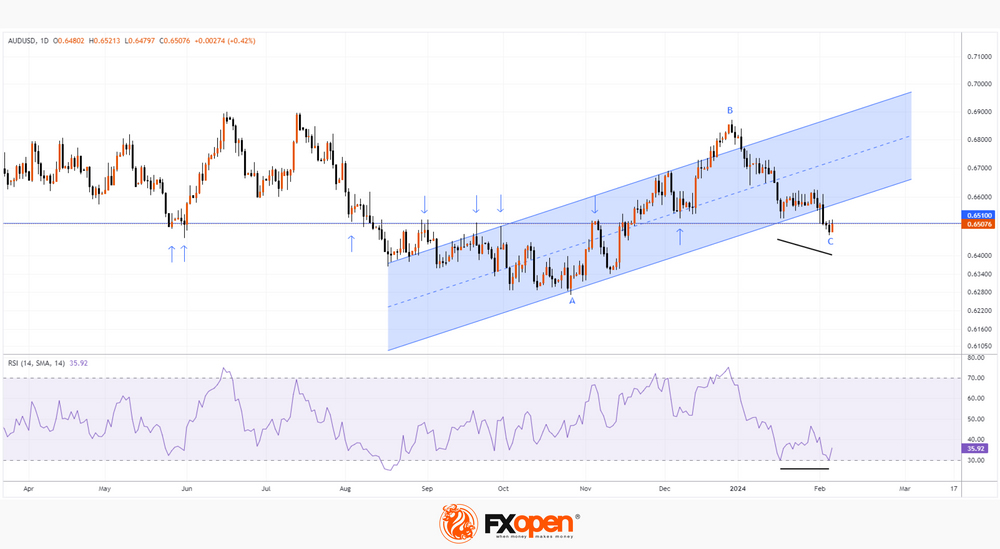
The daily AUD/USD chart today shows that if the bullish momentum does not fade, then based on the results of today's trading the following may form:
→ bullish engulfing candlestick pattern;
→ bullish divergence.
At the same time, the price is near the important level of 0.6510, which since mid-2023 has repeatedly shown its influence on the AUD/USD price both as support and resistance (shown by arrows).
The ability of the AUD/USD price to consolidate above this key level will indicate the strength of demand, with:
→ a false bearish breakdown of the level of 0.651 may form on the chart;
→ it is possible that the bulls will try to build on their success and return the AUD/USD price to the area of the ascending channel (shown in blue), which dates back to last fall.
From the point of view of technical analysis of AUD/USD, the likelihood of a bullish scenario is increased by the fact that point C (the current low of the year) is located in the area of the 0.382 Fibonacci level of the impulse movement A→B.
Trade over 50 forex markets 24 hours a day with FXOpen. Take advantage of low commissions, deep liquidity, and spreads from 0.0 pips. Open your FXOpen account now or learn more about trading forex with FXOpen.
This article represents the opinion of the Companies operating under the FXOpen brand only. It is not to be construed as an offer, solicitation, or recommendation with respect to products and services provided by the Companies operating under the FXOpen brand, nor is it to be considered financial advice.
NZD: Unemployment Rate Could Weaken NZD
Traders are closely monitoring Fed speeches, particularly Fed's Mester speech scheduled for Tuesday, for further insights into monetary policy directions. Additionally, market participants await key economic releases later in the week, including New Zealand's Unemployment Rate for Q4 and China's Consumer Price Index (CPI) and Producer Price Index (PPI) for January. These data points will provide crucial cues for assessing the economic outlook and may influence the NZDUSD pair's movement.
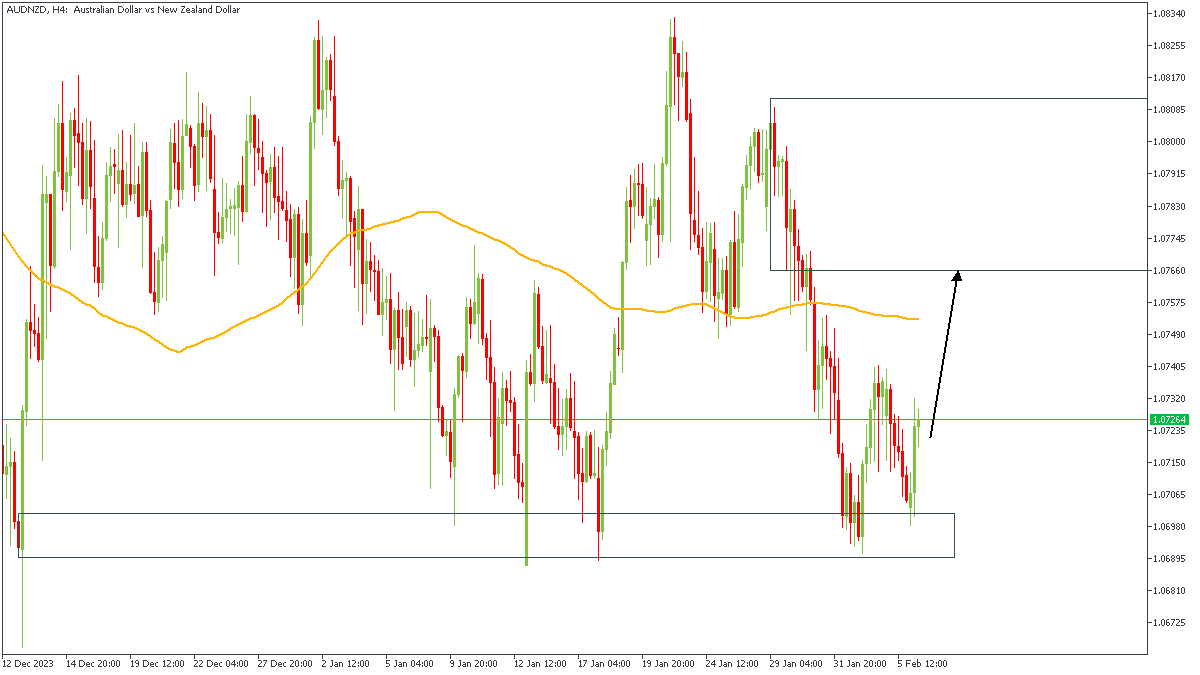
AUDNZD - H4 Timeframe
AUDNZD has just bounced off the demand zone on the Daily timeframe, and I suspect the price action intends to target the supply zone on the 4-hour timeframe. Although I do not have a lot of confidence in this sentiment, I, however, expect prices to get attracted to the 100-period moving average as shown on the chart.
Analyst’s Expectations:
- Direction: Bullish
- Target: 1.07635
- Invalidation: 1.06972
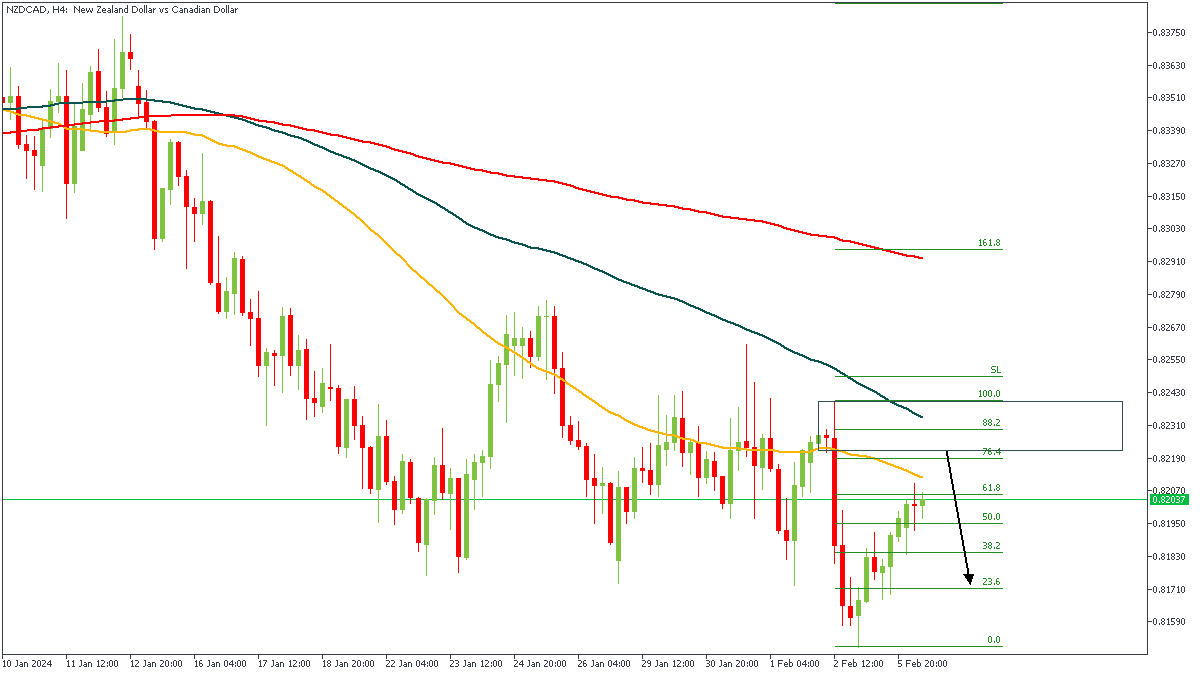
NZDCAD - H4 Timeframe
The 4-Hour timeframe on NZDCAD has been in a downtrend for a while now, as indicated by the moving averages. Following this, we see price currently approaching the 76% of the Fibonacci retracement, as well as the supply zone that lies underneath it. The bearish array of the moving averages adds an extra layer of confluence, whilst the 100-period moving average resistance is an additional factor to consider. My conclusion here is a bearish sentiment.
Analyst’s Expectations:
- Direction: Bearish
- Target: 0.81734
- Invalidation: 0.82409
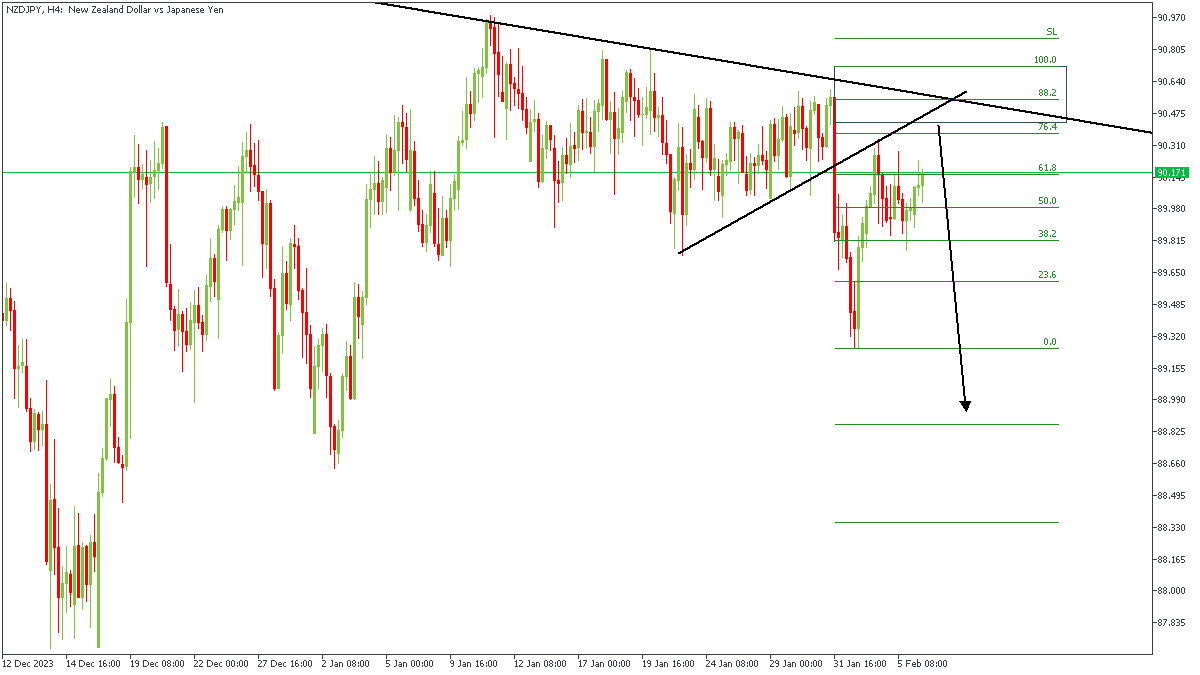
NZDJPY - H4 Timeframe
NZDJPY mirrors the price action as seen on NZDCAD, albeit with a few minor differences. In the case of NZDJPY, we see price currently approaching the 76% of the Fibonacci retracement as well, however, there is a confluence of two resistance trendlines, as well as the supply zone serving as the additional confirmations of the bearish sentiment in this case.
Analyst’s Expectations:
- Direction: Bearish
- Target: 89.620
- Invalidation: 90.731
CONCLUSION
The trading of CFDs comes at a risk. Thus, to succeed, you have to manage risks properly. To avoid costly mistakes while you look to trade these opportunities, be sure to do your due diligence and manage your risk appropriately.
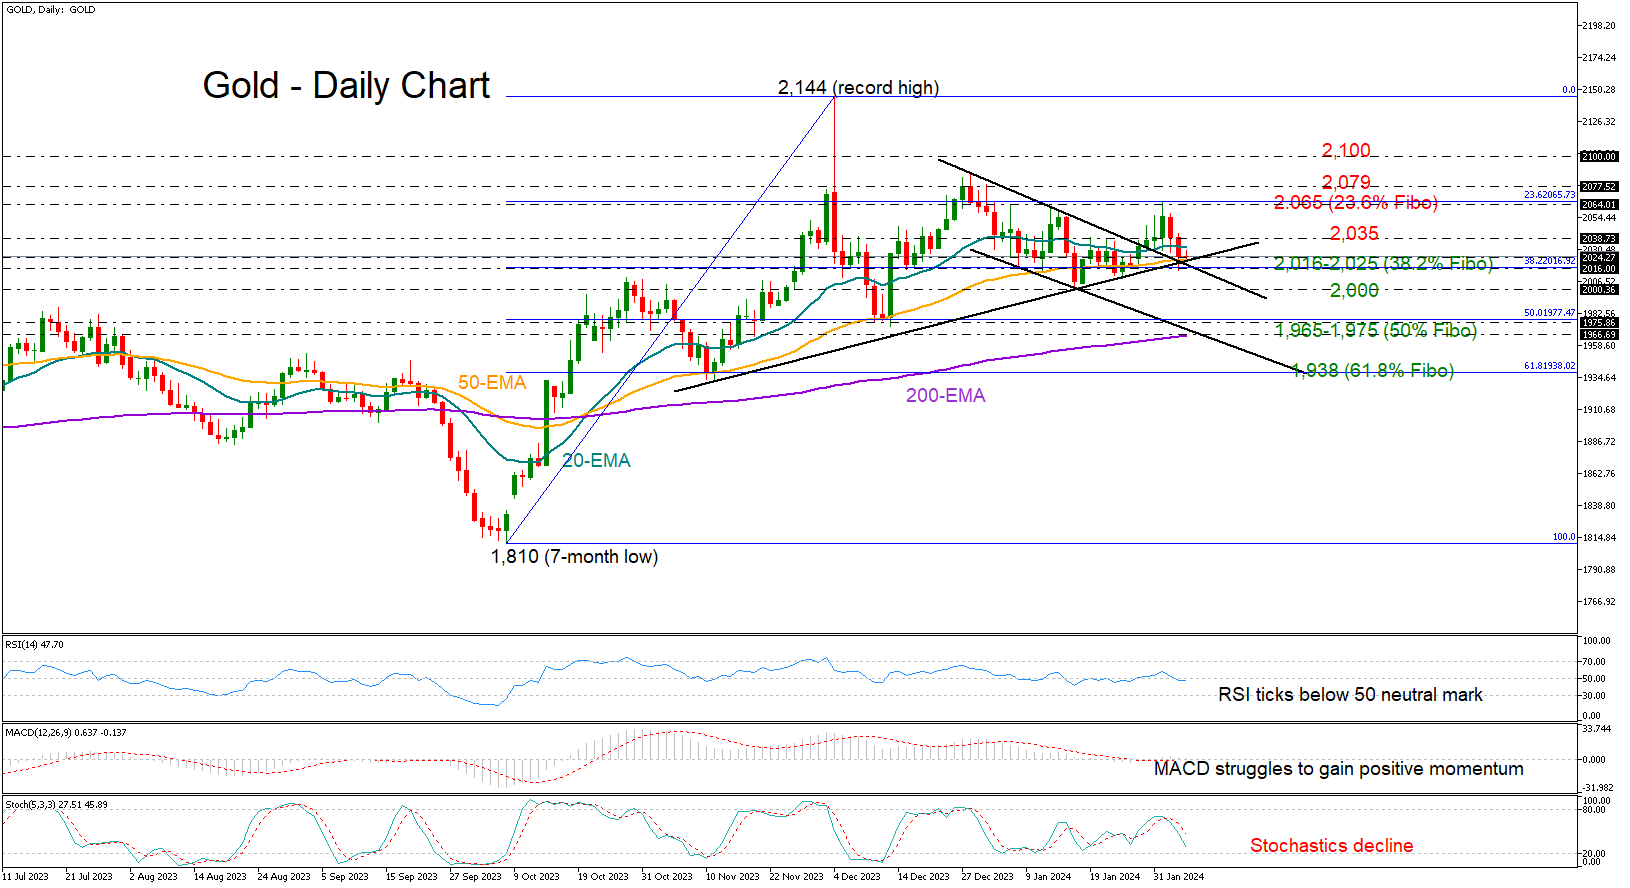
Gold Flips Backwards But Still Shines Above 2,000
- Gold loses ground after hitting tough resistance
- Lacks bullish signals but pattern of higher lows remains intact
Gold could not mark a new higher high above January’s tough resistance of 2,065, correcting lower to close around its 50-day exponential moving average (EMA) and the support trendline from November at 2,025.
The latest downturn in the technical indicators has increased downside risks, but the series of higher lows that started in October keeps feeding hopes for a bullish continuation as long as the price holds above the 2,000 round level.
Should the bears breach the 2,000 floor, the price could dive into the 1,965-1,975 zone formed by the 50% Fibonacci retracement of the previous upleg and the 200-day EMA. The lower boundary of the bearish channel is also in the neighborhood. Therefore, a step lower could raise fresh selling interest, pressing the price towards the 61.8% Fibonacci of 1,938.
If the bullish scenario unfolds, with the precious metal bouncing back above the 2,035 constraining zone, traders will look for an extension above the critical 2,065-2,079 resistance territory before they target the 2,100 psychological number. Beyond the latter, the recovery could stretch towards the record high of 2,144.
All in all, gold is maintaining a neutral profile in the short-term picture. A decisive rally above 2,065-2,079 or a plunge below 1,965-1,975 would change the outlook accordingly.
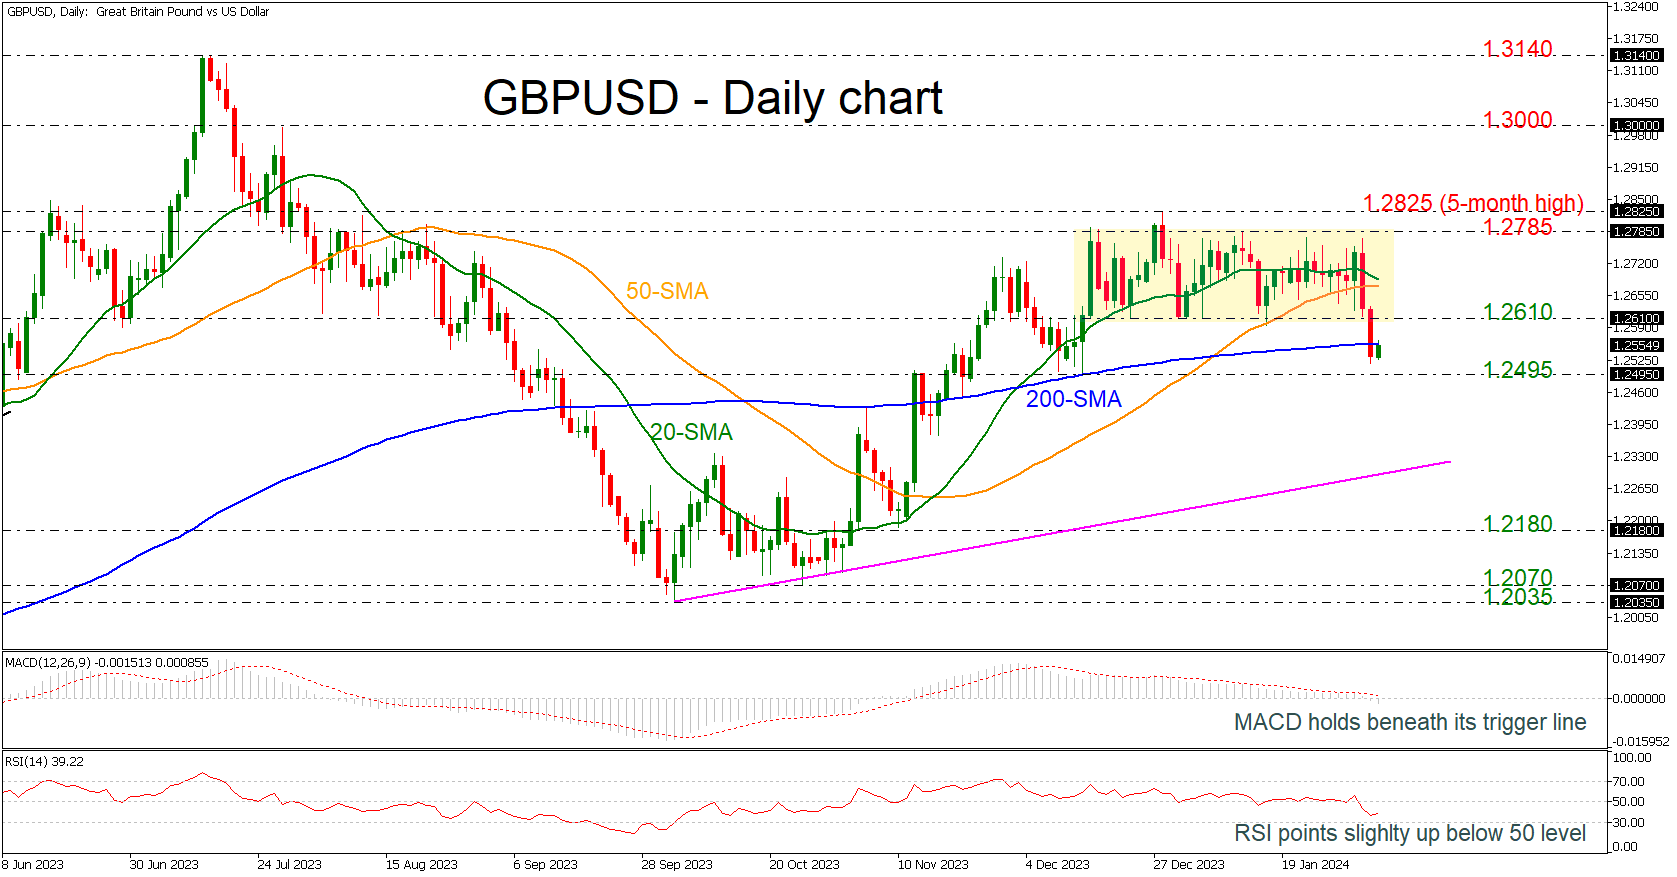
GBPUSD Plummets to 2-month Low
- GBPUSD tests 200-day SMA after strong sell-off
- Prices break trading range to the downside
- Outlook looks bearish in short-term
GBPUSD plunged to a new almost two-month low of 1.2517 on Monday’s session, falling beneath the short-term trading range and the 200-day simple moving average (SMA).
Currently, the market is recovering some losses with the RSI confirming the recent upside move as it is ticking slightly up below 50. On the other hand, the MACD oscillator is losing momentum beneath its trigger and zero lines, while the 20- and the 50-day SMAs are ready for a bearish crossover.
Should the bears press the price below 1.2495, the medium-term ascending trend line around 1.2300 may prevent an aggressive downfall towards the 1.2180 support level. If the latter gives way too, the decline could continue towards the 1.2035-1.2070 area, shifting the outlook to negative.
Alternatively, a climb back above the 200-day SMA and the 1.2610 resistance could meet the 20- and the 50-day SMAs at 1.2680 ahead of the 1.2780-1.2825 region. A climb above these levels could turn the outlook back to bullish.
All in all, GBPUSD is looking bearish in the very short-term timeframe after the tumble beneath the consolidation area; however, the market is still developing well above the medium-term uptrend line.