
Sample Category Title
USD/JPY Daily Outlook
Daily Pivots: (S1) 148.33; (P) 148.62; (R1) 148.96; More...
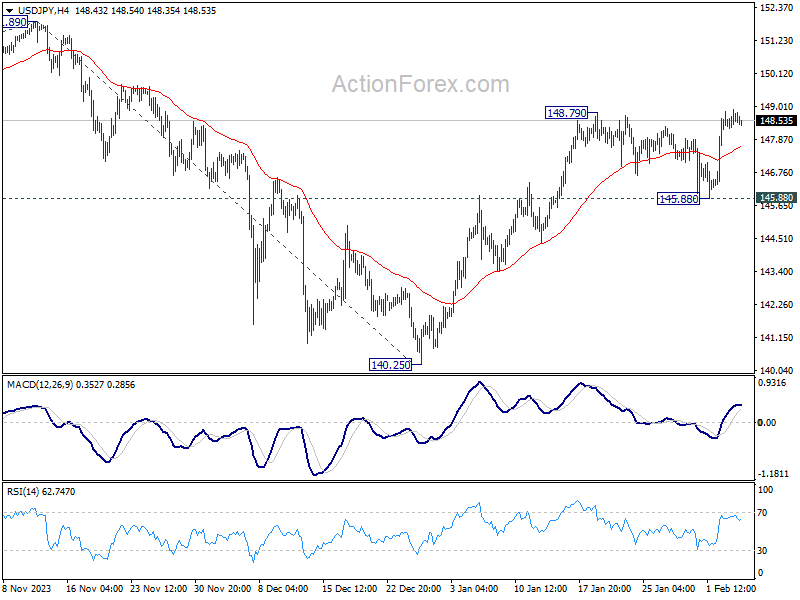
Intraday bias in USD/JPY remains neutral with focus on 148.79 resistance. Firm break there will resume the rally from 140.25 to 151.89/93 key resistance zone. For now, further rise will remain in favor as long as 145.88 holds, in case of retreat.
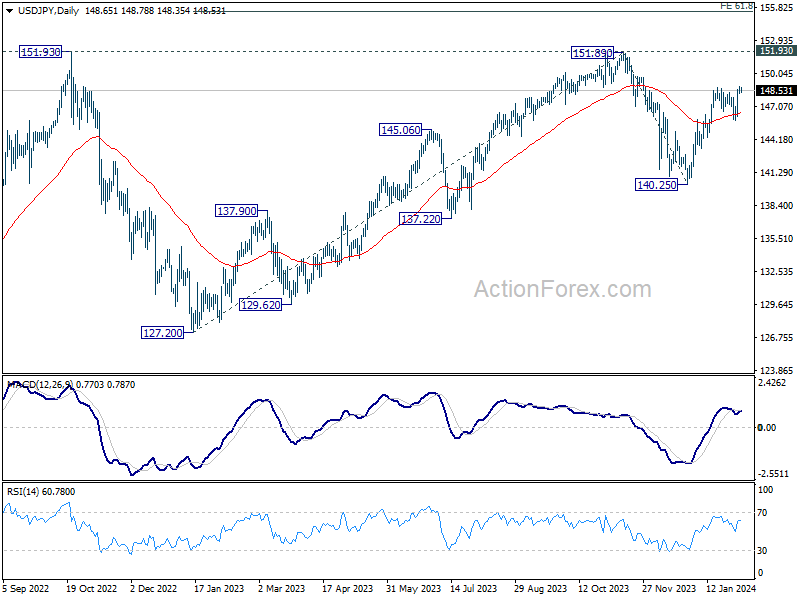
In the bigger picture, fall from 151.89 is seen as a correction to the rally from 127.20, which might have completed at 140.25 already. Firm break of 151.89/93 resistance zone will confirm up trend resumption next target will be 61.8% projection of 127.20 to 151.89 from 140.25 at 155.50. This will now remain the favored case as long as 140.25 support holds.
USD/CAD Daily Outlook
Daily Pivots: (S1) 1.3487; (P) 1.3515; (R1) 1.3570; More...
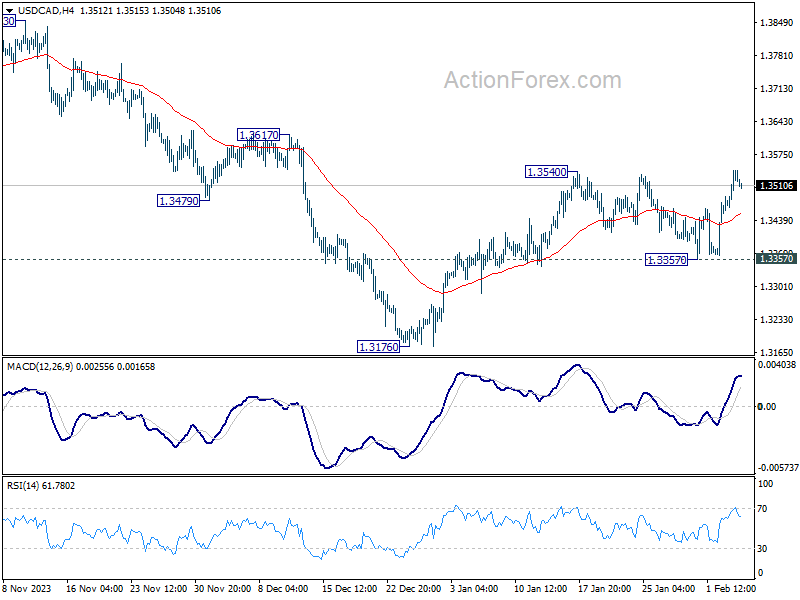
Intraday bias in USD/CAD stays neutral for the moment. On the upside, break of 1.3540 will resume the rise from 1.3176. That will also revive that case that whole fall from 1.3897 has completed, and target this resistance. Nevertheless, firm break of 1.3357 support will argue that rebound from 1.3176 has completed, and target this low for resuming whole fall from 1.3897.
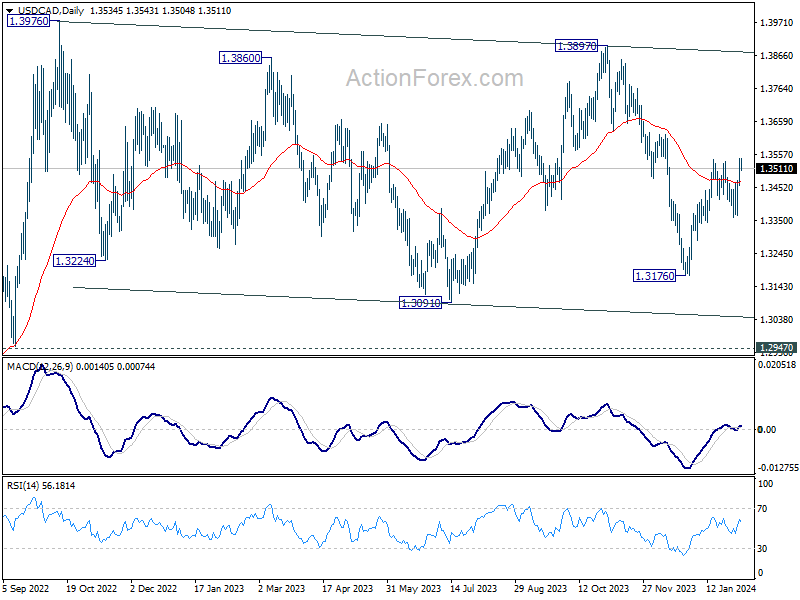
In the bigger picture, price actions from 1.3976 (2022 high) are viewed as a corrective pattern only. In case of another fall, strong support should emerge above 1.2947 resistance turned support to bring rebound. Overall, larger up trend from 1.2005 (2021 low) is still expected to resume through 1.3976 at a later stage.
RBA Still Wants Reassurance
The RBA Board held rates steady today, as expected by almost everyone. It is still not ruling out a hike, but nor is it ruling out a cut once it achieves sufficient confidence that inflation will return to the 2–3% target range sustainably.
The RBA Board held rates steady today, as expected by almost everyone. While the policy decision was well anticipated, it was something of a shift from the RBA’s own views from three months ago. In the most recent statement the Board stated, “The path of interest rates that will best ensure that inflation returns to target in a reasonable timeframe will depend upon the data and the evolving assessment of risks, and a further increase in interest rates cannot be ruled out.” This is noticeably softer language than the media release in December, which read, “Whether further tightening of monetary policy is required to ensure that inflation returns to target in a reasonable timeframe will depend upon the data and the evolving assessment of risks.” But it is still a little on the hawkish side relative to most expectations; the Board were not about to do a complete 180-degree turn in the space of three months. That said, in the subsequent media conference, Governor Bullock stated that the Board were “not ruling anything in or out”.
Inflation is still characterised as high. Although goods price inflation has declined faster than forecast, the media release and SMP emphasise that services inflation remains high and is only declining at the previously forecast pace. That said, the upgrade to the inflation forecast for calendar 2025 in the November forecast round has been taken back. Trimmed mean inflation is now expected to be 2.8% over calendar 2025, closer to the forecast from the August SMP round.
Since the last Board meeting in December, essentially all the domestic data have been weaker than assumed in the RBA’s November forecast round. Consumer spending, investment and especially inflation all ended 2023 weaker than the RBA forecast. The narrative that inflation had become increasingly home-grown and demand-driven has become harder to sustain.
The RBA is still of the view that the level of demand is too strong, even if the rate of growth “remains subdued”. It characterises demand and supply as “moving towards a better balance” and credits higher interest rates as working to establish that better balance. It also believes that the labour market is too tight, if only in “pockets”, as Governor Bullock said in the media conference. Some of the language about domestic demand in the SMP has nonetheless softened. The information from liaison suggested that firms are finding it increasingly difficult to pass on cost increases.
In line with this softer data, the forecasts for consumption were reduced. The recovery in dwelling investment has also been pushed out. GDP growth is forecast to be lower across the whole horizon than in the November round, and unemployment higher. The SMP also pointed to indicators of a broader moderation in wages growth in the period ahead.
The Statement on Monetary Policy (SMP) contains a new section showing an assessment of spare capacity, which shows estimates of labour market and output indicators being above capacity. Much of this is based on internal models that have not been published, though some are external estimates attributed to organisations such as the OECD. Given the current state of the academic literature, it is doubtful that these models adequately allow for the possibility that supply capacity could bounce back as the ripple effects from the pandemic and other shocks unwind. Also noteworthy is that this section highlights the low vacancy rates for residential real estate as evidence of demand exceeding supply, but the text does not mention the above-average vacancy rates in commercial real estate. If inflation outcomes continue to surprise the RBA on the downside, this assessment would need to be – and would be – revised.
As stated previously, we do not expect any further rate increases by the RBA this cycle. Rate cuts are still some way off, though. The RBA Board will need to be sufficiently comfortable that inflation will definitely decline into the 2–3% target band. It will also want to be confident in the recovery in productivity. We continue to expect the RBA to reach this level of comfort around September.
We doubt that the Board are even thinking about thinking about rate cuts yet, though. In a slight departure from the language in the media release, the Governor stated that the Board are “not ruling anything in or out”. Both a hike and a cut could be contemplated if the data pointed to it being necessary. She also emphasised that they do not need to see inflation actually inside the band, let alone at the midpoint of 2½%, to cut rates. But they do need to be confident that once it gets there, it will stay there.
Today ushered in many of the new arrangements recommended by the RBA Review, including the simultaneous release of the Statement on Monetary Policy. (This rescheduling had previously been contemplated by the staff, as revealed in the Third Request for Information bundle on the RBA Review web site. It was evidently only feasible with the advent of the longer Board meetings.) Some of the recommended changes, including unattributed votes and public appearances by Board members, will not come into effect until the enabling legislation is passed and the Monetary Policy Board formed, later in the year.
The shorter, more formatted SMP document also contains additional detail about the forecasts, including additional variables and an assessment of how the current state of the economy compares with the RBA’s view of full employment. In particular, the implied path for productivity was shown for the first time. This shows the assumed solid bounce-back and reversion to a trend a little above 1% annual growth. It was pleasing to see the RBA’s recognition in the text of the SMP that some of the weakness in productivity occurred because hours worked jumped too fast for the capital stock to keep up, and that this will unwind over time. This is in line with the analysis of Westpac Economics colleagues Pat Bustamante and Jameson Coombs last year.
Over the period ahead, the RBA Board will be focused on the data flow. It will “continue to pay close attention to developments in the global economy, trends in domestic demand, and the outlook for inflation and the labour market.” It will also be watching for signs that medium-term inflation expectations dislodge from their currently well-anchored state.
Bitcoin (BTCUSD) Looking to Extend Higher
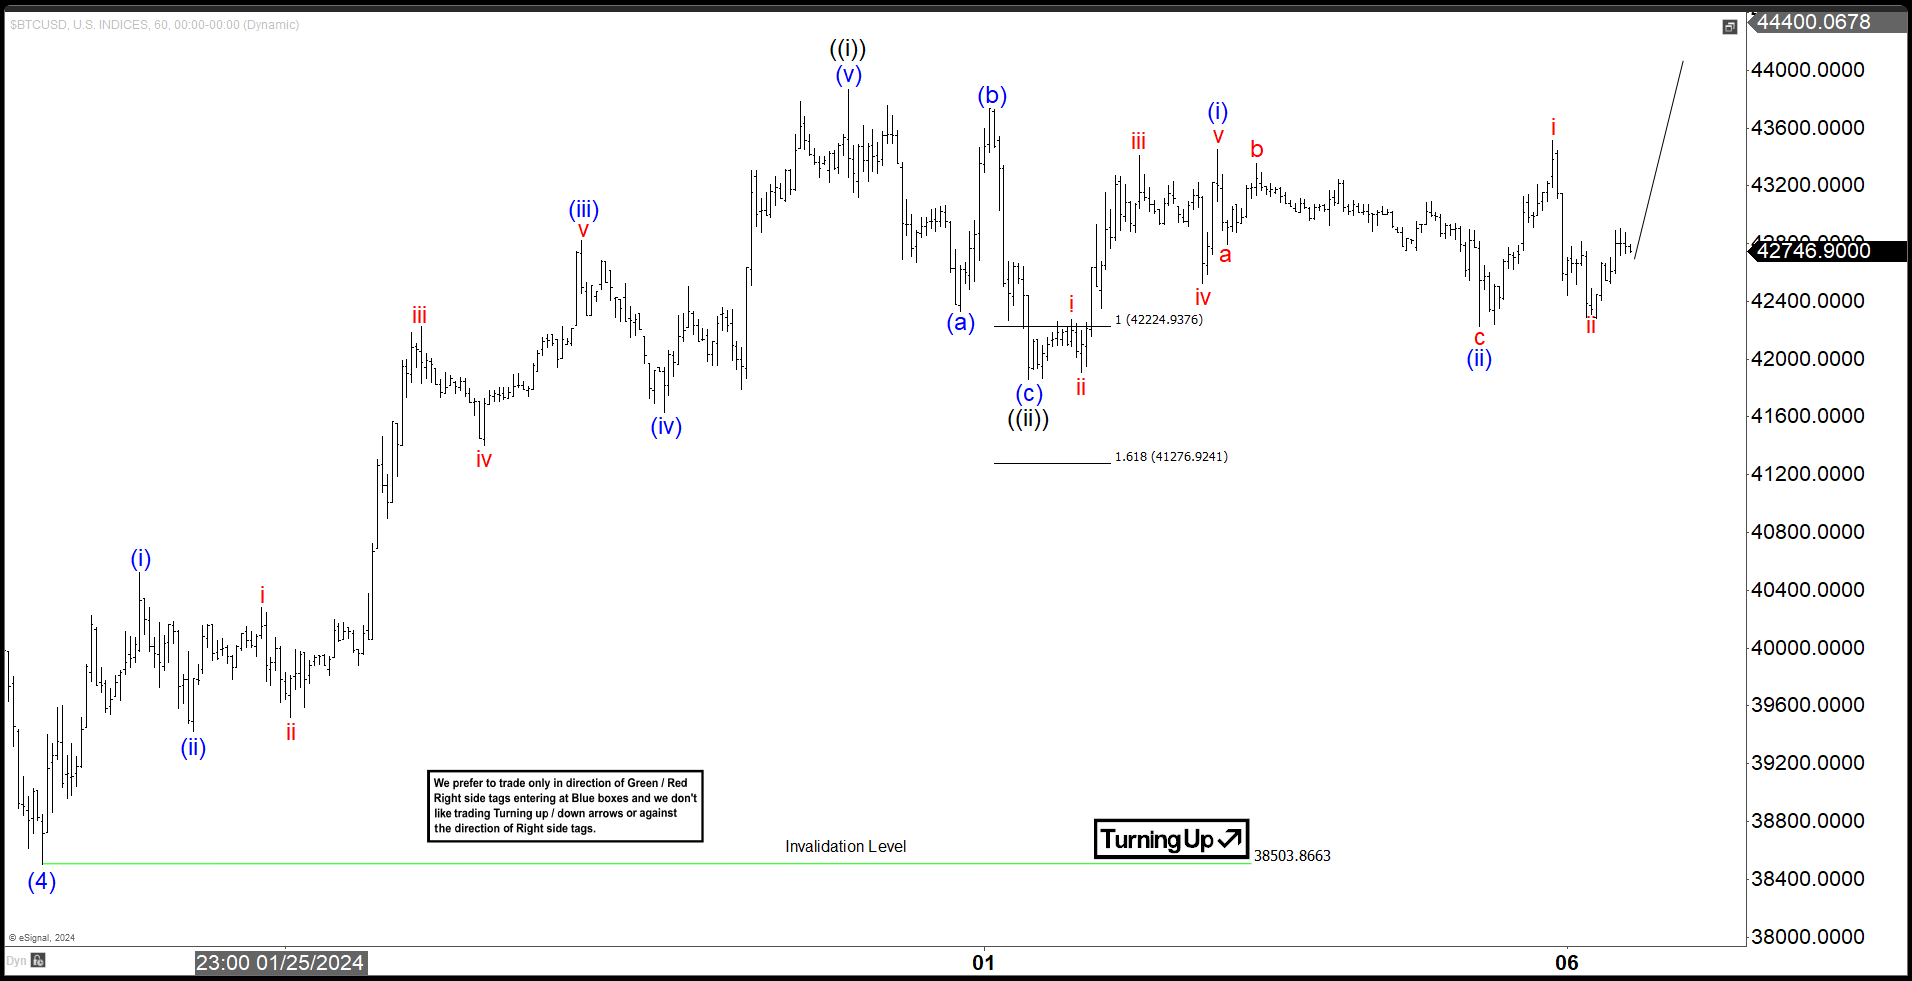
Short Term Elliott Wave view in Bitcoin (BTCUSD) suggests the rally to 49500 on January 11, 2024 ended wave (3). Pullback in wave (4) is proposed complete at 38503.8 as the 1 hour chart below shows. Up from wave (4), wave (i) ended at 40526.3 and pullback in wave (ii) ended at 39419.8. The crypto currency then extended rally higher in wave (iii) towards 42823.2 and pullback in wave (iv) ended at 41628.6. Final leg higher wave (v) ended at 43865 which completed wave ((i)) in higher degree. Bitcoin then pullback in wave ((ii)) towards 41856.4 with internal subdivision as a zigzag Elliott Wave structure.
Down from wave ((i)), wave (a) ended at 42333.2 and wave (b) ended at 43733.2. Wave (c) lower ended at 41856.4 which completed wave ((ii)). Bitcoin then turned higher in wave ((iii)). Up from wave ((ii)), wave (i) ended at 43448.4 and dips in wave (ii) ended at 4224. Near term, while Bitcoin stays above wave ((ii)) low, expect the crypto currency to extend higher. As far as pivot at 38503.8 low stays intact, expect pullback to find support in 3, 7, or 11 swing for further upside.
Bitcoin 60 Minutes Elliott Wave Chart
BTCUSD Elliott Wave Video
https://www.youtube.com/watch?v=e93dzS3s2nk
Turning the Mill With Carried Water
The selloff in US bonds extended to a second day on the back of crowded hawkish comments from Federal Reserve (Fed) members and on the surprising strength for the US economy. The latest ISM data printed yesterday showed that US services grew at their biggest pace in four months, screaming that the US economy is too resilient and too healthy for the Fed to start cutting the rates in a hurry. As such, the US 2-year yield approached the 4.50% level and the 10-year yield flirted with 4.18. The US sovereign bonds were better bid in Asia today, the US 10-year paper is expected to see a limited upside potential above 4.20%, but a March rate cut is off the table, and activity on fed funds futures gives no more than a two-thirds chance for a May cut – which remains quite high and could be further curbed.
Naturally, the US dollar extended its rally above the 100-DMA and is roaring against all majors since Friday’s jobs data. But note that the other central bankers won’t sit quietly, turning their thumbs, faced with the rate cut bets. The Reserve Bank of Australia (RBA) for example kept its policy rate unchanged at today’s meeting and warned that a further monetary policy TIGHTENING cannot be ruled out if needed. The AUDUSD found buyers below 65 cents.
Saying the obvious
The OECD also warned central bankers that it’s certainly too early to declare victory on inflation because growth remains resilient. According to their latest forecasts, global economic growth will slow to 2.9% this year, from 3.1% last year. It’s above their November forecast, but not all locations have the same bright outlook: the US forecast has been revised higher by 0.6 percentage point, while the euro area economic outlook is downed by 0.3 percentage points. The euro area’s economic divergence is due to its higher vulnerability to higher rates and the energy crisis – as duh, Europe has no fossil energy and can’t pump like crazy as the US does. And all that sums up to the same conclusion that I have been trying to convey since weeks: the Fed is in a better position to keep rates steady than the ECB. And that divergence should translate into a softer euro against the dollar. The EURUSD fell to 1.0723 yesterday as the soaring US yields and the stronger dollar hit all majors across the board. We could see the euro’s selloff slow after a big two-day slide, but the euro outlook remains bearish as the economic data on this side of the Atlantic doesn’t look as encouraging as on the US coast and it would only make sense if the ECB started cutting the rates before the Fed, which would imply a further euro weakness.
Nvidia defies gravity
In equities, the extension of yesterday’s selloff weighed on major US indices, but not too much. The S&P500 retreated by a meagre 0.32% from an ATH, as MAMAA stocks eked out a small gain while Nvidia gained another near 5% because Goldman Sachs upped its price target to $800 per share. Nvidia traded at the doorstep of $700 per share yesterday, another $100 rise is peanuts at the current momentum. There won’t be much to stop investors from buying – other than crazy valuations and deeply overbought conditions – before the February 21st earnings. The question is not whether Nvidia could rise to $800. It is whether it could consolidate gains after the results.
Turning the mill with carried water
Buying Chinese equities feels like catching a falling knife. The Chinese stock markets are in a better shape this morning as authorities came up with fresh measures to stop bleeding in Chinese stock markets. This time, China announced trade restrictions on domestic institutional investors and some offshore units, and imposed caps on some cross-border swaps that could be used to short Hong Kong stocks. They also told some brokers not to reduce their exposure to mainland shares. But all these measures are essentially attempting to turn the mill with carried water – they have been inefficient to trigger a sustained recovery and they will hardly bring investors back on board. The major worry is the Xi-led government’s radical change of mindset, which involves severe government crackdowns on the former investor gems like Alibaba and Tencent and the destruction of the Chinese dream. Throwing money into the mix is a clumsy quick fix, it won’t fix confidence.
ISM Data Points to a Stronger Than Expected US Service Sector
In focus today
Focus in the euro area is on retail sales for December. Private households are still cautious with spending despite the strong labour market and large savings from the previous years. We expect private consumption to improve during 2024 as real income rises, but the December 2023 print will likely show muted retail sales as previous months.
In Germany, we receive factory orders for December that will give a hint of where industrial production released tomorrow is heading. The print will likely be weak as we know German GDP contracted 0.3% q/q in Q4 2023.
Fed's Mester speaks at 18.00 and Fed's Kashkari speaks at 19.00.
Economic and market news
What happened overnight
The Reserve Bank of Australia chose to keep interest rates unchanged in line with markets' expectation. The central bank revised down its growth outlook citing lower consumer spending due to inflation and higher interest rates feeding into consumers' mortgage rates. They also underlined the risk of weak Chinese consumption affecting Australian exports. The central bank however said demand was still outstripping supply, hence they were not in a rush to cut rates, and "a further increase in interest rates cannot be ruled out".
In Japan, the average wage growth for December came in at 1.0% y/y. November's print had been revised up from 0.2% to 0.7% y/y, hence December showed stronger growth, albeit lower than the 1.3% expected by consensus. Wage growth is key to the outlook for the Bank of Japan's (BoJ) monetary policy and possible tightening. But we expect we will probably have to wait until spring wage negotiations for wages to start moving much higher. The debate on ending negative rates intensified in December according to a summary of opinions from the BoJ's December meeting.
In the commodity space, the ICE Front Month Brent contract trades at USD78.16/bbl slightly up from its closing price in yesterday's session.
What happened yesterday
In the US, ISM Services Index for January surprised to the upside. The PMI came in at 53.4 (prior 50.6), which compares to a Reuters poll showing consensus expectations of 52.0. The Prices Paid, New Orders, and Employment Index also all came in higher than December's print. The upside surprise in the ISM Services Index aligns with how most recent US data releases have surprised to the upside.
The OECD updated its outlook to global growth revising up its 2024 outlook to 2.9% from the 2.7% it expected in its November outlook. The organisation left its 2025 outlook for global growth unchanged at 3.0%.
In the euro area, the Sentix investor confidence rose to its highest level in 10 months. Given how the Sentix is the first sentiment indicator for February, the rise could signal improvements in other sentiment indicators to be released this month. The Producer Price Index fell 0.8% m/m in December in line with expectations. The biggest contributor to this drop came from energy prices which fell 2.4% m/m.
In Germany, the government announced it had agreed on earmarking subsidies worth EUR16bn for gas plants to switch to hydrogen.
In Sweden, the Service PMI for January came in at 51.8 thus rising from December's print at 50.0. This marks a firm entry into expansionary territory for the service sector that is the biggest sector in Sweden.
Bank of England Chief Economist Huw Pill was cited for saying it was a question of 'when, not if' when it came to rate cuts by the BoE. Pill, a voting member on the Monetary Policy Committee, did however stress he needed to see further evidence that underlying inflation components had weakened before he would vote for any rate cuts.
Equities: Global equities were down yesterday as the central bank reprising took its toll on the equity optimism. However, as the reprising owes to a stronger growth outlook it has a limited negative effect. Likewise, cyclicals kept up with defensives and tech stocks outperformed together with health care. If anything, the biggest surprise is to see quality growth stocks doing so strong despite the massive lift to yields we have seen lately. Not surprisingly, small caps struggled, and higher yields once again fuelled the fear in heavy-indebted sectors such as REITs and utilities. Materials were also one of the laggards, but this is just as much a China story and not yet feeling the support after massive Chinese policy stimulus. In US yesterday Dow -0.7%, S&P 500 -0.3%, Nasdaq -0.2% and Russell 2000 -1.3%. We see a very mixed picture in Asia this morning. Most markets are following the slight risk-off tone from Wall Street yesterday while Chinese markets are massively higher in a volatile session after yet another round of policy support for financial markets. Futures in Europe are higher while mixed in US.
FI: The repricing of global central banks continues as interest rates rise and we have taken out a rate cut from both the Federal Reserve and the ECB since Monday last week. Hence, 10Y US Treasury yields have risen almost 30bp and 10Y Bunds have risen almost 25bp since early last week. Furthermore, the new issuance wave continues as well with issuance in the long end of the curve. January 2024 set a record in the European market with a combined issuance of SSA, FIG and corporate bonds of EUR 350bn relative to EUR 290bn in 2023 (which was the previous record). This is also putting pressure on the global bond market, where we have seen a bearish steepener.
FX: US yields advanced further, pushing the greenback higher yesterday. Overnight, both Chinese stimulus and the unchanged RBA decision help short up AUD. Scandies, that suffered yesterday found some support overnight. After a strong start to the year, GBP has retreated somewhat at the start of February.
AUD/USD Daily Report
Daily Pivots: (S1) 0.6461; (P) 0.6491; (R1) 0.6513; More...
Intraday bias in AUD/USD is turned neutral with current recovery. But further decline is expected as long as 0.6621 resistance holds. Break of 0.6468 will resume the fall from 0.6870, as part of the down trend from 0.7156, to 61.8% projection of 0.6870 to 0.6524 from 0.6621 at 0.6407 next.
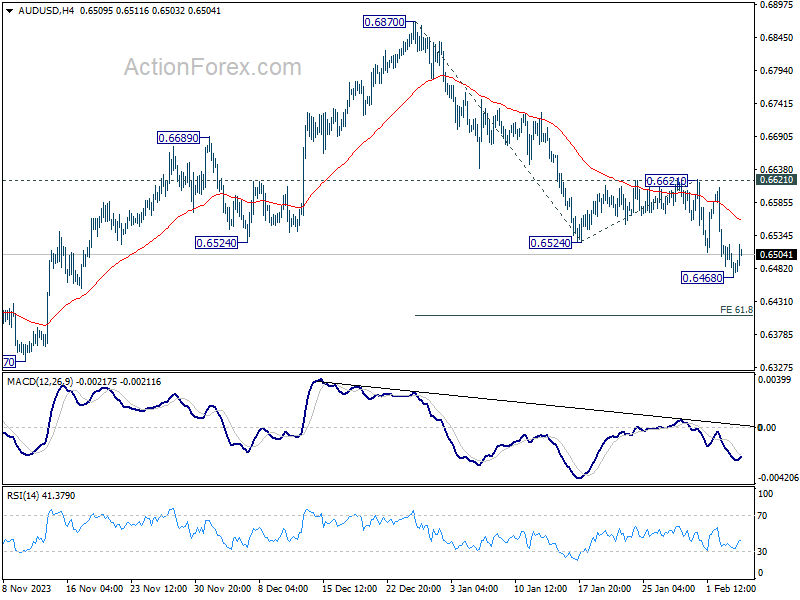
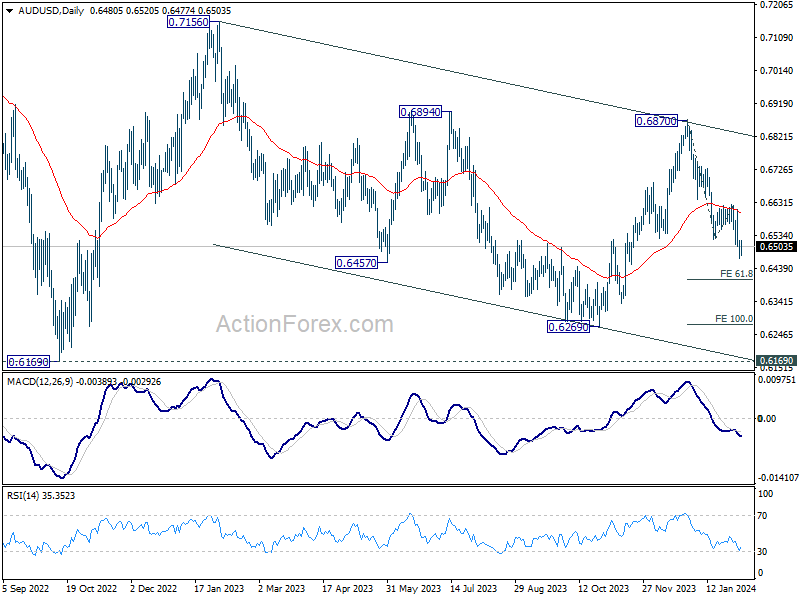
In the bigger picture, price actions from 0.6169 (2022 low) are seen as a medium term corrective pattern to the down trend from 0.8006 (2021 high). Fall from 0.7156 (2023 high) is seen as the second leg, which might still be in progress. Overall, sideway trading could continue in range of 0.6169/7156 for some more time. But as long as 0.7156 holds, an eventual downside breakout would be mildly in favor.
Aussie Recovers with RBA Hold and China Stocks Rally, But Momentum Tepid
Australian Dollar recovered mildly today, but momentum is so far limited. While RBA softened the hawkish stances after standing pat on rates, the left is still left open for more tightening. Governor Michele Bullock emphasized in the post-meeting press conference that the inflationary battle is far from won, while the board would keep this option on the table.
Aussie's buoyancy was also bolstered by the strong rebound in Chinese and Hong Kong stock markets. A notable boost in investor confidence came from Central Huijin Investment, a subsidiary of China's sovereign wealth fund, which announced its intention to increase investments in ETFs linked to major stock indices, aiming at market stabilization.
Within the broader currency spectrum, New Zealand Dollar the Canadian Dollar have also shown strength, albeit trailing Australian Dollar. US Dollar, on the other hand, has seen a broad but modest retreat, retaining a significant portion of its gains from the week. Meanwhile, European majors and Yen are finding themselves on the weaker side.
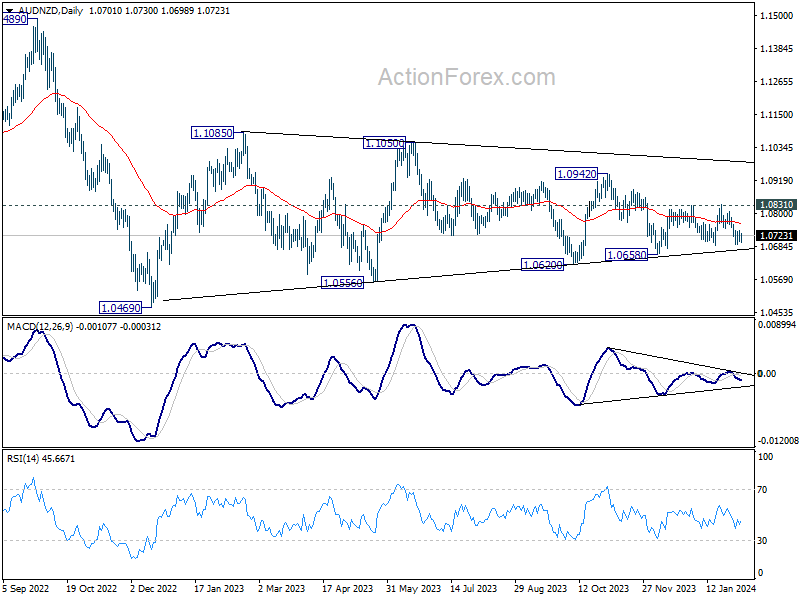
Technically, AUD/NZD is bounded in very tight range despite today's recovery. The picture suggests that underlying momentum of Aussie remains weak. With the crosses trading below 55 D EMA, risk is mildly on the downside. Break of 1.0658 support would revive near term bearishness through 1.0620 support, possibly to 1.0469 low.
In Asia, at the time of writing, Nikkei is down -0.26%. Hong Kong HSI is up 3.80%. China Shanghai SSE is up 3.58%. Singapore Strait Times is down -0.28%. Japan 10-year JGB yield is down -0.0008 at 0.720. Overnight, DOW dropped -0.71%. S&P 500 dropped -0.32%. NASDAQ dropped -0.20%. 10-year yield rose 0.131 to 4.164.
RBA stands pat, eases hawkish stance without shifting to neutral
RBA maintained cash rate target at 4.35%, aligning with broad market expectations. The hawkish stance has seen a slight moderation, with the acknowledgment that "a further increase in interest rates cannot be ruled out," hinting at a cautious approach rather than a definitive shift towards a neutral bias.
The updated economic forecasts paint a picture of gradual moderation in inflation pressures. Headline CPI is expected to decelerate from 4.1% at the end of 2023 to 3.2% by the close of 2024, reaching 2.8% at the end of 2025, and further softening to 2.6% by mid-2026.
Trimmed mean CPI mirrors this downward trend, projected to ease from 4.2% at the end of 2023 to 3.1% by the end of 2024, and gradually declining to 2.8% by December 2024, and then 2.6% by June 2026.
Additionally, RBA's outlook for cash rate assumes a decrease to 3.9% by the end of 2024, followed by a further reduction to 3.4% by the end of 2025, and eventually reaching 3.2% by mid-2026. This assumption aligns with the expectations derived from surveys of professional economists and financial market pricing.
On the growth front, RBA projects a modest GDP expansion of 1.8% in 2024, with an improvement to 2.3% in 2025.
Japan's labor cash earnings rises 1% yoy, with regular Pay at fastest pace since May
Japan saw a modest improvement in labor cash earnings in labor cash earnings, which increased by 1.0% yoy, accelerating from November's 0.7% gain. Despite this uptick, the growth fell short of anticipated 1.3% yoy.
A notable positive development was observed in regular pay, which rose by 1.6% yoy, marking the highest reading since May 2023. Additionally, special payments saw a marginal increase of 0.5% yoy, although overtime pay experienced a decline of -0.7% yoy.
With CPI standing at 3.0% yoy, real wages saw a decline of -1.9% yoy, albeit at a slower pace compared to -2.5% yoy observed in the previous month. This marks the slowest decline in real wages since June 2023, suggesting a slight easing in the pressure on household incomes.
However, this positive note is tempered by the latest household spending figures, which saw a -2.5% yoy drop, worse than the expected -2.1% yoy.
BoE's Pill: Rate reductions now a question of timing
BoE Chief Economist Huw Pill highlighted, in an online event overnight, a shift in BoE's monetary policy discussions, which has evolved to determining "when" rather than "if" it will be appropriate to commence reductions in the Bank Rate.
Pill pointed out that rate reductions is currently "premature." However, he suggested that the Bank does not require inflation to fully revert to its 2% target before easing monetary policy, given its current restrictive stance.
The Chief Economist also cautioned that due to developments in the Middle East, inflation is slightly more likely to "surprise on the upside than the downside" over the next year to 18 months. This perspective justifies to "to maintain restriction in the economy for some time". This scenario would warrant maintaining "for longer" or even increasing the restrictive nature of monetary policy to combat "second round effects".
Yet, Pill also left room for optimism, suggesting that if inflation dynamics dissipate more quickly than anticipated, there could be scope for more rapid interest rate reductions.
Looking ahead
Germany factory orders, UK construction PMI and Eurozone retail sales will be released in European session. Later in the day, Canada will release building permits and Ivey PMI.
AUD/USD Daily Report
Daily Pivots: (S1) 0.6461; (P) 0.6491; (R1) 0.6513; More...
Intraday bias in AUD/USD is turned neutral with current recovery. But further decline is expected as long as 0.6621 resistance holds. Break of 0.6468 will resume the fall from 0.6870, as part of the down trend from 0.7156, to 61.8% projection of 0.6870 to 0.6524 from 0.6621 at 0.6407 next.
In the bigger picture, price actions from 0.6169 (2022 low) are seen as a medium term corrective pattern to the down trend from 0.8006 (2021 high). Fall from 0.7156 (2023 high) is seen as the second leg, which might still be in progress. Overall, sideway trading could continue in range of 0.6169/7156 for some more time. But as long as 0.7156 holds, an eventual downside breakout would be mildly in favor.
Economic Indicators Update
| GMT | Ccy | Events | Actual | Forecast | Previous | Revised |
|---|---|---|---|---|---|---|
| 23:30 | JPY | Labor Cash Earnings Y/Y Dec | 1.00% | 1.30% | 0.70% | |
| 23:30 | JPY | Household Spending Y/Y Dec | -2.50% | -2.10% | -2.90% | |
| 03:30 | AUD | RBA Interest Rate Decision | 4.35% | 4.35% | 4.35% | |
| 04:30 | AUD | RBA Press Conference | ||||
| 07:00 | EUR | Germany Factory Orders M/M Dec | 0.30% | 0.30% | ||
| 09:30 | GBP | Construction PMI Jan | 47.2 | 46.8 | ||
| 10:00 | EUR | Eurozone Retail Sales M/M Dec | -1.30% | -0.30% | ||
| 13:30 | CAD | Building Permits M/M Dec | 1.20% | -3.90% | ||
| 15:00 | CAD | Ivey PMI Jan | 55 | 56.3 |
Technical Outlook and Review
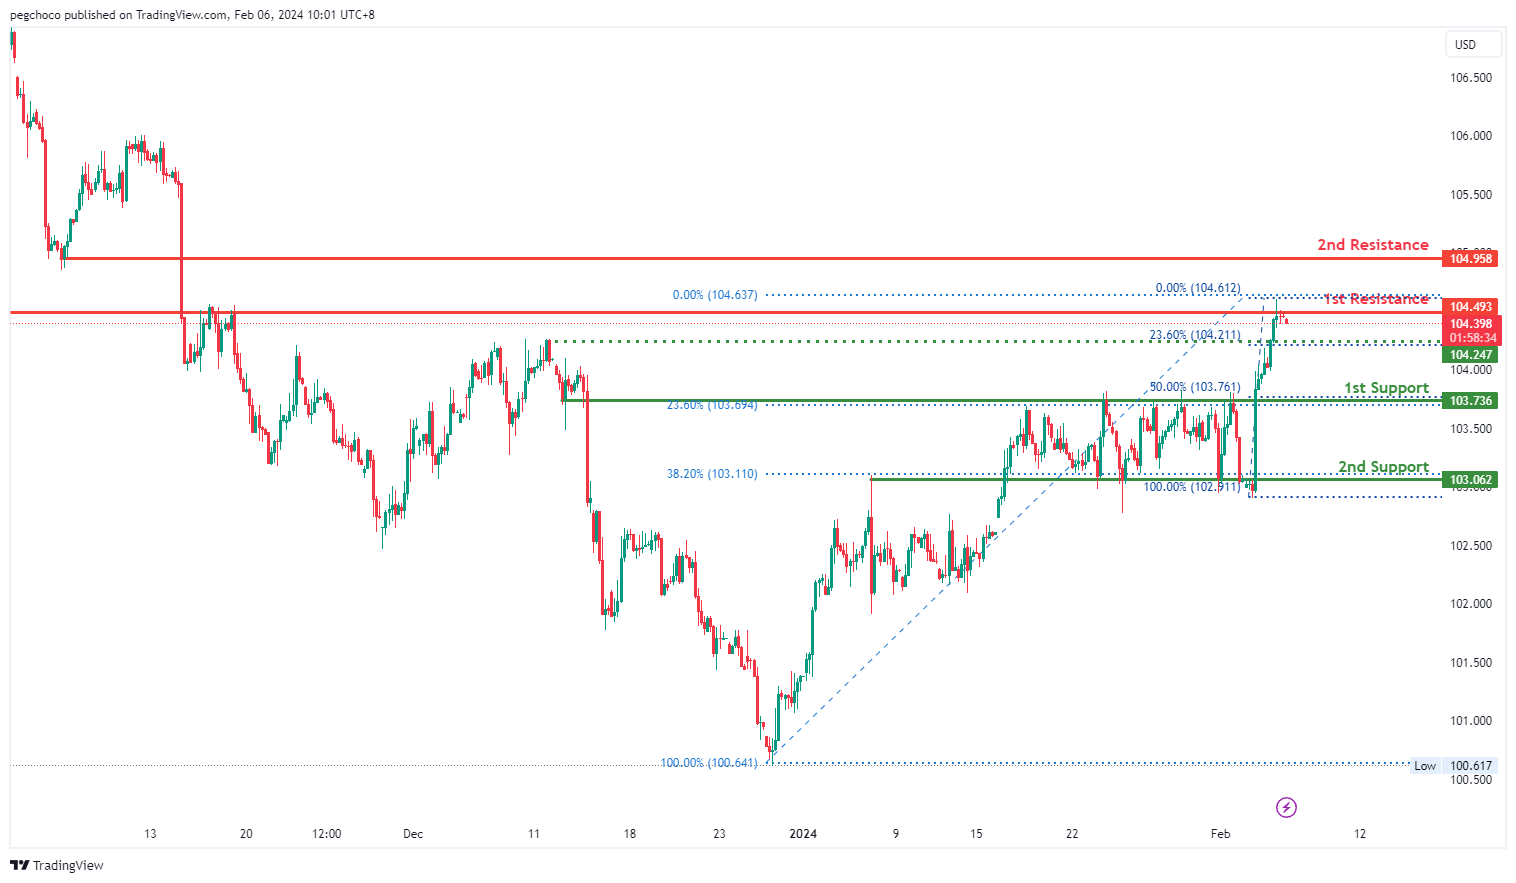
DXY:
The DXY chart currently exhibits a bearish overall momentum, indicating a downward trend. According to the analysis, the price could potentially experience a bearish reaction off the 1st resistance and drop towards the 1st support.
The 1st support level at 103.73 is identified as a pullback support, and it is reinforced by the presence of both the 50% and 23.60% Fibonacci Retracement levels. This indicates strong confluence at this level, making it a significant potential support zone.
There is also a 2nd support level at 103.06, characterized as another pullback support and associated with the 23.60% Fibonacci Retracement. This further emphasizes its importance as a potential support area.
On the resistance side, the 1st resistance level at 104.49 is categorized as an overlap resistance, indicating that it represents a historical point where the price has encountered resistance.
Additionally, there is a 2nd resistance level at 104.95, identified as a pullback resistance.
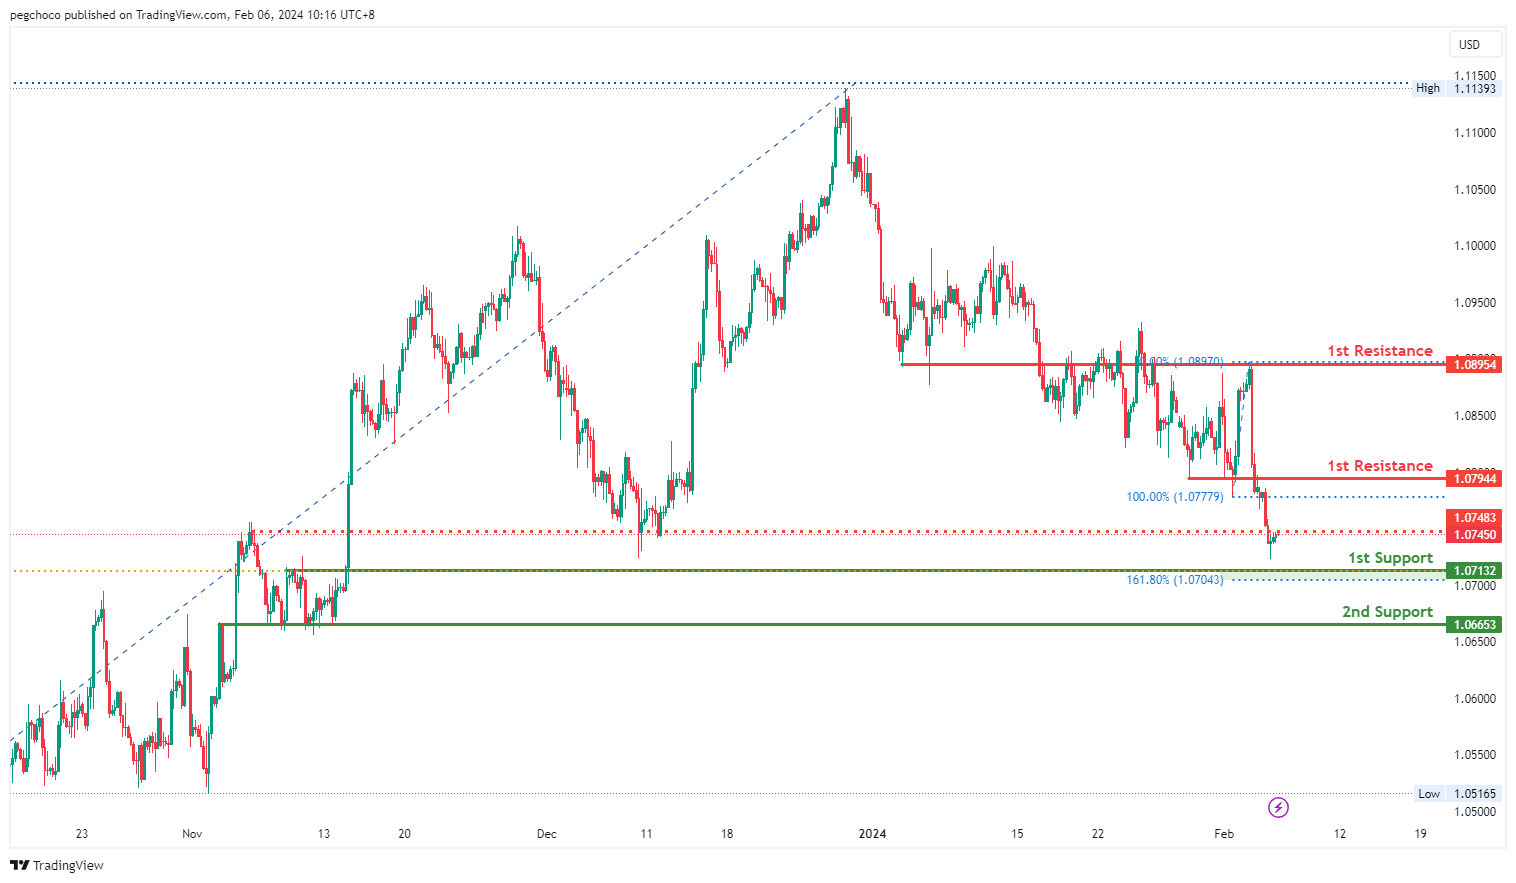
EUR/USD:
The EUR/USD chart currently exhibits a bearish overall momentum, indicating a downward trend. According to the analysis, the price could potentially rise towards the 1st resistance in the short term before reversing off it and dropping towards the 1st support.
The 1st support level at 1.0713 is characterized as a pullback support and is reinforced by the presence of the 161.80% Fibonacci Extension. This suggests that it has historical significance and could potentially act as a strong support level where buying interest may emerge.
There is also a 2nd support level at 1.0665, identified as an overlap support, which adds to its importance as a potential support zone.
On the resistance side, the 1st resistance level at 1.0794 is categorized as an overlap resistance, indicating that it represents a historical point where the price has encountered resistance in the past.
Additionally, there is a 2nd resistance level at 1.0895, identified as another overlap resistance.
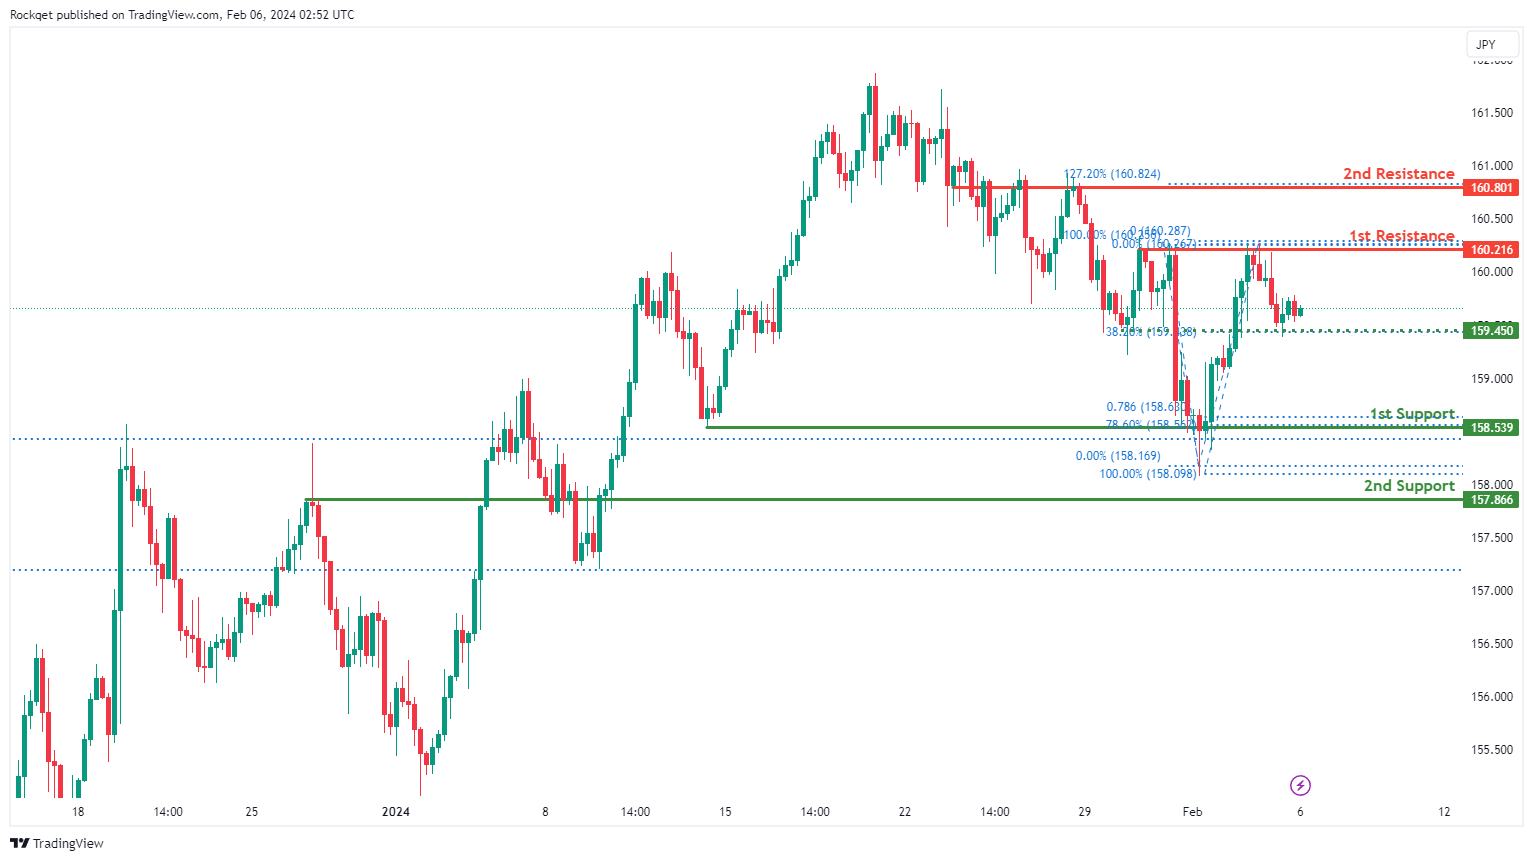
EUR/JPY:
The EUR/JPY chart currently exhibits a bearish overall momentum, indicating a prevailing downward trend. Several factors contribute to this bearish sentiment, supporting the potential for continued downward movement in the price.
The 1st support at 158.539 is considered favorable for various reasons. It is identified as a pullback support and aligns with the 78.60% Fibonacci Retracement and the 78.60% Fibonacci Projection, suggesting a historical level where buying interest has previously emerged.
The 2nd support at 157.866 is recognized as an overlap support, providing additional strength to the potential support zone.
An intermediate support level at 159.45 is identified, aligning with a pullback support and the 38.20% Fibonacci Retracement.
On the resistance side, the 1st resistance at 160.216 is highlighted as a level where selling pressure may emerge, representing a pullback resistance.
The 2nd resistance at 160.801 is also recognized, coinciding with an overlap resistance and the 127.20% Fibonacci Extension, adding further significance to this resistance level.
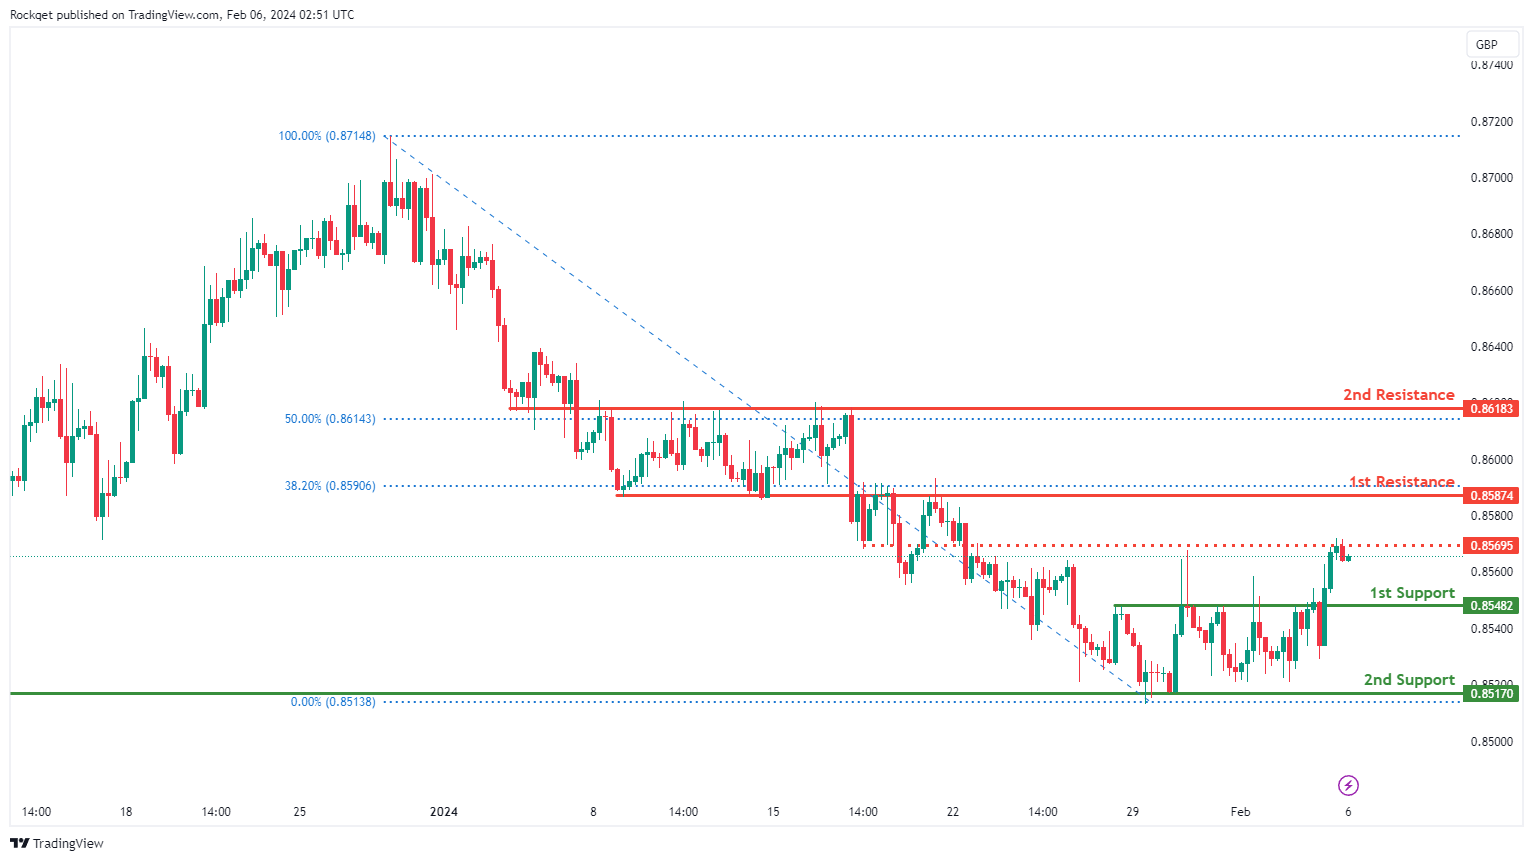
EUR/GBP:
The EUR/GBP chart currently exhibits a bearish overall momentum, indicating a prevailing downward trend. Several factors contribute to this bearish sentiment, supporting the potential for continued downward movement in the price.
The 1st support at 0.85482 is considered favorable for various reasons. It is identified as a pullback support, suggesting a historical level where buying interest has previously emerged.
The 2nd support at 0.85170 is recognized as multi-swing low support, adding additional significance to the potential support zone.
On the resistance side, the 1st resistance at 0.85874 is highlighted as a level where selling pressure may emerge, representing an overlap resistance and coinciding with the 38.20% Fibonacci Retracement.
The 2nd resistance at 0.86183 is also recognized, aligning with an overlap resistance and the 50% Fibonacci Retracement, providing further strength to this resistance level. An intermediate resistance level at 0.85695 is identified, representing an overlap resistance.
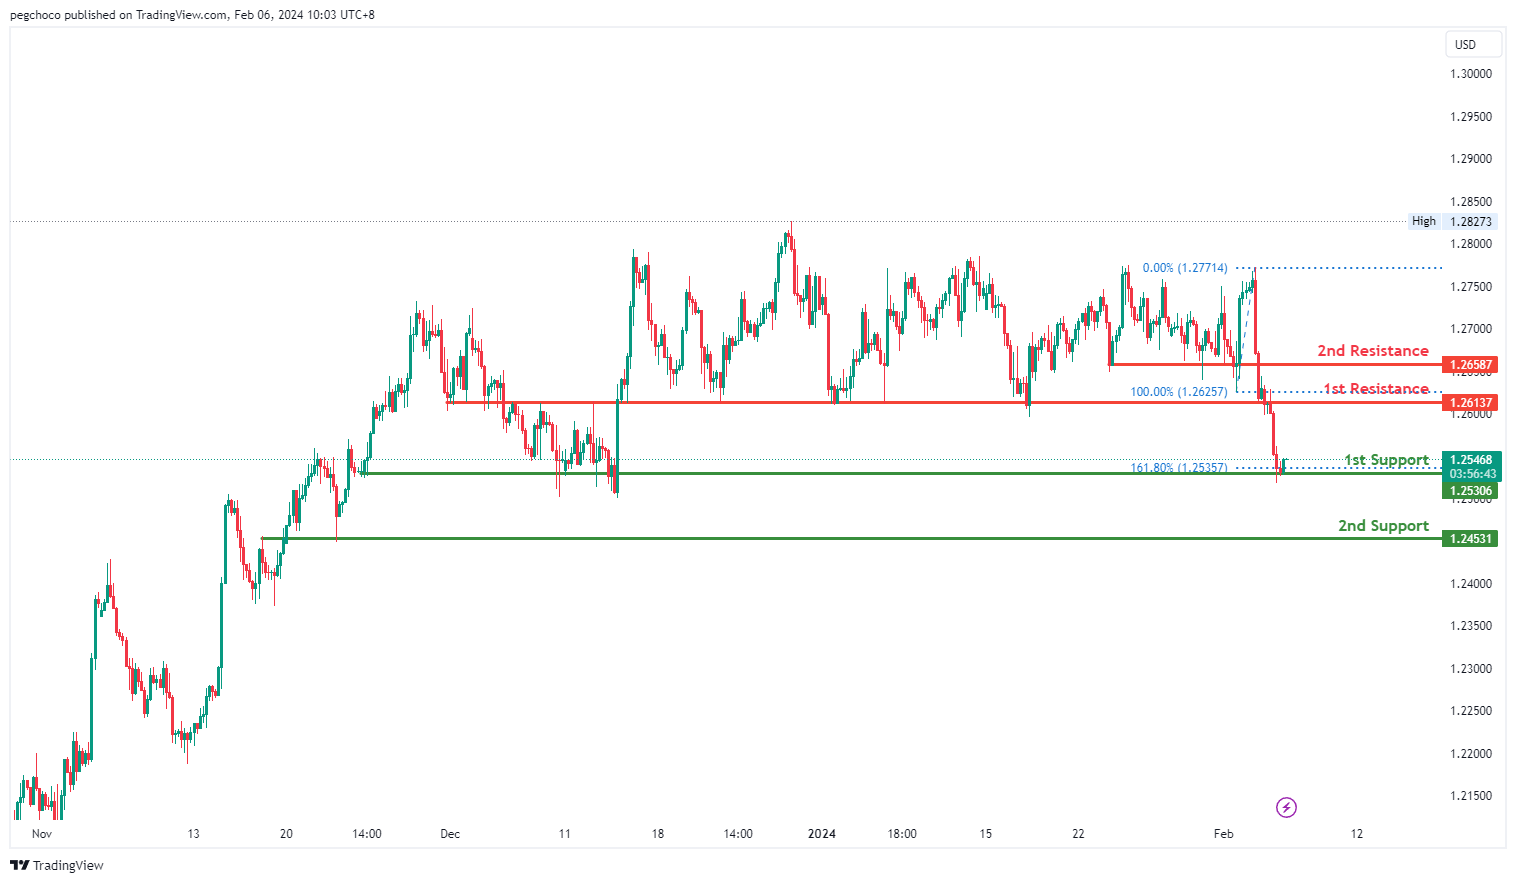
GBP/USD:
The GBP/USD chart currently exhibits a bearish overall momentum, indicating a downward trend. According to the analysis, the price could potentially rise towards the 1st resistance in the short term before reversing off it and dropping towards the 1st support.
The 1st support level at 1.2530 is identified as a multi-swing low support and is reinforced by the presence of the 161.80% Fibonacci Extension. This suggests that it has historical significance and could potentially act as a strong support level where buying interest may emerge.
There is also a 2nd support level at 1.2453, characterized as an overlap support, which adds to its importance as a potential support zone.
On the resistance side, the 1st resistance level at 1.2613 is categorized as a pullback resistance, indicating that it represents a point where the price has encountered resistance in the past.
Additionally, there is a 2nd resistance level at 1.2658, identified as another pullback resistance.
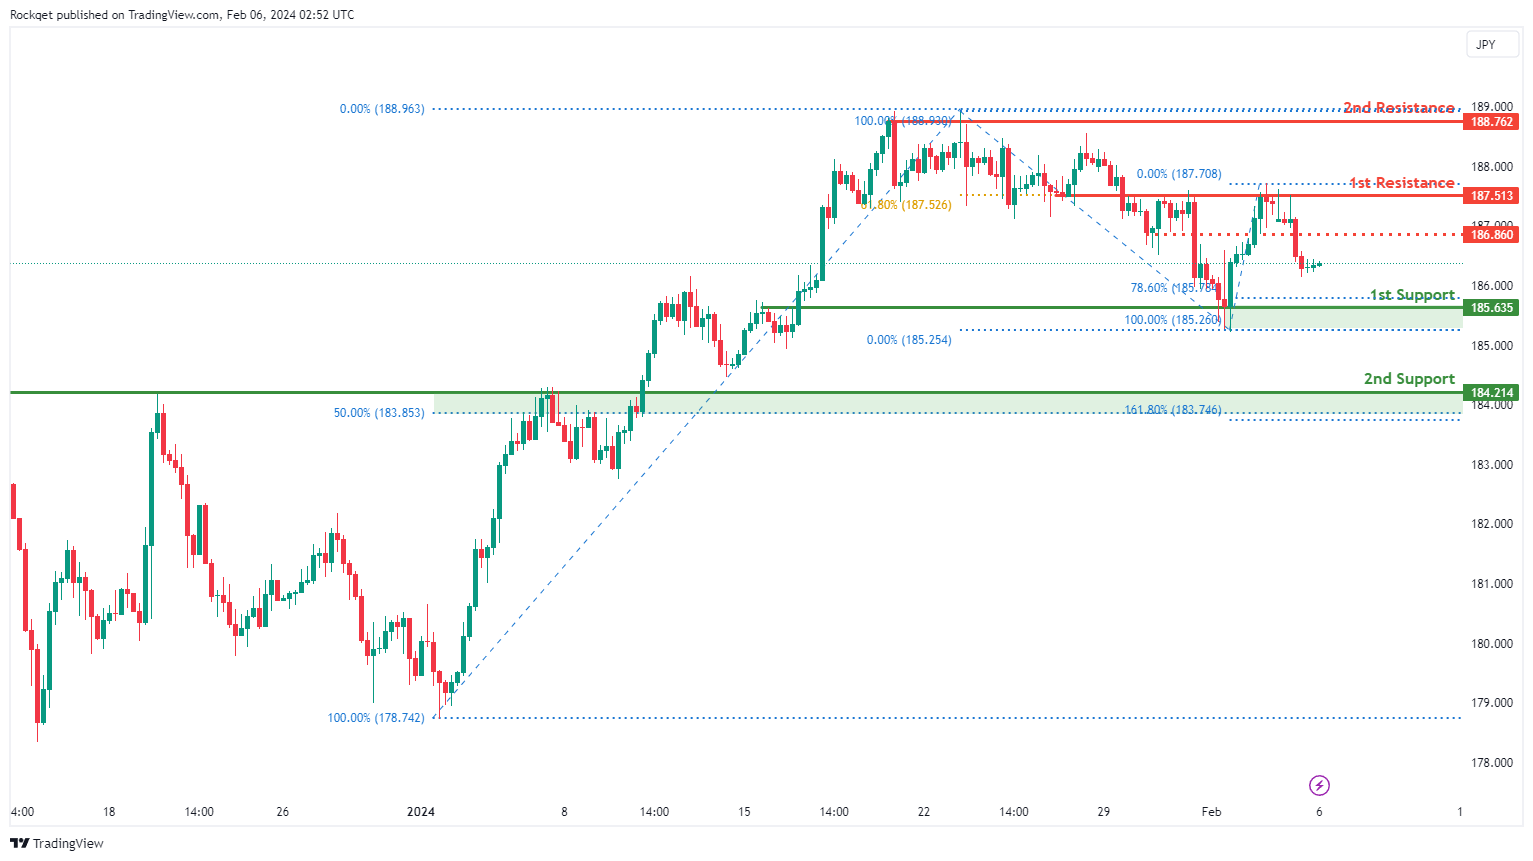
GBP/JPY:
The GBP/JPY chart currently demonstrates a bearish overall momentum, indicating a prevailing downward trend. Several factors contribute to this bearish sentiment, supporting the potential for continued downward movement in the price.
The 1st support at 185.635 is considered favorable for various reasons. It is identified as an overlap support and coincides with the 78.60% Fibonacci Retracement, suggesting a historical level where buying interest has previously emerged.
The 2nd support at 184.214 is also recognized as an overlap support, aligning with the 50% Fibonacci Retracement and the 161.80% Fibonacci Extension, providing additional strength to the potential support zone.
On the resistance side, the 1st resistance at 187.513 is highlighted as a level where selling pressure may emerge. It represents an overlap resistance and coincides with the 61.80% Fibonacci Retracement.
The 2nd resistance at 188.762 is also recognized, representing a swing high resistance.An intermediate resistance level at 186.86 is identified, aligning with an overlap resistance.
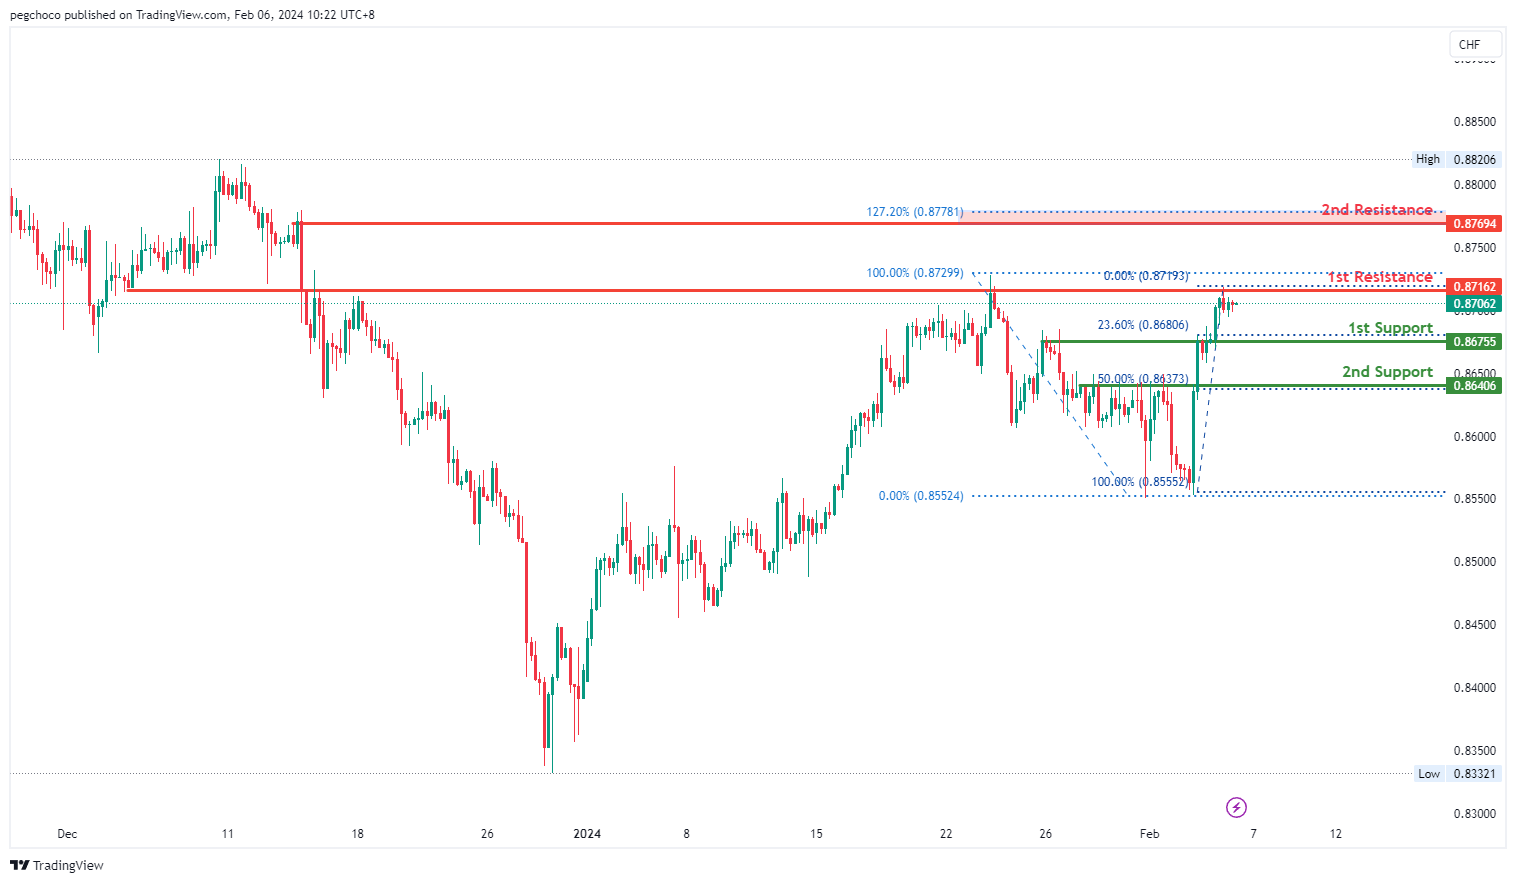
USD/CHF:
The USD/CHF chart currently exhibits a bullish overall momentum, indicating an upward trend. According to the analysis, the price could potentially drop further to the 1st support in the short term before bouncing from there and rising to the 1st resistance.
The 1st support level at 0.8675 is identified as a pullback support and is reinforced by the presence of the 23.60% Fibonacci Retracement. This suggests that it has historical significance and could potentially act as a strong support level where buying interest may emerge.
There is also a 2nd support level at 0.8640, characterized as another pullback support with the 50% Fibonacci Retracement, further emphasizing its importance as a potential support zone.
On the resistance side, the 1st resistance level at 0.8716 is categorized as an overlap resistance, indicating that it represents a historical point where the price has encountered resistance in the past.
Additionally, there is a 2nd resistance level at 0.8769, identified as a swing high resistance with the presence of the 127.20% Fibonacci Extension.
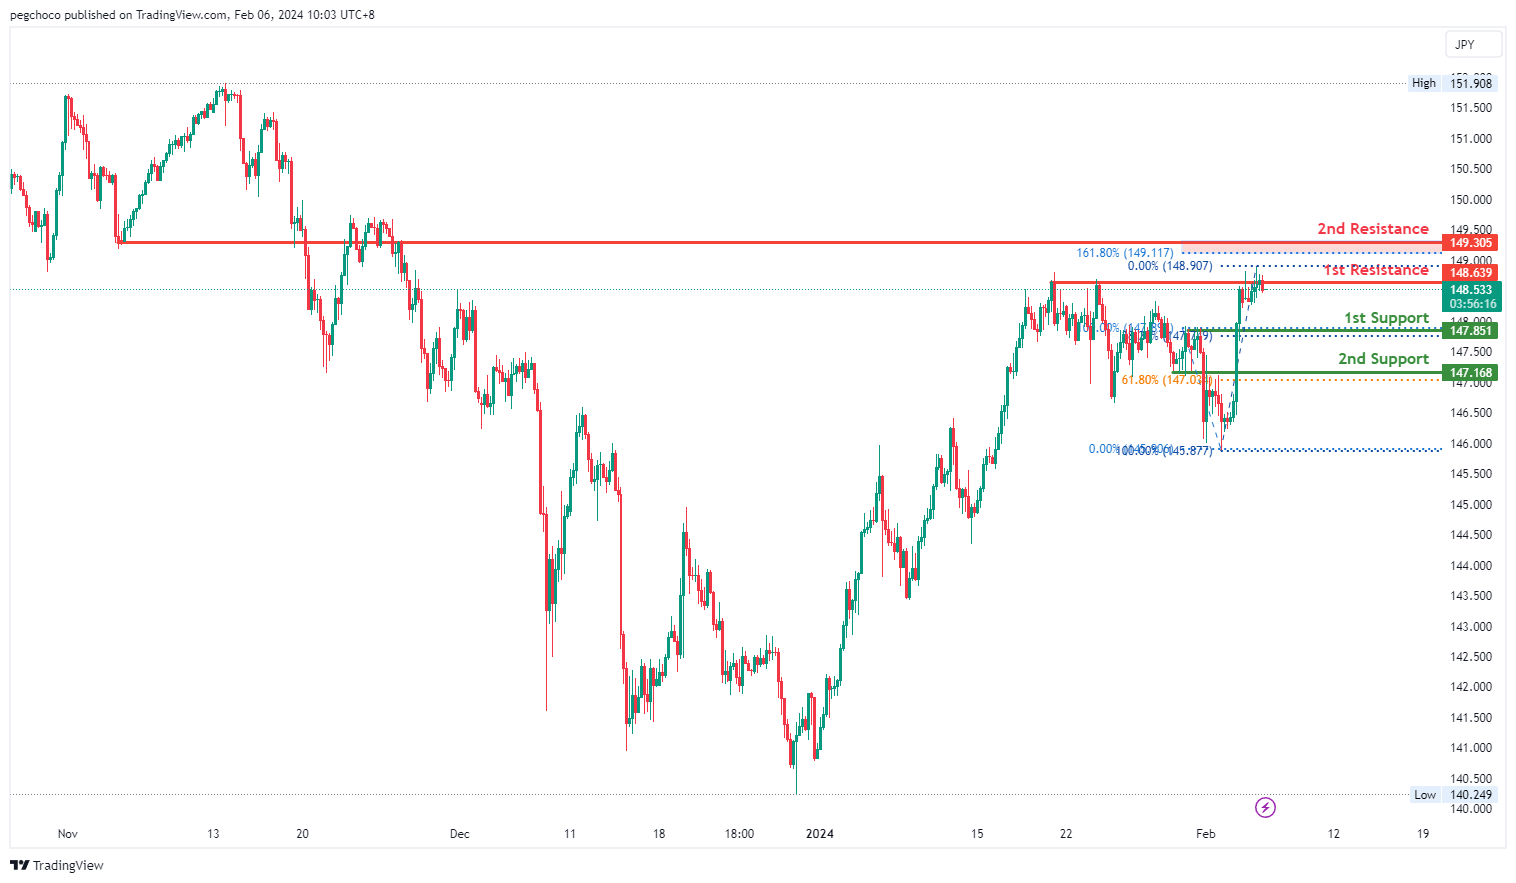
USD/JPY:
The USD/JPY chart currently exhibits a bearish overall momentum, indicating a downward trend. According to the analysis, the price could potentially experience a bearish reaction off the 1st resistance and drop to the 1st support.
The 1st support level at 147.85 is identified as a pullback support and is reinforced by the presence of the 38.20% Fibonacci Retracement. This suggests that it has historical significance and could potentially act as a strong support level where buying interest may emerge.
There is also a 2nd support level at 147.16, characterized as another pullback support with the 61.80% Fibonacci Retracement, further emphasizing its importance as a potential support zone.
On the resistance side, the 1st resistance level at 148.63 is categorized as a multi-swing high resistance, indicating that it represents a historical point where the price has encountered resistance in the past.
Additionally, there is a 2nd resistance level at 149.30, identified as an overlap resistance with the presence of the 161.80% Fibonacci Extension.
USD/CAD:
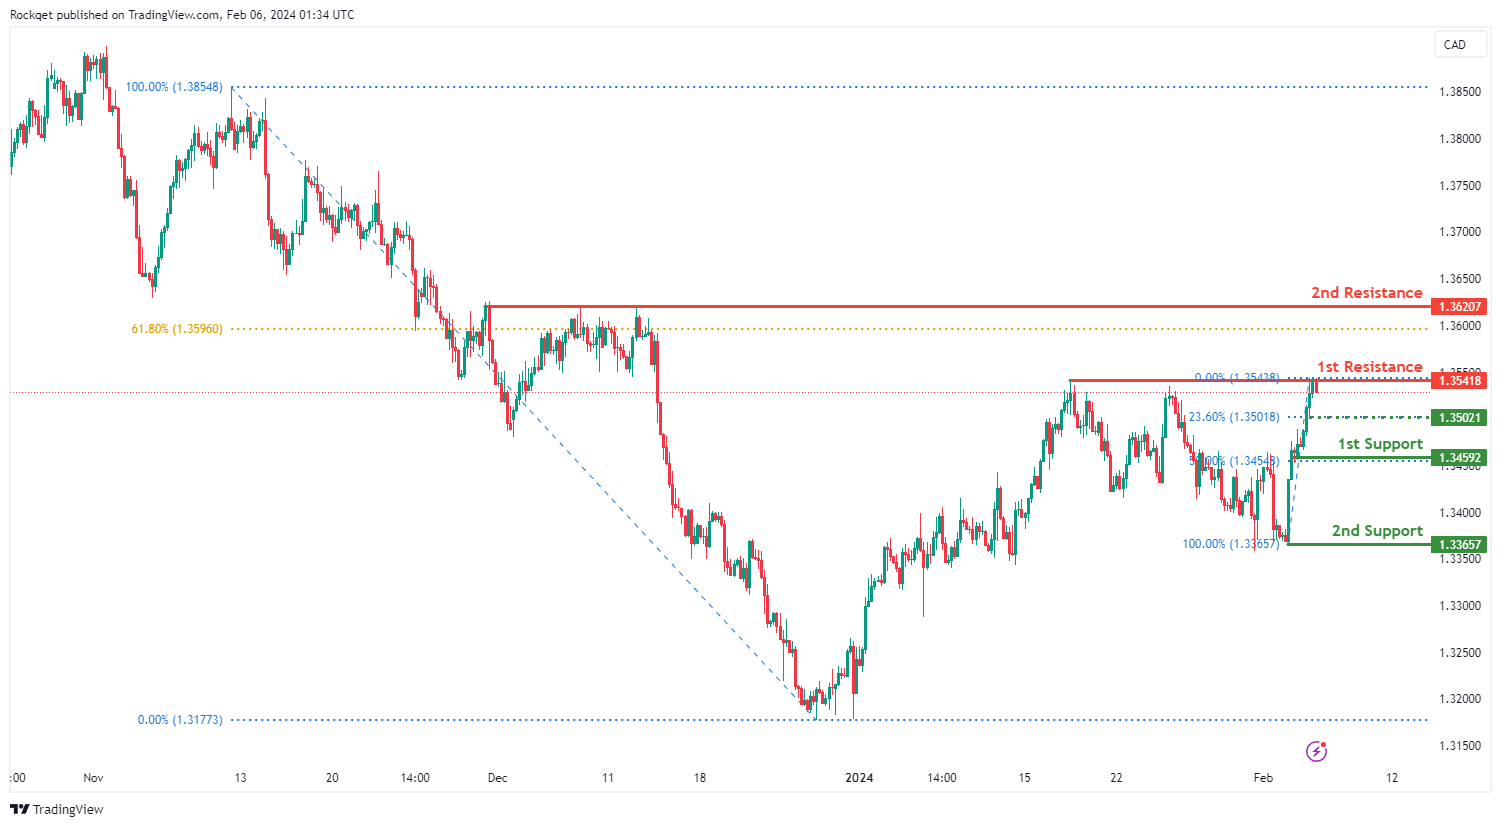
The USD/CAD chart currently exhibits an overall bullish momentum. However, there is a potential scenario for price to make a bearish reaction off the 1st resistance and drop towards the intermediate support.
The intermediate support level at 1.3502 is identified as a pullback support that aligns with the 23.60% Fibonacci Retracement level while the 1st support level at 1.3459 is also noted as a pullback support that aligns with the 50.00% Fibonacci Retracement level. Further below, the 2nd support level at 1.3365 is marked as a swing-low support, further emphasizing its importance as a potential support zone.
To the upside, the 1st resistance level at 1.3541 is identified as a pullback resistance. Higher up, the 2nd resistance level at 1.3620 is also noted as a pullback resistance that aligns close to the 61.80% Fibonacci Retracement level, further highlighting its importance as a potential resistance point.
AUD/USD:
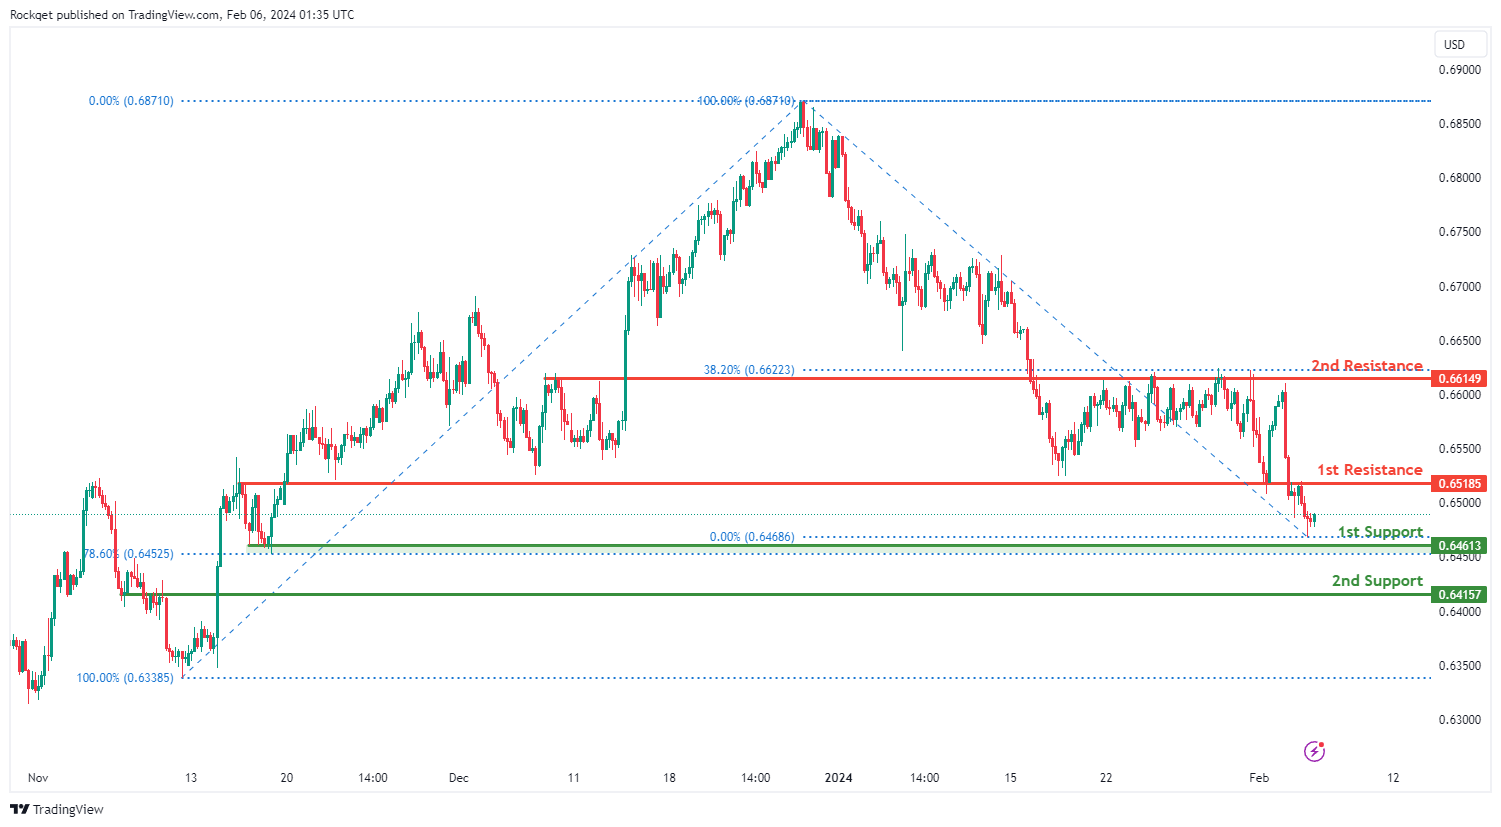
The AUD/USD chart currently exhibits an overall bearish momentum. In this context, there is a potential scenario for price to fall towards the 1st support.
The 1st support level at 0.6461 is identified as a pullback support that aligns close to the 78.60% Fibonacci Retracement level. Further below, the 2nd support level at 0.6415 is noted as an overlap support, further emphasizing its importance as a potential support zone.
To the upside, the 1st resistance level at 0.6518 is identified as an overlap resistance. Higher up, the 2nd resistance level at 0.6614 is marked as a pullback resistance that aligns close to the 38.20% Fibonacci Retracement level, further highlighting its importance as a potential resistance point.
NZD/USD
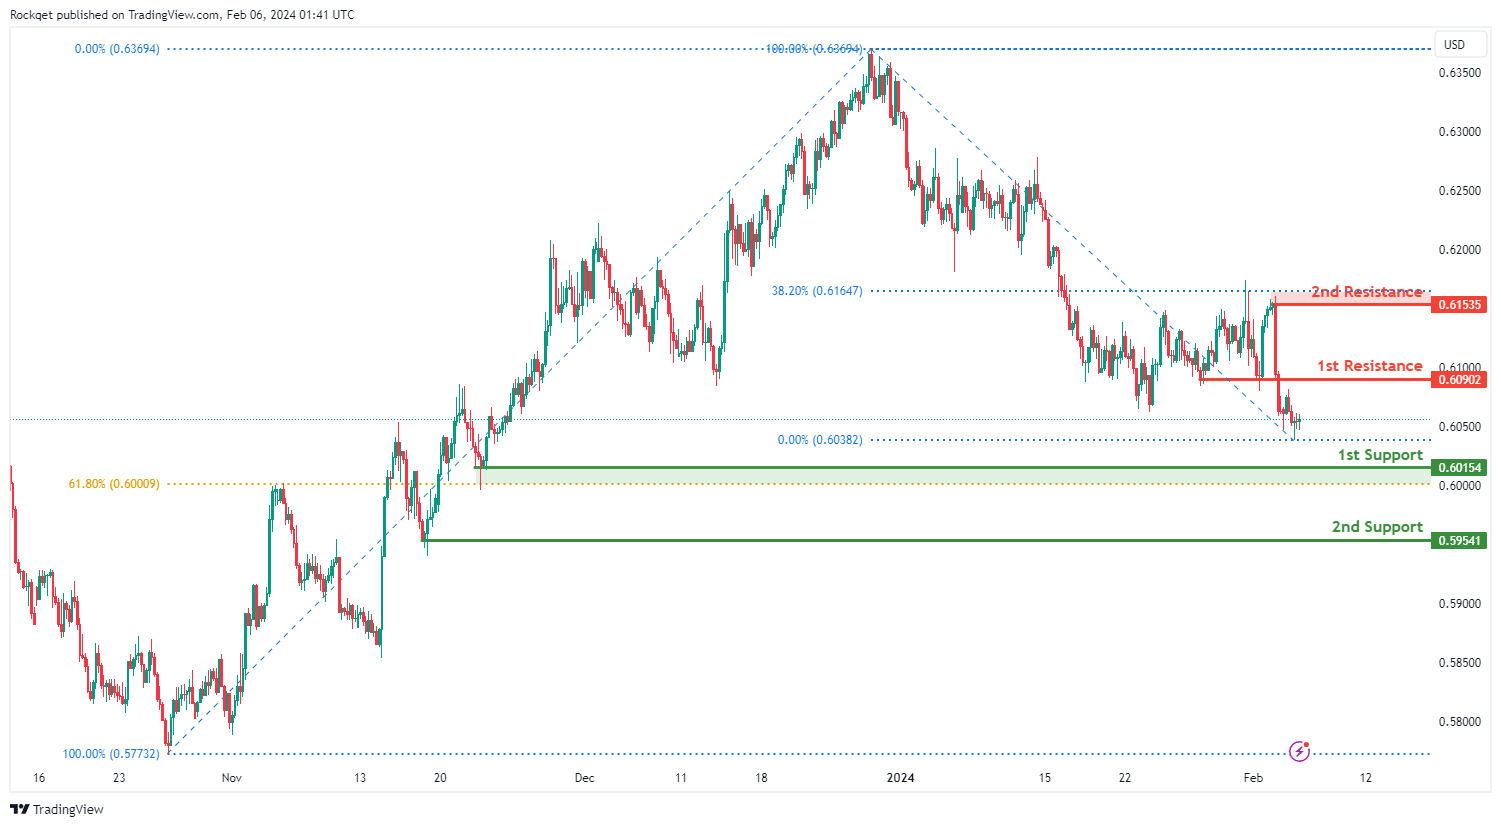
The NZD/USD chart currently exhibits an overall bearish momentum. In this context, there is a potential scenario for price to fall towards the 1st support.
The 1st support level at 0.6015 is identified as a pullback support that aligns close to the 61.80% Fibonacci Retracement level. Further below, the 2nd support level at 0.5954 is also noted as a pullback support, further emphasizing its importance as a potential support zone.
To the upside, the 1st resistance level at 0.6090 is identified as a pullback resistance. Higher up, the 2nd resistance level at 0.6153 is also marked as a pullback resistance that aligns close to the 38.20% Fibonacci Retracement level, further highlighting its importance as a potential resistance point.
DJ30:
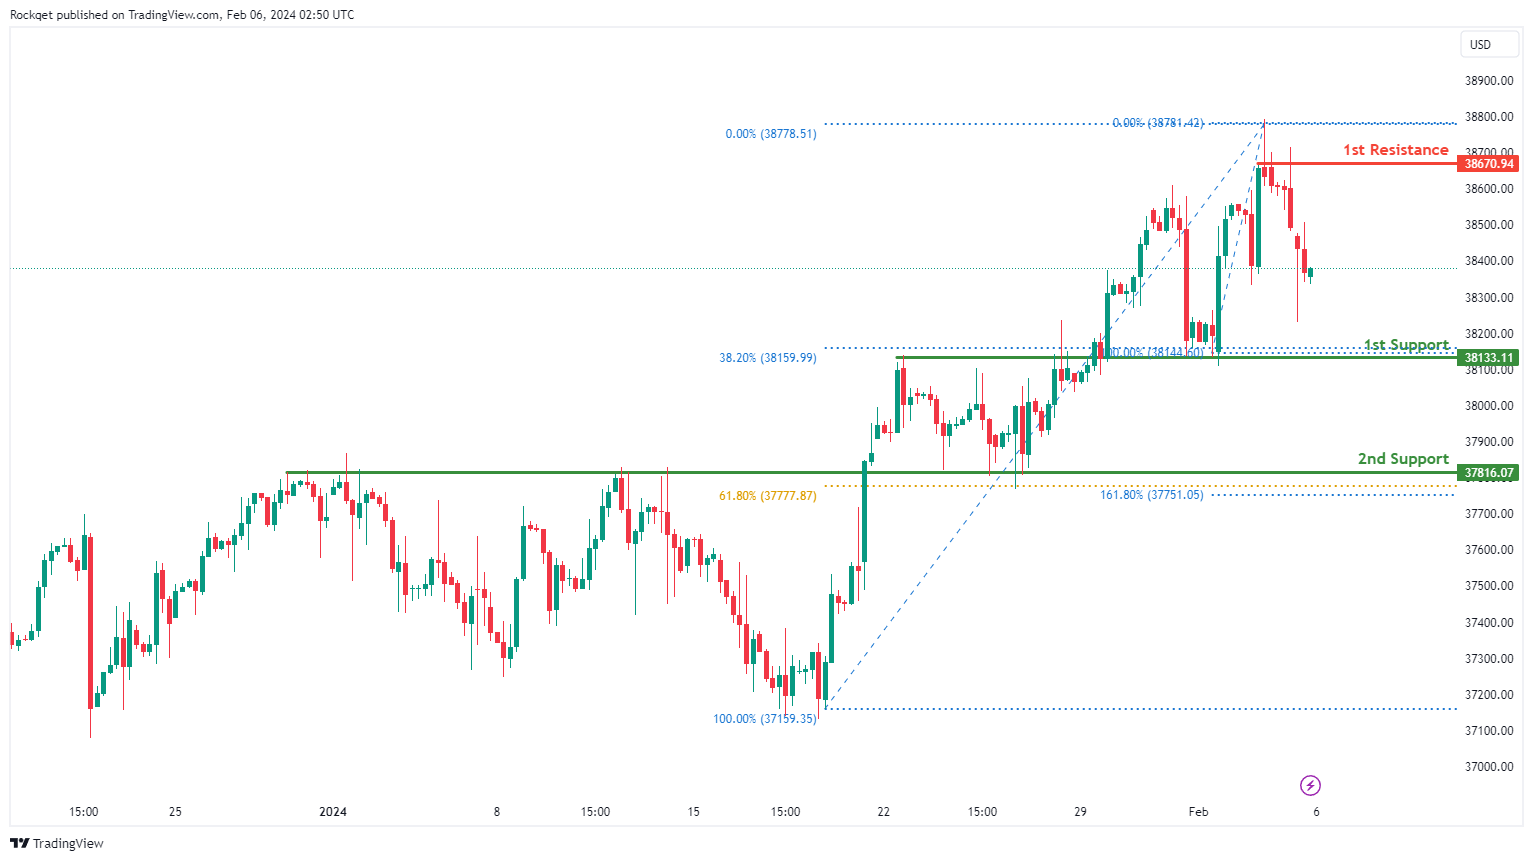
The DJ30 chart currently exhibits a bearish overall momentum, indicating a prevailing downward trend. Several factors contribute to this bearish sentiment, supporting the potential for continued downward movement in the price.
The 1st support at 38133.11 is considered favorable for various reasons. It is identified as an overlap support and aligns with the 38.20% Fibonacci Retracement, suggesting a historical level where buying interest has previously emerged.
The 2nd support at 37816.07 is also recognized as an overlap support, coinciding with the 61.80% Fibonacci Retracement and the 161.80% Fibonacci Extension, providing additional strength to the potential support zone.
On the resistance side, the 1st resistance at 38670.94 is highlighted as a level where selling pressure may emerge. It represents a swing high resistance.
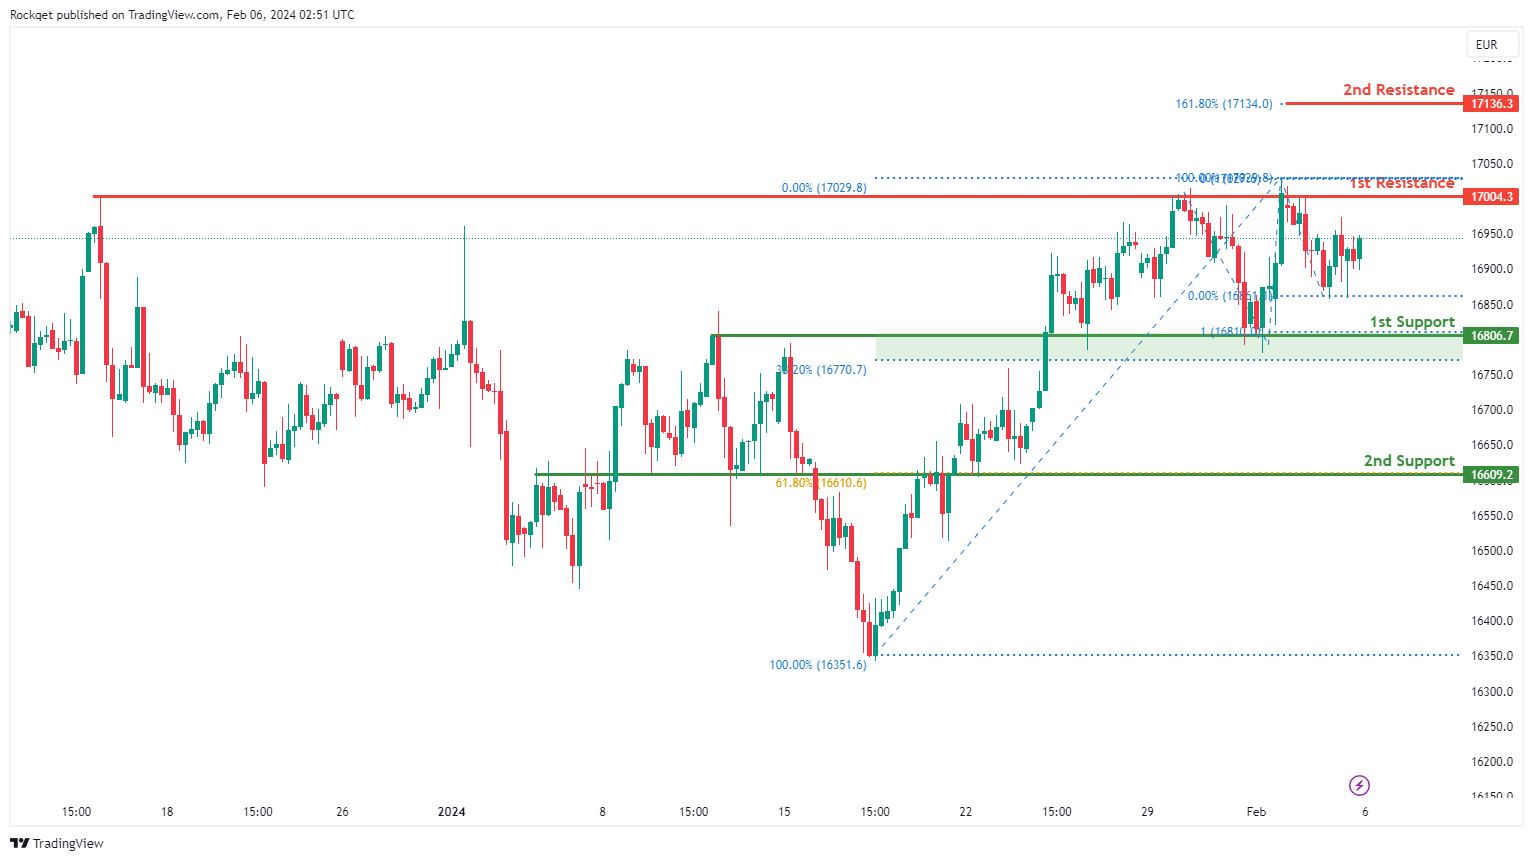
GER40:
The GER40 chart currently demonstrates a neutral overall momentum, indicating a lack of a clear trend. Several factors contribute to this neutral sentiment, suggesting potential price fluctuations between the 1st resistance and 1st support levels.
The 1st support at 16806.7 is considered favorable for various reasons. It is identified as an overlap support and aligns with the 38.20% Fibonacci Retracement and the 100% Fibonacci Projection, indicating a historical level where buying interest has previously emerged.
The 2nd support at 16609.2 is also recognized as an overlap support and coincides with the 61.80% Fibonacci Retracement, providing additional strength to the potential support zone.
On the resistance side, the 1st resistance at 17004.3 is highlighted as a level where selling pressure may emerge. It represents multi-swing high resistance.
The 2nd resistance at 17136.3 is also recognized, coinciding with the 161.80% Fibonacci Extension, adding further significance to this resistance level.
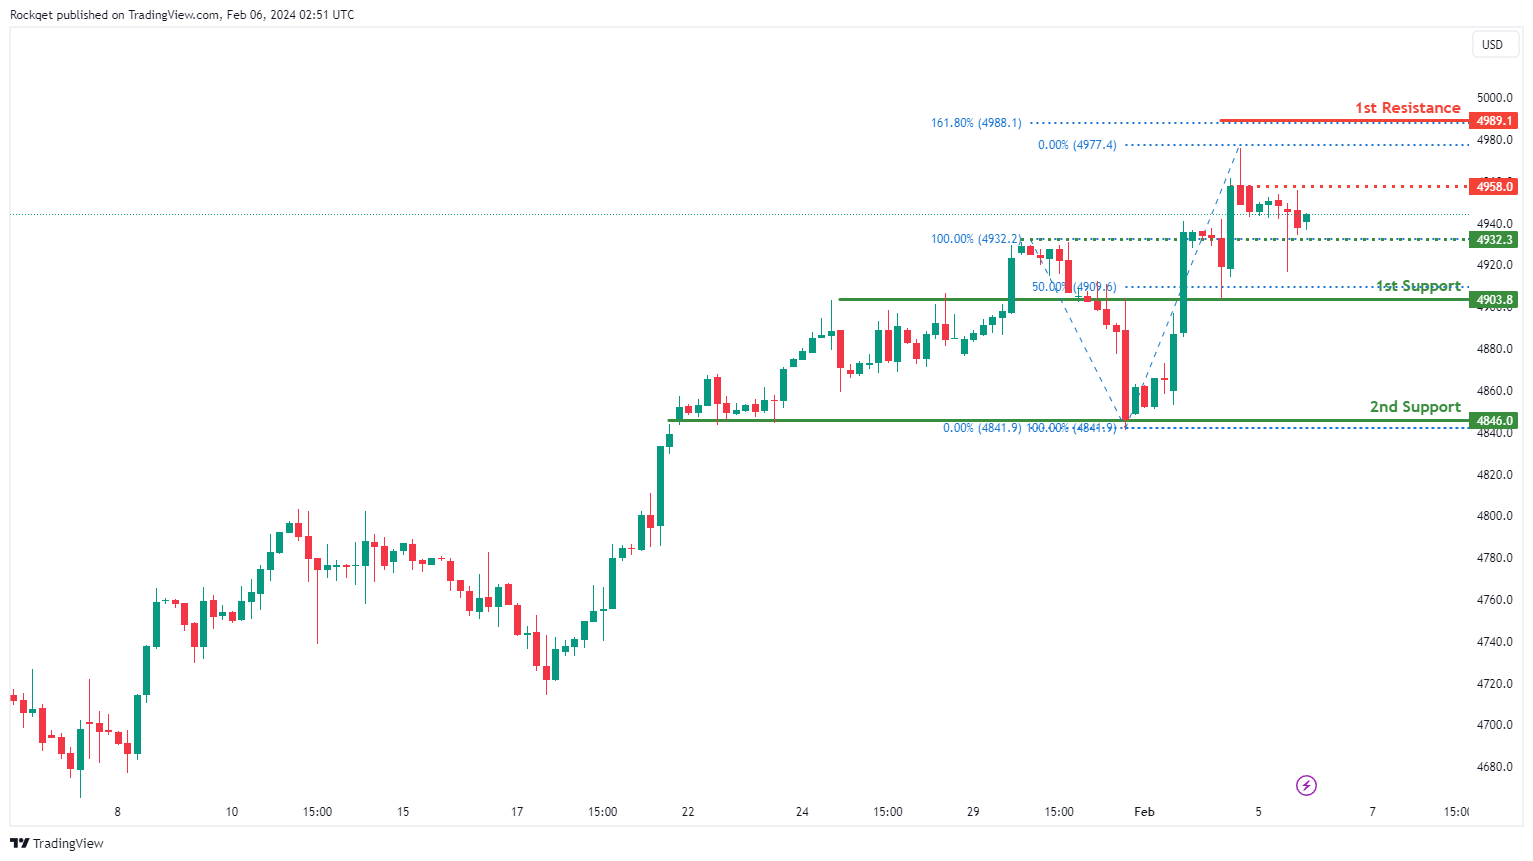
US500:
The US500 chart currently exhibits a neutral overall momentum, suggesting a lack of a clear trend. Several factors contribute to this neutral sentiment, indicating the potential for price fluctuations between the 1st resistance and 1st support levels.
The 1st support at 4903.8 is considered favorable for various reasons. It is identified as an overlap support and aligns with the 50% Fibonacci Retracement, indicating a historical level where buying interest has previously emerged.
The 2nd support at 4846.0 is also recognized as an overlap support, providing additional strength to the potential support zone. An intermediate support level at 4932.3 is identified, further contributing to the potential support area.
On the resistance side, the intermediate resistance at 4958.0 is noted, aligning with swing high resistance. The 1st resistance at 4989.1 is emphasized as it aligns with the 161.80% Fibonacci Extension, suggesting a potential barrier to the price.
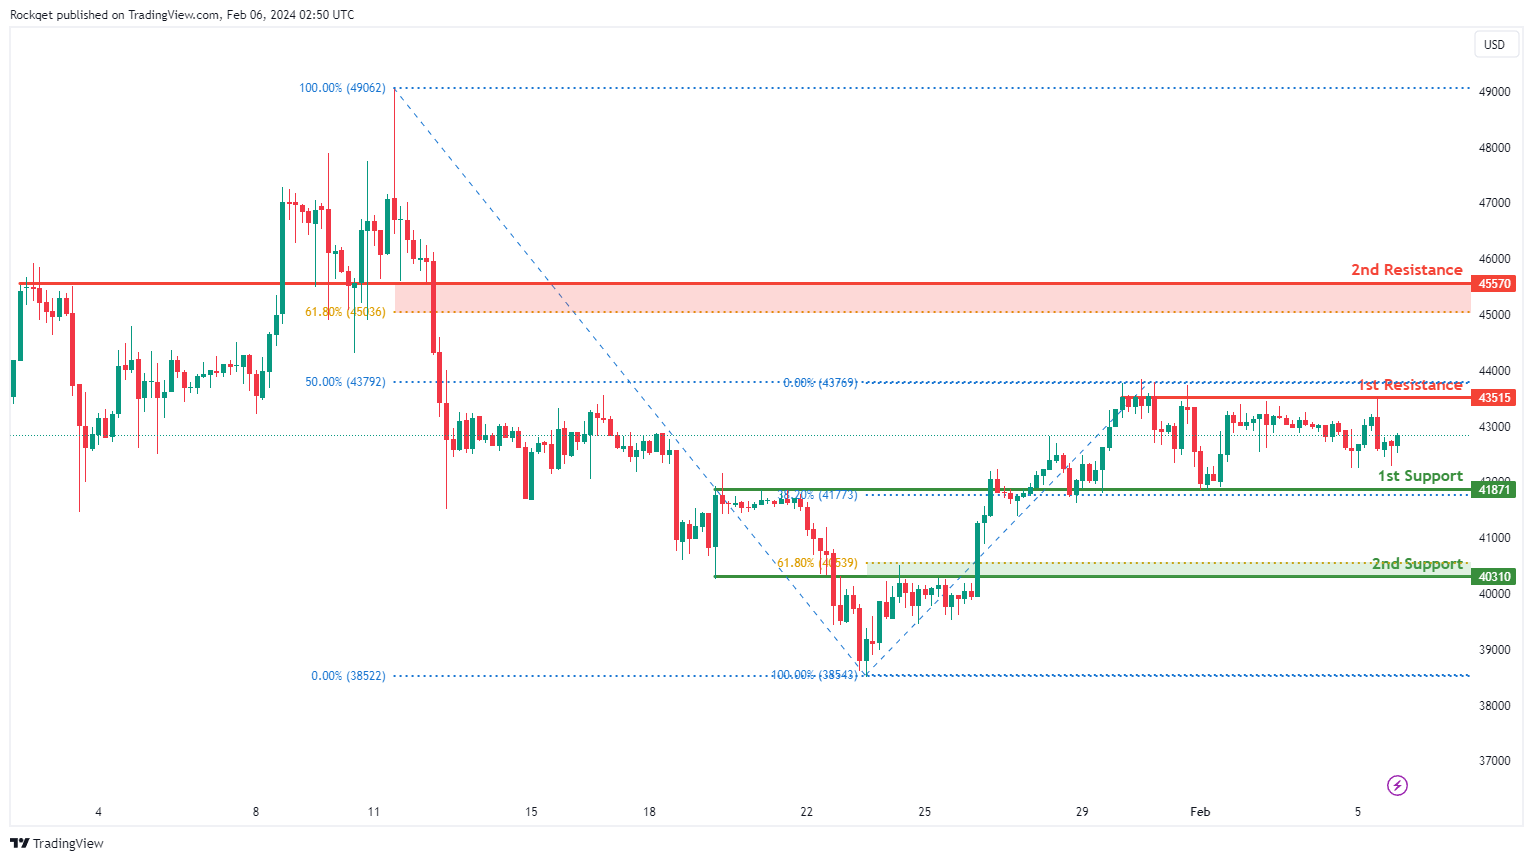
BTC/USD:
The BTC/USD chart currently demonstrates a neutral overall momentum, indicating a lack of a clear trend. Several factors contribute to this neutral sentiment, suggesting the potential for price fluctuations between the 1st resistance and 1st support levels.
The 1st support at 41871 is considered favorable for various reasons. It is identified as an overlap support and aligns with the 38.20% Fibonacci Retracement, indicating a historical level where buying interest has previously emerged.
The 2nd support at 40310 is also recognized as an overlap support and coincides with the 61.80% Fibonacci Retracement, providing additional strength to the potential support zone.
On the resistance side, the 1st resistance at 43515 is emphasized, aligning with pullback resistance and the 50% Fibonacci Retracement.
The 2nd resistance at 45570 is also recognized, coinciding with an overlap resistance and the 61.80% Fibonacci Retracement, adding further significance to this resistance level.
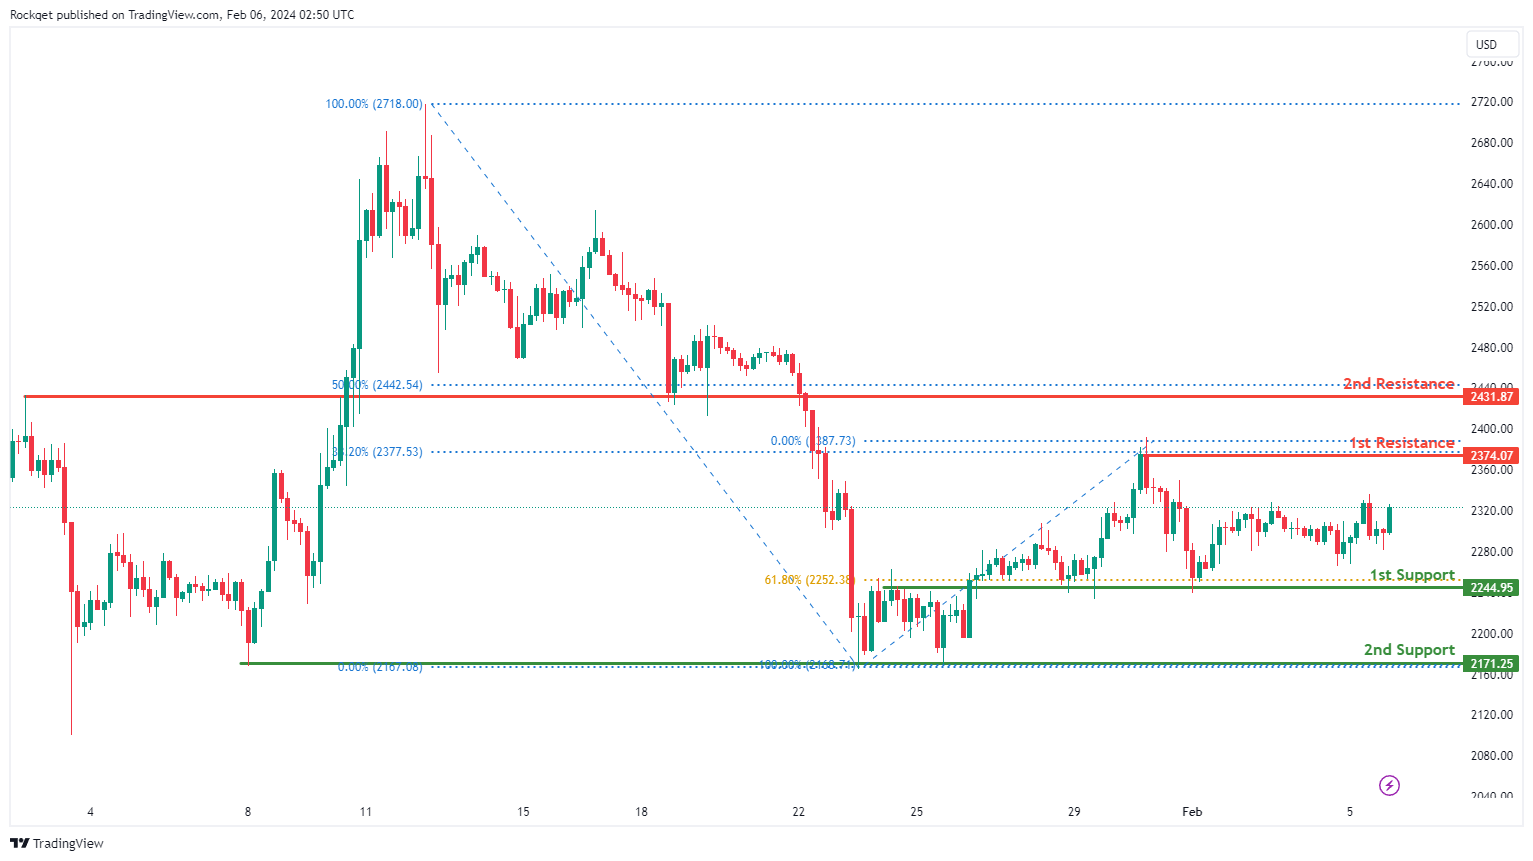
ETH/USD:
The ETH/USD chart currently reflects a neutral overall momentum, suggesting a lack of a clear trend. Several factors contribute to this neutral sentiment, indicating the potential for price fluctuations between the 1st resistance and 1st support levels.
The 1st support at 2244.95 is considered favorable for various reasons. It is identified as an overlap support and coincides with the 61.80% Fibonacci Retracement, highlighting a historical level where buying interest has previously emerged.
The 2nd support at 2171.25 is recognized as a pullback support, providing additional strength to the potential support zone.
On the resistance side, the 1st resistance at 2374.07 is emphasized, aligning with swing high resistance and the 38.20% Fibonacci Retracement.
The 2nd resistance at 2431.87 is also recognized, coinciding with an overlap resistance and the 50% Fibonacci Retracement, adding further significance to this resistance level.
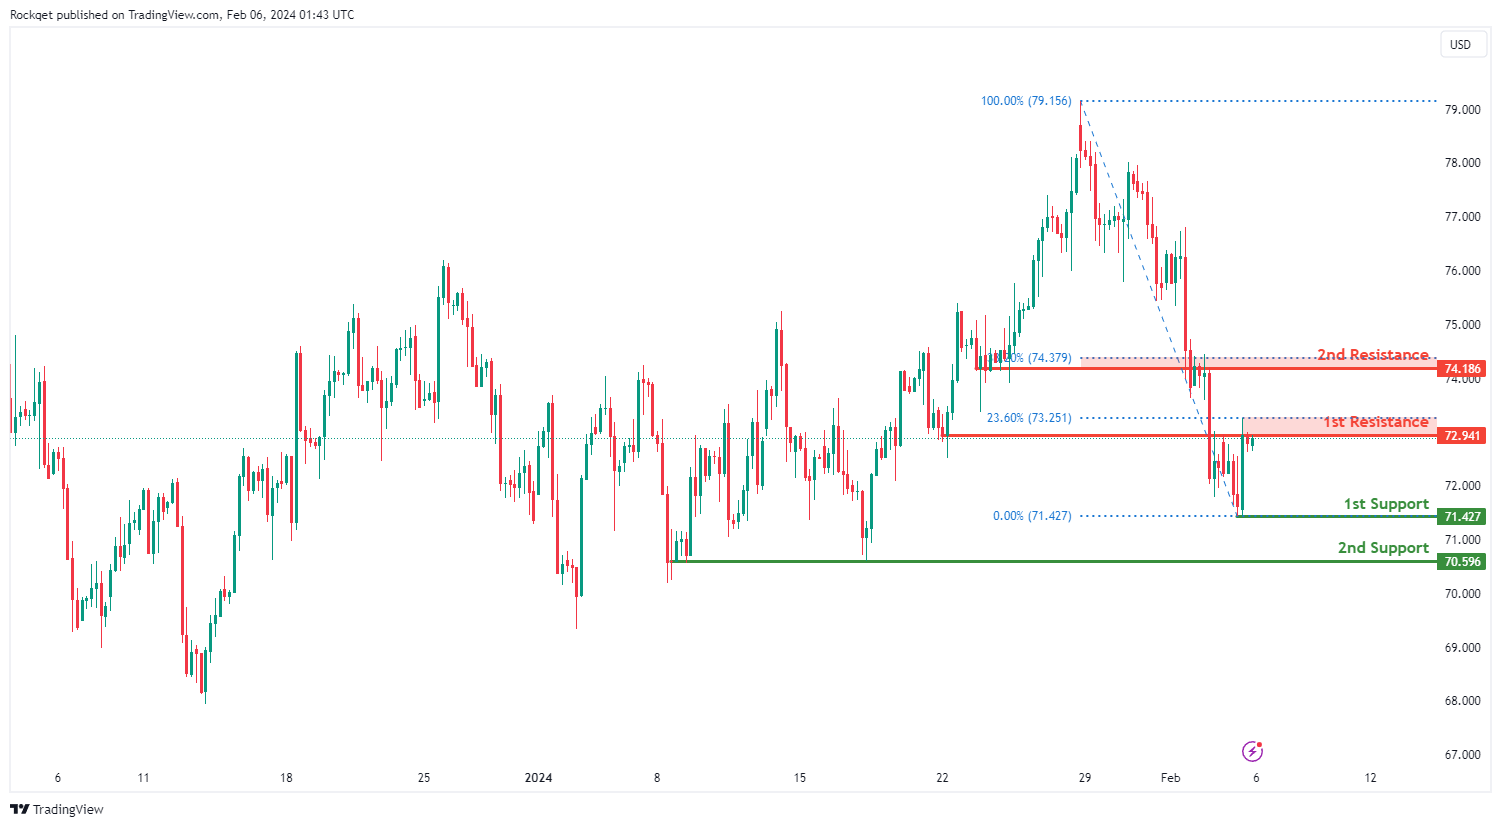
WTI/USD:
The WTI (West Texas Intermediate) chart currently exhibits an overall bearish momentum. However, there is a potential scenario for price to rise strongly towards the 1st resistance.
The 1st resistance level at 72.94 is identified as an overlap resistance that aligns close to the 23.60% Fibonacci Retracement level. Higher up, the 2nd resistance level at 74.18 is also marked as an overlap resistance that aligns close to the 38.20% Fibonacci Retracement level, further highlighting its importance as a potential resistance zone.
To the downside, the 1st support level at 71.42 is identified as a pullback support. Further below, the 2nd support level at 70.59 is noted as a multi-swing-low support, reinforcing its significance as a key support level.
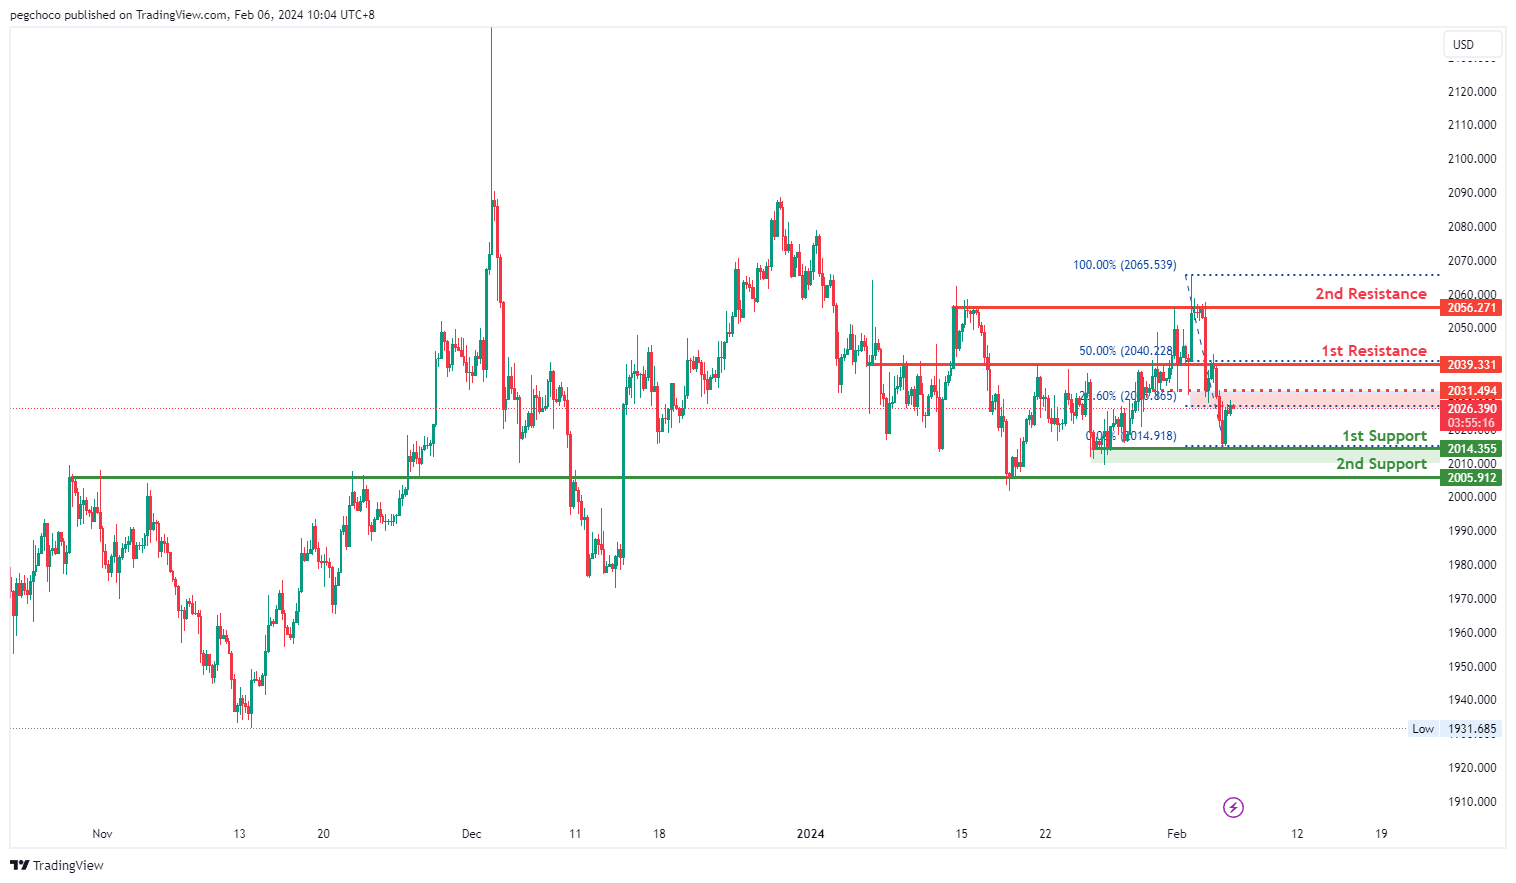
XAU/USD (GOLD):
The XAUUSD chart currently exhibits a bearish overall momentum, indicating a downward trend. The price could potentially make a rise towards the 1st resistance in the short term before reversing off it and dropping towards the 1st support.
1st support level at 2014.35 is identified as a multi-swing low support, suggesting historical significance as a strong support level where buying interest may emerge.
There is also a 2nd support level at 2005.91, characterized as an overlap support, further emphasizing its importance as a potential support zone.
On the resistance side, the 1st resistance level at 2039.33 is categorized as an overlap resistance with the presence of the 50% Fibonacci Retracement, indicating its historical significance as a point of potential resistance.
Additionally, there is a 2nd resistance level at 2056.27, identified as a multi-swing high resistance, which further adds to its significance as a potential barrier for further upside movement.
Intermediate resistance at 2031.49 is considered a pullback resistance with the presence of the 23.60% Fibonacci Retracement, which could act as a transitional level between support and resistance.
RBA stands pat, eases hawkish stance without shifting to neutral
RBA maintained cash rate target at 4.35%, aligning with broad market expectations. The hawkish stance has seen a slight moderation, with the acknowledgment that "a further increase in interest rates cannot be ruled out," hinting at a cautious approach rather than a definitive shift towards a neutral bias.
The updated economic forecasts paint a picture of gradual moderation in inflation pressures. Headline CPI is expected to decelerate from 4.1% at the end of 2023 to 3.2% by the close of 2024, reaching 2.8% at the end of 2025, and further softening to 2.6% by mid-2026.
Trimmed mean CPI mirrors this downward trend, projected to ease from 4.2% at the end of 2023 to 3.1% by the end of 2024, and gradually declining to 2.8% by December 2024, and then 2.6% by June 2026.
Additionally, RBA's outlook for cash rate assumes a decrease to 3.9% by the end of 2024, followed by a further reduction to 3.4% by the end of 2025, and eventually reaching 3.2% by mid-2026. This assumption aligns with the expectations derived from surveys of professional economists and financial market pricing.
On the growth front, RBA projects a modest GDP expansion of 1.8% in 2024, with an improvement to 2.3% in 2025.
Full RBA Statement and SoMP.