
Sample Category Title
EUR/JPY Daily Outlook
Daily Pivots: (S1) 183.85; (P) 184.16; (R1) 184.62; More...
Intraday bias in EUR/JPY remains neutral for the moment. On the downside, firm break of 181.85 support should confirm that the correction from 186.86 is already in the third leg. Deeper fall should be seen to 180.78 and below. However, break of 184.75 resistance will bring stronger rally to retest 186.86 high instead.
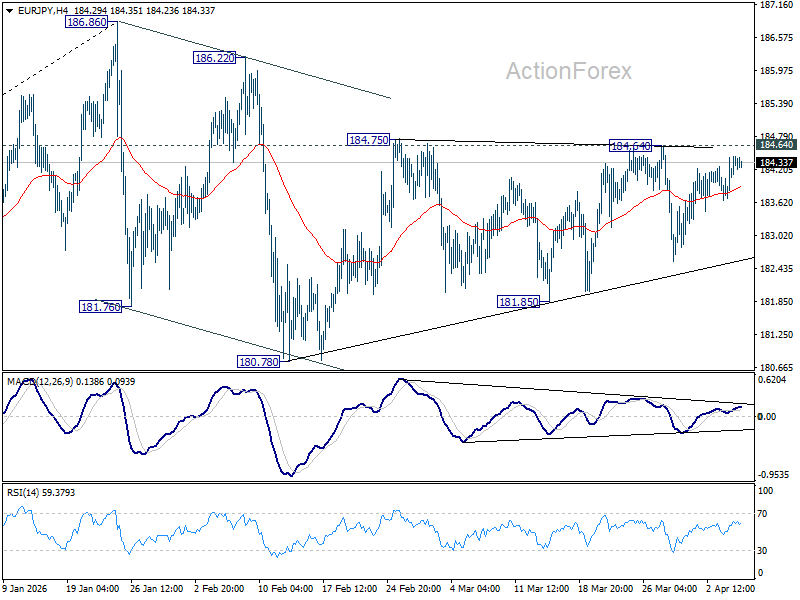
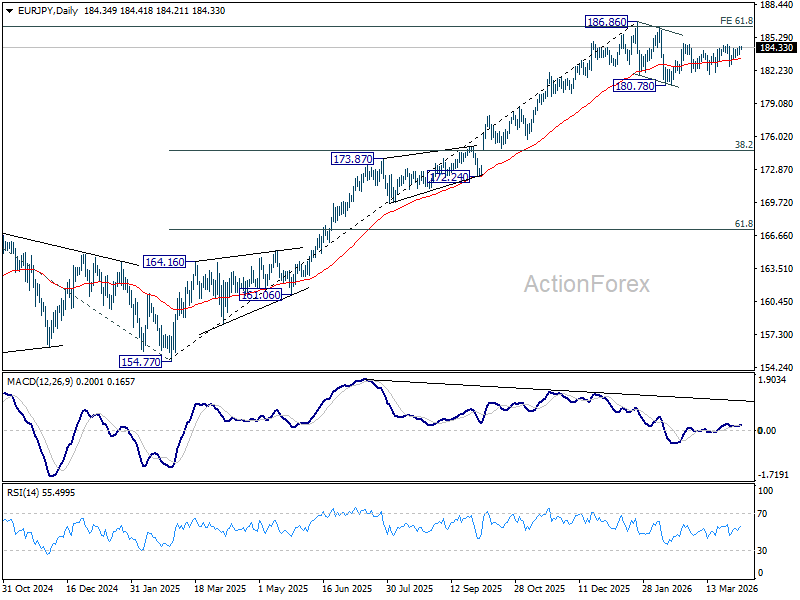
In the bigger picture, a medium term top could be in place at 186.86 and some more consolidations would be seen. Nevertheless, as long as 55 W EMA (now at 176.21) holds, the larger up trend from 114.42 (2020 low) remains intact. Firm break of 186.86 will pave the way to 78.6% projection of 124.37 (2022 low) to 175.41 (2025 high) from 154.77 at 194.88 next.
EUR/GBP Daily Outlook
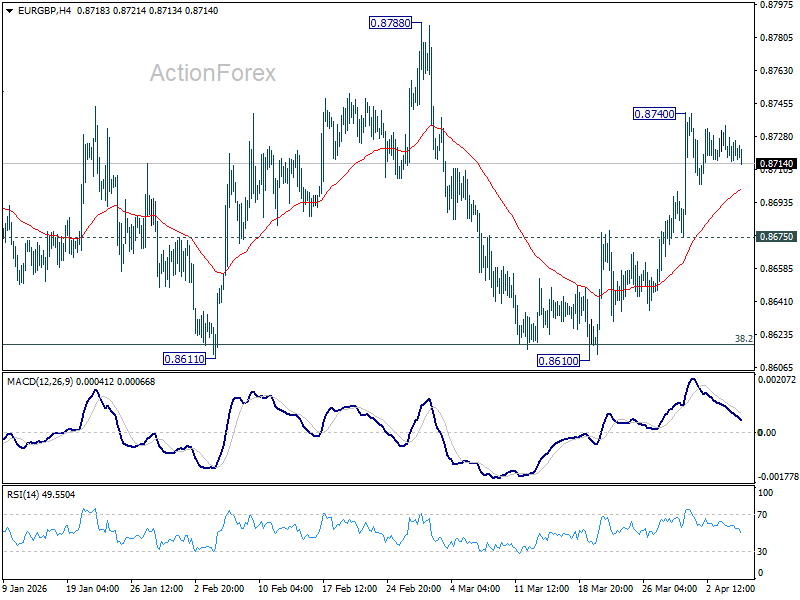
Daily Pivots: (S1) 0.8713; (P) 0.8724; (R1) 0.8733; More…
Intraday bias in EUR/GBP remains neutral and more consolidations would be seen below 0.8740. On the upside, above 0.8740 will resume the rebound from 0.8610 short term bottom to 0.8788 resistance next. However, break of 0.8675 will bring retest of 0.8610 low instead.
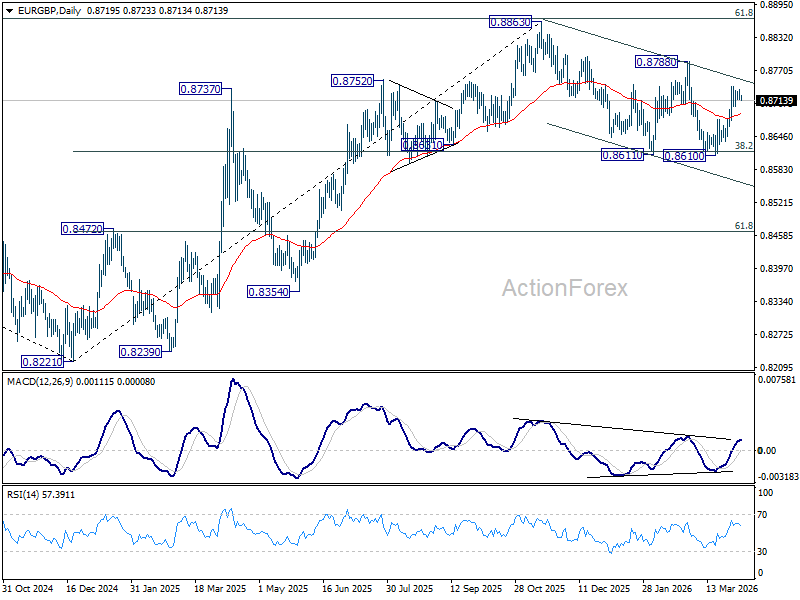
In the bigger picture, strong support was seen again from 38.2% retracement of 0.8821 to 0.8863 at 0.8618. Break of 0.8788 resistance will argue that larger rise from 0.8221 might be resume to resume through 0.8863. Nevertheless, sustained trading below 0.8618 should confirm reversal, and bring deeper fall to 61.8% retracement at 0.8466 at least.
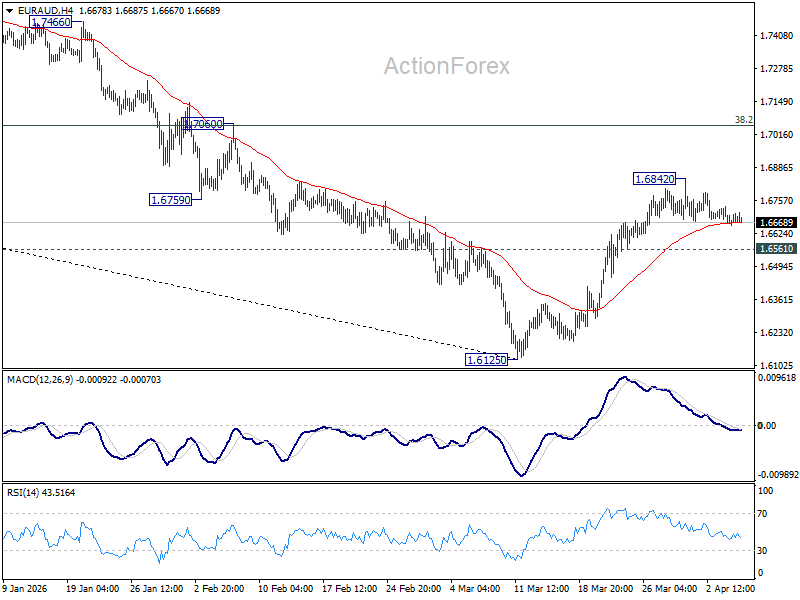
EUR/AUD Daily Outlook
Daily Pivots: (S1) 1.6649; (P) 1.6695; (R1) 1.6731; More...
Intraday bias in EUR/AUD remains neutral and more consolidations could be seen below 1.6842. On the upside, above 1.6842 will resume the rebound from 1.6125 to 38.2% retracement of 1.8554 to 1.6125 at 1.7053. However, break of 1.6561 minor support will argue that the rebound fro 1.6125 has completed, after rejection by 55 D EMA (now at 1.6742). Retest of 1.6125 low should be seen next.
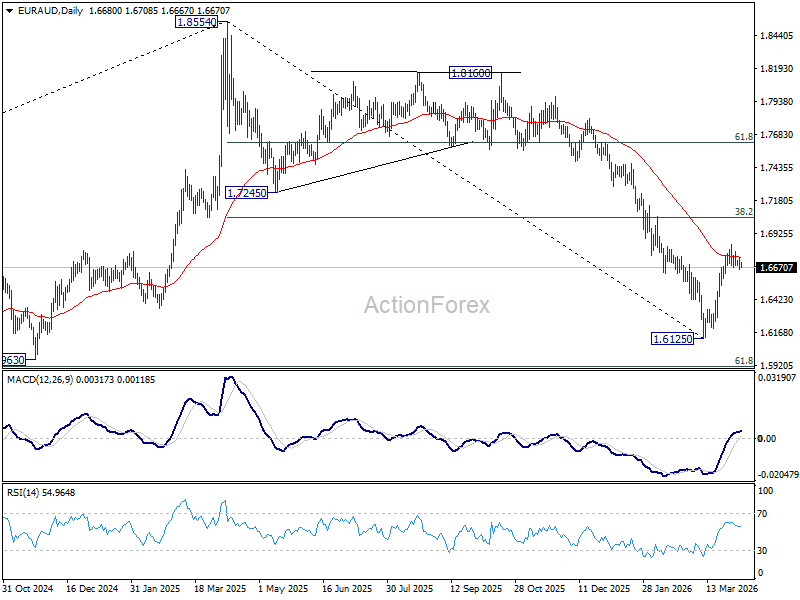
In the bigger picture, fall from 1.8554 medium term top is seen as reversing the whole up trend from 1.4281 (2022 low). Deeper decline should be seen to 61.8% retracement of 1.4281 to 1.8554 at 1.5913, which is slightly below 1.5963 structural support. Decisive break there will pave the way back to 1.4281. For now, risk will stay on the downside as long as 55 W EMA (now at 1.7207) holds, even in case of strong rebound.
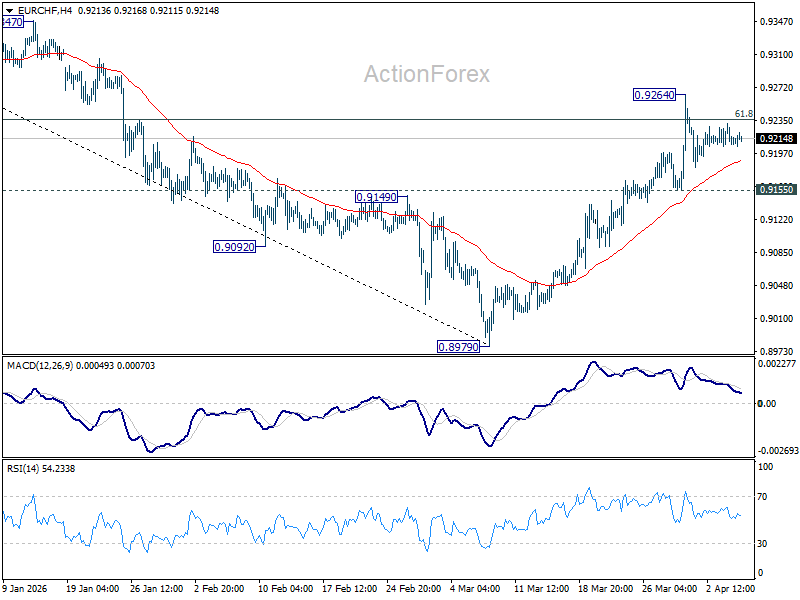
EUR/CHF Daily Outlook
Daily Pivots: (S1) 0.9203; (P) 0.9219; (R1) 0.9228; More....
Range trading continues in EUR/CHF and intraday bias remains neutral. On the upside, sustained trading above 61.8% retracement of 0.9394 to 0.8979 at 0.9235 will pave the way to 0.9394 key resistance next. However, break of 0.9155 support will turn bias back to the downside for 0.8979 low.
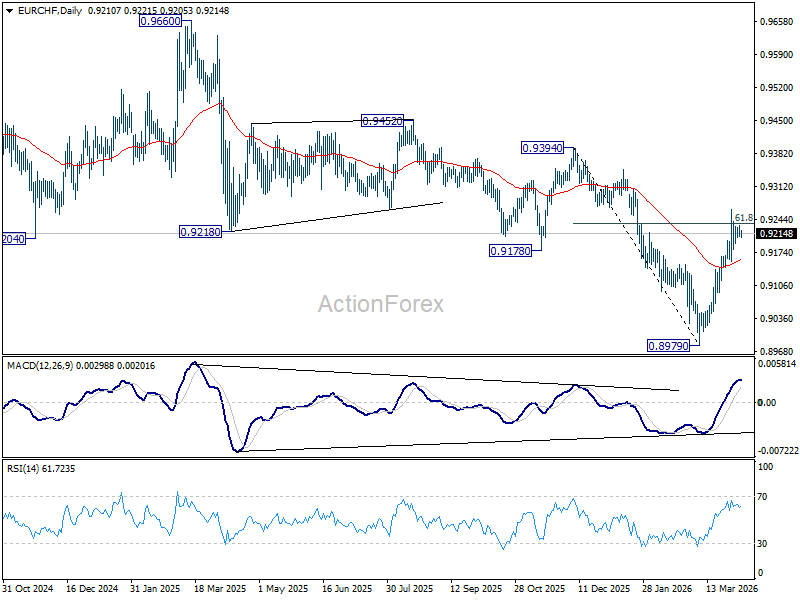
In the bigger picture, as long as 55 W EMA (now at 0.9281) holds, the larger down trend from 0.9928 (2024 high) is still expected to continue through 0.8979 at a later stage. However, sustained break of 55 W EMA should confirm medium term bottoming, and bring stronger rise through 0.9394 resistance, even as a corrective move.
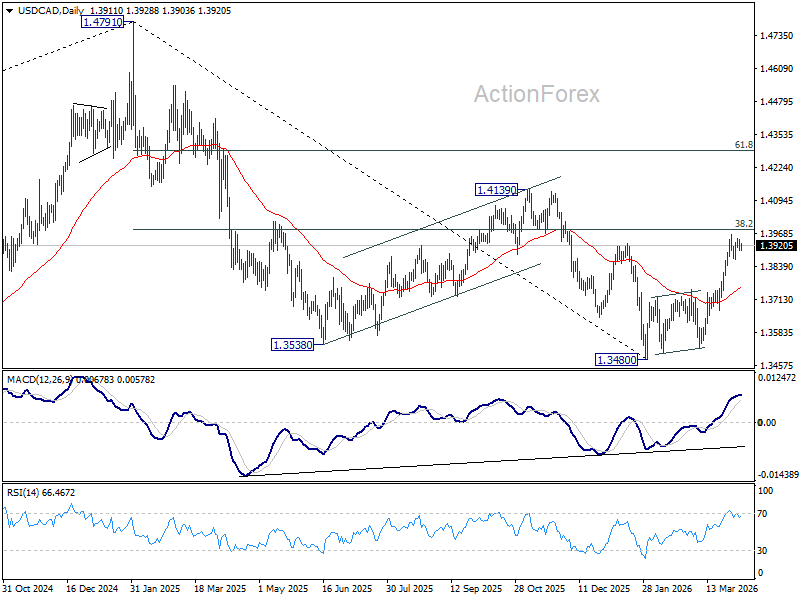
USD/CAD Daily Outlook
Daily Pivots: (S1) 1.3893; (P) 1.3921; (R1) 1.3940; More...
Range trading continues in USD/CAD and more consolidations could be seen below 1.3965. In case of another fall, downside should be contained above 1.3751 resistance turned support. On the upside, decisive break of 38.2% retracement of 1.4791 to 1.3480 at 1.3981 will argue that it's already reversing the whole down trend from 1.4791, and target 61.8% retracement at 1.4290. However, firm break of 1.3751 should indicate rejection by 1.3981, and keep the fall from 1.4791 intact. Bias will be back on the downside for retesting 1.3480 low.
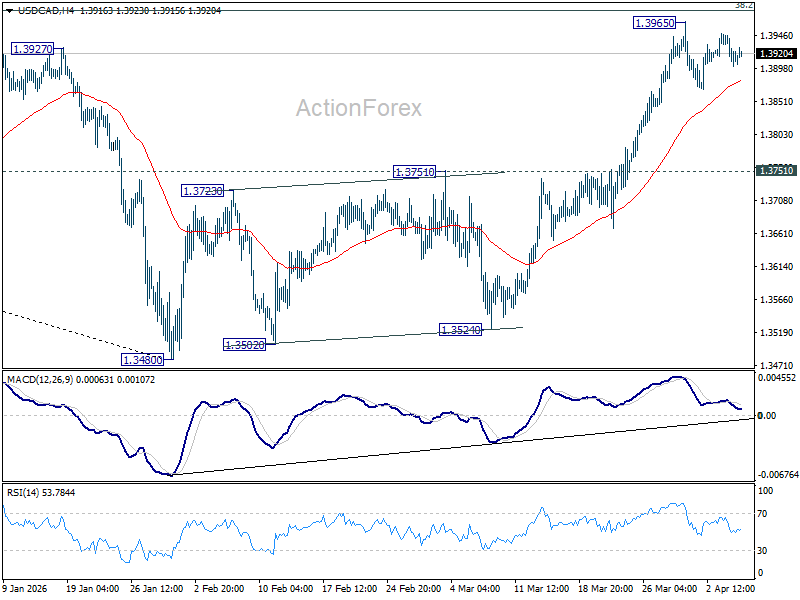
In the bigger picture, price actions from 1.4791 are seen as a corrective pattern to the whole up trend from 1.2005 (2021 low). Deeper fall could be seen, as the pattern extends, to 61.8% retracement of 1.2005 to 1.4791 at 1.3069. However, decisive break of 1.3927 resistance will argue that the correction has completed with three waves down to 1.3480 already. Further break of 1.4139 will confirm and bring retest of 1.4791 high.
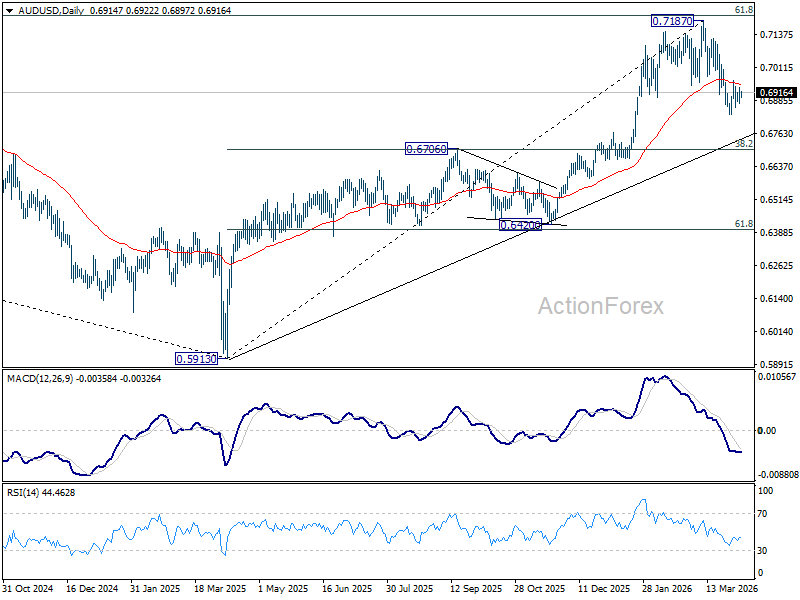
AUD/USD Daily Report
Daily Pivots: (S1) 0.6883; (P) 0.6910; (R1) 0.6945; More...
Range trading continues in AUD/USD above 0.6832 and intraday bias stays neutral. On the downside, below 0.6832 will extend the decline from 0.7187 to 38.2% retracement of 0.5913 to 0.7187 at 0.6700. However, firm break of 0.6978 will argue that the correction has completed, and bring retest of 0.7817 high.
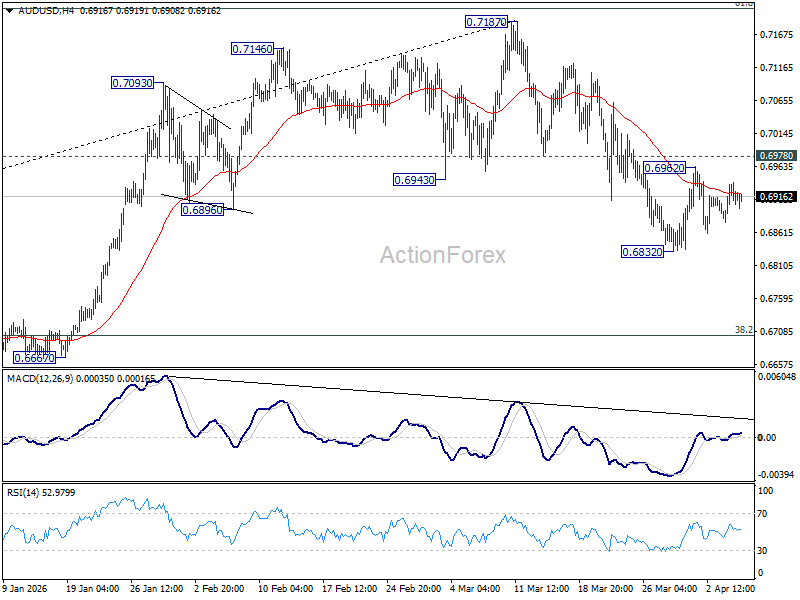
In the bigger picture, as long as 0.6706 cluster support holds, rise from 0.5913 (2024 low) should still be in progress. Decisive break of 61.8% retracement of 0.8006 to 0.5913 at 0.7206 will solidify the case that it's already reversing the down trend from 0.8006 (2021 high). However, firm break of 0.6706 will dampen this bullish case, and bring deeper fall back to 0.6420 support, and possibly below.
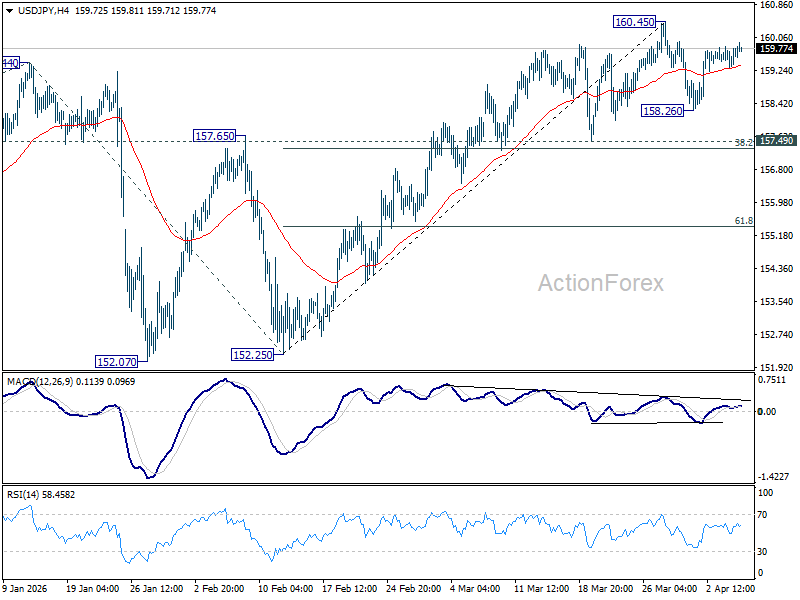
USD/JPY Daily Outlook
Daily Pivots: (S1) 159.48; (P) 159.62; (R1) 159.81; More...
USD/JPY is staying in consolidations below 160.45 and intraday bias remains neutral for the moment. Another fall could be seen, but overall outlook will remain bullish as long as 157.49 cluster support (38.2% retracement of 152.25 to 160.45 at 157.31) holds. Firm break of 160.45 will resume the rise from 152.25 to retest 161.94 high.
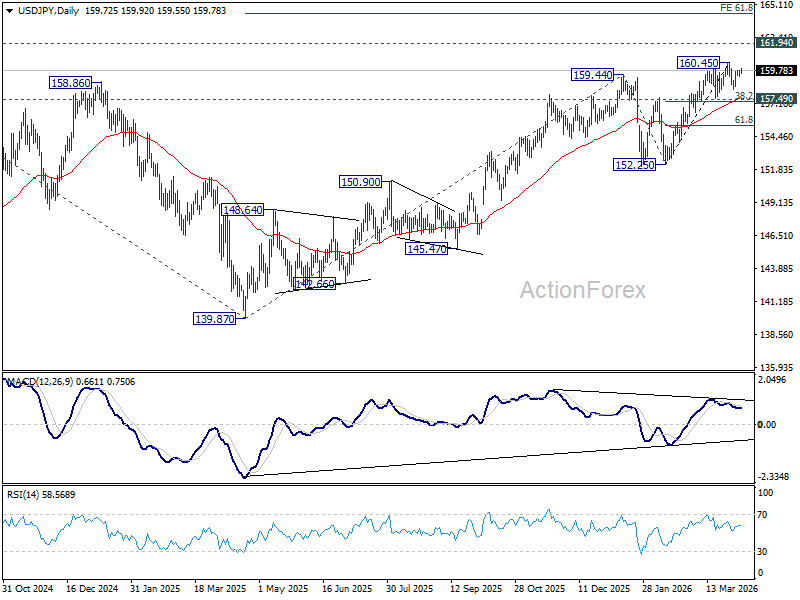
In the bigger picture, outlook is unchanged that corrective pattern from 161.94 (2024 high) should have completed with three waves at 139.87. Larger up trend from 102.58 (2021 low) could be ready to resume through 161.94. This will remain the favored case as long as 55 W EMA (now at 152.97) holds. Firm break of 161.94 will pave the way to 61.8% projection of 102.58 to 161.94 from 139.87 at 176.75.
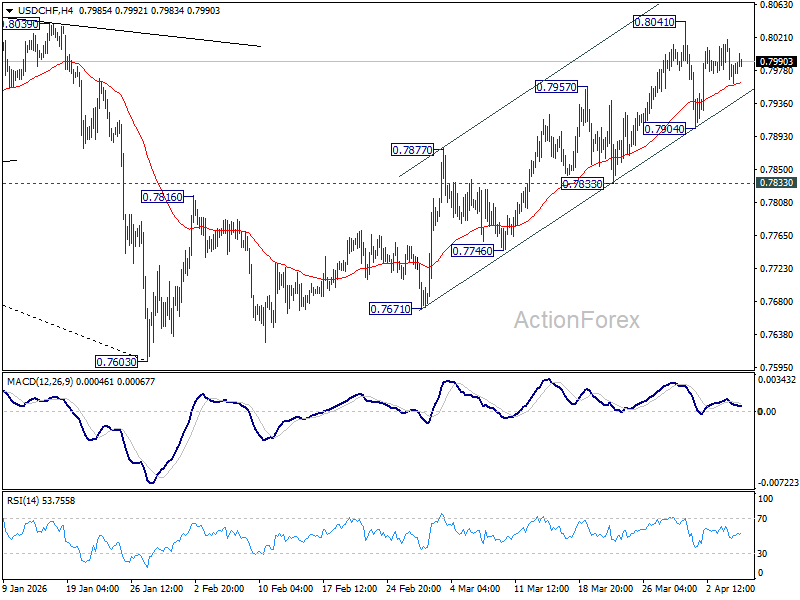
USD/CHF Daily Outlook
Daily Pivots: (S1) 0.7956; (P) 0.7988; (R1) 0.8015; More….
Range trading continues in USD/CHF and intraday bias remains neutral for more consolidations. Further rally is expected with 0.7833 support intact. On the upside, break of 0.8041 will resume the whole rally from 0.7603, and target 38.2% retracement of 0.9200 to 0.7603 at 0.8213. However, decisive break of 0.7833 support will argue that the rebound has completed, and turn bias back to the downside for deeper fall.
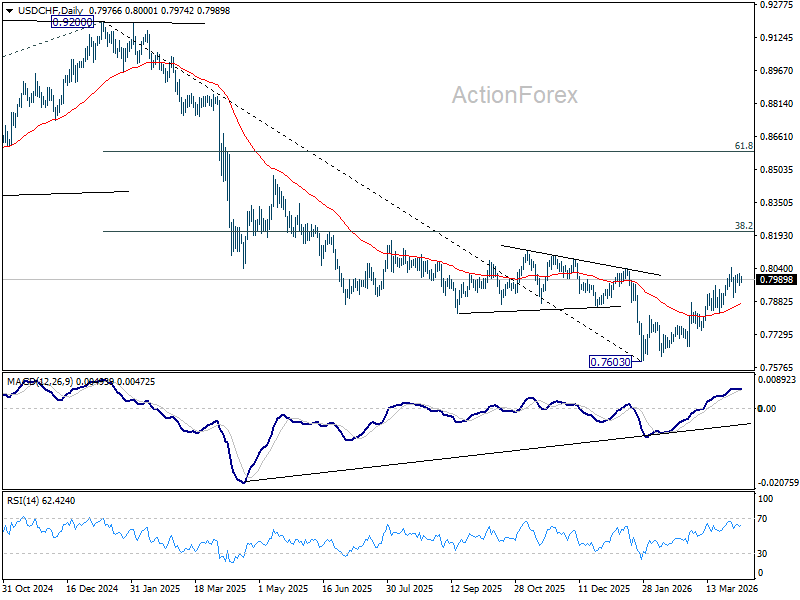
In the bigger picture, a medium term bottom should be in place at 0.7603 on bullish convergence condition in D MACD. Rebound from there is seen as correcting the fall from 0.9200 only. However, decisive break of 55 W EMA (now at 0.8081) will suggest that it's probably correcting the larger scale down trend from 1.0146 (2022 high). On the other hand, rejection by the 55 W EMA will setup down trend resumption to 100% projection of 1.0146 (2022 high) to 0.8332 from 0.9200 at 0.7382 at a later stage.
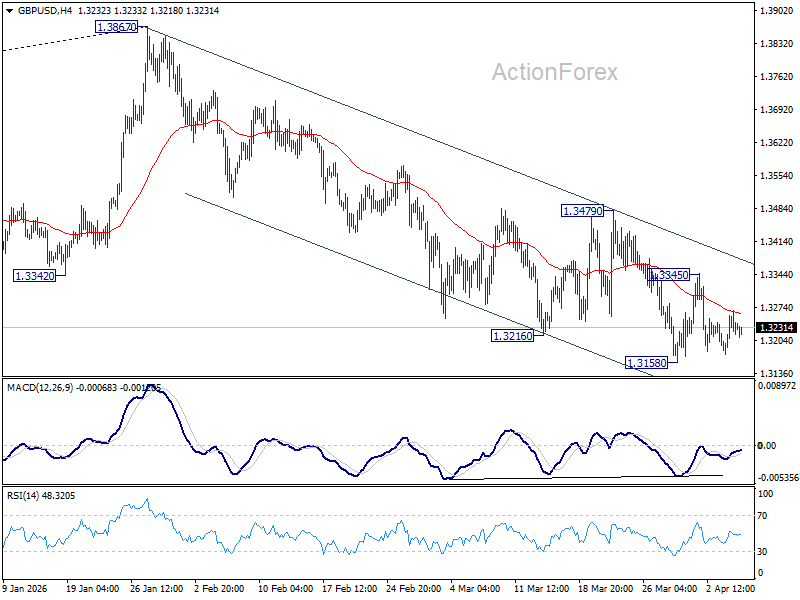
GBP/USD Daily Outlook
Daily Pivots: (S1) 1.3187; (P) 1.3228; (R1) 1.3278; More...
Range trading continues in GBP/USD above 1.3158 and intraday bias stays neutral. With 1.3479 resistance intact, further decline is still in favor. Below 1.3158 will resume the fall from 1.3867 to 1.3008 structural support. However, firm break of 1.3479 will indicate that the fall from 1.3867 has completed, and turn bias back to the upside for stronger rally.
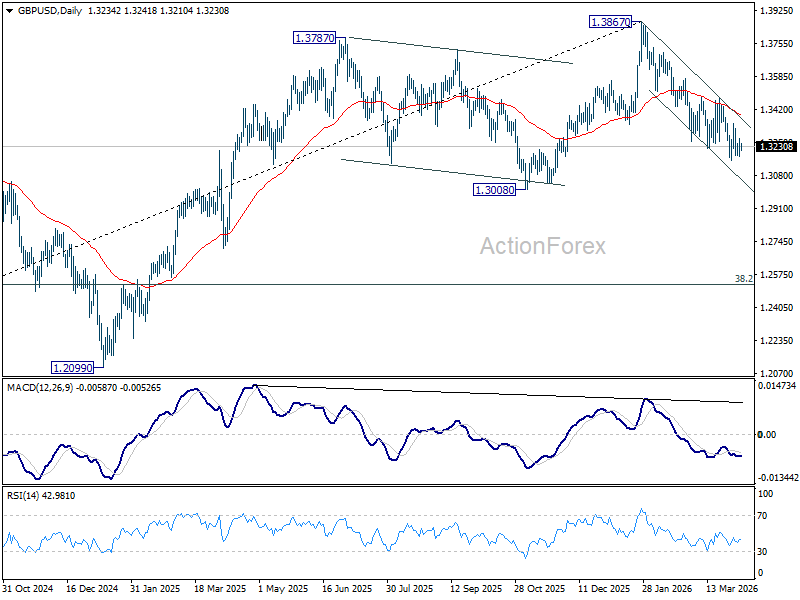
In the bigger picture, considering bearish divergence condition in both D and W MACD, a medium term top should be in place at 1.3867. Firm break of 1.3008 support will argue that fall from 1.3867 is at least correcting the rise from 1.0351 (2022 low) with risk of bearish reversal. That would open up further decline to 38.2% retracement of 1.0351 to 1.3867 at 1.2524. For now, medium term outlook will be neutral at best as long as 1.3867 resistance holds, or until further development.
Oil Hits 111 USD/bbl as Iran Rejects US Ceasefire Proposal
In focus today
Focus continues to be on tensions in the Middle East, keeping oil markets and risk sentiment on edge.
Swedish inflation tops the domestic agenda, where we expect core inflation at 1.5% whilst higher energy prices will push CPIF up to 2.2%, from previously 1.7%. Compared to our previous forecast, the inflation path has been revised upwards, reflecting our view that traffic through the Strait of Hormuz will remain subdued for an extended period, exerting pressure on supply chains. Note that as this is the flash inflation print, we will not receive any details but must wait another week for them. Additionally, we also receive services, and composite, PMIs today.
In the euro area, final services PMI and composite PMI for March will be released. The flash estimate showed the composite PMI declining to 50.5 from 51.9 in February, while the services PMI fell to 50.1 from 51.9, indicating near-stalling growth in the sector.
In Denmark, Danmarks Nationalbank's press release on March FX reserves will be published in the afternoon, revealing whether the central bank intervened in the FX market in March.
Overnight, we expect the Reserve Bank of New Zealand (RBNZ) to keep its monetary policy unchanged in line with market pricing and consensus. Markets expect RBNZ to hike rates most likely in Q3 this year.
For the rest of the week, developments in the Iran war will continue to be the main market driver. Furthermore, from the US, we will look out for the minutes from the FOMC's March meeting released on Wednesday evening, and both February PCE and final Q4 GDP figures released on Thursday. Friday will bring flash inflation figures for March from China, Denmark, Norway and the US.
Economic and market news
What happened since Wednesday
The US-Iran conflict escalated further on Monday as Iran rejected a US ceasefire proposal brokered by Pakistan, which called for an immediate halt to hostilities followed by broader peace talks to be concluded within 15 to 20 days. Instead, Iran issued a response consisting of 10 clauses, demanding a permanent end to the war with the US and Israel, the lifting of sanctions, and safe passage through the Strait of Hormuz. President Trump dismissed the Iranian response and issued a stark warning threatening massive strikes if his demands for Iran to reopen the Strait of Hormuz are not met by Tuesday evening. Trump has repeatedly threatened strikes on Iranian energy and transport infrastructure, while experts have noted that strikes on civilian infrastructure, such as power plants and bridges, would constitute war crimes. At the time of writing, Brent crude prices have risen to 111 USD/bbl as markets assess the risks to global energy supply.
In the US, Friday's March jobs report came in stronger than expected, with payrolls growing by 178k (cons: +65k, Danske: +30k), while the unemployment rate fell to 4.3% (cons: 4.4%, Danske: 4.5%). However, February's figures were revised down further to show a decline of 133k jobs instead of 92k. Average hourly earnings growth eased to 0.2% from 0.4% in February, and the average work week dipped slightly to 34.2 hours from 34.3. Despite these softer details, the overall report was robust, reflecting a rebound from February, which was affected by bad weather and a nurses' strike. Importantly, the data primarily reflects the second week of March, so the impact of the Iran conflict and surging oil prices is not yet visible. However, recent indicators, including a decline in job postings and softer employment in the March PMI, suggest potential headwinds for the labour market in the months ahead.
US February retail sales also surprised to the upside, with headline growth at 0.6% m/m SA and core retail sales (control group) rising by 0.5% m/m SA. However, the February retail sales data do not yet reflect potential sentiment effects from the ongoing conflict in Iran. The ISM manufacturing report for March also revealed notable developments, with the prices paid index surging to 78.3 (cons: 73.0, prior: 70.5), while new orders declined to 53.5 from 55.8 in February. The ISM services PMI also disappointed, falling to 54.0 in March (cons: 54.9, prior: 56.1). The prices paid component jumped to 70.7, the highest since October 2022, likely reflecting inflationary pressures from both the Iran conflict and lingering tariff effects.
Also in the US, St. Louis Fed President Musalem (non-voter) stated on Wednesday that the current policy stance remains appropriate despite rising inflation risks tied to the Middle East conflict. He warned that persistent supply shocks could have a lasting impact on inflation expectations and highlighted the need to closely monitor core inflation
In the euro area, unemployment rose slightly to 6.2% in February from 6.1%, driven by a 137k increase in unemployed persons. The modest uptick is not a clear dovish signal for ECB given the data's monthly volatility and earlier revisions. Despite the February increase, the number of unemployed persons remains below end-2025 levels.
In Sweden, March manufacturing PMI rose to 56.3, but the details revealed signs of supply disruptions. Delivery times increased significantly, contributing most to the higher PMI, though the rise likely reflects supply chain issues rather than stronger demand. Input prices also surged to their highest level since October 2022, driven by higher energy costs and global price pressures tied to the Middle East conflict. Furthermore, new orders fell sharply.
In South Korea, Samsung Electronics reported record Q1 operating profit of 57.2 trillion won, which represents nearly triple its previous record and exceeds its entire 2025 profit. The chipmaker's semiconductor division generated 95% of total profit as supply shortages from AI data centre requirements constrained traditional chip availability while soaring AI chip demand has pushed up memory prices over 50%.
Goldman Sachs' private credit fund defied industry-wide redemption pressures with withdrawal requests of just under 5% in Q1, staying below its quarterly cap, while the broader private credit industry faces surging withdrawals. The outperformance comes as fears over AI disruption eroding software companies' earnings and loan repayment ability have rattled the sector, prompting several asset managers to cap redemptions at 5%.
Equities: Equity markets traded broadly sideways over the Easter period in the regions that remained open, following the rebound seen into the holiday. Importantly, this does not change the bigger picture: global equities are still ~4% above the recent lows, reflecting a market that is increasingly pricing when - not if - we get a de-escalation in the Middle East.
The underlying assumption remains that a ceasefire and/or broader stabilization would imply a partial (if not full) reopening of the Strait of Hormuz, easing constraints on global energy supply. This view is increasingly supported by a pick-up in bilateral agreements, particularly between Asian economies and Iran, allowing some oil flows to resume via alternative arrangements. Cyclicals have, not surprisingly, outperformed from the lows. More notably, however, volatility has declined across regions and asset classes, reinforcing the notion that investors are trying to look through the near-term noise. Markets in the US edged higher yesterday, while Asian trading this morning is mixed. European futures are slightly firmer, catching up with US moves, whereas US futures are marginally softer.
FI and FX: With most of Europe off for Easter, yesterday saw choppy price action amid thin volumes across the FX market. NOK outperformed within G10 and EUR/NOK retraced all of Friday's gains and is now back at 11.20. On the other end of the scale, we find the SEK, that continues to underperform. EUR/SEK was rejected at support around 10.85 and is back trading above 10.90 to start this morning. US yields have remained relatively stable over the Easter period, and EUR/USD held resistance at 1.1570 yesterday, and looks to start the day with a move to the lower 1.15's.