

Sample Category Title
Markets Enter Warsh Fed Era With Higher Yields, Stronger Dollar, and No Hormuz Relief
The first trading day of Kevin Warsh’s tenure as Federal Reserve Chair is already being defined by rising Treasury yields, stronger Dollar demand, and market skepticism that the Trump-Xi summit will deliver meaningful relief from the global energy shock.
US Treasury yields surged again in Asian session, with the 10-year yield breaking decisively above the key 4.5% psychological level. The move extended a broader global bond selloff that has accelerated throughout the week following hotter-than-expected US inflation data and resilient consumer spending figures.
The market reaction suggests investors could be beginning to position for a structurally different Fed regime under Warsh.
While current Fed officials have generally maintained a cautious wait-and-see stance, bond markets appear focused on the possibility that Warsh may ultimately prove significantly less tolerant of persistent inflation than Jerome Powell. The incoming Fed Chair has repeatedly criticized the central bank’s post-pandemic policy framework, particularly its delayed response to inflation and its heavy reliance on balance-sheet expansion.
During Senate testimony in April, Warsh described the Fed’s failure to tighten policy sooner during 2021-2022 as a “fatal policy error.” He has also been among the strongest critics of the Fed’s multi-trillion-dollar balance sheet, arguing prolonged asset purchases distorted financial markets and weakened monetary discipline.
That backdrop is helping drive a broader repricing across global markets.
Higher US Treasury yields triggered weakness across Asian equity markets, especially in South Korea, as tighter global financial conditions pressured risk sentiment. The resulting risk-off tone fed back into stronger Dollar demand, particularly against higher-beta currencies such as Aussie and Kiwi.
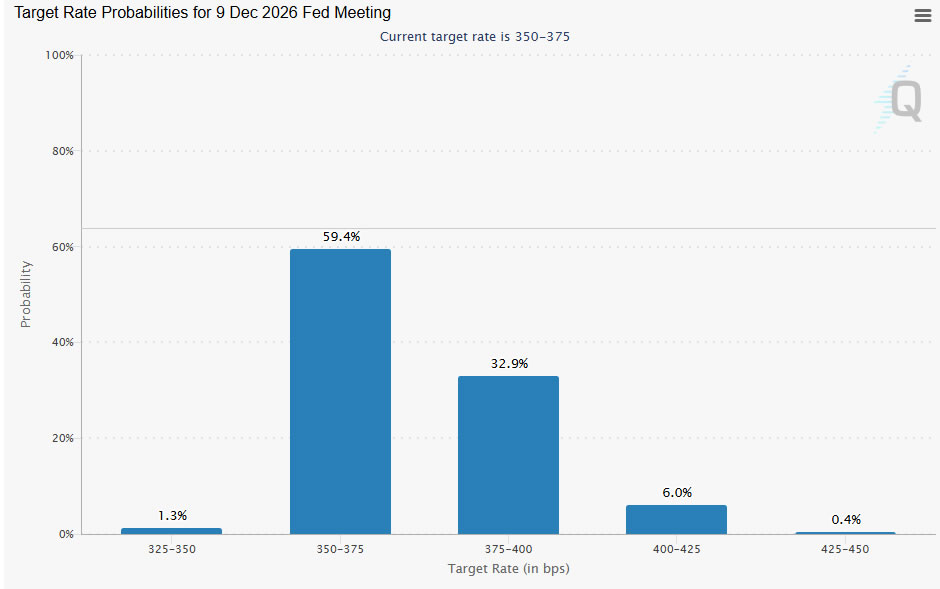
Importantly, however, markets are still only cautiously pricing outright additional Fed tightening. Fed funds futures currently imply roughly a 40% probability of one more rate hike before year-end. But the more important shift may be broader expectations that rates could stay elevated for significantly longer under a more inflation-focused Fed leadership structure.
At the same time, energy markets continue signaling little confidence that geopolitical risks are meaningfully improving.
Despite the highly anticipated Trump-Xi summit in Beijing, Brent crude remains stuck near $107 rather than collapsing lower. For markets, that is interpreted as evidence that traders do not believe the Strait of Hormuz crisis is close to resolution.
Trump said today that both leaders “feel very similar” regarding Iran and that: “We want the straits open.” But the remarks offered little operational clarity on how shipping security would actually be restored.
China’s Foreign Ministry took a slightly firmer tone on Friday, calling for a “comprehensive and lasting” ceasefire while stating: “Shipping routes should be reopened as soon as possible.” The ministry also emphasized that “dialogue and negotiation are the right path” and said the two leaders reached “a series of new consensuses,” though Beijing again avoided providing specifics.
That ambiguity appears to be preventing oil traders from removing the substantial war premium embedded in crude markets. If anything, Brent remaining near $107 despite the summit likely reinforces investor belief that energy-driven inflation pressures could remain elevated well into the second half of the year.
That leaves markets entering the Warsh era facing a difficult combination:
- structurally higher yields,
- persistent inflation risk,
- elevated oil prices,
- and no convincing resolution to the Hormuz crisis.
In currency markets, Dollar led gains broadly during the Asian session. Yen also strengthened modestly on defensive positioning, while Euro outperformed most commodity-linked currencies. Kiwi was the weakest performer of the day, followed by Aussie and Swiss Franc, while Sterling and Loonie traded more mixed.
In Asia, at the time of writing, Nikkei is down -1.68%. Hong Kong HSI is down -0.87%. China Shanghai SSE is up 0.12%. Singapore Strait Times is down -0.08%. Japan 10-year JGB yield is up 0.097 at 2.732. Overnight, DOW rose 0.75%. S&P 500 rose 0.77%. NASDAQ rose 0.88%. 10-year yield fell -0.02 to 4.46.
USD/JPY Climbs Toward 160 as Rising US Yields Test Japan’s Intervention Resolve Again
USD/JPY climbed back toward the critical 160 level as surging US Treasury yields widened the US-Japan rate gap and intensified doubts over whether Japanese intervention can still effectively stabilize the Yen. Read More.
Japan PPI Surges 4.9% as Energy Shock Intensifies
Japan’s wholesale inflation accelerated sharply in April as higher oil prices, chemical costs, and a weak Yen intensified imported inflation pressures, reinforcing expectations for further BoJ tightening. Read More.
New Zealand PMI Falls to 50.5 as New Orders Turn Negative
New Zealand’s manufacturing sector lost significant momentum in April as new orders fell into contraction territory and firms reported rising freight, fuel, and supply-chain pressures linked to the Iran war. Read More.
Fed’s Williams Sees No Need for Rate Changes Right Now
Fed’s John Williams said policymakers see no urgent need to change interest rates despite rising inflation pressures tied to the Middle East conflict, emphasizing that longer-term inflation expectations remain stable for now. Read More.
Fed’s Barr Says Shrinking Balance Sheet Should Not Trump Financial Stability
Fed Governor Michael Barr warned that proposals to shrink the Fed’s balance sheet by weakening bank liquidity requirements could make the financial system more fragile rather than safer. His remarks highlighted growing debate inside the Fed ahead of the Kevin Warsh era. Read More.
GBP/USD Daily Outlook
Daily Pivots: (S1) 1.3352; (P) 1.3442; (R1) 1.3490; More...
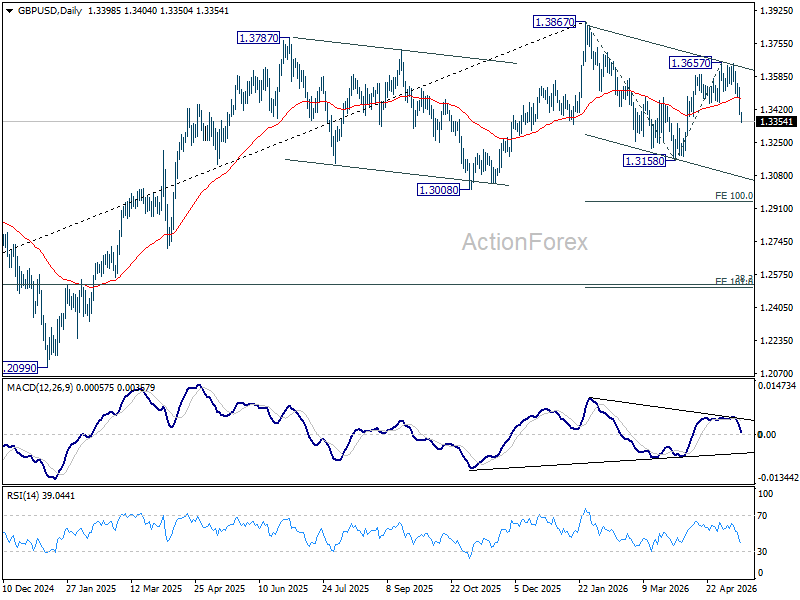
GBP/USD's steep decline today suggests that rebound from 1.3158 has already completed at 1.3657. Intraday bias is back on the downside for retesting 1.3158. Decisive break there will target 100% projection of 1.3867 to 1.3158 from 1.3657 at 1.2948. For now, risk will stay on the downside as long as 1.3453 support turned resistance holds, in case of recovery.
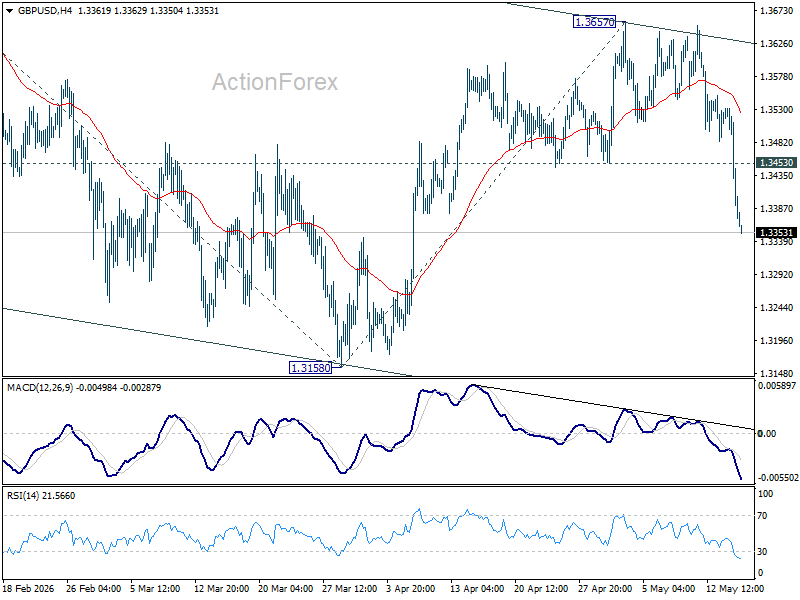
In the bigger picture, current development suggests that price actions from 1.3867 are merely a corrective pattern within the broader up trend from 1.0351 (2022 low). With 1.3008 support intact, medium term bullishness is maintained and break of 1.3867 is in favor for a later stage, towards 1.4248 key resistance (2021 high). However, firm break of 1.3008 will at least bring deeper fall to 38.2% retracement of 1.0351 to 1.3867 at 1.2524, with increased risk of bearish reversal.
XAUUSD Elliott Wave Update: Gold in Expanded Flat Correction
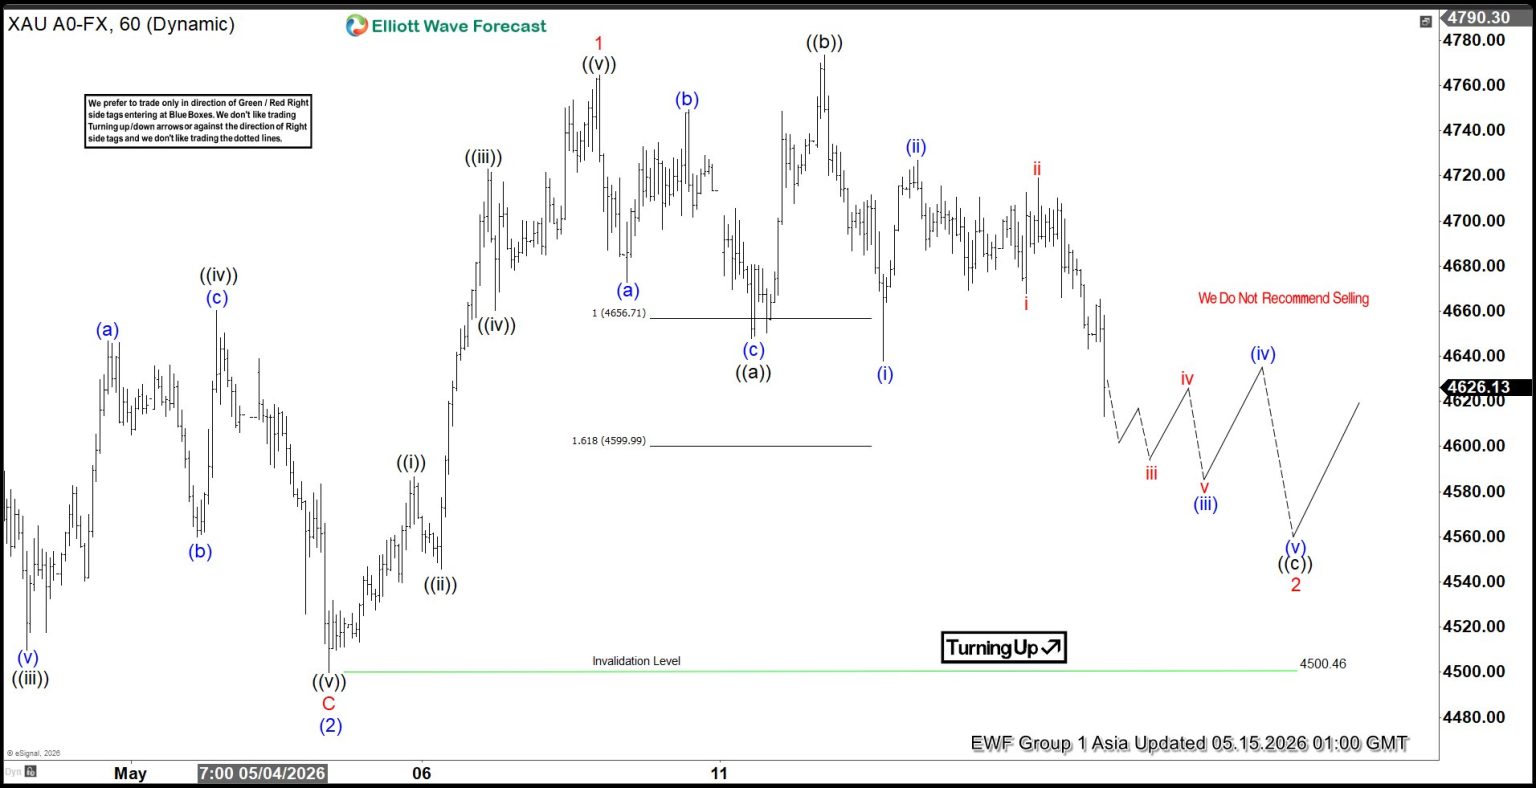
After completing the correction at $4098.74 on the March 23 low, Gold (XAUUSD) initiated a rally in a clear impulsive structure. From that level, wave (1) advanced and concluded at $4890.97. The subsequent pullback in wave (2) finished at $4500.46, as reflected in the one‑hour chart. Following this retracement, the metal resumed its upward movement in wave (3). However, confirmation of this view requires a decisive break above the prior wave (1) peak at $4890.97. From the wave (2) low, wave 1 advanced and ended at $4764.73.
At present, wave 2 is unfolding as a corrective phase to address the cycle that began on May 5, 2026. The internal structure of this wave is developing as an expanded flat formation within the Elliott Wave framework. Declining from wave 1, wave ((a)) terminated at $4647.71, while wave ((b)) completed at $4773.58. The ongoing wave ((c)) of 2 is progressing lower in impulsive fashion, with potential to retest the $4500.46 level before a renewed advance occurs. This decline is part of the corrective sequence rather than a reversal of the broader trend.
In the near term, the key pivot remains the $4500.46 low. As long as this level holds, the expectation favors a resumption of the upward cycle once the correction completes. The broader structure suggests that Gold is consolidating within a corrective pattern, yet the underlying impulsive bias remains intact. Traders should monitor the completion of wave ((c)) closely, as it will likely set the stage for the next bullish phase.
Gold Futures (XAUUSD) 60-Minute Elliott Wave Chart
XAUUSD Elliott Wave Video:
https://www.youtube.com/watch?v=vGZhaFIAs98
Oil Surges Past $106, USD Rises as Fed Signals Steady Rates
Key Takeaways
- Brent crude oil surged above $106/bbl as the prolonged Iran conflict and continued Strait of Hormuz disruption reinforced fears of persistent global energy supply shortages and inflation pressures.
- The Federal Reserve maintained its “higher for longer” stance after stronger inflation data and elevated energy prices reduced expectations for rate cuts, while Kevin Warsh was confirmed as Fed chair, further shaping future policy expectations.
- The Trump-Xi summit kept markets cautious after Xi Jinping warned over Taiwan tensions, contributing to weakness across major Asia-Pacific equity indices despite continued resilience in US equities.
- Chart of the day: Nikkei 225 is now facing potential near-term weakness below 63,270 key short-term resistance, reinforced by a jump in oil prices.
Top Macro Headlines
- Trump-Xi summit culminates with Taiwan warning: US President Donald Trump and Chinese President Xi Jinping wrap up a two-day state visit featuring business deals, but Xi issued a stark warning that mishandling the Taiwan issue could push US-China relations to “a very dangerous place.”
- Oil hovers above $106 on Iran war: Brent crude oil prices surged 5% over the week, hovering above $106 a barrel as the prolonged Iran conflict keeps the key Strait of Hormuz largely shut.
- Fed holds steady amid inflation shock, Warsh confirmed: Federal Reserve Bank of New York President John Williams stated there is no need right now to weigh any change in interest rate policy amid the Middle East war uncertainty. Meanwhile, the US Senate approved Kevin Warsh as chair of the Federal Reserve.
- Gold set for weekly decline: Spot gold fell 0.6% to $4,619.49 per ounce, down 1.9% for the week, pressured by higher energy prices fueling fears of inflation and prolonged higher interest rates.
- US retail sales and jobless claims increase: US retail sales increased by 0.5% m/m in April, in line with expectations, while initial jobless claims also increased moderately last week, pointing to a stable but inflation-pressured economy.
Key Macro Themes
- Inflation and “higher for longer” rates: Higher energy prices from the Middle East war are driving up inflation, reinforcing fears that interest rates will remain higher for longer, as confirmed by NY Fed President John Williams.
- Geopolitical tensions drive commodities: The prolonged closure of the Strait of Hormuz is keeping oil prices, Brent, elevated above $106, while the US dollar's strength makes greenback-priced bullion more expensive, leading to a weekly decline in gold.
- Sino-US relations in focus: The Trump-Xi summit brings both economic deals and geopolitical warnings, specifically concerning Taiwan, making the Asia Pacific region highly sensitive to diplomatic outcomes.
Global Market Impact: Last 24 Hours
Equities: Despite global energy flows disrupting markets, the benchmark S&P 500 index extended its rally in 2026 towards the next psychological level of 7,500 and a record high.
Fixed Income: The prospect of prolonged higher interest rates, fueled by oil-driven inflation and affirmed by Fed officials, continues to exert pressure on bond markets.
FX: The US Dollar Index gained over 1% this week, supported by higher inflationary data in the US, in turn significantly reducing Fed rate cut bets in 2026 and 2027 according to the CME FedWatch tool.
Commodities: Brent crude oil is hovering above $106 a barrel, up 5% this week. Spot gold fell 0.6% to $4,619.49 per ounce, while spot silver fell 2.8% to $81.10.
Asia Pacific Impact
- Stock markets: Markets are closely watching the conclusion of the Trump-Xi talks in Beijing, especially after Xi's stark warning regarding Taiwan, which could impact regional stability and equities. A stronger USD is now triggering weakness in regional benchmark stock indices at the open. Nikkei 225 fell 0.8%, KOSPI dropped 2%, Hang Seng Index lost 0.8%, China A50 fell 0.3%, ASX 200 declined 0.3%, and STI slipped 0.1% at the time of writing.
- Currencies: The yuan is an outlier among its Asia Pacific peers. USD/CNH, offshore yuan, is trading almost unchanged at around 6.79, while AUD and NZD both decline by 0.4% against the USD, in line with lacklustre Asia Pacific equities.
- Economic outlook: The improving regional manufacturing recovery in Taiwan and South Korea faces headwinds from expensive energy imports and a fading global risk appetite if the ceasefire is broken.
Top 2 Events to Watch Today
- Conclusion of the Trump-Xi Beijing Summit Impact: USD/CNH, global equities
- US Industrial Production (Apr) - 9.15 pm SGT; consensus: 0.3% m/m, Mar: -0.5% m/m Impact: USD, US stock indices
Chart of the Day: Nikkei 225 Bearish Breakdown Below Ascending Channel Support
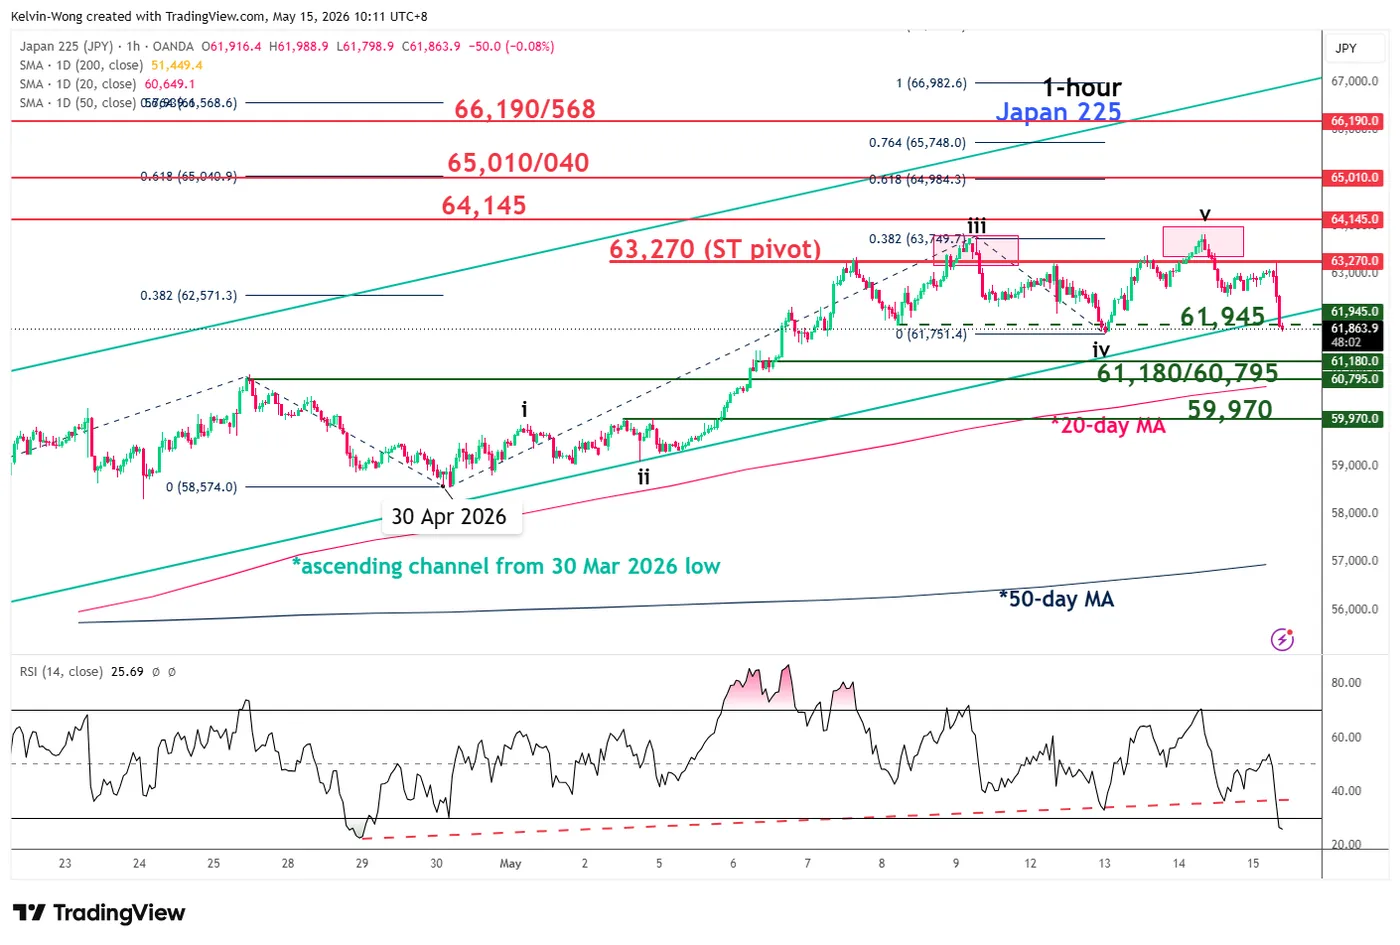
Fig. 1: Japan 225 CFD index minor trend as of 15 May 2026. Source: TradingView.
The Japan 225 CFD index, a proxy of the Nikkei 225 futures, is now staging an intraday decline of 1.7% at the opening on Friday, 15 May, Asian session.
Its price action is now breaking below a month-long ascending channel support at 61,945 from the 30 March 2026 low, which increases the odds of a minor corrective decline sequence to retrace towards its 20-day moving average.
Watch the 63,270 key short-term pivotal resistance for the next intermediate support to come in at 61,180/60,795, also the 20-day moving average. A break below 60,795 may trigger a further intraday drop towards 59,970 next.
On the flipside, a clearance with an hourly close above 63,270 invalidates the bearish scenario to revive the bullish impulsive up move sequence towards the next intermediate resistances, new all-time highs, at 64,145 and 65,010/040, Fibonacci extension cluster.
USD/JPY Climbs Toward 160 as Rising US Yields Test Japan’s Intervention Resolve Again
USD/JPY is once again approaching territory that could force Japanese authorities into difficult decisions. The pair surged through 158 on Friday as broad Dollar strength combined with another sharp rise in US Treasury yields. The US 10-year yield pushed above 4.5% in Asian trading, extending a global bond selloff that is currently dominating currency market dynamics. The latest move places USD/JPY back within striking distance of the psychologically and politically sensitive 160 level that previously triggered Japanese intervention.
The immediate driver is the widening yield gap between the US and Japan. Bond investors in U.S appears to be beginning to price a more hawkish policy environment under incoming Fed Chair Kevin Warsh, even while current Fed officials continue advocating a wait-and-see approach. Strong US inflation data this week, combined with resilient retail sales and stable employment conditions, reinforced fears that inflation linked to the Middle East energy shock could become more persistent, pushing Treasury yields sharply higher.
Importantly, however, markets are still only cautiously pricing additional Fed tightening. Current futures pricing implies roughly a 40% chance of one further rate hike by year-end. But in FX markets, even a modest repricing becomes highly significant when combined with Japan’s still-ultra-low interest rate structure and the BoJ’s cautious normalization path.
Meanwhile, Japanese officials are signaling concern about the broader global backdrop rather than simply Yen weakness itself. Finance Minister Satsuki Katayama said on Friday that G7 finance leaders are likely to discuss the recent surge in global bond yields. “These moves appear to be reinforcing each other across the major markets,” she said, referring to simultaneous selloffs in US Treasuries, Japanese government bonds, and UK gilts.
Her comments highlight an increasingly uncomfortable reality for Tokyo: intervention becomes far less effective when global bond markets are simultaneously widening the underlying yield differential supporting Dollar strength. Even if Japanese authorities step into FX markets again, it is uncertain whether intervention alone can sustainably reverse USD/JPY higher while US yields continue climbing faster than Japanese yields.
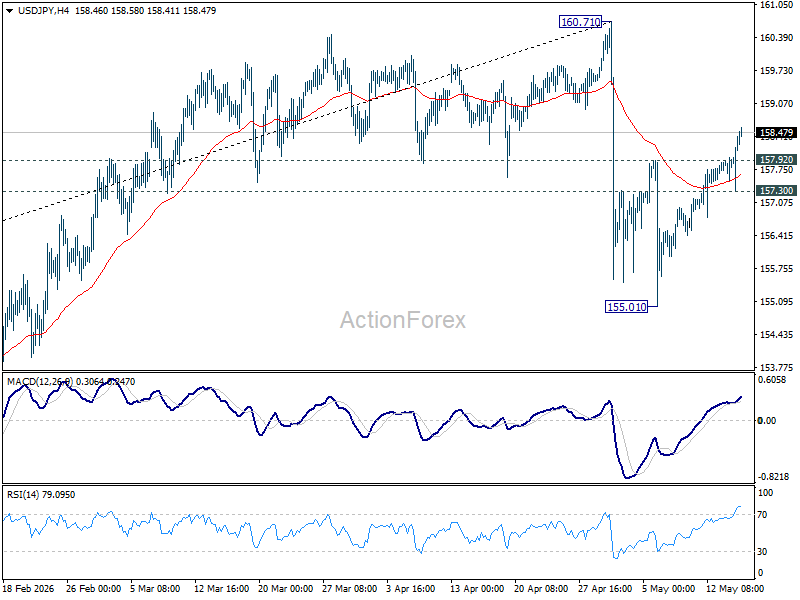
Technically, USD/JPY's break of 157.92 resistance suggests that pullback from 160.71 has already completed at 155.01. Rebound from there is now seen as the second leg of a corrective pattern from 160.71. Further rise could be seen towards 160.71 but strong resistance should emerge around there to bring reversal. Meanwhile, break of 157.30 minor support will argue that the third leg could have already started back towards 155.01.
Cliff Notes: Beyond the Horizon
Key insights from the week that was.
The 2026/27 Federal Budget was the main event in Australia this week. Our bulletin provides a detailed view of the Government’s fiscal position, policy measures and economic expectations over the forward estimates. Compared to the projections from MYEFO, the budget bottom line has improved owing to commodity price windfalls, with the deficit now expected to hold steady around 1.0% of GDP. Larger improvements in the Government’s finances are anticipated in the outer years as the Government’s major saving measures deliver. Of particular note is the clamp-down on NDIS spending announced in April, which is expected to relieve budget pressure from payment cost inflation and help keep Federal net debt low versus other OECD countries.
The tax reform proposed in the Budget was also consequential and broad-based, impacting negative gearing, the capital gains tax discount and discretionary trusts. Our conversation with Chief Economist Luci Ellis explores these proposed changes and the other key measures for households. Budget night also saw a number of initiatives put forward for business and SMEs, alongside a range of reforms that should help foster productivity growth in the long run. While meaningful, these measures are not expected to materially add or detract from the fiscal impulse over the next couple of years, thereby having little impact on the RBA’s policy calculus.
Our Q1 Westpac-DataX Consumer Panel meanwhile showed that consumers are having to reduce savings and discretionary consumption to absorb the spike in fuel and electricity prices (the latter now due to the roll-off of government rebates). Mortgage holders are well placed in aggregate to weather the shock from the Middle East and interest rate rises; but the distribution of buffers is varied, leaving some more exposed. Wages growth remains robust and is only slowing gradually, offering support to consumer demand without posing an immediate threat to inflation. That said, the pass-through of non-labour input cost inflation was a key message in this week’s NAB business survey, giving the RBA cause to remain cautious of inflation’s potential persistence.
Last Friday in the US, nonfarm payrolls beat expectations, rising 115k in April with only a small -16k revision to the previous two months. This left the three-month average at 48k, consistent with labour demand and supply being in balance. The unemployment rate remained steady at 4.3% as the participation rate edged down 0.1ppts. On a multi-month view, the labour market can be characterised as a ‘low hire, low fire’ environment, a sentiment echoed by FOMC member Schmid this week. This backdrop should result in moderate wage growth over the coming year.
The April CPI then came in as expected at 0.6%, 3.8%yr. The headline outcome reflected a further 5.4% gain for gasoline prices after March’s 21.2% surge. An outsized 0.6% increase in the shelter component was also observed, reportedly biased up by a delayed sample reset following the government shutdown late last year. Abstracting from these two effects, underlying inflation was modest in the month. Energy was also a major contributor to import prices in April, up 1.9% (0.7% ex-petroleum) to be 4.2% higher over the year. Seeing as the US is an energy product exporter, export prices have also strengthened of late, up 3.3% in April to be up 8.8%yr. US consumers look to be weathering the surge in energy prices well so far, headline and control group retail sales up 0.5% in April, a solid gain. Tax refunds have supported spending of late, and established households continue to benefit from fixed interest rates and wealth gains.
China’s price data was also stronger than expected in April because of energy prices. Consumer inflation lifted to 1.2%yr, while producer prices were up 2.8%yr. Producer price gains were concentrated in the most energy-intensive sectors such as metals, while sectors more vulnerable to excess capacity saw price declines. While recent data has been encouraging for China’s deflationary cycle, it is worth noting that it’s the supply-side driving the outcomes, not demand. Further fiscal support will be required to sustainably lift China out of deflation.
Of course, the main event in China this week was not a data release but instead the meeting between President Xi and President Trump. While limited in terms of the detail, the outcomes were productive. The US has reportedly agreed to reduce its controls over China’s access to technology; and in return, China will buy more commodities from the US. A “Board of Trade” is also to be set up to allow trade disputes to be resolved through bilateral negotiation. President Trump also reportedly emphasised the need for China to help bring the conflict in the Middle East to an end and re-open the Strait of Hormuz. Whether progress is seen on that front is an open question. President XI has been invited to Washington in September to continue in-person discussions.
USD/JPY Recovery Nears Make-Or-Break Moment For Trend Direction
Key Highlights
- USD/JPY started a decent upward move above 157.20.
- A key rising channel is forming with support at 157.65 on the 4-hour chart.
- EUR/USD could extend losses if it settles below 1.1650.
- GBP/USD corrected some gains and might revisit 1.3300.
USD/JPY Technical Analysis
The US Dollar remained supported and recovered above 157.00 against the Japanese Yen. USD/JPY even cleared 157.50 before the bears appeared.
Looking at the 4-hour chart, the pair spiked above the 50% Fib retracement level of the downward move from the 160.72 swing high to the 155.03 low. However, the bears remained active near the 100 simple moving average (red, 4-hour).
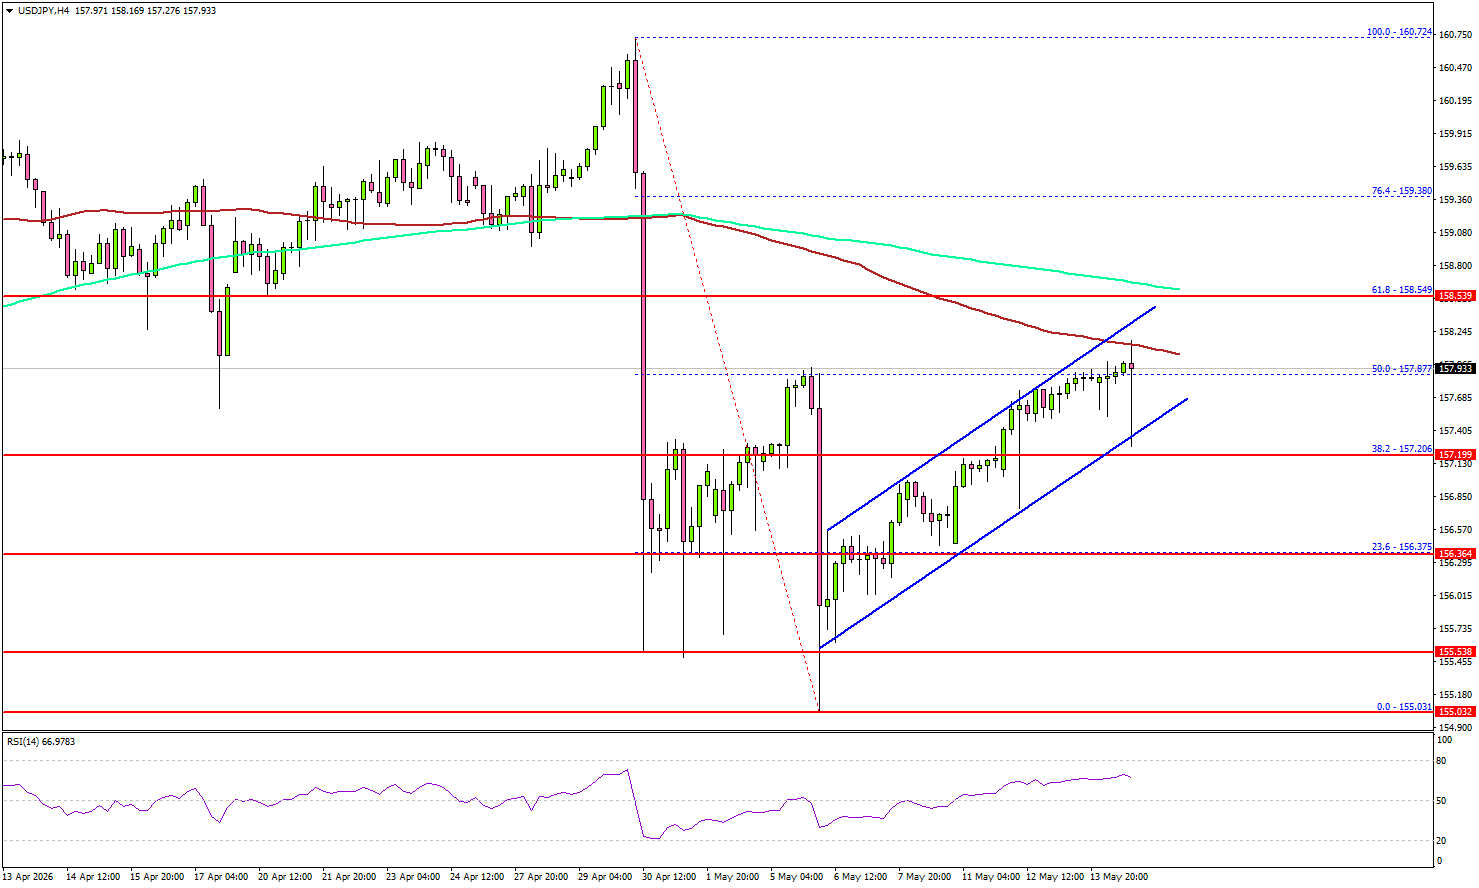
If the bears remain in action, the pair could start a fresh decline. The first major support sits near the 157.50 level. There is also a key rising channel forming with support at 157.65.
The next support could be 157.20. A close below 157.20 might initiate a drop to 156.35. Any more losses might open the doors for a drop toward the 155.50 zone. On the upside, the pair faces resistance at 158.20 and the 100 simple moving average (red, 4-hour).
The first major resistance sits at 158.55, the 200 simple moving average (green, 4-hour), and the 61.8% Fib retracement level of the downward move from the 160.72 swing high to the 155.03 low. A close above 158.55 could open doors for gains above 159.00. In the stated case, the bulls could aim for a move to 160.00.
Looking at EUR/USD, the pair remained in a negative zone, and the bears could aim for a clear move below the 1.1600 support.
Upcoming Key Economic Events:
- US Industrial Production for April 2026 (MoM) – Forecast +0.3%, versus -0.5% previous.
- NY Empire State Manufacturing Index for May 2026 – Forecast 7.5, versus 11.0 previous.
Japan PPI Surges 4.9% as Energy Shock Intensifies
Japan’s wholesale inflation accelerated sharply in April, adding to expectations that the Bank of Japan could move toward another rate hike as early as June. The Corporate Goods Price Index rose 4.9% yoy, accelerating from 2.9% yoy in March and far exceeding market expectations of 3.0% yoy. It marked the fastest annual increase since May 2023.
On a monthly basis, producer prices climbed 2.3% mom after rising 1.0% mom previously, highlighting the growing impact of higher energy and import costs on Japan’s heavily import-dependent economy.
Petroleum and coal product prices rose 5.3% yoy, while chemical goods prices surged 9.2% yoy, the fastest pace since September 2022, reflecting broadening cost pressures linked to the Middle East conflict and disruption surrounding the Strait of Hormuz.
The weak Yen is also amplifying imported inflation pressures. Japan’s yen-based import price index surged 17.5% yoy in April, the fastest rise since December 2022.
| Indicator | March 2026 | April 2026 | Notes |
|---|---|---|---|
| Japan CGPI / PPI (YoY) | 2.9% | 4.9% | Fastest since May 2023 |
| Japan CGPI / PPI (MoM) | 1.0% | 2.3% | Sharp acceleration |
| Yen-Based Import Price Index (YoY) | 17.5% | Fastest since Dec 2022 | |
| Petroleum & Coal Goods Prices (YoY) | 5.3% | Reflecting higher crude and jet fuel costs | |
| Chemical Goods Prices (YoY) | 9.2% | Fastest since Sep 2022 |
New Zealand PMI Falls to 50.5 as New Orders Turn Negative
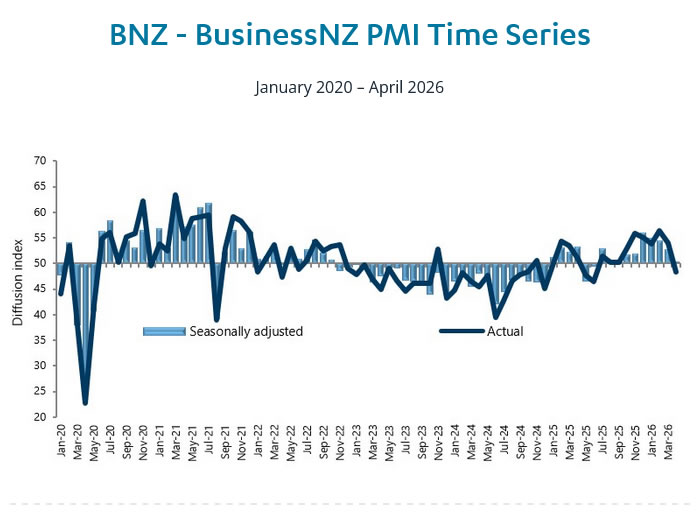
New Zealand’s manufacturing sector lost significant momentum in April, with the BusinessNZ Performance of Manufacturing Index falling from 52.8 to 50.5, only marginally above the breakeven 50 level that separates expansion from contraction. The details of the report pointed to a broad loss of momentum, particularly in forward-looking components tied to demand and supply-chain activity.
New orders dropped sharply from 55.0 to 48.2, slipping into contraction territory and signaling weakening future demand. Deliveries also deteriorated notably, falling from 49.6 to 46.5 — the weakest reading since July 2024 — highlighting growing disruptions in supply chains and raw material availability. Production eased from 53.4 to 51.7, while finished stocks declined from 53.8 to 50.5. Employment was the only major component to improve, rising from 51.8 to 53.4.
BusinessNZ Director of Advocacy Catherine Beard said many firms cited the impact of the Iran war on freight costs, fuel prices, and delivery times for raw materials. “The proportion of respondents highlighting negative influences on their business performance was 63.6%,” she noted, up from 62.0% in March.
BNZ Head of Research Stephen Toplis warned the slowdown may now be becoming more serious. “We feared it was only a matter of time before the wheels started to fall off and, alas, the April survey indicates that time may now have arrived,” he said.
| Indicator | March | April |
|---|---|---|
| BusinessNZ Manufacturing PMI | 52.8 | 50.5 |
| Production | 53.4 | 51.7 |
| Employment | 51.8 | 53.4 |
| New Orders | 55.0 | 48.2 |
| Finished Stocks | 53.8 | 50.5 |
| Deliveries | 49.6 | 46.5 |
| Negative Business Comments | 62.0% | 63.6% |
Fed’s Barr Says Shrinking Balance Sheet Should Not Trump Financial Stability
Federal Reserve Governor Michael Barr warned Thursday that efforts to shrink the Fed’s balance sheet by easing bank liquidity requirements would be misguided and could ultimately weaken financial stability. Speaking in New York, Barr pushed back against growing debate over reducing the central bank’s “footprint” in financial markets.
“I think shrinking the balance sheet is the wrong objective,” Barr said. He argued that many proposals aimed at reducing Fed holdings “would undermine bank resilience, impede money market functioning, and, ultimately, threaten financial stability.” Barr also warned that some of the proposed changes “would actually increase the Fed’s footprint in financial markets” by making banks more reliant on emergency central bank liquidity during periods of stress.
Barr specifically argued that lessons from the 2023 regional banking turmoil point toward stronger, not weaker, liquidity safeguards. “If anything, the bank stresses of 2023 suggest that liquidity requirements should go up and not down,” he said.
Fed’s Williams Sees No Need for Rate Changes Right Now
New York Fed President John Williams signaled Thursday that he remains comfortable keeping interest rates unchanged for now, arguing that policymakers are still waiting to see how inflation pressures tied to the Middle East conflict evolve. Speaking in New York, Williams said monetary policy is currently “in a good place right now” and emphasized there is no immediate case for either tightening or easing.
“I don't see there's any reason at all to raise rates right now or lower rates right now,” Williams said. While acknowledging that the Middle East war has pushed inflation pressures higher, he stressed that “longer-term projections have been stable, which is a good thing.”
Williams suggested he is not yet seeing signs that energy-driven inflation is spreading broadly through the economy. “We're not seeing... unusual second-round effects or persistent effects. But we just have to keep watching,” he said. Williams also noted that much of the tariff-related inflation impact may already have occurred.