Sample Category Title
Oil Tumbles Below USD 100/bbl on US-Iran Ceasefire Agreement
In focus today
All focus this morning is on the ceasefire in the Middle East and the impact on energy prices. Markets will closely monitor any information released on expectations for oil and gas flows.
Tonight, the minutes from FOMC March meeting are due for release. The minutes may get less attention than usual as the war in Iran was only in its early stages at the time of the meeting. That said, we will keep an eye out for any forward guidance on the balance sheet operations, which the Fed has lately provided mostly in the minutes.
Economic and market news
What happened overnight
In the US-Iran war, President Trump agreed to a two-week ceasefire with Iran just two hours before his deadline for Iran to reopen the Strait of Hormuz. Iran agreed to halt attacks and provide safe passage through the strait, while the US and Israel committed to the terms of the truce. Brent crude fell as low as USD92/bbl on the news, but the drop in prices is contingent on the pre-condition that traffic through the Strait of Hormuz resumes. For prices to stabilise at lower levels, oil and gas flows through the strait must pick up again, which remains uncertain. The deal looks fragile, particularly as Iran is allowed to charge fees on ships passing through. Stock markets surged, with S&P 500 futures rising over 2% and European futures up more than 5%, while the US dollar weakened on improved risk sentiment. The war is now in its sixth week, and scepticism remains about whether the ceasefire will hold, as many view it as a trust-building exercise. Significant uncertainties persist, and the oil market and broader markets are likely to stay volatile as they monitor activity from the Gulf.
In New Zealand, the Reserve Bank (RBNZ) kept its official cash rate unchanged at 2.25% during its April meeting, as expected. The central bank highlighted that rising oil and fuel prices driven by Middle East tensions are adding to near-term inflation pressures while weighing on economic growth. The RBNZ reiterated its focus on medium-term inflation, emphasising the importance of containing core inflation, wage growth, and inflation expectations.
What happened yesterday
In the euro area, the April Sentix investor confidence indicator declined to -19.2, its lowest level in a year, reflecting concerns over the war in Iran. The monthly drop is comparable to the sentiment deterioration seen in April last year following Trump's "Liberation Day" and is about two-thirds of the decline observed in March 2022 when the war in Ukraine began.
In Sweden, March inflation surprised on the downside, with CPI at 0.6% y/y (cons: 1.2%), CPIF at 1.6% y/y (cons: 2.2%), and CPIF-XE at 1.1% y/y (cons: 1.5%). Food prices declined -0.7% m/m, more than anticipated, while energy prices fell sharply by -5.3%, driven by milder weather lowering electricity costs after elevated levels in January and February. The data does not yet reflect any impact from the war in Iran, with the lower reading likely attributable to seasonality. Sweden's April services PMI rebounded strongly to 55.7 in March (prior: 48.3), supported by higher order intake and business volumes. Price pressures also rose, presenting a somewhat hawkish signal in contrast to the earlier low inflation print.
In Denmark, the Danish central bank did not sell EUR/DKK in FX intervention in March, where EUR/DKK hit 7.4728. This aligns with our expectation that it will allow the pair to rise to 7.4730-50 range before stepping into the market.
In the US, health insurers rallied after the government announced a 2.48% average increase in 2027 Medicare Advantage payment rates, exceeding the 0.09% proposed in January. The USD 13bn boost is expected to improve margins, with shares of UnitedHealth, CVS Health, and Humana rising in response.
Equities: The ceasefire agreed overnight between Iran, the US and Israel is clearly dominating market action this morning. What we are seeing is a classic "big war/cease fire reversal trade" across asset classes and equities.
In Asia, there is a pronounced cyclical rotation, led by tech, with the semiconductor space up around ~10% this morning. Defensives and low-vol stocks are underperforming, while energy is a clear laggard, down roughly 7%.
We will refrain from going into the details of the various statements from US and Iranian officials leading up to this, but once again this outcome is fully consistent with Trump's well-known negotiation tactics - maximum pressure followed by a "TACO"-style de-escalation. This remains the relevant framework for interpreting developments going forward, also as we approach the expiry of the two-week ceasefire. Importantly, this is only a ceasefire, and a lot can still go wrong, but it goes without saying that this is a step in the right direction. European equity futures are up around ~5% this morning, while US futures are higher by ~2-3%.
FI and FX: With Trump's deadline fast approaching, the US president announced a two-week ceasefire with Iran. This provided an imminent relief for markets, with oil prices collapsing below USD100/barrel, US yields falling by more than 10bp across the curve and EUR/USD rallying towards 1.17. The SEK, which weakened through yesterday's session on the back of lower-than-expected Swedish inflation, rallied sharply on the ceasefire announcement. As for the NOK, which is caught by opposing forces, EUR/NOK remains below 11.20. Although a lot of uncertainty still prevails, especially beyond the two-week ceasefire, risk sentiment seems to have turned and will likely act supportive for the time being.
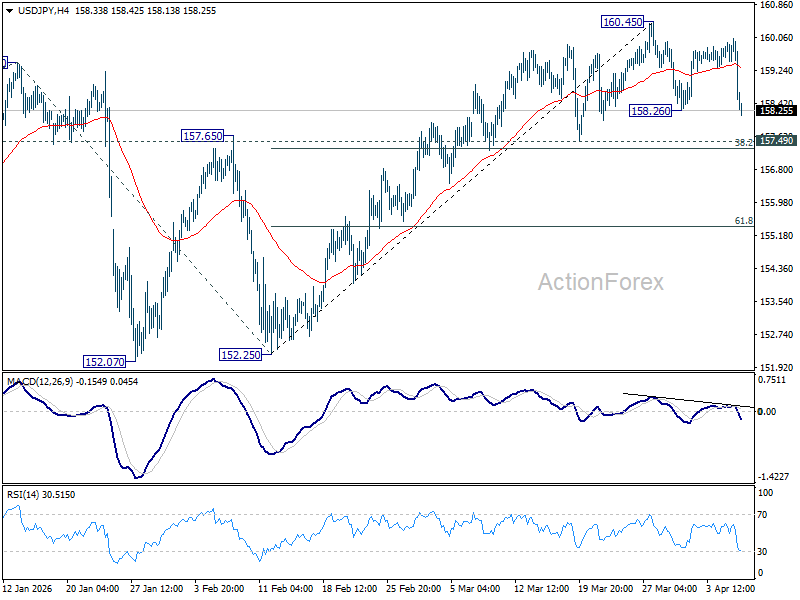
USD/JPY Daily Outlook
Daily Pivots: (S1) 159.39; (P) 159.71; (R1) 159.94; More...
USD/JPY is extending the corrective pattern from 160.45 high with another falling leg, and outlook is unchanged. Intraday bias remains neutral, and further rise is expected as long as 157.49 cluster support (38.2% retracement of 152.25 to 160.45 at 157.31) holds. Firm break of 160.45 will resume the rise from 152.25 to retest 161.94 high. However, firm break of 157.31/49 will bring deeper fall back to 61.8% retracement at 155.38 next.
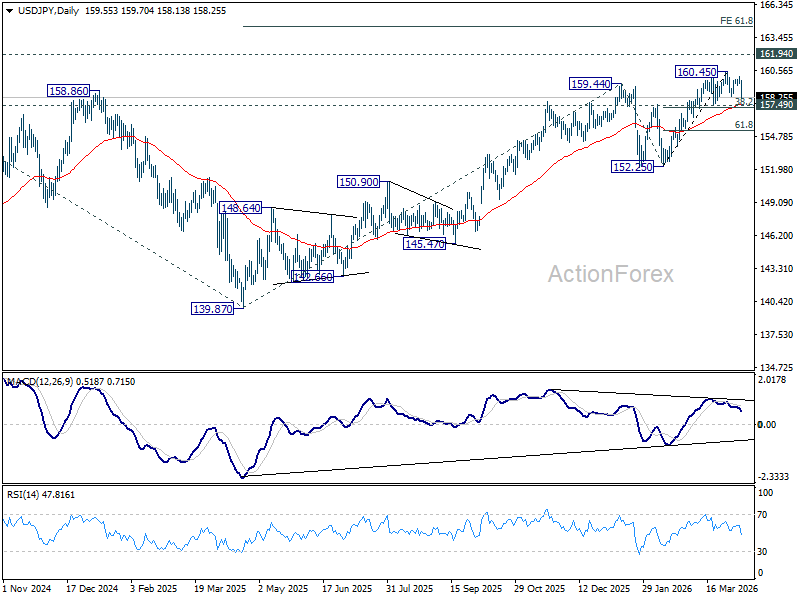
In the bigger picture, outlook is unchanged that corrective pattern from 161.94 (2024 high) should have completed with three waves at 139.87. Larger up trend from 102.58 (2021 low) could be ready to resume through 161.94. This will remain the favored case as long as 55 W EMA (now at 152.97) holds. Firm break of 161.94 will pave the way to 61.8% projection of 102.58 to 161.94 from 139.87 at 176.75.
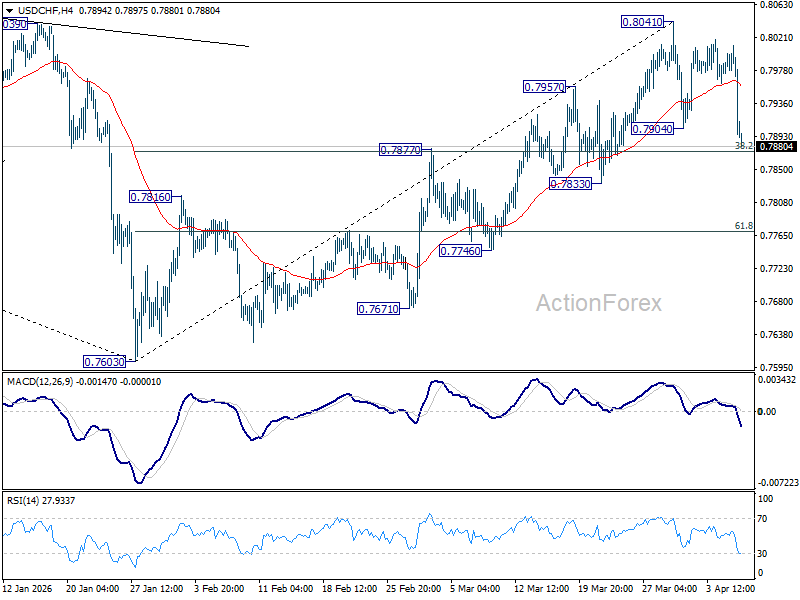
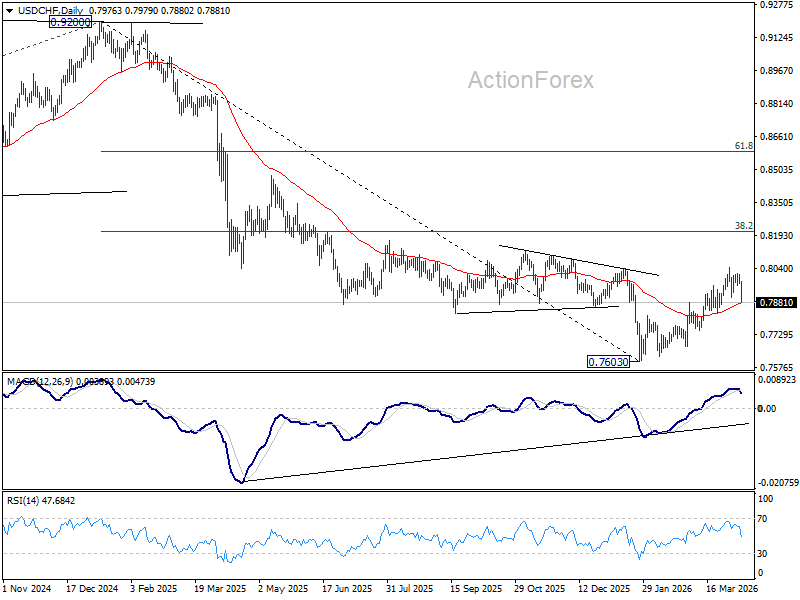
USD/CHF Daily Outlook
Daily Pivots: (S1) 0.7962; (P) 0.7987; (R1) 0.8002; More….
USD/CHF's fall from 0.8041 resumed by breaking through 0.7904. Immediate focus is now on 0.7877 cluster support (38.2% retracement of 0.7603 to 0.8041 at 0.7874). Decisive break there will argue that whole rise from 0.7603 as completed, and bring deeper fall to 61.8% retracement at 0.77706 and below. Nevertheless, strong bounce from 0.7874/7 will retain near term bullishness for another rise through 0.8041 at a later stage.
In the bigger picture, rebound from 0.7603 medium term bottom is seen as correcting the fall from 0.9200 only. rejection by 55 W EMA (now at 0.8081) will affirm this case, and setup down trend resumption to 100% projection of 1.0146 (2022 high) to 0.8332 from 0.9200 at 0.7382 at a later stage. Though, sustained break of 55 W EMA will suggest that it's probably correcting the larger scale down trend from 1.0146 (2022 high).
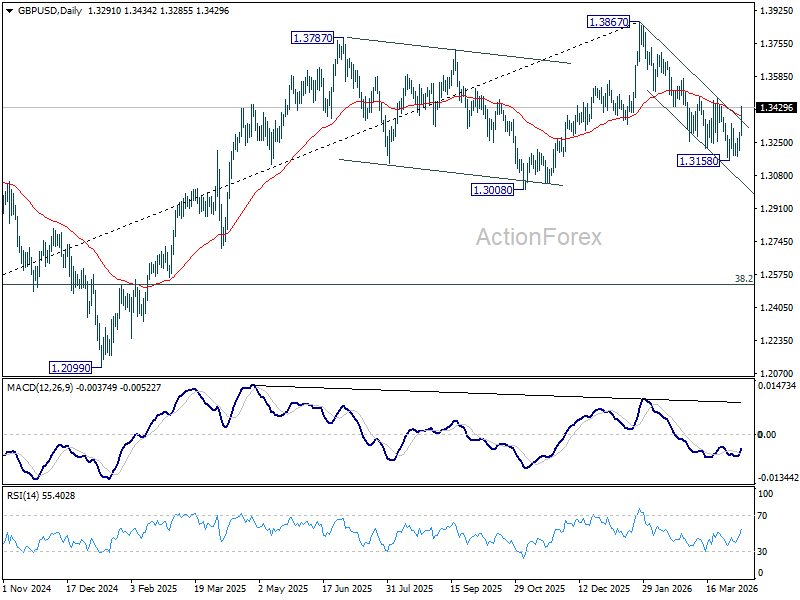
GBP/USD Daily Outlook
Daily Pivots: (S1) 1.3236; (P) 1.3268; (R1) 1.3327; More...
GBP/USD's rebound from 1.3158 accelerated higher today and immediate focus is now on 1.3479 resistance. Decisive break there will argue that fall from 1.3867 has completed as a correction at 1.3158. Intraday bias will be turned back to the upside for retesting 1.3867 high. Nevertheless, rejection by 1.3479 will keep near term outlook bearish for a break through 1.3158 low at a later stage.
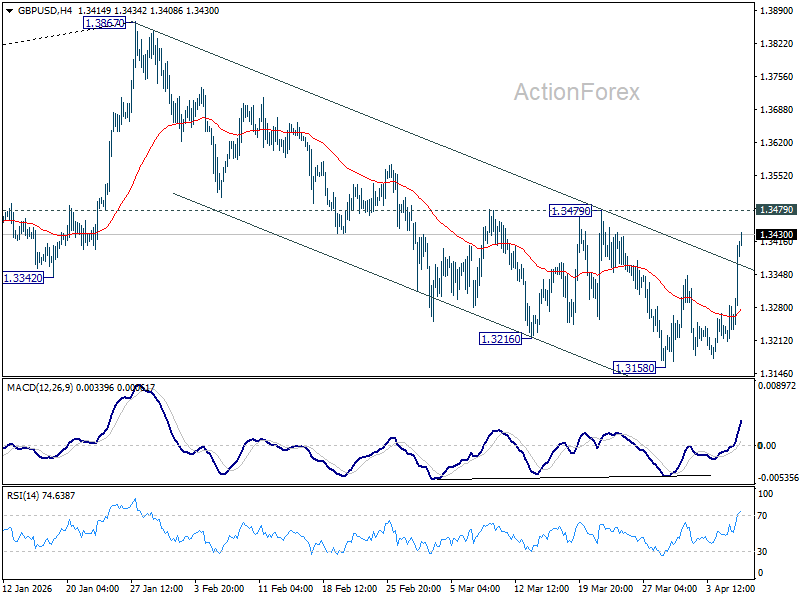
In the bigger picture, considering bearish divergence condition in both D and W MACD, a medium term top should be in place at 1.3867. Firm break of 1.3008 support will argue that fall from 1.3867 is at least correcting the rise from 1.0351 (2022 low) with risk of bearish reversal. That would open up further decline to 38.2% retracement of 1.0351 to 1.3867 at 1.2524. For now, medium term outlook will be neutral at best as long as 1.3867 resistance holds, or until further development.
EUR/USD Daily Outlook
Daily Pivots: (S1) 1.1546; (P) 1.1575; (R1) 1.1627; More….
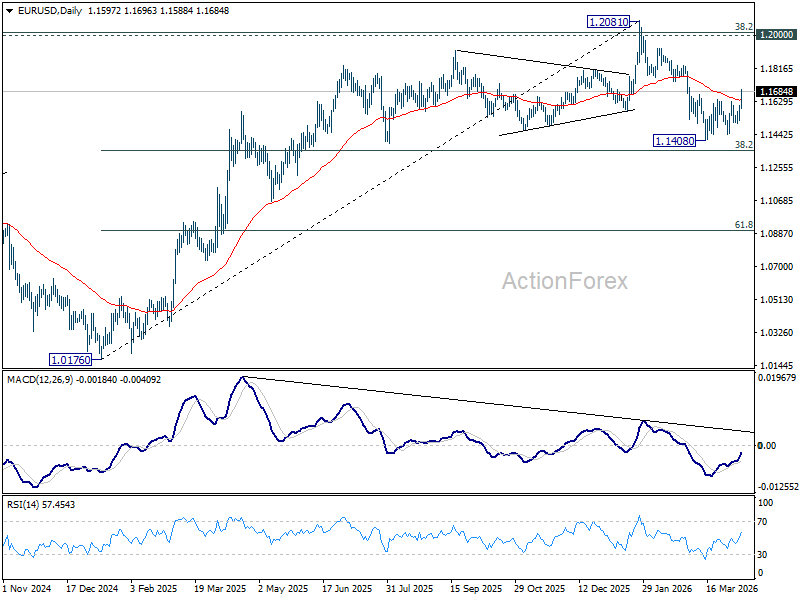
EUR/USD's extended rally and break of 1.1666 cluster resistance (38.2% retracement of 1.2081 to 1.1408 at 1.1665) now suggests that whole decline from 1.2081 high has completed at 1.1408. The is also supported by the strong break of 55 D EMA. Intraday bias is back on the upside for 61.8% retracement of 1.2081 to 1.1408 at 1.1824. Firm break there will pave the way to retest 1.2081 high. For now, risk will stay on the upside as long as 1.1503 support holds, in case of retreat.
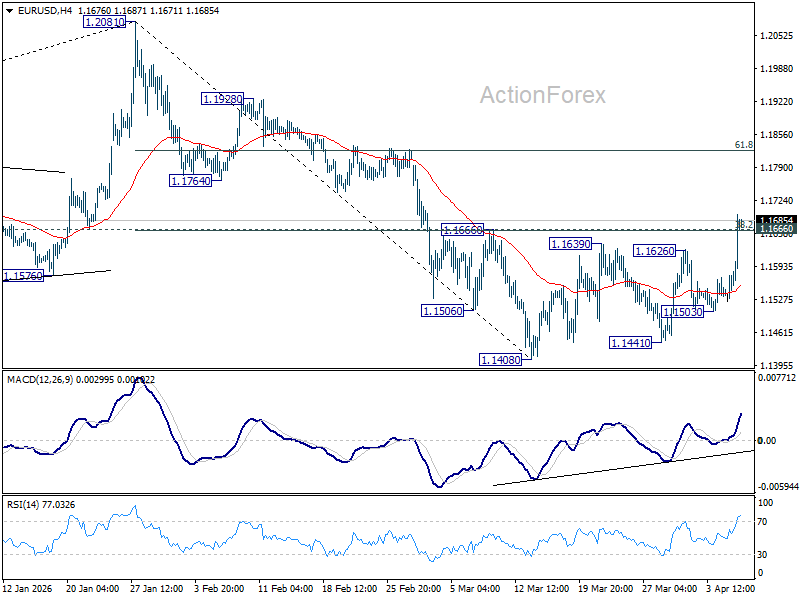
In the bigger picture, the strong support from 38.2% retracement of 1.0176 to 1.2081 at 1.1353 suggests that the pullback from 1.2081 is more likely a corrective move. Strong support was also found in 55 W EMA (now at 1.1505). Focus is back on 1.2 key cluster resistance level. Decisive break there will carry long term bullish implications. Nevertheless, break of 1.1408 support will revive the case of medium term bearish trend reversal.
Dollar Slides as Ceasefire Unwinds War Premium—Is EUR/USD Heading Back to 1.20?
Dollar’s sharp slide as oil price drops below $100 on the US-Iran ceasefire is raising a critical question for FX markets: whether the unwinding of war premium is now enough to push EUR/USD back toward the 1.20 psychological level. The move reflects a rapid shift from pricing disruption to pricing partial normalization—but the path forward remains conditional.
The turnaround was triggered just 90 minutes before the U.S. deadline for a major strike, when President Donald Trump announced a “double sided CEASEFIRE”. This followed days of extreme rhetoric, including warnings that “a whole civilization will die tonight”. The agreement also includes a safe reopening of Hormuz, allowing tanker flows to resume. This is triggering supply normalization, alongside an insurance premium collapse that had effectively frozen shipments over the past weeks.
Markets reacted with a powerful risk-on rotation. Equities surged across Asia, with South Korea’s KOSPI jumping around 6.5% and Japan’s Nikkei rising close to 5%.
The easing in energy markets feeds directly into macro expectations. Lower oil prices reduce inflation pressure, weakening the case for prolonged restrictive monetary policy. The result is an inflation shock unwind. This is where the Fed narrative comes into play. If oil continues to fall and inflation pressures ease, markets may begin to price a renewed Fed pivot toward a more dovish stance. That would further erode the Dollar’s, reversing its rally since late January.
That would provide the macro foundation for EUR/USD to extend higher, with prospect of retesting the key psychological and technical level at 1.20.
However, the move toward 1.20 for EUR/USD is not automatic. It hinges on whether current progress evolves into something more durable. Oil moving toward $90—and especially toward $80—would signal deeper normalization and strengthen the case for a sustained Dollar reversal.
Here, geopolitics becomes critical. The involvement of Pakistani Prime Minister Shehbaz Sharif and Field Marsh Asim Munir signals the emergence of a viable mediation channel. Additionally, Trump himself acknowledged Iran’s proposal as a “workable basis” for negotiation, suggesting a path toward resolution.
Yet, the situation remains fluid. Iranian Foreign Minister Abbas Araghchi emphasized that passage through Hormuz is currently “via coordination with Iran’s Armed Forces.” Any “misunderstandings” or skirmishes during this two-week window could quickly bring back war premium and halt the current rally.
The next major milestone is the Islamabad talks scheduled for Friday. If a formal U.S. delegation—potentially led by Vice President JD Vance—participates, the probability of oil moving toward $80 rises significantly. That would be a key signal that markets are transitioning from relief to genuine normalization.
In the currency markets, Kiwi is currently the leader for the day, additionally supported by RBNZ's hawkish hold. Aussie is the second strongest, and then Swiss Franc. Dollar is the runaway loser at the bottom, followed by Loonie which is apparently pulled down by oil prices. Euro is the third worst. Sterling and Yen are positioning in the middle.
In Asia, at the time of writing, Nikkei is up 5.19%. Hong Kong HSI is up 3.16%. China Shanghai SSE is up 2.03%. Singapore Strait Times is up 0.81%. Japan 10-year JGB yield is down -0.046 at 2.364. Overnight, DOW fell -0.18%. S&P 500 rose 0.08%. NASDAQ rose 0.10%. 10-year yield rose 0.008 to 4.343.
Oil Drops Below $100 on US-Iran Ceasefire, But $80 Seen as Floor Without Peace Deal
Oil has dropped below $100 as the US-Iran ceasefire unwinds war premium, but the absence of a peace deal means prices may stabilize above $80. Markets are pricing relief—but not resolution. Read More.
RBNZ Holds, Warns of “Decisive” Hikes if Inflation Expectations De-Anchor
RBNZ kept rates unchanged—but signaled it won’t hesitate to act. A warning of “decisive” hikes has put inflation expectations at the center of the policy outlook. Read More.
EUR/USD Daily Outlook
Daily Pivots: (S1) 1.1546; (P) 1.1575; (R1) 1.1627; More….
EUR/USD's extended rally and break of 1.1666 cluster resistance (38.2% retracement of 1.2081 to 1.1408 at 1.1665) now suggests that whole decline from 1.2081 high has completed at 1.1408. The is also supported by the strong break of 55 D EMA. Intraday bias is back on the upside for 61.8% retracement of 1.2081 to 1.1408 at 1.1824. Firm break there will pave the way to retest 1.2081 high. For now, risk will stay on the upside as long as 1.1503 support holds, in case of retreat.
In the bigger picture, the strong support from 38.2% retracement of 1.0176 to 1.2081 at 1.1353 suggests that the pullback from 1.2081 is more likely a corrective move. Strong support was also found in 55 W EMA (now at 1.1505). Focus is back on 1.2 key cluster resistance level. Decisive break there will carry long term bullish implications. Nevertheless, break of 1.1408 support will revive the case of medium term bearish trend reversal.
RBNZ Holds, Warns of “Decisive” Hikes if Inflation Expectations De-Anchor
The Reserve Bank of New Zealand held the Official Cash Rate at 2.25% as expected, but struck a clearly hawkish tone, warning it stands ready to deliver “decisive and timely increases” if inflation expectations begin to de-anchor. The decision underscores a policy stance that is on hold for now, but increasingly alert to upside inflation risks.
In its summary record, the RBNZ emphasized the uncertainty surrounding the inflation outlook, noting that the impact of the Middle East conflict will depend on how opposing forces evolve. Policymakers made clear that the balance of risks is shifting. “Any signs of significant second-round inflationary effects or increases in medium-term inflation expectations would require decisive and timely increases in the OCR,” the Committee said.
The central bank outlined a conditional path. If recent inflation pressures—largely driven by higher oil prices—prove temporary, the RBNZ would expect to move "gradually" toward more neutral policy settings as growth recovers. However, the emphasis on second-round effects signals growing concern that price pressures could become more persistent.
The discussion revealed a divergence within the Committee. Some members favored a more "pre-emptive response" to guard against inflation expectations drifting higher, while others stressed downside risks to growth and argued for patience. This split highlights the difficulty of calibrating policy in an environment shaped by both external shocks and domestic fragility.
Overall, the RBNZ delivered a hawkish hold that supports a tightening bias without committing to immediate action. The bar for future hikes has lowered if inflation expectations begin to shift. Markets are likely to interpret this as a signal that the next move, while not imminent, would be upward.
Gold at Crucial Crossroads, Is a Volatile Move Coming?
Key Highlights
- Gold started a fresh increase above the $4,500 zone.
- A major bearish trend line is forming with resistance at $4,735 on the 4-hour chart.
- WTI Crude Oil trimmed gains and traded below the $105 pivot level.
- Bitcoin regained traction and climbed above $71,500.
Gold Price Technical Analysis
Gold reclaimed the $4,250 pivot level and started a fresh increase against the US Dollar. The price cleared the $4,400 and $4,500 resistance levels.
The 4-hour chart of XAU/USD indicates that the price even surpassed the $4,500 resistance zone. Finally, the bears appeared near the $4,800 zone and the 100 Simple Moving Average (red, 4 hours). There is also a major bearish trend line forming with resistance at $4,735.
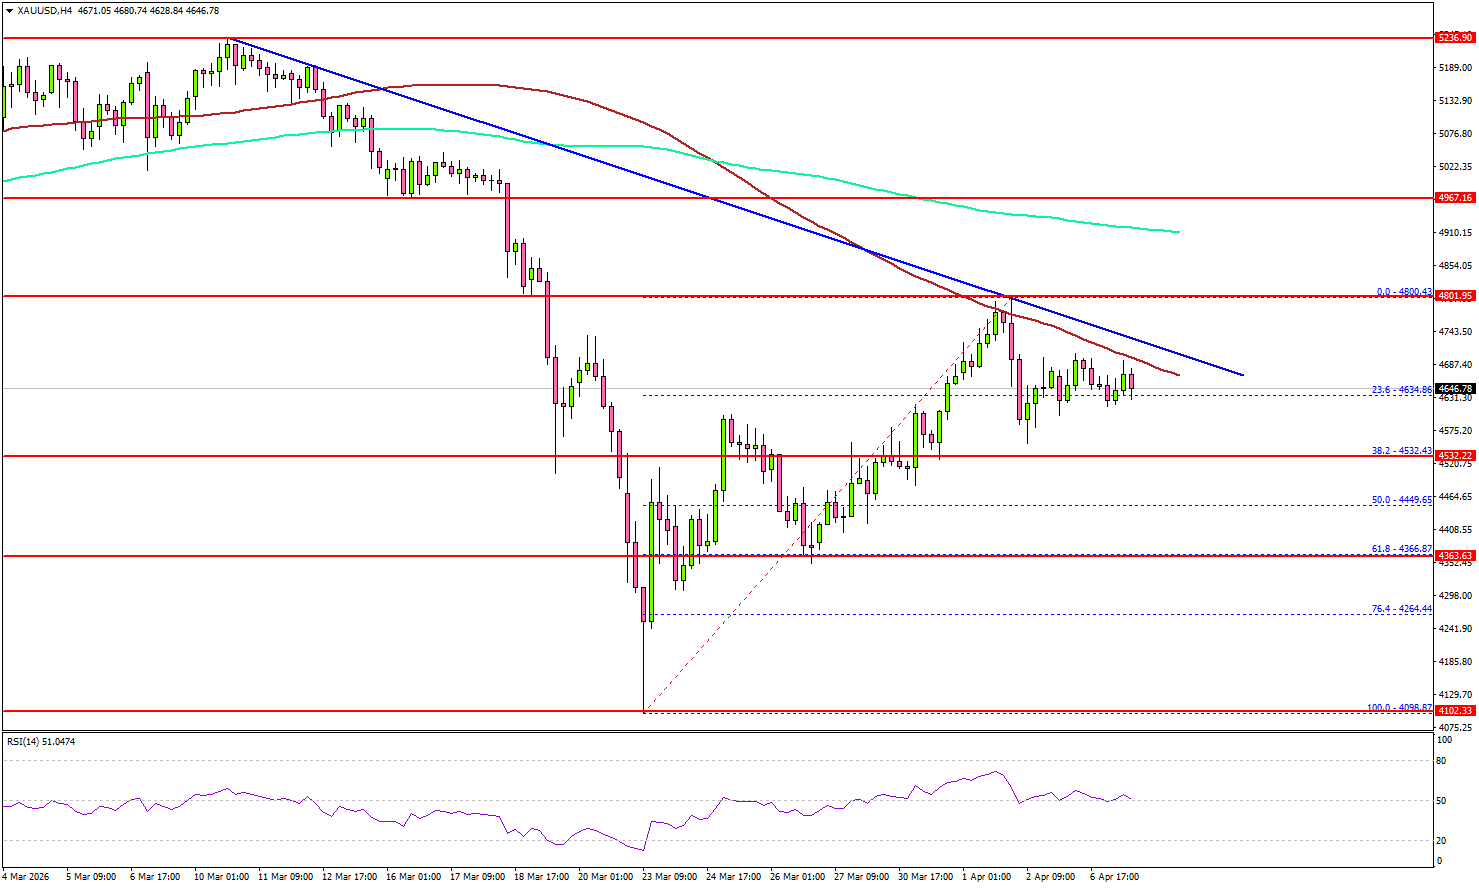
If there is another decline, Gold might find bids near the $4,430 level. The first major support sits at $4,365 or the 61.8% Fib retracement level of the upward move from the $4,098 swing low to the $4,800 high.
The next support could be $4,320, below which the price might slide to $4,265. The main support sits at $4,120. Any more losses might call for a test of $4,020 or even $4,000 in the coming days.
On the upside, immediate resistance is $4,750 and the trend line. The next major resistance sits near $4,800. The main resistance could be near the trend line at $4,900 and the 200 Simple Moving Average (green, 4 hours).
A clear move above $4,900 could open the doors for more upside. In the stated case, the bulls could aim for a move toward $5,000 or even $5,200.
Looking at WTI Crude Oil, the price failed to extend gains above $115 and started a fresh decline below the $105 support.
Economic Releases to Watch Today
- Fed's Daly speech.
- FOMC Minutes.
(RBNZ) OCR on hold at 2.25%
The Monetary Policy Committee today agreed to hold the OCR at 2.25 percent. Since the February Monetary Policy Statement, events in the Middle East have materially altered the outlook and the balance of risks for inflation and economic growth in New Zealand. In the near term, inflation is expected to increase and the economic recovery to weaken. The Committee is vigilant to any generalised inflationary pressure and stands ready to act to return inflation to its medium-term target.
The Middle East conflict has disrupted global supply chains, leading to significantly higher prices for oil and refined petroleum products. As a result, near-term inflation is increasing and economic growth is weakening in many countries. Global financial markets have been volatile and market interest rates have increased.
In New Zealand, the extent of the near-term increase in headline inflation will depend on how the conflict in the Middle East evolves and the magnitude and duration of the disruption to global supply chains and energy markets.
Medium-term inflationary pressure will depend on the extent to which higher costs influence price- and wage-setting behaviour by firms and workers in the economy. If medium-term inflation expectations increase, then inflation is likely to become more persistent. However, weak demand and spare productive capacity in the economy should constrain the degree to which higher costs can be passed on.
The current economic situation is different to 2022 when COVID-19 and Russia’s invasion of Ukraine disrupted global supply chains and increased energy prices. Back then, demand was growing strongly, adding to inflation pressure.
The Committee’s decision to hold the OCR balances the potential benefits of responding pre-emptively to the risk of higher medium-term inflation against the cost of unnecessarily stifling the economic recovery.
The Monetary Policy Committee is focused on ensuring that inflation returns to the 2-percent target midpoint over the medium term. This requires core inflation and wage growth to remain contained and medium- and long-term inflation expectations to remain around 2 percent. If these conditions are not met, decisive and timely increases in the OCR would be required.
Summary record of meeting – April 2026
Since the February Monetary Policy Statement, events in the Middle East have materially altered the outlook and the balance of risks for inflation and economic growth. Inflation is now expected to remain at the top of the Monetary Policy Committee’s (MPC) 1 to 3 percent target band in the March 2026 quarter and increase considerably in the near term. Near-term economic activity is also expected to be weaker, dampening the medium-term inflationary effects of the Middle East conflict. There is a risk that inflation could be significantly higher and output markedly lower than currently expected.
The Committee’s focus is on the medium-term outlook for inflation.
Conflict in the Middle East is leading to significant supply side disruptions
Conflict in the Middle East has significantly reduced the supply of oil, gas and other petrochemicals, including fertilisers, flowing from the Middle East through the Strait of Hormuz. The price of oil has increased substantially in the last month, while prices for many refined petroleum products have increased by even more. Oil and gas products are a key input into broader supply chains and are critical inputs for many sectors in New Zealand, such as transport, agriculture, and packaging.
The outlook for petrochemical prices depends on how the conflict in the Middle East evolves, the extent to which critical infrastructure is damaged, and how quickly supply chains adjust. Oil futures markets are volatile and currently suggest a relatively quick resolution to supply disruptions, with declines in oil prices expected over the coming months. The Committee believes the balance of risks to future oil prices is to the upside.
Global financial market volatility has increased in the wake of the shock. Equity prices have fallen in most jurisdictions, and the US dollar has appreciated against most currencies, reflecting expectations of weaker global growth. Financial markets have priced in expectations of higher central bank policy interest rates this year. However, at this stage, most advanced economy central banks have left interest rates unchanged at recent decisions.
Global inflation is expected to increase and growth to weaken
Prior to the onset of conflict in the Middle East, global economic growth had been resilient. Global inflation was also generally declining towards respective countries’ inflation targets. Disruptions to global supply chains and higher oil prices are likely to lead to higher inflation and weaker growth in the near term, particularly in countries heavily dependent on Middle East oil and gas. This includes many of New Zealand’s trading partners in Asia.
There is significant cross-country variation in the starting point for inflation, the fiscal and regulatory response to higher oil prices, and economic resilience to the shock. The monetary policy reactions across countries will likely differ.
Supply chain disruptions will lead to higher near-term inflation in New Zealand
Annual consumers price inflation increased to 3.1 percent in the December 2025 quarter, slightly above the Committee’s 1 to 3 percent target band. Higher oil prices will result in higher headline inflation in the near term. The extent of this increase will depend on how the conflict in the Middle East evolves and the magnitude and duration of the disruption to supply chains.
The Committee has updated its forecast for consumers price inflation for the first and second quarters of 2026. This forecast is based on observed higher fuel prices and current futures pricing, which assumes that Dubai crude oil prices drop below USD100 per barrel by the end of June. The Committee also assumes some near-term pass through into other consumers price inflation components, particularly transportation, airfares and food prices. These assumptions result in an inflation forecast of 3.0 percent in the March quarter and 4.2 percent in the June quarter. The Committee see significant uncertainties around this forecast and will update it at coming monetary policy meetings.
Economic growth is expected to be weaker in the near term
Prior to the conflict, New Zealand’s economic recovery was at an early stage. GDP growth of 0.2 percent in the December 2025 quarter was lower than expected, largely due to relatively weak household consumption and business investment. However, higher frequency indicators over January and February suggested that the recovery was gaining strength.
The Middle East conflict will result in weaker economic activity in the near term. Higher fuel prices are increasing costs, lowering profit margins for many businesses, and reducing household purchasing power. Increased global uncertainty is also expected to weigh on investment. Data received in recent weeks suggest a weakening in business activity and consumer confidence since the onset of the conflict. Recent discussions with businesses are consistent with a slowing in economic activity over March. Many firms reported that higher fuel prices are already being passed through to a range of other prices. Some firms are applying temporary fuel surcharges while others report difficulty in passing on cost increases.
The inflation outlook will depend on price setting behaviour and domestic demand
The Committee’s mandate is to focus on ensuring that inflation returns to the target mid-point over the medium term. The outlook for medium-term inflation pressures depends on the size and persistence of the inflationary impulse stemming from higher oil prices and the extent to which it is offset by weaker demand in the economy.
In the near term, the Committee expects higher fuel prices to spill over into increased transport and food prices, reflecting the high energy intensity of these products. Short-term inflation expectations are increasing.
Returning inflation to the 2 percent target mid-point over the medium term requires core inflation and wage growth being contained, and medium- and long-term inflation expectations remaining around 2 percent. The extent to which these criteria are met will influence the scope for the Committee to look through current near-term inflation or whether tighter monetary policy is required. The Committee will be looking to timely indicators to help make this assessment, such as surveys of households and businesses, intelligence from business visits and high frequency price and activity information.
The Committee expects second round effects of the oil shock on price- and wage-setting behaviour and inflation expectations to be constrained to some extent by weak demand and excess productive capacity in the economy. At the time of the February Monetary Policy Statement, the Committee judged that the economy was operating well below its productive capacity. While energy supply constraints could reduce potential output in the near term, it is still likely that spare capacity persists for longer as higher fuel costs and rising uncertainty weaken economic activity. This is a different starting point compared to when COVID-19 and Russia’s invasion of Ukraine in 2022 disrupted supply chains and increased energy prices. Back then, demand was growing strongly, adding to inflation pressure.
Domestic financial conditions have tightened since February
New Zealand wholesale interest rates have increased since the onset of the conflict. While this partly reflects expectations of OCR increases, some illiquidity in swap markets has accentuated these moves. Fixed-term mortgage rates have increased, with two-year rates up by around 20 basis points. This reduces the further stimulus that was expected in February from mortgage borrowers refixing at lower interest rates. Term deposit interest rates, particularly at the most popular six-month term, have not increased to the same degree.
The New Zealand dollar has depreciated somewhat in trade-weighted terms, consistent with broader moves in currency markets, posing some upside risk to inflation while benefitting exporters.
The Committee discussed risks to the medium-term outlook
The Committee noted that the balance of risks has shifted, and there are likely to be differences between the near term and medium term.
The Committee discussed the risk that the conflict has more persistent impacts on inflationary pressures. The Committee noted that current futures prices for oil imply a relatively quick resumption in oil supply and discussed the risk that supply chains could be disrupted for longer even if the conflict ends relatively soon.
The Committee discussed the risk of a larger change in price setting behaviour as firms seek to pass on higher fuel costs. This risk is accentuated by current tight business margins given weak activity and substantial cost pressures, which could limit the degree to which some firms are able to absorb further cost increases. This would result in inflation spreading beyond energy-intensive products into services, with core inflation and medium-term inflation expectations increasing and pushing up wage expectations.
The Committee also discussed the risk of a more pronounced decline in economic activity. Households have been cautious in the face of weak real income growth, high unemployment and house price weakness. Investment activity is also expected to remain weak. There is a risk that household and business caution becomes more pronounced, resulting in higher unemployment and weaker growth.
Business activity could also be constrained if it becomes difficult to secure productive inputs such as fuel, fertiliser or other products requiring petrochemicals such as plastic for packaging. This could accentuate disruptions in regional economies due to domestic energy constraints. At the same time, businesses and households are likely to adapt to adverse circumstances.
The Committee agreed to hold the OCR at 2.25 percent
The Committee noted that the net effect of the conflict in the Middle East on medium-term inflation pressures in New Zealand will depend on how the countervailing factors play out. It also noted that financial conditions had already tightened since the onset of conflict.
The Committee discussed the size and speed of any monetary policy response to the risks of higher medium-term inflation.
If the increase in near-term inflation is largely temporary, the Committee envisages gradually moving the OCR to more neutral levels as activity recovers and near-term inflationary pressures dissipate. However, any signs of significant second-round inflationary effects or increases in medium-term inflation expectations would require decisive and timely increases in the OCR to re-anchor inflation expectations. The Committee is vigilant to these risks.
On the timing of any increase in the OCR, members discussed that a pre-emptive response to medium-term inflation pressures could guard against the risk of inflation expectations becoming unanchored and reduce the extent of second round price increases. In turn, this could mean that monetary policy may need to tighten by less and result in output contracting by less than otherwise.
Conversely, the Committee noted the risk of reacting to higher near-term inflation and accentuating weakness in the real economy and labour market. Members noted that this could cause unnecessary volatility in output and employment if the conflict was resolved in the near term or if the economic outlook weakens by more than currently expected.
Some members placed more emphasis on the arguments in favour of an early monetary policy response, noting that further data and analysis would provide greater clarity about medium-term inflation pressures. Other members emphasised downside risks to growth and argued for more opportunity to judge the extent to which weaker growth balances the second-round effects of higher fuel prices.
On balance, the Committee decided to leave the OCR unchanged at this meeting. It will continue to assess the countervailing forces on the inflation outlook and stands ready to act decisively to ensure that inflation reaches the 2 percent mid-point of the target band in the medium term.
On Wednesday 8 April the Committee reached consensus to hold the OCR at 2.25 percent.
Attendees:
MPC members: Anna Breman (Chair), Carl Hansen, Hayley Gourley, Karen Silk, Paul Conway, Prasanna Gai
Treasury Observer: Struan Little
MPC Secretary: Chris Bloor
Oil Drops Below $100 on US-Iran Ceasefire, But $80 Seen as Floor Without Peace Deal
Oil’s immediate slide from around $115 to below $100 shows markets are embracing the US-Iran ceasefire and unwinding war premium. But with no peace deal in place, prices are likely to hold above $80 as residual risk remains. The sharp move reflects a rapid shift from pricing disruption to pricing partial normalization following the announcement of a two-week “double-sided ceasefire.”
The de-risking move was triggered by US President Donald Trump’s decision to suspend planned attacks on Iranian infrastructure, conditional on the “COMPLETE, IMMEDIATE, and SAFE OPENING of the Strait of Hormuz.” Trump declared, “This will be a double sided CEASEFIRE!”, signaling a temporary pause in escalation.
On the Iranian side, Foreign Minister Abbas Araghchi confirmed that vessels would be allowed to transit the Strait during the ceasefire period “via coordination with Iran’s Armed Forces.” This effectively enables a safe reopening of Hormuz, removing the most acute supply bottleneck.
A critical development underpinning this ceasefire is the emergence of Pakistan as a credible intermediary. Prime Minister Shehbaz Sharif and Field Marshal Asim Munir were directly credited by Trump, highlighting a significant shift in diplomatic backchannels. This marks the establishment of a viable mediation channel between Washington and Tehran, something markets had not been able to price previously.
The immediate market impact comes through supply normalization. With tankers resuming transit, the collapse in war-risk insurance premiums is allowing crude flows from Saudi Arabia, Iraq, and Kuwait to restart. This insurance premium collapse is a key channel through which oil prices have adjusted lower.
Crucially, this remains a pause, not peace. The agreement lasts only two weeks, and without tangible progress toward a broader settlement, a portion of the war premium is likely to remain embedded. This explains why the market is repricing lower—but not collapsing.
From a price framework perspective, Brent is now likely to test $90 and potentially extend toward $80. However, a sustained break below 80 would require clear progress toward a lasting peace deal. Without that, residual geopolitical risk should continue to anchor prices above this level.
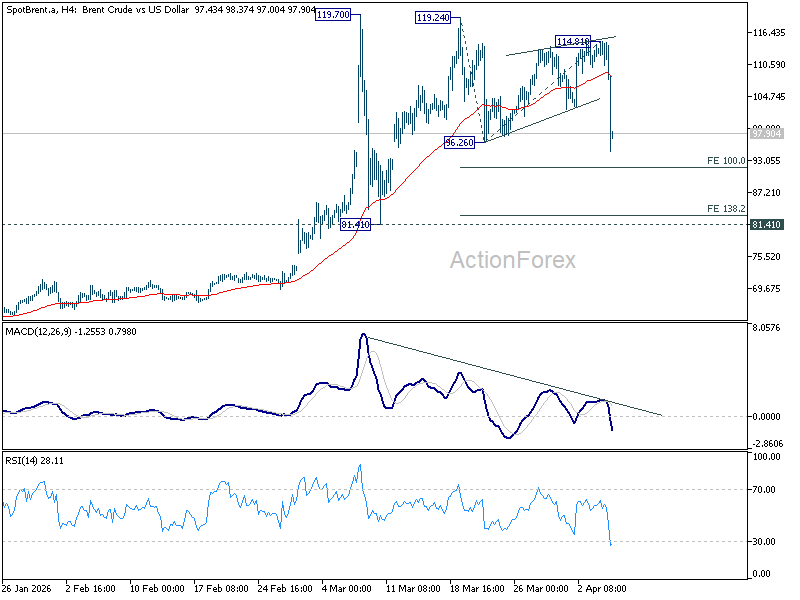
Technically, Brent crude's fall from 119.24 resumed by breaking 96.26. This decline is seen as the third leg of the pattern from 119.97 high. Immediate focus is now on 100% projection of 119.24 to 96.26 from 114.81 at 91.83. Firm break there will pave the way to 138.2% projection at 83.05, where it will meet 81.41 key support level.
This aligns with the broader view: oil is normalizing—but not yet transitioning back into a full peace regime.