

Sample Category Title
EUR/CHF Daily Outlook
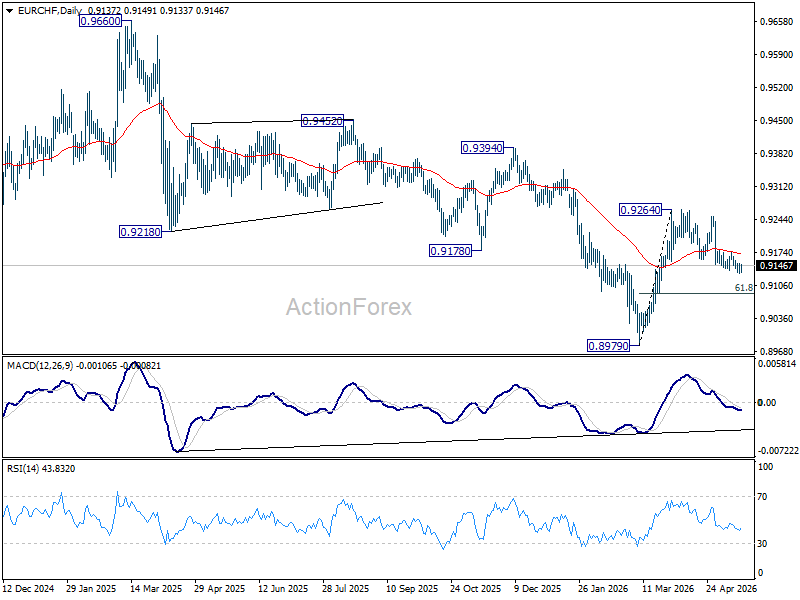
Intraday bias in EURCHF remains mildly on the downside at this point. Fall from 0.9264 would extend towards 61.8% retracement of 0.8979 to 0.9264 at 0.9088 and possibly below. On the upside, however, break of 0.9174 will turn bias back to the upside for stronger rebound to retest 0.9264 high instead.
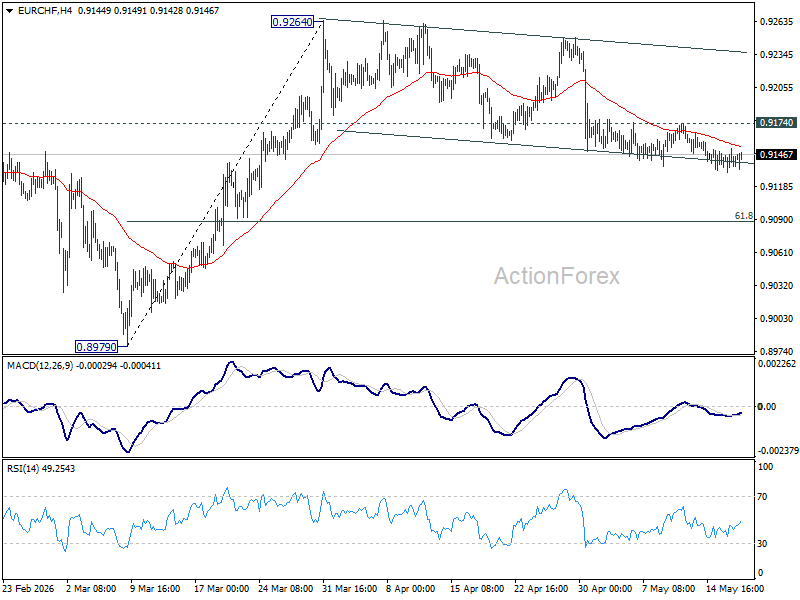
In the bigger picture, considering bullish convergence condition in W MACD, a medium term bottom should be in place at 0.8979. Sustained trading above 55 W EMA (now at 0.9241) will add more credence to this case. Further break of 0.9394 resistance will pave the way to 0.9660 resistance next. However rejection by the 55 W EMA will set up another fall through 0.8979 low at a later stage.
Gold Recovers Some Losses: What’s Driving the Market?
Gold rose to 4,600 USD per ounce on Tuesday, continuing its recovery from the previous session, and is now trading around 4,548 USD. Market sentiment was supported by hopes of a possible resumption of negotiations between the US and Iran, which has somewhat eased concerns over inflation and the energy crisis.
US President Donald Trump announced that he had postponed a planned strike on Iran following appeals from Saudi Arabia, Qatar, and the UAE. According to him, the Gulf states believe an agreement with Tehran is still possible.
Earlier, gold had been under pressure due to escalating tensions in the Middle East. Rising oil prices increased inflationary risks and reinforced expectations of further interest rate hikes by central banks globally.
Additionally, accelerating US inflation continues to weigh on the market. Investors are revising their expectations for Federal Reserve policy, with the likelihood of a rate cut this year declining significantly. Discussions are increasingly focusing on the potential for another rate increase before year-end.
Market attention now turns to the upcoming release of FOMC minutes and preliminary US PMI data. These reports could provide fresh signals regarding the state of the economy and the Fed’s next steps.
Technical Analysis
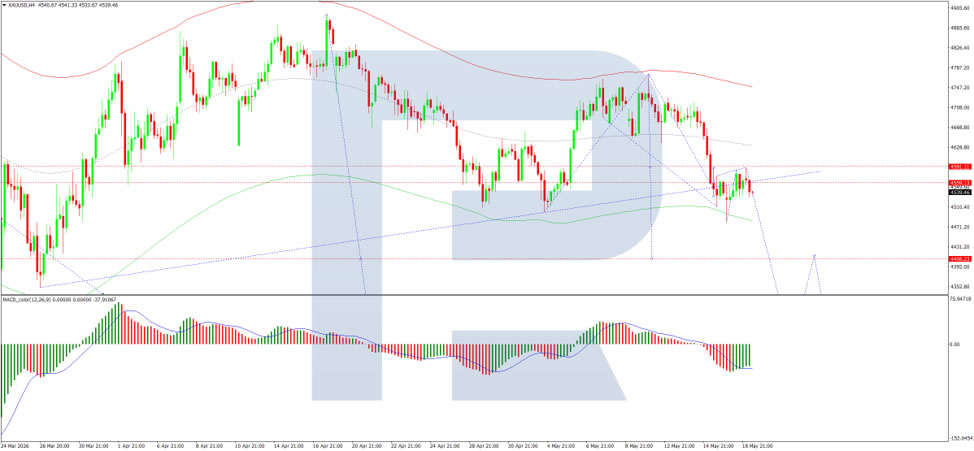
On the H4 XAU/USD chart, gold has rebounded towards 4,590 USD and is now moving lower towards 4,400 USD. A corrective bounce to 4,550 USD is possible, followed by a further decline towards 4,250 USD. The MACD indicator confirms the current downside momentum, with the signal line below the centre line and pointing firmly downwards.
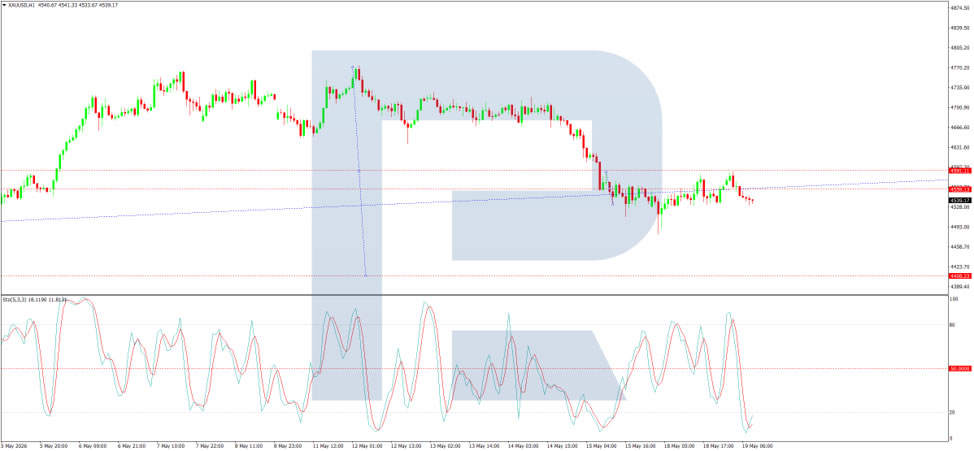
On the H1 chart, gold has broken below 4,555 USD and continues to move lower towards 4,400 USD. A corrective rebound to 4,550 USD (testing from below) may follow, before a further decline towards 4,250 USD. The Stochastic oscillator supports this scenario, with the signal line below 20 and pointing firmly downwards, indicating continued downside pressure.
Conclusion
Gold is recovering from recent losses, supported by easing geopolitical tensions and hopes for renewed US–Iran talks. However, strong US inflation and expectations of further Fed rate hikes continue to exert downward pressure. Technical indicators suggest a mixed short-term outlook, with potential corrective rebounds followed by further declines.
Eurozone Trade Surplus Shrinks Sharply to EUR 7.8B as Exports to US Collapse
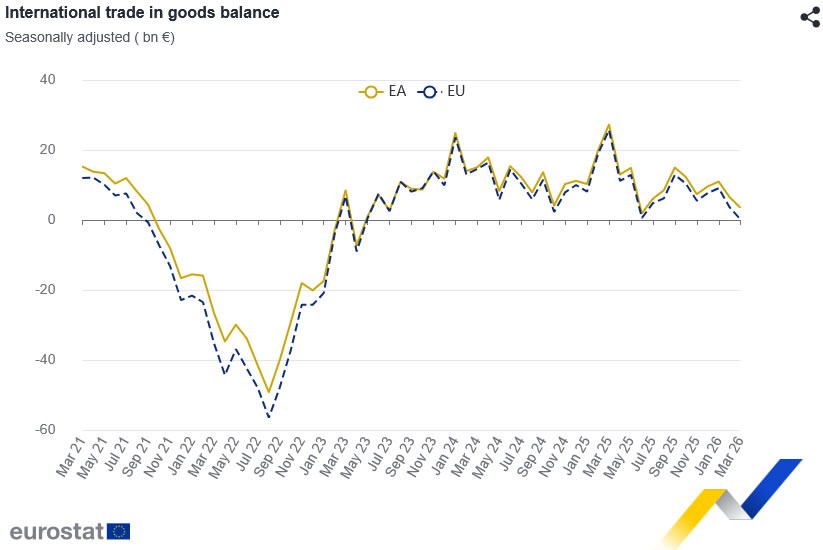
Eurozone trade data deteriorated sharply in March as exports weakened significantly while imports continued rising, highlighting the growing pressure from slowing global demand and escalating trade disruptions. Eurozone recorded a goods trade surplus of EUR 7.8B in March 2026, down dramatically from EUR 34.1B a year earlier. Exports to the rest of the world fell -5.5% yoy to EUR 265.3B, while imports rose 4.4% yoy to EUR 257.4B.
The broader European Union figures painted a similarly weak picture. The EU’s goods trade surplus narrowed from EUR 34.0B to EUR 5.9B as extra-EU exports dropped -8.7% yoy to EUR 233.9B, while imports increased 2.7% yoy to EUR 228.0B.
The deterioration was particularly severe in trade with the United States, where EU exports plunged -37.1% yoy to EUR 45.0B. Although imports from the US edged up only 1.1%, the bilateral trade surplus with the US collapsed from EUR 40.4B a year earlier to EUR 13.5B.
While exports to the UK and Switzerland remained relatively resilient, trade with China continued to show a large structural deficit, with imports from China rising 2.7% while exports slipped -2.3%.
| Indicator | March 2026 (EUR) | Change (yoy) |
|---|---|---|
| Euro Area Trade Balance | 7.8B | |
| Euro Area Exports | 265.3B | -5.5% |
| Euro Area Imports | 257.4B | +4.4% |
| EU Trade Balance | 5.9B | |
| Extra-EU Exports | 233.9B | -8.7% |
| Extra-EU Imports | 228.0B | +2.7% |
Key EU Trading Partners
| Partner | Exports (B) | Export Growth | Imports (B) | Import Growth | Trade Balance (B) |
|---|---|---|---|---|---|
| United States | 45.0 | -37.1% | 31.5 | +1.1% | 13.5 |
| China | 17.7 | -2.3% | 50.3 | +2.7% | -32.6 |
| United Kingdom | 32.9 | +6.9% | 14.9 | +1.1% | 18.0 |
| Switzerland | 23.0 | +10.1% | 13.9 | +11.4% | 9.1 |
GBP/USD: Sellers Rretain Control Below Key SMAs
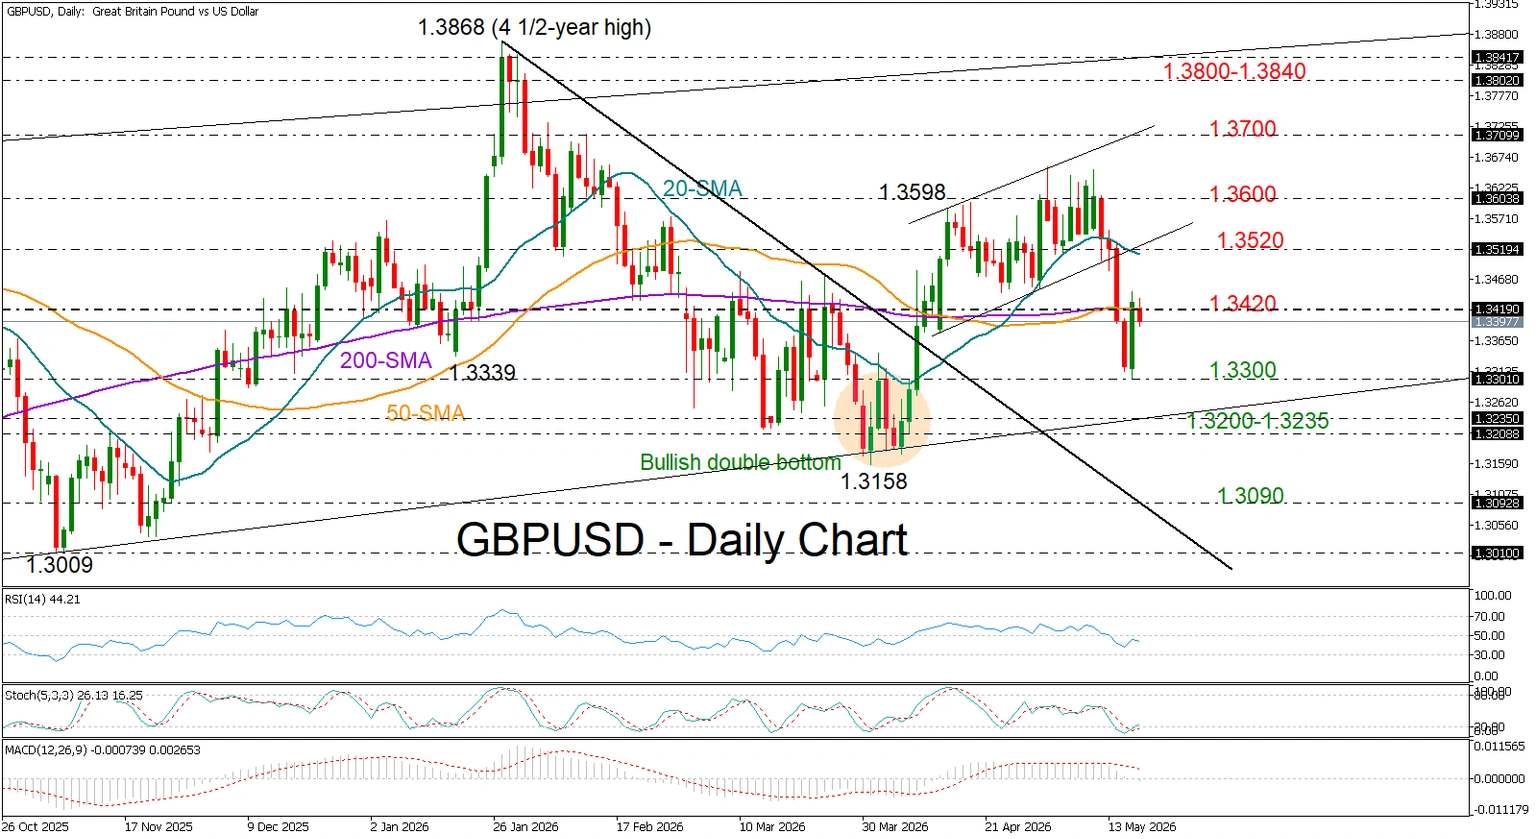
- GBP/USD stays cautious below SMAs at 1.3420 as UK unemployment rate rises.
- Short-term bias is bearish; fresh sellers await below 1.3200.
GBP/USD remains capped below its 50- and 200-day simple moving averages (SMAs) near 1.3420 as investors digest discouraging political and macroeconomic developments. Earlier today, the UK unemployment rate climbed back to 5.0%, while employment in April recorded a loss of 100k jobs.
From a technical perspective, short-term risks remain tilted to the downside, as the RSI continues to fluctuate below its neutral 50 level and the MACD is entering negative territory.
If the wall at 1.3420 holds firm, the pair may once again seek support near 1.3300. An additional safety zone could emerge around 1.3200-1.3235 before the broader outlook turns bearish, potentially triggering a sharp decline toward 1.3090.
Alternatively, if Monday’s bullish engulfing pattern is confirmed with a move above 1.3420, the price could advance toward the 20-day SMA and the 1.3520 region. Should the 1.3600 barrier give way too, the pair may post a fresh higher high in the short-term picture near 1.3700, reviving its spring recovery trend.
Overall, GBP/USD remains vulnerable as long as it trades below its 50- and 200-day SMAs near 1.3420. However, for a broader deterioration in outlook, the bears would need to decisively cross below the 1.3200-1.3225 support base.
EUR/GBP: Weak UK Jobs Data Pushes BoE Toward Patience, but CPI Holds Key to Breakout
Sterling softened after the latest UK labor market data reinforced expectations that the Bank of England is likely to adopt a more patient near-term stance on interest rates. The sharp decline in payroll employment, rising unemployment rate, and cooling wage growth excluding bonuses all pointed to a labor market that is gradually losing momentum, reducing pressure for immediate additional tightening from the BoE.
Still, the BoE cannot easily pivot dovish given the renewed surge in global energy and import costs. Higher oil prices linked to the Gulf conflict continue threatening imported inflation, and a weaker Pound would only amplify those pressures further. That leaves policymakers in a difficult position: the domestic economy argues for caution, but external inflation risks argue against cutting rates prematurely.
The IMF effectively endorsed that balancing act this week, recommending restrictive policy to prevent energy costs from feeding into broader inflation while also urging the BoE to remain ready to adjust policy “in either direction” if conditions change.
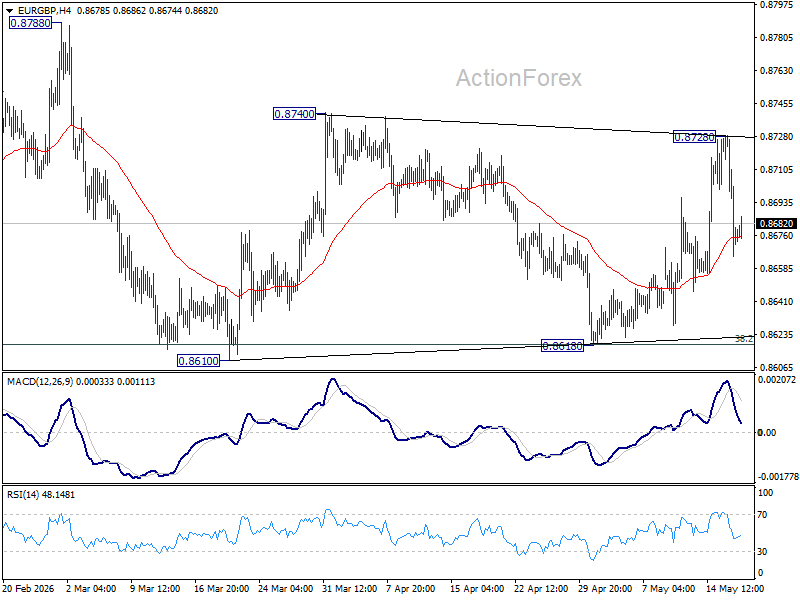
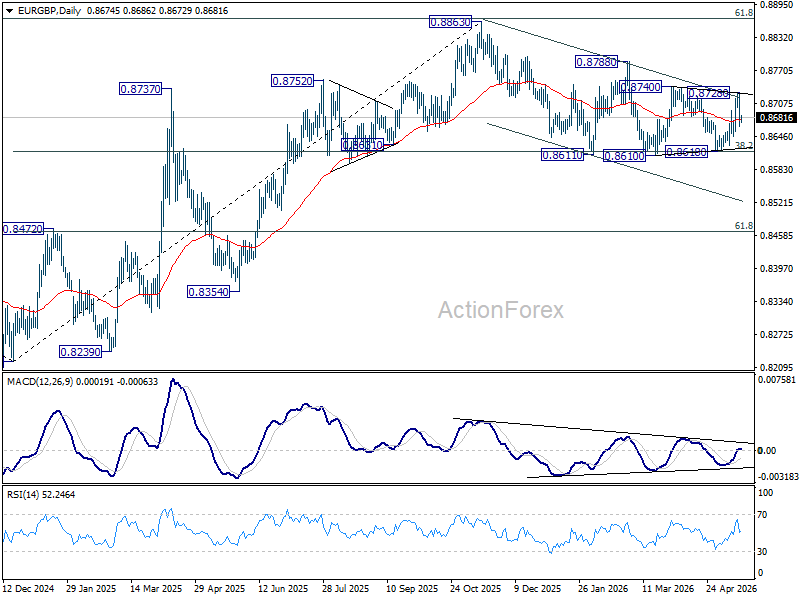
Technically, EUR/GBP remains trapped in an indecisive sideways range. The cross failed to break through 0.8740 resistance and remains capped by the near-term falling channel ceiling, keeping downside risks modestly favored. However, there is also insufficient selling momentum to break below 38.2% retracement of 0.8821 to 0.8563 at 0.8661, leaving the broader direction unresolved for now.
That leaves tomorrow’s UK CPI report as the likely catalyst for the next decisive move. A softer inflation reading could reinforce expectations for prolonged BoE patience and potentially lift EUR/GBP higher through resistance. But if inflation remains sticky — particularly due to energy costs — Sterling may quickly regain support as markets reassess the chance of a BoE hike in the near term.
WTI: Falling Production and Deadlock in Negotiations
Fundamental Background
As a result of the military conflict between the United States and Iran, the combined volume of halted oil production in Iraq, Saudi Arabia, Kuwait, the UAE, Qatar and Bahrain reached 10.5 million barrels per day in April, triggering record declines in global oil inventories. The U.S. Energy Information Administration forecasts a drop in global inventories of 8.5 million barrels per day in the second quarter of 2026 before supplies through the strait begin to recover.
An additional structural factor came from the UAE’s withdrawal from OPEC, which took effect on 1 May 2026 and reduced the cartel’s available spare production capacity. On the diplomatic front, negotiations continue without clear progress: according to available reports, Iran is prepared to accept a long-term nuclear freeze, but not the full dismantling of its nuclear programme, while both sides continue discussing conditions through intermediaries.
Technical Picture
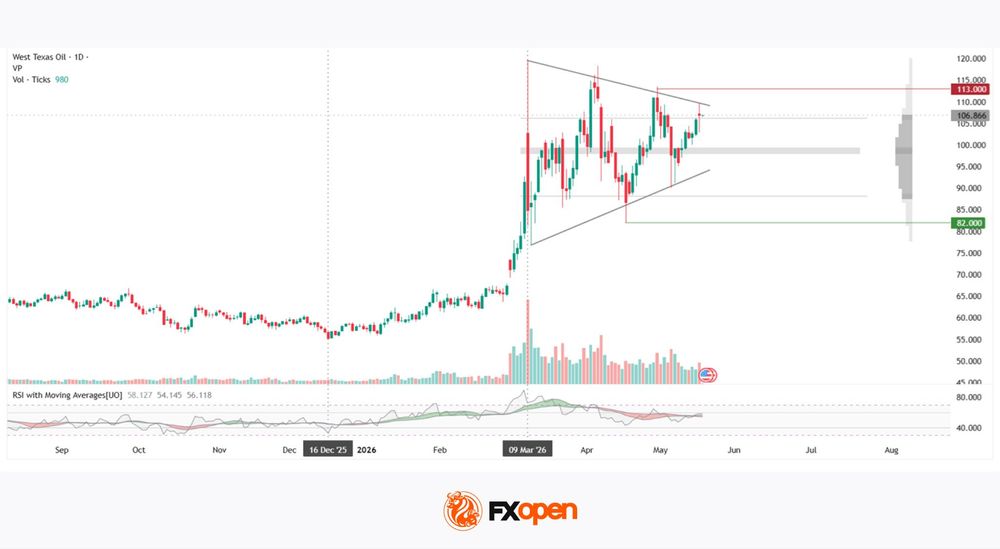
Since the sharp acceleration recorded on 9 March 2026 amid a peak surge in vertical volume, WTI crude has formed a symmetrical contracting triangle on the daily timeframe. The upper boundary of the pattern extends from the March high near 120 and continues to be actively tested by price action. The triangle boundaries are gradually converging, creating conditions for a future impulsive breakout from the formation.
At present, the price is testing the upper boundary of the triangle above the upper edge of the profile. The market volume profile covers the 88–106 range.
The point of control (POC) is located within the 98–99.5 range and remains the main obstacle for sellers. Current vertical trading volume remains moderate and continues to decline relative to the March peaks. The nearest resistance level stands at 113, while the key support level is located at 82.
The RSI + MAs indicator shows readings of 58, 54 and 56 — all readings remain above the neutral 50 level, although without a strong directional impulse. All three lines are clustered together, with neither buyers nor sellers holding a clear advantage.
Key Takeaways
The current price structure is shaped by a balance between the risk premium linked to potential supply disruptions through the strait and uncertainty surrounding the timing of supply restoration. The flat RSI dynamics and the fact that price remains trapped within the triangle continue to support a wait-and-see market stance.
Start trading commodity CFDs with tight spreads (additional fees may apply). Open your trading account now or learn more about trading commodity CFDs with FXOpen.
This article represents the opinion of the Companies operating under the FXOpen brand only. It is not to be construed as an offer, solicitation, or recommendation with respect to products and services provided by the Companies operating under the FXOpen brand, nor is it to be considered financial advice.
Sunset Market Commentary
Markets
Selling pressure on global bond markets eased a bit yesterday. Even so, the relieve, if any, was small compared to the sharp rise especially of long-term yields at the end of last week. Headlines throughout the day on the developments in the Middle-East conflict were mixed at best and didn’t bring clear guidance on a roadmap to a solution around Hormuz. Oil also showed some nervous intraday swings. At the end of the day, Brent closed off the intraday highs (near $110/b), after US President Trump said he was asked by regional allies to put off a new strike on Iran as they saw chances reaching a deal soon. (US) yields to some extent still moved in lockstep with the intraday pattern of oil. In a limited steepening move, the 2-y yield fell a modest 2.5 bps. However, even in a daily perspective there was no relieve at the long end of the curve (30-y +0.7 bps, close at 5.12% only a whisker away from the 2023 top of 5.176%). A similar (or even worse) pattern was visible for German and Japanese LT yields. German yields eased between 2.8 bps (2-y) and 0.5 bps (30-y), but the 30-y yield at 3.7% intraday still touched the highest level since mid-2011. The 30-y Japanese yield at 4.15% even trades at the highest level since the launch of the tenor. The correction in UK bond yields was a bit more outspoken after Friday’s sell-off with yields retracing between 7 and 8.5 bps across the curve. A spokesman of potential UK PM contender Andy Burnham said that he didn’t intend to change the government’s self-imposed borrowing limits/framework as currently applied by UK Chancelor Reeves. However, it’s far from sure whether this will be enough to keep calm at UK bond markets when the leadership contest continues over the next weeks. It helped to take some pressure off sterling with EUR/GBP easing from the 0.873 area to close at 0.867. Equities at least were not hugely inspired by the “pause” in the bond market. US indices changed between +0.32% (Dow) and -0.51% (Nasdaq). The Eurostoxx 50 regained a modest 0.36%. Question remains whether/to what extent high risk premia/real yields at the long end of the curve might become a factor for other markets of risk assets (US 10-y real yield at 2.10% is nearing the end March top). In FX markets, DXY tested the end of April top near 99.34, but closed at 99.2. EUR/USD rebounded from 1.162 to 1.1655.
Yesterday’s trends basically continue this morning. Japanese (LT) yields remain upwardly oriented (30-y +6.3 bps). The US 30-y yield also holds near 5.15%. This apparently weighs on equities (Nikkei -0.56%, US equity futures losing 0.3%-0.6%). Eco data today probably are again second tier with only US weekly ADP data scheduled for release. We also keep an eye at remarks from ECB Chief Economist Philip Lane in a panel discussion in Frankfurt. At the time of finishing this report, UK labour market data came in mixed to tentatively softer than expected. The unemployment rate of the 3-month period to March rose from 4.9% to 5%. Monthly payrolled employees in April declined a substantial 100k (from -28k in March). Sterling holds little changed near EUR/GBP 0.868 in a first reaction.
News & Views
Fitch Ratings said the default rate for US private credit loans edged higher from 5.7% in March to 6% last month – the highest since the agency began tracking in August 2024. 10 defaults were recorded in April, the bulk of which by issuers in the industrial and manufacturing sector (accounting for four events). Of those 10 events, six were new unique defaulters while four were serial defaulters. Seven of the 10 defaults involved maturity extensions while the remaining three were offered to pay interest in additional debt in lieu of cash interest. In the twelve month rolling period, Fitch recorded 99 default events of which 81 for the first time, also the highest ever.
Japanese Q1 growth marginally topped expectations. The 0.5% quarterly pace (2.1% annualized, quickest since September 2024) compares with the 0.4% expected but follows a downwardly revised 0.2% in Q4 of last year. Private consumption grew 0.3% and carried 0.2% of total growth (ie. the contribution). Fixed capital formation accounted for 0.1% of quarterly growth. Exports rose 1.7% and imports only by 0.5%, resulting in a positive net export contribution of 0.3%. Japanese assets were little moved by what is considered an outdated report which does not capture the full impact of the Iran war. But it could persuade doubting Japanese monetary policymakers to hike rates to counter the inflationary impact in an economy that went into the conflict in solid shape. USD/JPY is trading a tad stronger in the 159 area. Japanese yields continue their ascent towards multidecade/record highs across the curve. The long end underperforms with rates rising about 6 bp
UK Unemployment Rate Rises to 5.0% as Payroll Employment Continues to Decline
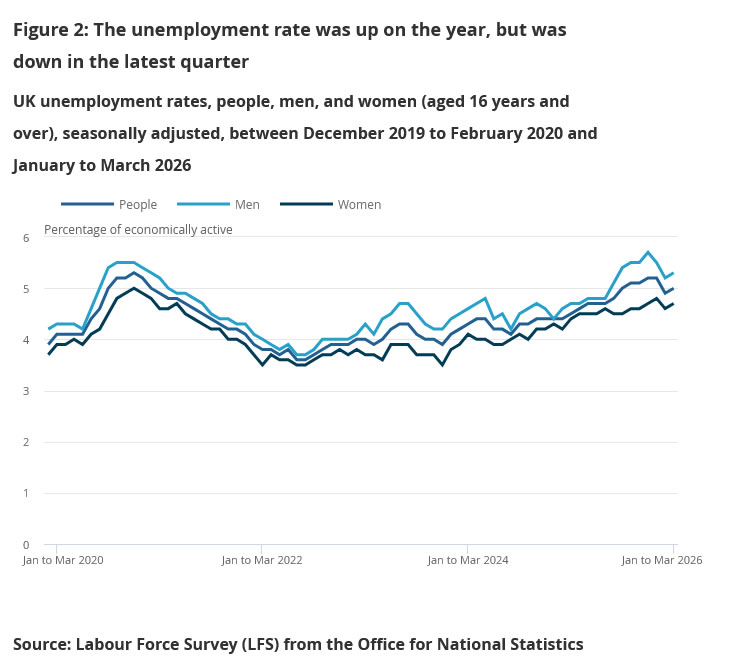
UK labor market data showed further signs of softening, with payroll employment falling again in April while the unemployment rate edged higher in the three months to March. Payrolled employment declined by -100k or -0.3% mom in April, extending the annual drop to -210k or -0.7% yoy. Meanwhile, the unemployment rate rose from 4.9% to 5.0% in the three months to March, slightly above expectations of 4.9%.
Wage growth data presented a more mixed picture. Median monthly pay growth remained elevated at 4.9% yoy in April, unchanged from the previous month. In the three months to March, average earnings excluding bonuses slowed from 3.6% yoy to 3.4% yoy, matching expectations and suggesting some easing in underlying wage pressures. However, average earnings including bonuses accelerated from 3.9% yoy to 4.1% yoy, beating forecasts of 3.8% yoy.
The figures reinforce the difficult balancing act facing the Bank of England. While softer payrolls and rising unemployment point to gradual cooling in labor market conditions, wage growth remains firm enough to keep policymakers cautious about inflation risks, especially with higher energy costs continuing to pressure the broader economy.
| Indicator | Period | Latest |
|---|---|---|
| Payrolled Employment (mom) | April | -100k (-0.3%) |
| Payrolled Employment (yoy) | April | -210k (-0.7%) |
| Median Monthly Pay (yoy) | April | 4.9% |
| Unemployment Rate | 3 mth to March | 5.0% |
| Average Earnings ex Bonus (yoy) | 3 mth to March | 3.4% |
| Average Earnings inc Bonus (yoy) | 3 mth to March | 4.1% |
Oil and Yields Ease on Reports of Renewed US-Iran Negotiation Efforts
In focus today
Focus will continue to be on developments in the Middle East and the bond market rout that has caused a sell-off in risk assets.
In the UK a fresh labour market report will be published. Employment is expected to have fallen again in March, although the earlier, concerning rise in unemployment has since been revised lower.
Economic and market news
What happened overnight
In Japan, Q1 real GDP grew at an annualised 2.1%, equivalent to 0.5% q/q, outpacing the consensus forecast of 1.7% and the revised 1.3% recorded in the previous quarter. Growth was broadly based, with both private consumption and capital expenditure rising 0.3%, while net external demand contributed 0.3pp, underlining the role of solid exports. The figures suggest the economy was on a relatively firm footing before the Iran war and its associated energy shock, giving it some buffer, but momentum is expected to slow in the second quarter as the full impact on businesses and households becomes clearer.
What happened yesterday
In the US-Iran war, Tehran has submitted a new response to the latest US proposal via Pakistan, though mediators warn the ceasefire is "on life support". Brent Crude slipped around 2% to USD109.8/bbl in early Asian trading after President Trump said he had paused a planned large‑scale strike on Iran to allow time for negotiations aimed at ending the war in the Middle East. Yet Trump insists the US remains ready to act if talks fail. At the same time, Washington extended a sanctions waiver on Russian seaborne crude, helping stabilise physical supply, while record US reserve draws have pushed inventories to two‑year lows, leaving the market highly sensitive to any renewed escalation.
In the bond market, investors are increasingly pricing in a lasting inflation shock from the Iran war, triggering a global bond market rout, with G7 10-year yields surging towards 4% and 30-year rates to about 4.6%, and US Treasuries and JGBs at multi-year highs. Yesterday, however, the sell-off abated as lower oil prices helped temper inflation concerns, prompting a retracement in yields and improved risk sentiment, even though markets still see a durable agreement as distant.
In the euro area, European Commissioner Valdis Dombrovskis flags a "stagflationary shock" from the war in Iran in an interview with CNBC, noting that the forthcoming spring report will lower growth forecasts and raise inflation expectations. Persistent disruption in the Strait of Hormuz and oil above USD100/bbl are key drivers. His comments reinforce expectations of softer activity, stickier inflation and limited policy space to cushion the shock.
Equities: Equity markets moved lower yesterday, driven by US tech underperformance and a clear defensive rotation. What is important, however, is that this was not a classic broad-based risk-off session. Most sectors were actually higher on the day, and VIX also declined. In other words, the move was more about sector rotation out of high-flying semiconductors than a general deterioration in risk appetite.
We are seeing some of that same dynamic continue in Asia this morning. Taiwan and South Korea are notably weaker after what has been truly exceptional year to date gains, with the semiconductor complex underperforming after the pressure seen in the US yesterday.
It is also worth highlighting the turnaround we saw in Europe yesterday. Markets started the day in the red but managed to close higher, which is a constructive signal in a session otherwise dominated by pressure on the most crowded parts of the equity market. Energy was the best performing sector in both the US and Europe, as oil crept higher. Hence, this also signals Iran remains one of the biggest daily drivers for markets at the moment.
This morning, Asian markets are mixed. European futures are higher, while US futures are lower, again with tech somewhat under pressure.
FI and FX: The sell-off in global FI markets has stabilized in the last 24 hours with importantly the short-end of the USD curve even coming lower driving a slight steepening of the curve. Despite Trump's announcement that he will be holding back strikes on Iran today, Iran's updated peace proposal and the news of another US waiver on the selling of Russian oil that has already been loaded on tankers the impact on energy and hence broader markets has still been rather limited. EUR/USD retreated some of its decline from last Friday but continues to trade around 1.1650. In the Scandies both SEK and NOK have stabilized and are marginally stronger vs the EUR since Monday's opening.
Building Carry Risk
The week started on a mixed note. In Europe, the retreat in European bond yields gave a certain relief to equity indices, allowing the Stoxx 600 to keep floor above the 50-DMA, while major US indices failed to maintain earlier optimism – fueled by news that Washington reportedly proposed a temporary waiver on sanctions. The US denied the report shortly after.
This morning, we’re back to square one. Yields are rising and equities are under pressure. The Japanese 10-year yield – which has become the first thing I look at in the morning – is pushing toward the 2.80% mark again. Rising oil prices fuel inflation and Bank of Japan (BoJ) rate hike expectations, justifying the rise in yields, while economic data released this morning backs a further selloff: the Japanese economy grew more than 2% annualized in Q1, consumption rose more than expected, while price pressures did not ease as pencilled in by analysts. The latter boosted hawkish BoJ expectations – the expectation that the BoJ would raise rates to tame inflationary pressures – a scenario that echoes through US yields as well.
Japanese yields matter to the entire world
Why? Because Japan is one of the largest foreign holders of US Treasuries. For years, Japanese investors such as pension funds and insurance companies bought US government bonds because yields in Japan were extremely low — often close to zero — making US bonds far more attractive in comparison.
But that changes when Japanese government bond yields rise. If the 10-year Japanese Government Bond (JGB) yield climbs toward the 1.75–1.77% range, domestic bonds start becoming attractive again for major Japanese institutions: they can earn a decent return at home without taking the currency risk, hedging costs, or overseas exposure that comes with holding US Treasuries.
That matters because if large Japanese investors start shifting even part of their money back into domestic bonds, demand for US Treasuries could weaken, potentially putting upward pressure on US yields. And we see this morning that the US 10-year yield is pushing past 4.60% — the highest in a year.
In other news, China – another major UST holder – also joined the global selloff in US Treasuries in March amid rising geopolitical tensions.
Beyond the Iran war, China has been reducing the risk of holding US Treasuries for years, replacing part of its UST reserves with gold. The latter – echoed by other central banks – is expected to maintain gold’s positive longer-term trend.
Gold caught between yields and liquidity
In the short run, however, gold remains under pressure from rising yields – higher sovereign yields increase the opportunity cost of holding non-interest-bearing gold, making the yellow metal relatively less attractive compared to fixed-income assets. I believe every tick lower is an opportunity to strengthen a long-term bullish position.
The next reverse carry trade may be more than a temporary scare
Coming back to rising Japanese yields, the latter is becoming a growing risk for global markets. As the Japanese repatriate their money back home, US Treasury yields push higher, and higher US yields echo across global yields, while higher yields weigh on equity valuations. That’s called the reverse carry trade. The last time the latter happened, in August 2024 following a BoJ rate hike, the Nikkei lost nearly 20% in a few days, while the Nasdaq – exposed to cheap yen funding – dived around 14%.
Today, and with stretched valuations, a scenario like this becomes increasingly possible, especially if the BoJ moves ahead with another rate hike. The BoJ will meet on June 16–17 and is increasingly expected to raise rates from 0.75% to 1.00% at that meeting.
And how do you recognize a reverse carry trade? The biggest tell is a violent drop in USDJPY, combined with a simultaneous drop in equities and collapsing yields, confirming a risk-off deleveraging event.
This far, because Japanese yields remained notably low — and below the important 1.75–1.77% threshold for the 10-year JGB — reverse carry-trade episodes mostly resulted in temporary bouts of deleveraging and short-lived panic across global markets. Investors eventually returned to borrowing cheap yen and chasing higher returns abroad because the yield advantage still overwhelmingly favoured foreign assets.
But as we’re moving sustainably above that threshold, and as Japan is making its way out of a two-decade-long deflationary environment – which was the reason why Japanese yields were so low in the first place – we could see something far more structural happen. The next reverse carry episode could trigger a gradual – and sustainable – reallocation of Japanese capital back home, as domestic bonds start offering sufficiently attractive returns without the currency risk and hedging costs tied to overseas investments.
And that would mean structurally less liquidity for global markets, because Japan is one of the world’s largest pools of savings. A sustained repatriation flow could reduce demand for US Treasuries and global risk assets, put upward pressure on global borrowing costs, strengthen the yen structurally, and tighten global liquidity conditions after years of abundant Japanese-funded capital supporting everything from US tech stocks to emerging markets.
Keep calm and carry on
Now, that’s the theory.
In practice, if you ask me how worried I am, I am not extremely worried about lower Japanese liquidity. I am sure the Federal Reserve (Fed) and other central banks could fill the gap with QE, repo facilities, or any other liquidity programs designed to inject money into the system.
And that’s exactly why the durable and notable rise in the 10-year JGB yield above the 1.75–1.77% threshold did not lead to the massive selloff that many expected – and warned very loudly about.
On the contrary, global liquidity kept rising on a steep upward trajectory, and a large part of that liquidity eventually found its way into global equity indices and other risk assets. Duh!
That’s why it only makes sense to stay buy the next dip, and stay invested in equities when stock-price inflation appears inevitable due to sustained liquidity injections.
One last thing about money injection. The new Fed Chair Kevin Warsh is willing to reduce the size of the Fed’s balance sheet, and balance the negative impact by lowering rates. I don’t believe for one second that he could credibly do that.