

Sample Category Title
EUR/GBP Daily Outlook
Daily Pivots: (S1) 0.8703; (P) 0.8716; (R1) 0.8734; More…
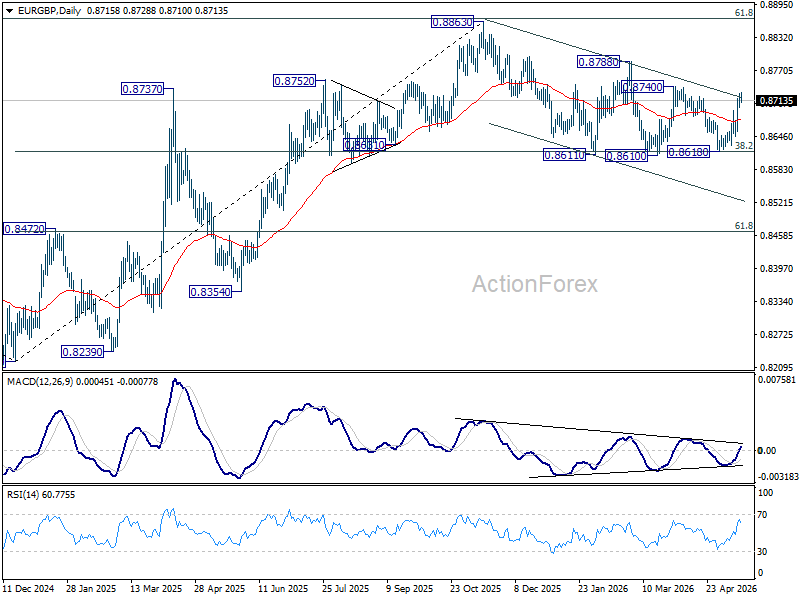
Intraday bias in EUR/GBP remains on the upside for 0.8740 resistance. Decisive break there should pave the way through 0.8788 to retest 0.8863 high. On the downside, below 0.8700 minor support will turn bias neutral again.
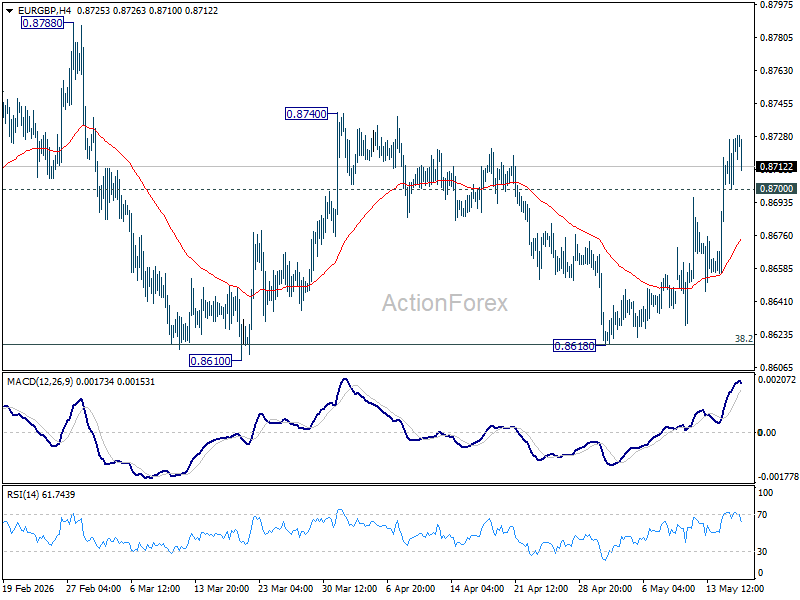
In the bigger picture, focus is back on 38.2% retracement of 0.8821 to 0.8863 at 0.8618. Strong rebound from there will retain medium term bullishness. Rise from 0.8221 should resume through 0.8863 at a later stage. Nevertheless, sustained break of 0.8618 will confirm that whole rise from 0.8221 has completed at 0.8863. Deeper decline should then be seen to 61.8% retracement at 0.8466 at least.
EUR/AUD Daily Outlook
Daily Pivots: (S1) 1.6174; (P) 1.6226; (R1) 1.6311; More...
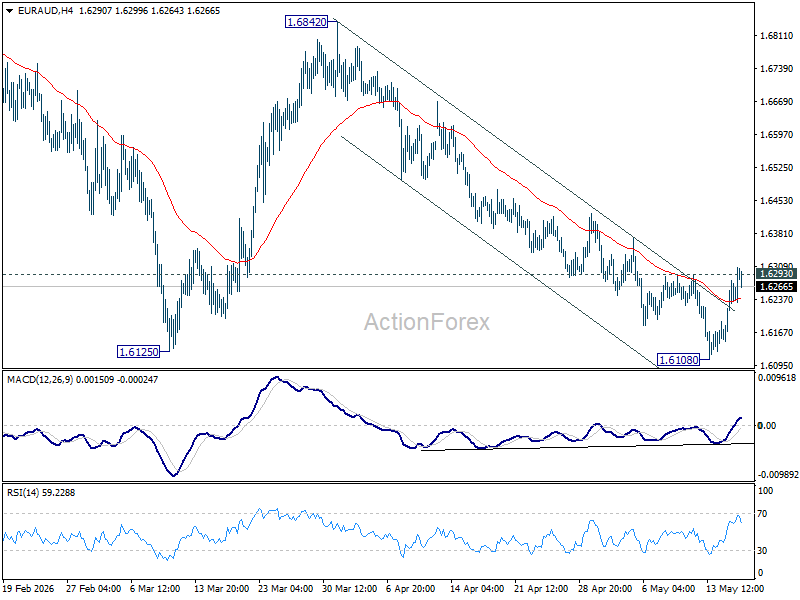
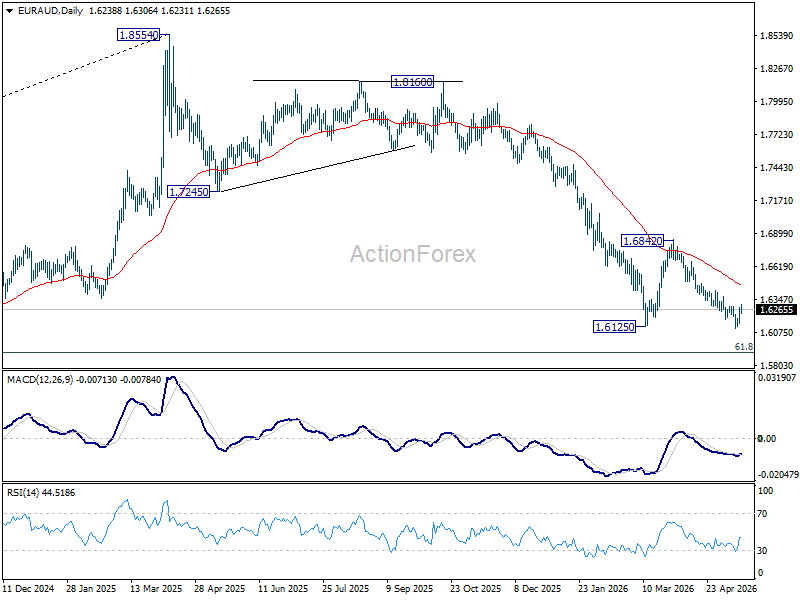
Intraday bias in EUR/AUD stays neutral first. On the upside, firm break of 1.6293 resistance will suggest that a short term bottom was already formed at 1.6108. Bias will be turned tot he upside for 55 D EMA (now at 1.6464) and possibly above. On the downside, below 1.6108 will extend larger fall from 1.8554 to 1.5913 fibonacci level.
In the bigger picture, fall from 1.8554 (2025 high) is in progress and deeper decline should be seen to 61.8% retracement of 1.4281 to 1.8554 at 1.5913, which is slightly below 1.5963 structural support. Decisive break there will pave the way back to 1.4281 (2022 low). For now, risk will stay on the downside as long as 55 W EMA (now at 1.7012) holds, even in case of strong rebound.
EUR/CHF Daily Outlook
Daily Pivots: (S1) 0.9135; (P) 0.9143; (R1) 0.9154; More....
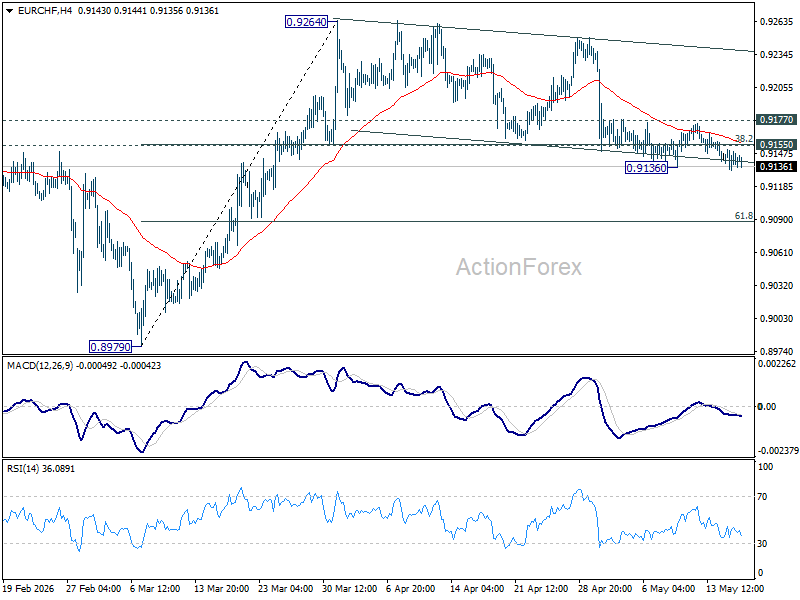
Intraday bias in EUR/CHF is mildly on the downside with breach of 0.9136 temporary low. Sustained trading blow 0.9155 cluster support (38.2% retracement of 0.8979 to 0.9264 at 0.9155) will argue that rise from 0.8979 has completed. Deeper fall should be seen to 61.8% retracement at 0.9088 and possibly below. On the upside, break of 0.9177 resistance will bring stronger rally back to retest 0.9264.
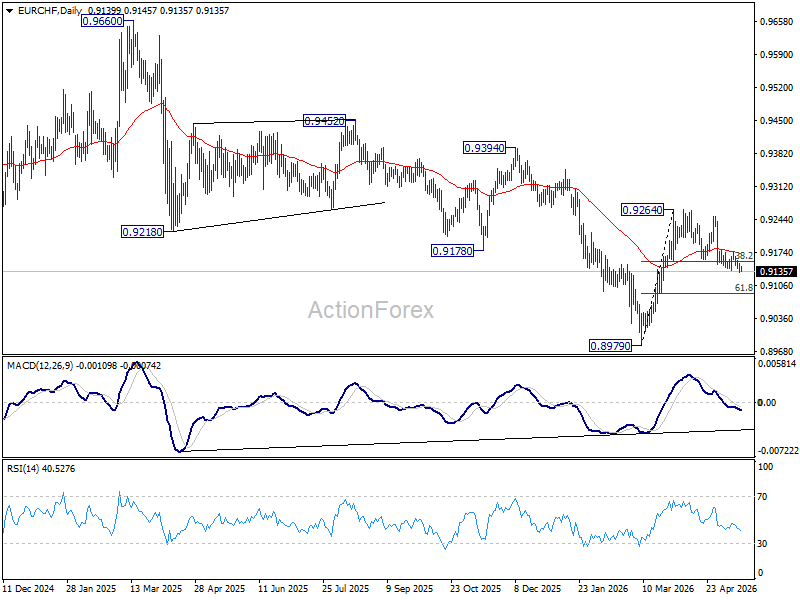
In the bigger picture, considering bullish convergence condition in W MACD, a medium term bottom should be in place at 0.8979. Sustained trading above 55 W EMA (now at 0.9241) will add more credence to this case. Further break of 0.9394 resistance will pave the way to 0.9660 resistance next. However rejection by the 55 W EMA will set up another fall through 0.8979 low at a later stage.
USD/CAD Daily Outlook
Daily Pivots: (S1) 1.3718; (P) 1.3742; (R1) 1.3771; More...
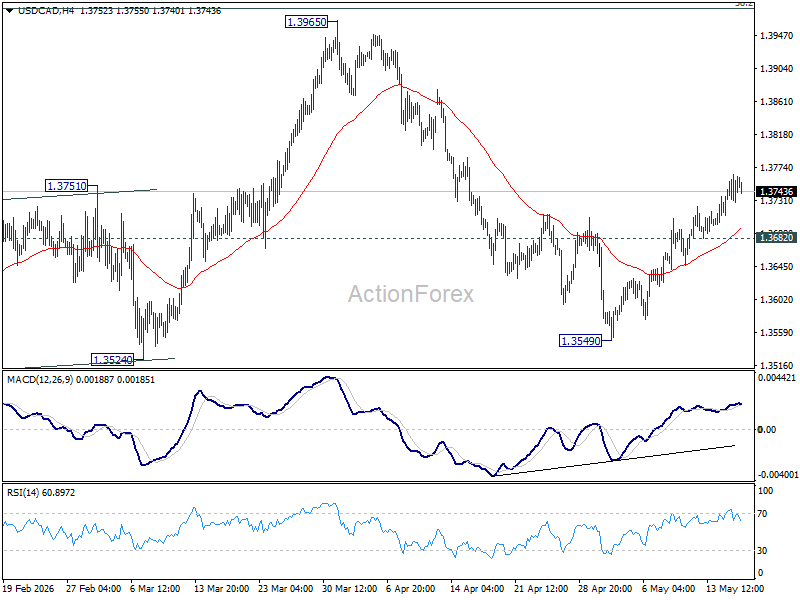
USD/CAD's rebound from 1.3549 is still in progress and intraday bias remains on the upside. This rise is seen as the third leg of the corrective pattern from 1.3480. Further rise would be seen towards 1.3965 resistance. On the downside, below 1.3682 minor support will turn intraday bias neutral first.
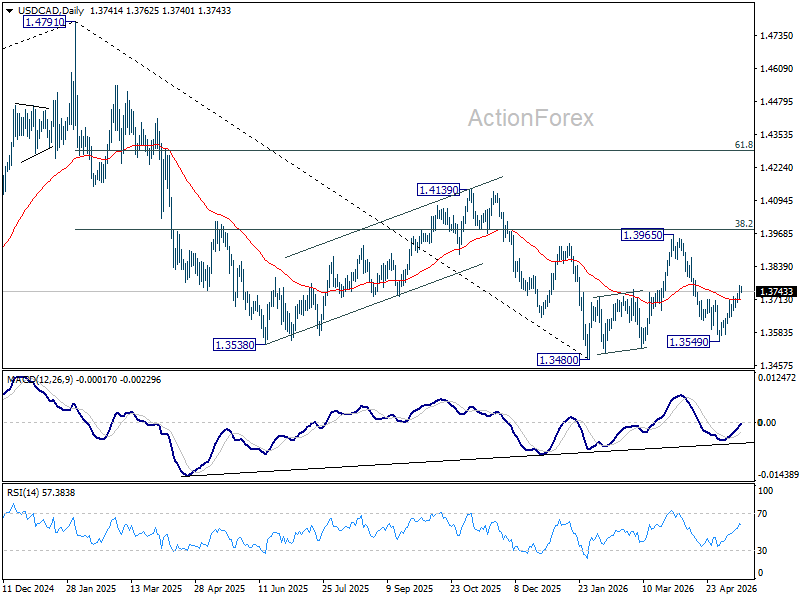
In the bigger picture, price actions from 1.4791 are seen as a corrective pattern to the whole up trend from 1.2005 (2021 low). Deeper fall could be seen, as the pattern extends, to 61.8% retracement of 1.2005 to 1.4791 at 1.3069. However, decisive break of 38.2% retracement of 1.4791 to 1.3480 at 1.3981 will argue that the correction has completed with three waves down to 1.3480 already.
AUD/USD Daily Report
Daily Pivots: (S1) 0.7115; (P) 0.7168; (R1) 0.7198; More...
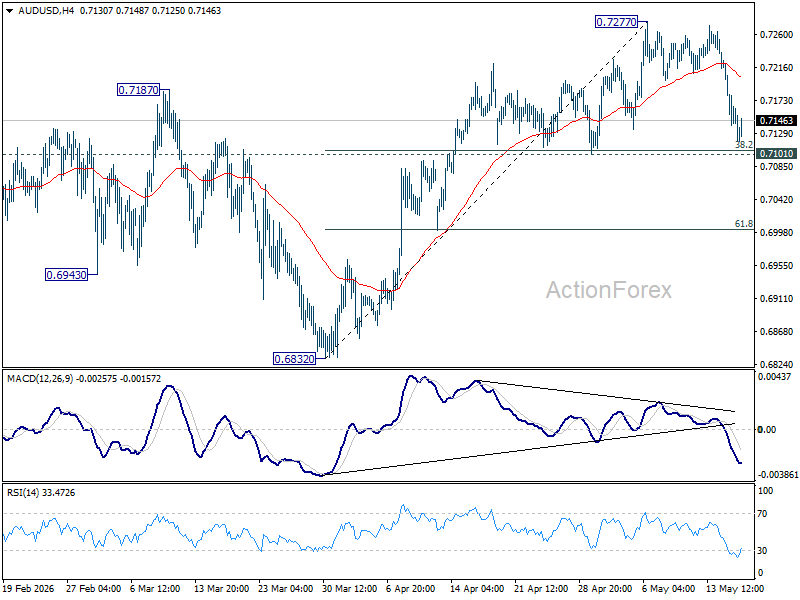
Range trading continues in AUD/USD and intraday bias stays neutral at this point. With 0.7101 support intact, further rise remains in favor. On the upside, firm break of 0.7277 will resume larger up trend. However, decisive break of 0.7101 will bring deeper decline back towards 0.6832 support.
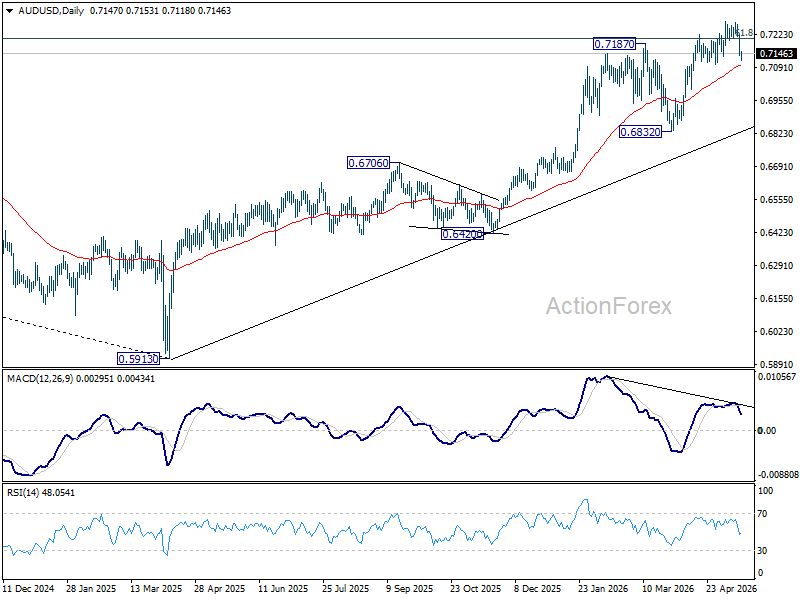
In the bigger picture, rise from 0.5913 (2024 low) is still in progress. Decisive break of 61.8% retracement of 0.8006 to 0.5913 at 0.7206 will solidify the case that it's already reversing the down trend from 0.8006 (2021 high). Further rally should then be seen to retest 0.8006. For now, outlook will remain bullish as long as 0.6832 support holds, in case of pullback.
USD/JPY Daily Outlook
Daily Pivots: (S1) 158.35; (P) 158.59; (R1) 158.99; More...
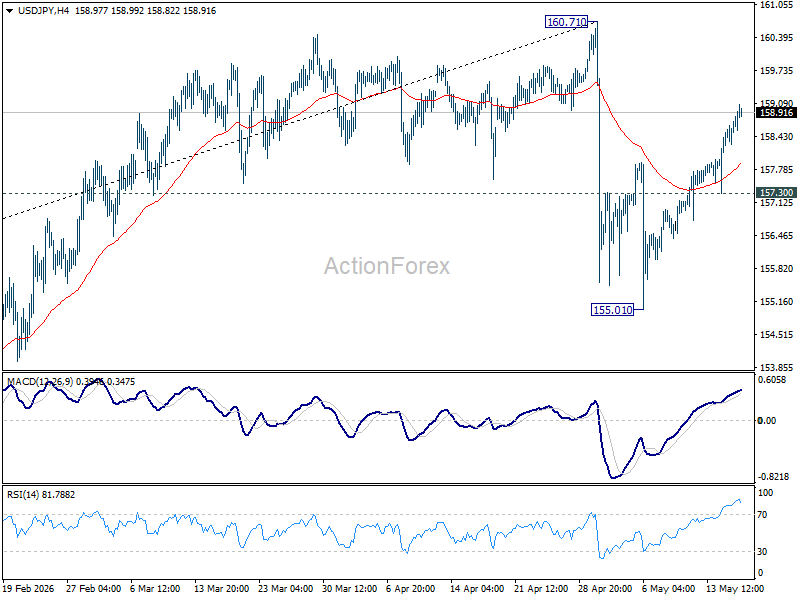
USD/JPY's rise from 155.01 is in progress and intraday bias remains on the upside. As this rebound is seen as the second leg of the corrective pattern from 160.71, strong resistance should emerge from there to limit upside. On the downside, break of 157.30 minor support will argue that the third leg could have started, and target 155.01 support instead.
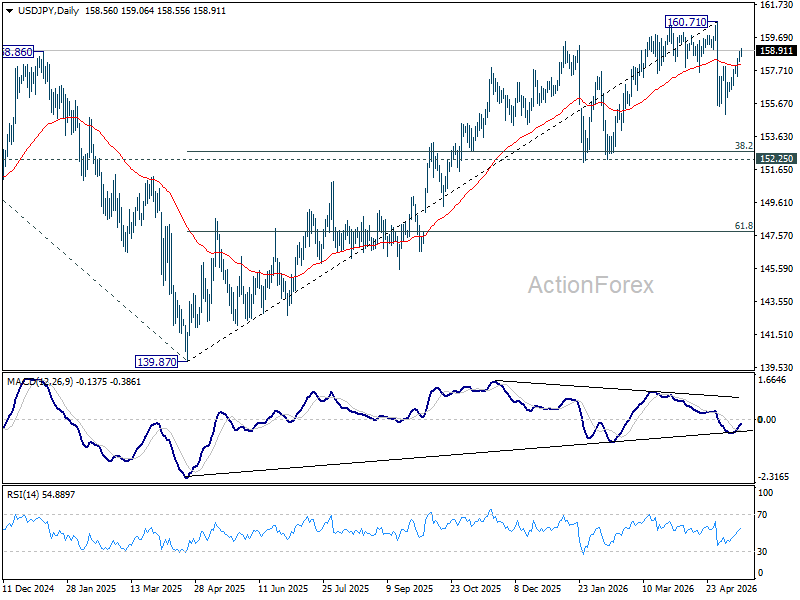
In the bigger picture, for now, corrective pattern from 161.94 (2024 high) is still seen as completed at 139.87. Rise from there is seen as resuming the long term up trend. So, break of 161.94 is expected at a later stage to resume the long term up trend. However, sustained break of 55 W EMA (now at 154.36) will dampen this view and bring deeper fall back towards 139.87 to extend the pattern from 161.94.
USD/CHF Daily Outlook
Daily Pivots: (S1) 0.7839; (P) 0.7856; (R1) 0.7884; More….
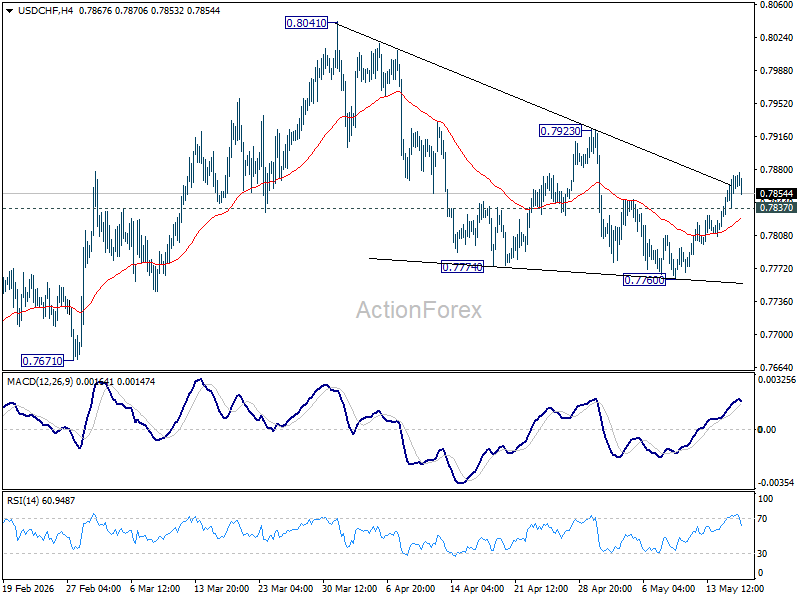
Intraday bias in USD/CHF remains on the upside at this point. Rebound from 0.7760 would continue to 0.7923 resistance. Firm break there will argue that fall from 0.8041 has completed as a three wave correction, and bring further rise to retest this high. On the downside, below 0.7837 minor support will turn intraday bias neutral first.
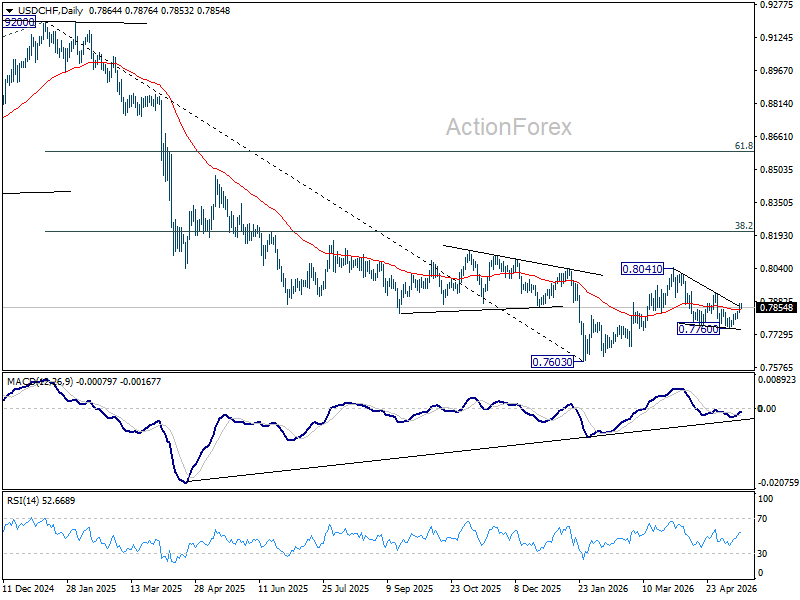
In the bigger picture, as long as 55 W EMA (now at 0.8035) holds, fall from 0.9200 is expected to continue, as part of the larger down trend. Firm break of 0.7603 will target 100% projection of 1.0146 (2022 high) to 0.8332 from 0.9200 at 0.7382.
GBP/USD Daily Outlook
Daily Pivots: (S1) 1.3290; (P) 1.3347; (R1) 1.3379; More...
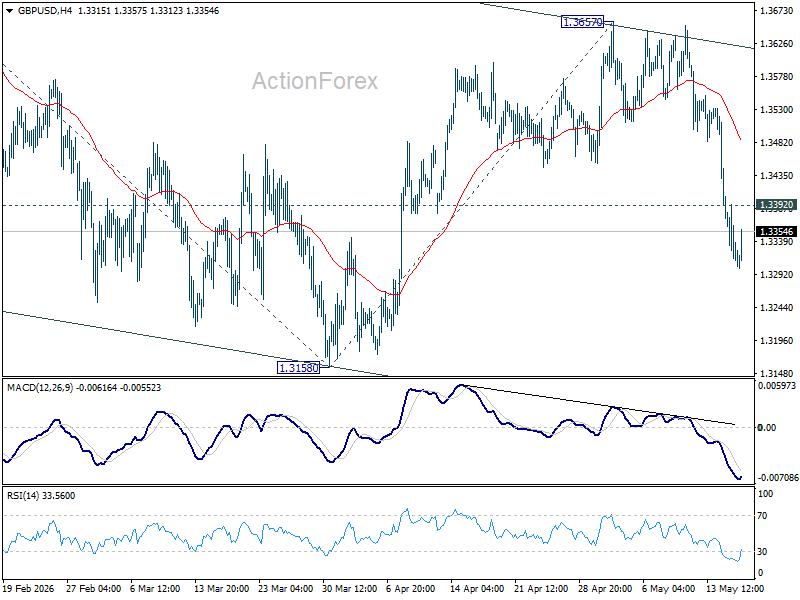
Intraday bias in GBP/USD stays on the downside at this point. Fall from 1.3657 would extend to retest 1.3158 support. Decisive break there will target 100% projection of 1.3867 to 1.3158 from 1.3657 at 1.2948. On the upside, above 1.3392 minor resistance will turn intraday bias neutral again first.
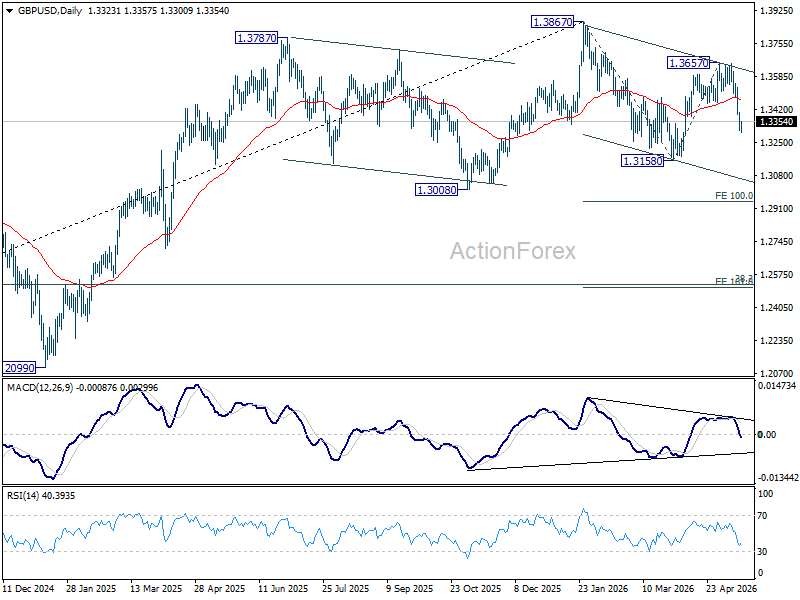
In the bigger picture, current development suggests that price actions from 1.3867 are merely a corrective pattern within the broader up trend from 1.0351 (2022 low). With 1.3008 support intact, medium term bullishness is maintained and break of 1.3867 is in favor for a later stage, towards 1.4248 key resistance (2021 high). However, firm break of 1.3008 will at least bring deeper fall to 38.2% retracement of 1.0351 to 1.3867 at 1.2524, with increased risk of bearish reversal.
EUR/USD Finds Footing at One‑Month Lows Near 1.160
- EUR/USD halts losses near April highs.
- Key test: break above SMA cluster overhead.
- Momentum signals show easing selling pressure.
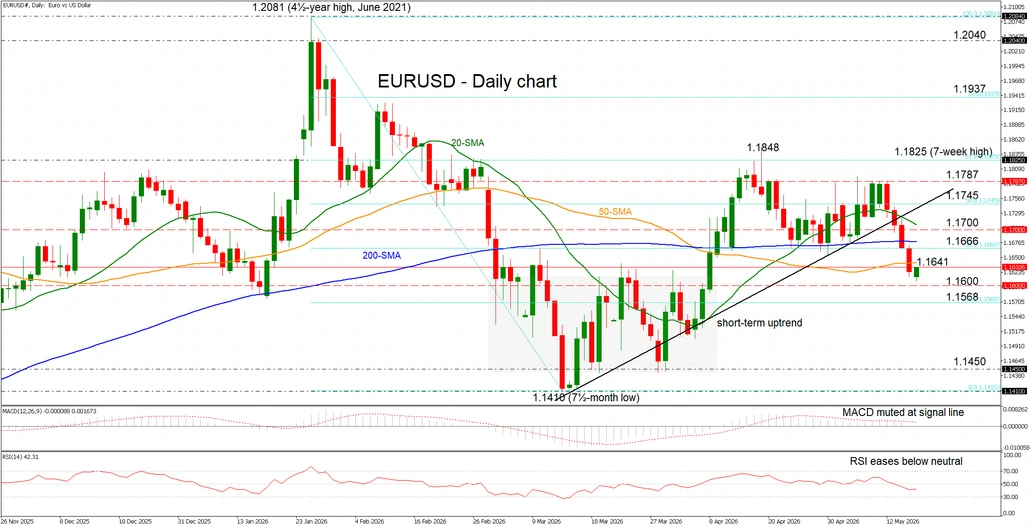
EUR/USD is attempting to stabilise after a four‑session pullback from the 1.1787 area to one‑month lows just above 1.1600, with the euro remaining under pressure against a firmer dollar amid renewed Middle East tensions and risk‑averse conditions.
Momentum indicators point to a pause in selling pressure, with the RSI flattening below neutral and the MACD stabilising around its zero and signal lines.
That said, the pair remains vulnerable after slipping below key levels, including the simple moving average (SMA) cluster and short‑term uptrend.
Resistance starts near the 50‑day SMA at 1.1641 and extends into the 1.1666-1.1745 zone, marked by the 38.2% and 50% Fibonacci retracements of the January-March decline and reinforced by the 20‑ and 200‑day SMAs. A break above this region could reopen the path toward 1.1787.
Support lies at the 1.1600 psychological level, followed by the 23.6% Fibonacci near 1.1568, before deeper losses toward multi‑month lows near 1.1410-1.1450.
Overall, EUR/USD is consolidating losses after breaking below its short‑term uptrend, though a recovery toward the SMA cluster and the 1.1700 area could ease downside pressure if support holds.
A Correction Is Inevitable
The big story – and dominant market driver – is becoming the rapid selloff across sovereign bond markets, as bond yields in major economies, including the US and Japan, soared last week after a set of inflation numbers showed that price pressures accelerated faster than analysts expected due to Middle East-led energy price pressures.
Yes, it was predictable. The funny thing is that there is always a pivotal moment that delivers the “uh huh” moment to investors. Last week, that moment came with inflation numbers from major economies, while oil prices kept rising due to the lack of progress in Iran peace talks.
And this Monday, bond stress remains in the headlines, as US crude traded above $108pb earlier in the session, with upside risks remaining dominant as the prolonged Middle East conflict leads to a record decline in global oil reserves.
The Japanese 10-year yield hit 2.80% before bouncing lower, while the Nikkei sold off another 1% following Friday’s sharp 2% retreat, also dragging major US and European indices lower. Tech stocks took a hit simply because they have been carrying the latest rally on their shoulders.
In China, the latest economic data looked particularly bleak, with an unexpected fall in investment, an unexpected slowdown in industrial production, and a worrying decline in retail sales growth to near-zero in April, mostly due to a 15% plunge in car sales. The weakness was largely explained by heavy disruptions linked to the Iran war.
This morning, futures are in the red and the bearish mood is justified: rising inflation fuels hawkish central bank expectations, reinforces the outlook for higher rates, and weighs on valuations. This makes sense.
What didn’t make sense was major indices rallying to ATH levels while investors KNEW inflation was going to become a problem as Middle East tensions dragged on. But strong AI earnings and solid guidance outweighed the risks, while CEOs of non-tech companies increasingly warned that the energy crisis was starting to eat into consumers’ purchasing power.
Now, this setup has been in place for more than two months, and central bankers have already expressed their views on what’s coming.
The European Central Bank (ECB) is expected to hike rates as soon as next month, while some hawkish voices are also growing louder at the Bank od Japan (BoJ). The Bank of England (BoE) is on slippery ground, with gilt yields also pressured by the political earthquake there. I wouldn’t touch sterling nor UK gilts at this moment. There is too much political uncertainty, making the fiscal policy path highly uncertain in a country where growth and productivity are both notably under pressure.
In the US, there has been a major shift: the probability of a December rate hike is now priced in at more than 50%. Activity in Federal Reserve (Fed) funds futures is now pricing in a 25bp+ rate hike for this December at above 50%. That’s a major shift for a Fed that was, until recently, expected to keep rates steady.
Remember, before the Iran war started, markets expected the Fed to CUT interest rates this year. The White House even chose Kevin Warsh partly because he was seen as someone who could help deliver lower rates if he were to become the next Fed chair. Today, markets are pricing a more than 50% chance of a December rate HIKE instead.
That’s not great news when equity prices are flirting with ATH levels and valuations already look stretched.
A correction is inevitable
The Nasdaq 100 PE ratio is above 38 today, meaning that a correction would actually be healthy to bring valuations back to a more reasonable — and down-to-earth — level.
If the Nasdaq 100 PE ratio were to move back toward its historical range — somewhere around 25x to 30x earnings — it would likely imply a meaningful pullback in equity prices unless earnings growth accelerates fast enough to justify current valuations.
How meaningful? Pure maths suggests that a move from 38x PE to 30x PE would imply roughly a 20–22% correction if earnings expectations remain unchanged. Assuming earnings continue to grow, however, a correction of 10–15% may be more reasonable. That would bring the Nasdaq 100 toward the 23.6% Fibonacci retracement level of the rally from April 2025 to today, near 26’600, and potentially toward 25’200, near the current 200-DMA. In theory, such a retreat should not reverse the positive trend, which would remain intact above the 24’800 level, but it would take some air out of the rally and allow for a healthier path higher.
This week
The focus will remain on Iran and the Strait of Hormuz, but also on UK inflation, FOMC meeting minutes, and flash PMI numbers across major economies.
On the earnings front, Nvidia is due to release earnings on Wednesday after the closing bell. Nvidia’s results have been one of the most important gauges of the health of the AI growth story. But that is no longer entirely the case. Nvidia chips are still considered the best in the market for training complex AI models, but running them also requires CPUs and memory chips. This is why memory chipmakers have increasingly taken over the rally, while traditional CPU makers and memory specialists like Intel and Micron have recently outperformed Nvidia, and Korean memory chipmakers continue to dominate headlines.
So I believe Nvidia earnings could temporarily divert investors’ attention away from geopolitical worries and soaring bond yields. But the bar is now set extremely high for Nvidia, and an earnings beat alone may not automatically trigger a positive market reaction.