Sample Category Title
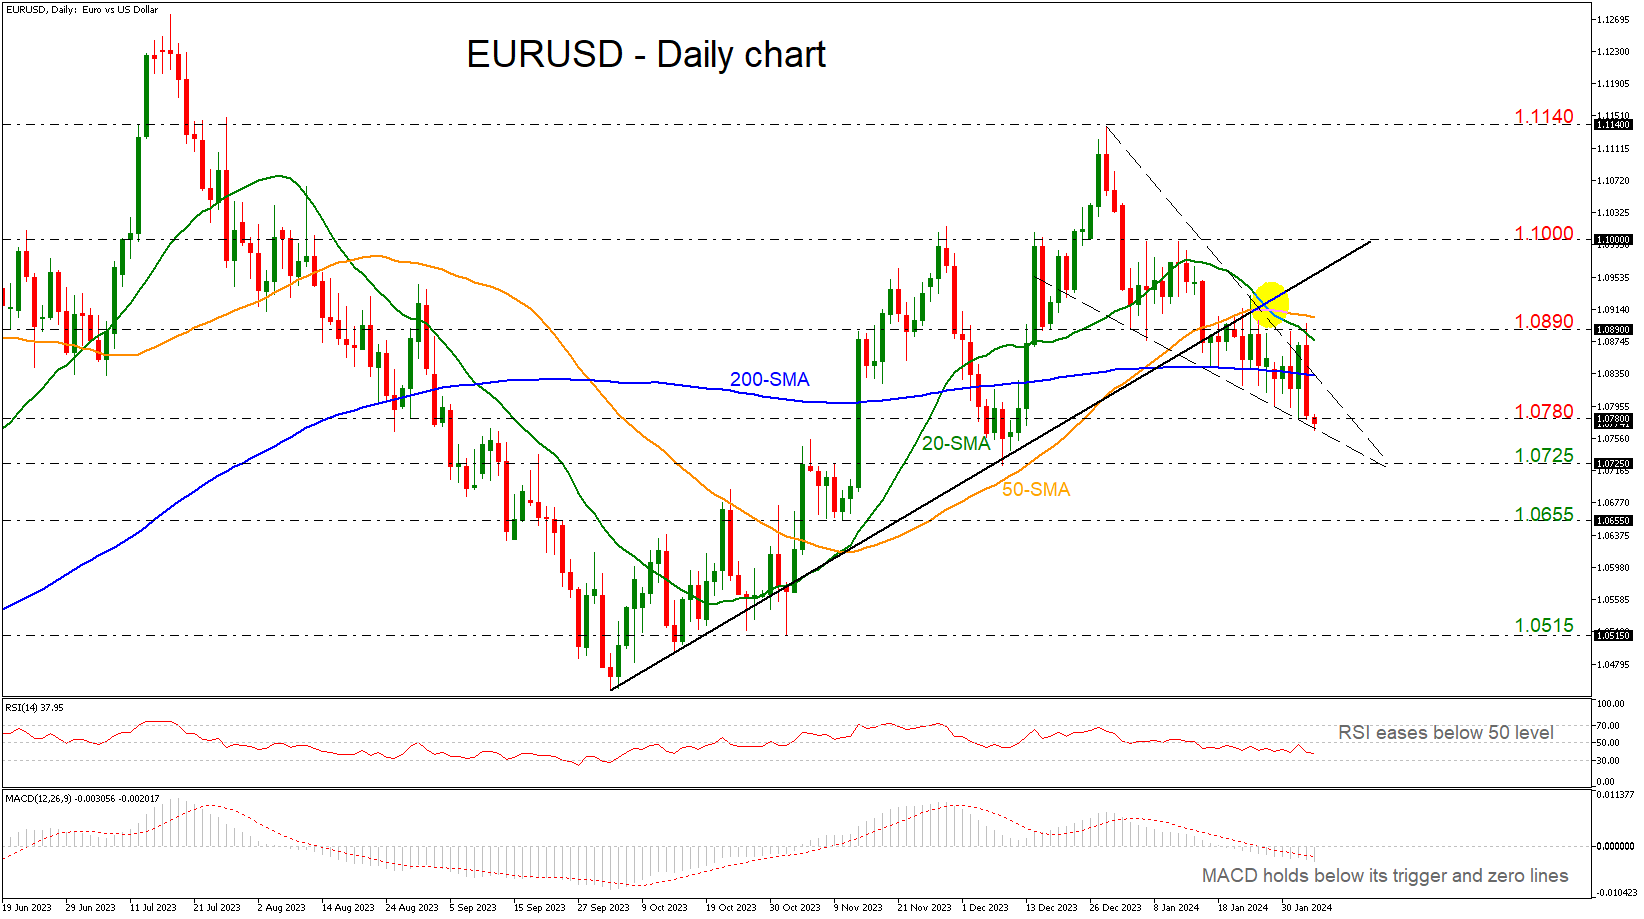
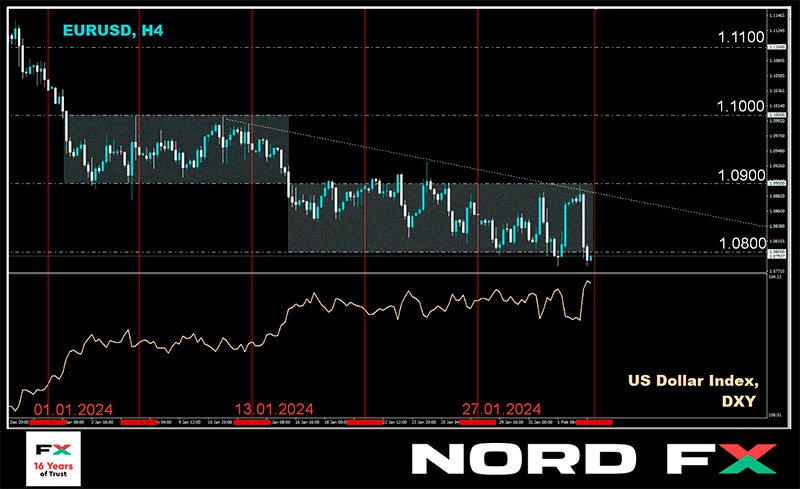
EURUSD Unlocks 2-month Low Below 1.0800
- EURUSD meets lower boundary of bearish triangle
- Market is in descending tendency
- MACD and RSI strengthen bearish bias
EURUSD plummeted more than 1% on Friday after the release of the NFP report and posted a fresh almost two-month low of 1.0766 earlier today, meeting the lower boundary of the bearish triangle.
The price is also developing beneath the 200-day simple moving average (SMA) and the 20- and 50-day SMAs act as strong resistance levels as well, after the bearish crossover that occurred in the preceding sessions. The RSI is standing beneath the neutral threshold of 50 and is moving lower, while the MACD is strengthening its negative momentum below its trigger and zero lines.
Further losses should see the December 8 low of 1.0725, endorsing the descending tendency in the market. A drop lower would take the price towards the 1.0655 support ahead of the 1.0515 barricade, taken from the bottom on November 1.
In the event of an upside reversal, the 200-day SMA at 1.0835 could act as a barrier before being able to re-challenge the 1.0890 resistance which holds between the short-term SMAs. A break above this region would shift the short-term outlook to a more neutral one as it would take the pair above the 1.1000 round number. Further gains would lead the way towards the 1.1140 high.
All in all, EURUSD seems to be in a bearish mode with the technical oscillators endorsing this view. However, a climb above 1.1000 may raise some optimism for a bullish retracement.
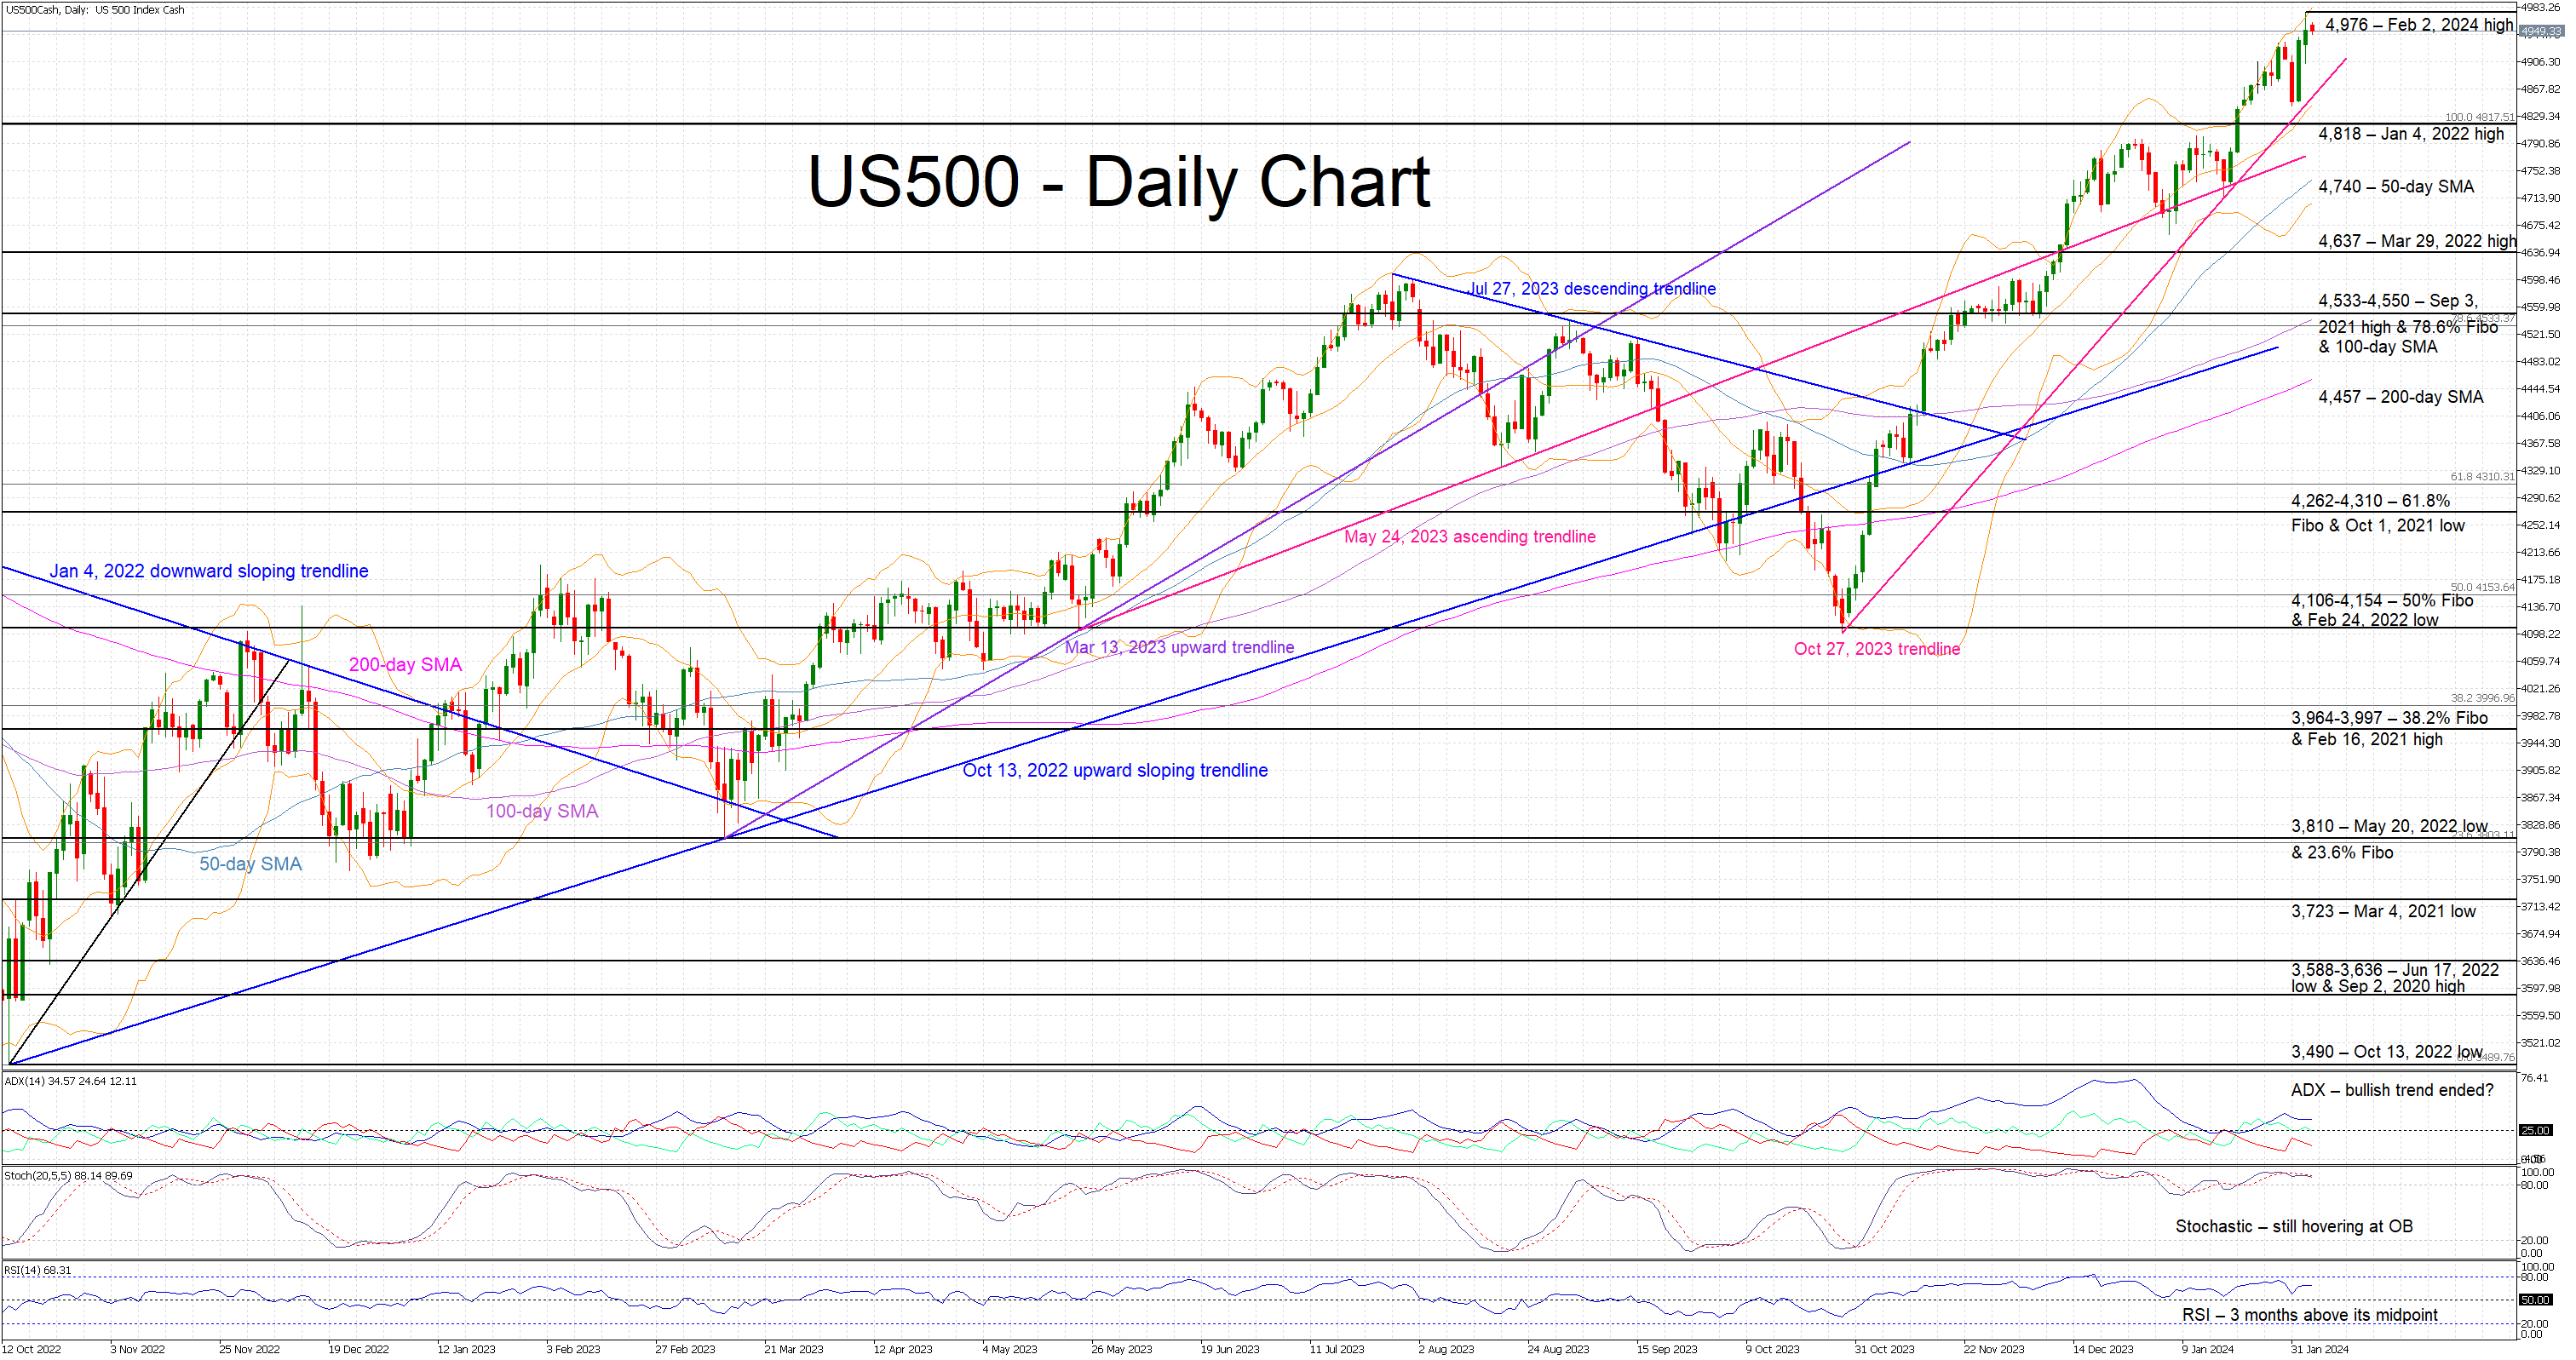
US 500 Cash Index Continues to Record Higher Highs
- US 500 index flirts with new all-time highs on daily basis
- Bears lack the strength to stage a correction
- Momentum indicators still support the bullish move
The US 500 cash index is edging lower after recording a new all-time high of 4,976 last week. Friday’s US labour market statistics do not appear to have dented the market’s bullish appetite. Having said that, the pace of the rally since the October 27, 2023 low of 4,100 remains too aggressive and thus keeping the door open to a much-delayed correction.
The current bullish trend is still assumed to be in place, but the momentum indicators could be close to sending bearish signals. The Average Directional Movement Index (ADX) is hovering a tad above its 25-midpoint, signaling a much-weakened bullish trend in place. Similarly, the RSI is trading sideways, completing three months above its 50-midpoint. More importantly, the stochastic oscillator continues to battle with its simple moving average (SMA) at the overbought (OB) territory. Should it finally manage to break below the OB area, it would be seen as a strong bearish signal.
The bears are desperately trying to recapture the market reins and to push the US 500 index below the October 27, 2023 ascending trendline and towards the January 4, 2022 high at 4,818. If successful, they could have a go at testing the support set by the 50-day SMA and the March 29, 2022 high at 4,740 and 4,637 respectively. Even lower, the bears could face the busy 4,533-4,550 area.
On the flip side, the bulls could first try to keep the US 500 index above the October 27, 2023 trendline and test the resistance set by the February 2, 2024 high at 4,976. Even higher, the 5,000 level looks like the plausible next target.
To conclude, with the US 500 index continuing to record new all-time highs, the bulls are probably feeling extremely confident and ignoring some early rally-exhaustion signals.
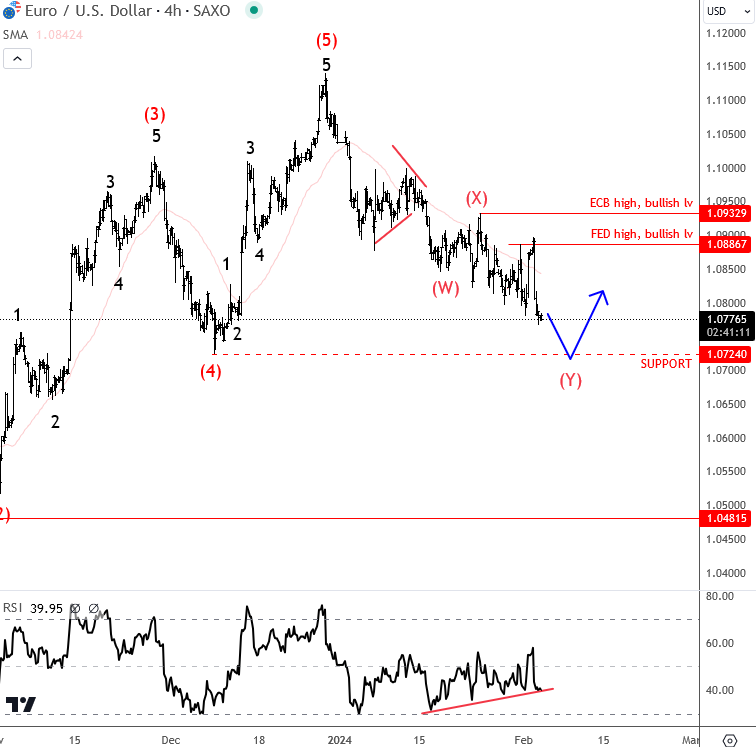
EUR/USD Still Trading South, But Bears Losing the Momentum
Euro turned up at end of 2023, it recovered with a sharp reaction higher up to 1.1 area where pair slowed down and turned lower into a pullback that is now in progress. Ideally, thats now overlapping drop of a higher degree correction that can represent even wave 2 higher degree, so be aware of price stabilization, maybe soon as price comes down into some nice support, here at 1.08-1.07 area where complex correction can come to an end. Divergence on the RSI also suggests that pair bears can be losing momentum.
Daily and weekly closes above FED and ECB highs can confirm the bottom for the pair, especially now after another strong jobs data from the US.
It Might Take Until Summer for Fed to Start Easing Cycle
Markets
Fed Chair Powell signaled last week that the Fed wants additional confirmation that the economy is on a path that should bring inflation back to 2% in a sustainable way, even as inflation developed favorably over the past six months. The labour market in this respect is an important variable. Since the December meeting, the Fed again shifted its focus from inflation to both pillars of its mandate: price stability and maximum employment. For now, the employment pillar doesn’t force the Fed to scale back policy restrictions. The US economy in January again added an impressive 353k jobs, with an 126K upward revision for the previous two months on top. Wage growth accelerated to 0.6% M/M and 4.5% Y/Y (from 4.3%; 4.1% expected). Despite the recent rise in productivity, this kind of wage growth probably isn’t in line with inflation sustainably returning to 2%. Data from the consumer survey were less buoyant, but the unemployment rate remained stable at a low 3.7%. US yields jumped between 17 bps (5y) and 10.2 bps (30y). German yields followed at a distance, adding between 11.3 bps (5y) and 6.8 bps (30y). Markets now see only about 20% chance of a March rate cut and aren’t even sure anymore about a first step in May (80%). Even as markets had to scale back expectations on an early/aggressive rate cut cycle, equites held up well supported by positive earnings from tech bellwethers (Nasdaq +1.74%). The dollar outperformed. DXY closed at a new YTD top (103.92). EUR/USD dropped below the 1.08 handle (close 1.0788). Friday’s trends in bond and FX markets are extended this morning. Fed Chair Powell in an interview with CBS yesterday, repeated that it’s unlikely that the Fed will cut rates already in March as he sees a danger that recent good inflation readings might not be a true indictor of where inflation is heading. Confirmation is highly needed. The CBS interviewer indicated that Powell even suggested that it might take until summer for the Fed to start its easing cycle. The US 2y yield again adds 5 bps. USD extends its ascent (DXY 104, EUR/USD 1.078). Asian equities are trading mixed, with especially Chinese stocks showing volatility. They currently recover after another early session sell-off as the securities regulator vowed to take steps to contain the risks from the equity decline.
Market focus is again on the US with the services ISM and the senior loan officer opinion survey (SLOOS). The ISM is expected to revert an ‘unexpected’ December dip (52.0 from 50.5). Also prices and employment subindices deserve attention. For the loan survey, it will be interesting to see to what extend Fed policy is filtering through to actual credit practices as the economy continues to perform well. More signs of US eco resilience might push the US 2y yield for a test/break of the 4.5% resistance area. The technical picture of the dollar is improving. A sustained break of DXY above 104 in this respect would be illustrative. EUR/USD is also captured in a protracted downtrend with 1.0724/12 next key reference on the cards.
News & Views
Slovak Finance Minister Kamenicky said that his government wants to show investors that they have a clear consolidation trajectory and that its plan to reduce the budget deficit is credible. Rating agency Fitch as recently as December, downgraded Slovakia from A to A- over a deterioration of public finances and an unclear consolidation path. The budget deficit was 6.5% of GDP last year and is only to narrow to 6% this year. The government therefore is working on a €1.5bn package to cut spending and increase revenue, including cutting energy subsidies given the improving inflation outlook and energy market developments. Hungary’s economy minister Nagy delivered the opposite message, confessing that this year’s budget deficit target would be 4.5% of GDP rather than 2.9%. He forecasts the deficit narrowing to 3.7% of GDP in 2025 and to 3% in 2026.
The Turkish central bank (CBRT) fired its chair Erkan, 8 months into her job. She cited personal reasons and a smear campaign against her in local media as decision to step aside. She will be replaced by deputy governor Karahan who has credentials as an economist at the New York Federal Reserve and is expected to stick with the anti-inflation campaign or even take it slightly further. The CBRT raised policy rates to 45%, but suggested after its final 250 bps move in January that the rate hit a peak. The Turkish lira still holds close to all-time low levels near EUR/TRY 33.
Forex and Cryptocurrencies Forecast
EUR/USD: Dollar Strengthening Prospects Increase
Throughout January, a series of indicators: GDP, employment, and retail sales, consistently highlighted the strength of the US economy. The threat of recession diminished, and it became evident that the high interest rate did not significantly hinder economic performance. Market participants were keenly awaiting the Federal Open Market Committee (FOMC) meeting of the US Federal Reserve, scheduled for Wednesday, January 31, against the backdrop of these positive economic indicators.
As anticipated, the regulator maintained the key rate at its current level (5.50%) but shifted its rhetoric to indicate that its next move would likely be to ease monetary policy. The question on everyone's mind was: when? During the press conference, Fed Chair Jerome Powell sought to temper expectations. He stated that FOMC members wanted to be 100% certain of victory over inflation and that they would not rush into a dovish pivot until convincing evidence of inflation falling below the 2.0% target was seen. Fortunately, the strong economy permits this cautious approach. However, Powell acknowledged that should there be a sharp cooling in the labour market, the easing of monetary policy could occur quite swiftly.
It should be noted that throughout the latter half of January, Fed officials made concerted efforts to temper expectations of a rate cut starting as early as March. And it must be said, they succeeded. The probability of a policy reversal in March dropped from a peak of 90% to 35.5%, while the likelihood of a rate cut in May increased to 61%.
The market's reaction to the outcome of the FOMC meeting was rather muted. The DXY dollar index failed to reach 104.00, and EUR/USD, having dropped to 1.0800 on February 1, reversed direction and climbed back to 1.0900 by Friday, in anticipation of the release of data on the state of the American labour market.
The data published on February 2 revealed that the number of new jobs in the US non-farm sector (Non-Farm Payrolls) increased by 353,000 in January, far exceeding the expected 180,000. This followed a December increase of 333,000. Unemployment remained stable at 3.7%, while wage inflation rose to 4.5% on an annual basis, significantly surpassing market expectations of 4.1%. Thus, Fed Chair Jerome Powell's concerns about a sharp cooling of the labour market were unfounded, which clearly benefited the American currency.
Let's recall that a week earlier, on January 25, the European Central Bank (ECB) held a meeting where the regulator also left the key interest rate unchanged at 4.50%. During the press conference following the meeting, ECB President Christine Lagarde refrained from commenting on the possible timing of rate cuts. According to her, the Governing Council members believe it is too early to discuss easing monetary policy. However, many market participants think that economic challenges may prompt the ECB to initiate this process first. A comparison of macroeconomic indicators between the Old and the New World is enough to support this view.
The unemployment rate in the Eurozone stands at 6.4% compared to 3.7% in the US. European GDP barely moved from a recessionary negative level of -0.1% to 0% in Q4, while the US saw a growth of +3.3%. Moreover, inflation in the Eurozone is close to the target of 2.0%, currently at 2.9%, compared to 3.4% in the US. All these indicators could prompt the European Central Bank to begin easing monetary policy soon. Furthermore, ECB Vice President Francois Villeroy de Galhau recently stated that the rate could be reduced at any moment. Many market participants interpreted this as a signal that a dovish trend might begin within the next two months.
However, analysts at Commerzbank believe that an initial rate cut in March or April might not occur. They note that one negative factor for the euro persists. The bank's strategists think that there is a significant faction within the ECB Governing Council that is merely biding time, to then seize the first opportunity to advocate for a rate cut. "This may even be too soon," Commerzbank warns.
Economists at another bank, the British HSBC, expect the dollar to strengthen slightly in the medium term, especially against the euro and the pound. This is attributed to the continued outperformance of the US economy compared to many other G10 countries, allowing the Federal Reserve to delay easing its policy. "A less aggressive easing path could lead to a decrease in risk appetite, which would support the US dollar," HSBC specialists write.
EUR/USD closed the week at 1.0787. At present, 30% of experts have voted for the dollar to strengthen in the near future, anticipating further decline in the pair. An equal percentage sided with the euro, believing that the pair will at least remain within the 1.0800-1.0900 channel. The remaining 40% have adopted a neutral stance. Indicator readings on the D1 are more definitive. Oscillators are 100% in the red (though 20% of them signal oversold conditions). Among trend indicators, the balance of power is 85% red to 15% green. The nearest support for the pair is located in the 1.0780 zone, followed by 1.0725-1.0740, 1.0620-1.0640, 1.0500-1.0515, and 1.0450. Bulls will encounter resistance in the areas of 1.0820, 1.0890-1.0925, 1.0985-1.1015, 1.1110-1.1140, and 1.1230-1.1275.
Key events for the upcoming week include the release of data on business activity (PMI) in the US services sector on Monday, February 5. The next day, volumes of retail sales in the Eurozone will be disclosed. Thursday traditionally brings information on the number of initial jobless claims in the United States. And towards the very end of the workweek, on Friday, February 9, data on consumer price inflation (CPI) in Germany, the main engine of the European economy, will be released.
GBP/USD: US Labor Market Delivers Blow to the Pound
Last week, on Thursday, February 1, the Bank of England (BoE), like its counterparts across the Channel and the Atlantic, maintained its key interest rate at 5.25%. The Bank of England made no changes to its policy and did not issue any dovish statements. However, the pound received support as two members of the BoE's Monetary Policy Committee continued to vote for a rate hike of 25 basis points. This argument proved to be relatively weak, especially since another committee member voted for a rate cut, while the overwhelming majority, eight members, supported keeping the rate unchanged.
Analysts continue to believe that expectations are on the side of the British currency, speculating that the BoE might be among the last to cut rates this year. However, according to Scotiabank specialists, for further growth of the GBP/USD pair, a breakthrough of the late December peak at 1.2825 is necessary. Yet, there seems to be no foundation for this at the moment. Moreover, strong data from the US labour market strengthened the dollar and prevented the pair from remaining near the upper boundary of the 1.2600-1.2800 sideways channel, where it has been trading for seven weeks.
GBP/USD concluded the past week at 1.2632. According to economists at Internationale Nederlanden Groep (ING), a strong dollar may keep GBP/USD around the 1.2600-1.2700 range in Q1 2024. Regarding the median forecast of analysts for the coming days, 35% voted for the pair falling below the 1.2600 support level, 50% for its rise, and 15% preferred to maintain neutrality. Unlike the experts, trend indicators on D1 show a slight bias towards the American currency, with 60% indicating a strengthening dollar and further decline of the pair, against 40% suggesting its rise. Among oscillators, 65% lean towards the dollar (with 10% indicating oversold conditions), 10% favour the pound, and the remaining 25% hold a neutral position. Should the pair move south, it will encounter support levels and zones at 1.2595-1.2610, 1.2500-1.2515, 1.2450, 1.2330, 1.2210, and 1.2070-1.2085. In case of an upward movement, resistance will be met at levels 1.2695-1.2725, 1.2785-1.2820, 1.2940, 1.3000, and 1.3140-1.3150.
No release of significant macroeconomic data related to the economy of the United Kingdom is anticipated for the upcoming week.
USD/JPY: BoJ Policy Shift: Dreams or Reality?
Strong U.S. labour market statistics dashed the hopes of bulls not only for the euro and the pound but also for the yen. At the beginning of the past week, the Japanese currency was gaining, and USD/JPY was trending downwards, marking a local minimum at 145.89 on Thursday, February 1. A sharp decline in the yield of U.S. Treasuries helped the yen. Specifically, the yield on 10-year U.S. bonds fell to its lowest level since the end of December: 3.9%. It is worth noting the correlation between U.S. securities and USD/JPY. If the yield on ten-year Treasury notes falls, the yen strengthens, and USD/JPY forms a downward trend. This was exactly the case. However, the end of the workweek was characterized by a clear advantage for the American currency, and the pair soared again, concluding at 148.35.
Many market participants continue to harbour hopes for a tightening of monetary policy by the Bank of Japan (BoJ). For instance, analysts at the Canadian Imperial Bank of Commerce (CIBC) expect the BoJ to move away from negative interest rates in April, with additional changes in its Yield Curve Control (YCC) policy to support the Japanese yen in the second half of the year. "We believe," CIBC strategists write, "that USD/JPY has already reached its peak and should [...] decrease to 144.00 in Q2. Following this, we anticipate that rate cuts by the Federal Reserve and the prospect of gradual adjustments to the BoJ's YCC will lead to a decline in USD/JPY to 140.00 in Q3 and 135.00 in Q4 2024."
It's important to note that many experts had anticipated a tightening of the Bank of Japan's (BoJ) monetary policy already in 2023: a topic extensively covered in previous discussions. However, this did not occur. And it might not happen now either.
In January, the Consumer Price Index (CPI) in the Tokyo region unexpectedly fell from 2.4% to 1.6%, and the core CPI, excluding fresh food and energy prices, decreased from 3.5% to 3.1%. Additionally, the growth of industrial production in Japan in December slowed to 1.8%, against a forecast of 2.4%. On a year-over-year basis, industrial production also showed further deceleration: in December, this indicator was -0.7% (year-on-year), an improvement compared to the previous period's -1.4% but still marking a decline.
Such a significant easing of inflationary pressure and a slowdown in economic growth may lead to the BoJ not tightening its policy in the foreseeable future, leaving the interest rate at -0.1%. This forecast was also confirmed by the minutes from the Bank of Japan's December meeting. It was indicated that the Board members agree that "it is necessary to patiently maintain a loose policy."
Regarding the near-term outlook, only 25% of experts expect further strengthening of the dollar and an increase in USD/JPY. In contrast, 75% are siding with the yen, agreeing with CIBC economists that the pair has reached its peak. Trend indicators and oscillators on D1 are all pointing northward, with 100% indicating upward momentum, although 10% of the latter are in the overbought zone. The nearest support level is located in the 147.60 zone, followed by 146.85-147.15, 146.00, 145.30, 143.40-143.65, 142.20, 141.50, and 140.25-140.60. Resistance levels and zones are at 148.55-148.80, 149.85-150.00, 150.80, and 151.70-151.90.
No significant events or statistics related to the Japanese economy are expected in the upcoming week.
CRYPTOCURRENCIES: Halving – Grief or Joy?
Throughout the past week, BTC/USD moved with support at $42,000 without showing any significant results in either direction, drawing special attention to its statistics. Analysts note that the 12-month volatility of the first cryptocurrency has reached its lowest level in 12 years. The indicator has varied significantly over the years but has generally shown a clear downward trend over this period. From 179% in January 2012, it dropped to 45% at the beginning of this year.
A higher volatility figure indicates significant price variability and signals greater market unpredictability. Lower metric values suggest much more stable trading conditions. The decreased volatility could mean a larger number of long-term holders, according to CryptoQuant. The research department at Galaxy Digital predicts that the spot bitcoin ETFs launched in January will further smooth out price fluctuations. "A huge amount of BTC will be held in [investment] advisory accounts. They are not interested in intraday trading," the experts state.
Analysts at Glassnode also spoke about long-term investors. Their report indicates that the overwhelming majority of such BTC holders still do not wish to part with their coins and adhere to a hodling strategy in anticipation of higher spot prices. According to K33 Market Research, the volume of spot trading in bitcoin reached "sustainably high activity following the approval of ETFs." Data from The Block's Data Dashboard shows that the monthly volume of on-chain transactions in the bitcoin network in January was at a multi-month high, with trading volume for January exceeding $1.11 trillion.
Regarding the Bitcoin ETFs launched in January, the situation has not been as promising as expected. According to several experts, this is a classic case of "buy the rumour, sell the news." Initially, there was an impressive bull rally. Now, however, as these funds have become operational, market participants have begun actively taking profits.
The Grayscale ETF was converted from a trust fund, and by the end of January, it experienced a withdrawal of funds amounting to $2.2 billion. The reason for this is not only the profit-taking by the trust's shareholders in 2023 but also dissatisfaction with high management fees. Grayscale charges a 1.5% fee, whereas other funds have managed to keep their fees between 0.2-0.3%. Among the ETF competitors, BlackRock continues to lead with $2.2 billion, with Fidelity approaching $2 billion. WisdomTree is at the bottom of the ranking with $6.3 million. As for the net inflow of funds since the launch of spot BTC-ETFs, it stands at a modest $760 million.
In addition to profit-taking, another reason putting pressure on the market has been the miners. The halving is scheduled for April 19, leaving roughly 2.5 months. If the price of digital gold does not show significant growth during this period, the majority of miners will face a severe liquidity shortage. Therefore, they have already started to sell off their BTC reserves to replenish liquidity. Since the approval of spot ETFs on January 10, they have sent a record 624,000 BTC to exchanges over the last six years, approximately worth $26 billion. According to estimates, miners still have about 1.8 million BTC left, valued at $76 billion. The sale of these reserves could potentially push bitcoin prices significantly lower.
Analysts at Matrixport have forecasted a drop in BTC/USD to $36,000. They believe that bitcoin might then appreciate in value, but only against a backdrop of favourable macroeconomic conditions and increasing liquidity. (It's worth mentioning that these same analysts had predicted bitcoin would reach $125,000 in 2024 back in December).
Chris Burniske, a partner at the venture firm Placeholder, provided an even more pessimistic forecast. He believes that the price of the leading cryptocurrency will first fall to the $30,000-$36,000 range and then likely reach a local bottom around $20,000. "The consolidation will come lower than most people expect, due to too many variables (e.g., specifics of the crypto market, macroeconomics, adoption, and development of new products)," the expert warned. However, testing the levels around $20,000 will be a "real step" towards reaching previous highs, he believes. "The journey there will be volatile – expect setbacks. And it will take months. As always, your best friend is patience," Burniske emphasized, adding that the decline in other assets will be even deeper than that of bitcoin.
Contrary to Chris Burniske, the forecast by analyst DonAlt appears significantly more optimistic. He cheered his 56,700 YouTube subscribers by noting that bitcoin managed to avoid a total price collapse after the launch of the Bitcoin ETFs. "Digital gold looks strong even after its price dropped below $40,000 last week," he observed. The expert believes that the absence of mass selloffs is a positive sign. "For this reason, I am no longer in the bear camp; now, I am with the bulls," he declared. DonAlt also emphasized that bitcoin is consolidating within a strong upward trend and is likely to regain bullish momentum once it overcomes resistance at the $44,000 level.
Another expert, known by the nickname Rekt Capital, believes traders have one last chance to buy bitcoin at a low price. He analysed historical data and came to the following conclusions:
1. If bitcoin does not become cheaper in the next two weeks, then the coin's price will not significantly fall until the halving. 2. Approximately 60 days before the halving, BTC's price will rise on the wave of hype surrounding the event. 3. After the halving, speculators will rush to sell the cryptocurrency, so bitcoin will depreciate for several weeks, and its value may drop by 20-38%. 4. Then a period of accumulation will begin, lasting up to 150 days, characterized by a relatively low level of BTC price volatility. 5. After this, a phase of parabolic growth in the bitcoin price will start, and its price will reach a new all-time high.
Markus Thielen, Head of Research at 10x Research, is a proponent of Elliott Wave Theory, which suggests that asset prices move in five waves. According to this theory, the first, third, and fifth waves are "impulse waves" that move the asset in the direction of the trend, while the others are corrective "retracement waves." The analyst believes the recent decline in bitcoin's price represents the fourth wave, i.e., a retracement. At present, the fifth wave is beginning, which could push the price upward. "Wave analysis has marked this recovery up to $52,671 potentially by the end of the first quarter of 2024," Thielen announced.
Anthony Scaramucci, the founder of hedge fund SkyBridge Capital, pointed to a similar figure. "Suppose the price [on the day of the halving] is $50,000," he predicts. "Multiply this BTC price by four, and it will reach this level [$200,000] within the next 18 months." Previously, the head of SkyBridge claimed that the BTC rate could reach $100,000 after the halving. As an additional reason for a bullish rally, he cited the reduction of the US Federal Reserve's interest rate.
Regarding the long-term course, Scaramucci forecasts that bitcoin's market capitalization could reach half of gold's, which stands at $14.5 trillion. Therefore, by his calculations, the price per coin would amount to about $345,000.
Peter Schiff, the President of Euro Pacific Capital and a staunch opponent of the first cryptocurrency, made an unexpected long-term forecast. While he typically predicted a complete crash for bitcoin, he has now suggested that by 2031 the price of the coin could reach ... $10 million, albeit under a very hypothetical scenario. According to him, this would only occur if the US dollar were to follow the path of "German paper marks." This term informally referred to the currency introduced in Germany at the start of World War I in 1914 as a replacement for the previous gold-backed mark. In the early 1920s, the paper mark depreciated due to hyperinflation. At that time, companies paid wages several times a day so that workers could make purchases before prices rose again. The money supply grew so rapidly that the state could not print banknotes fast enough and had to enlist private companies for help. The largest denomination issued was a banknote worth 100 trillion marks.
In reality, Peter Schiff does not believe in an economic collapse and the fall of the US dollar. Thus, this forecast of his can be considered mockingly sarcastic towards bitcoin. However, Robert Kiyosaki, the economist and author of the bestseller "Rich Dad Poor Dad," harbours no doubts about such a scenario. He continues to insist that gold, silver, and bitcoin should be part of every investor's portfolio. He is confident that the price of BTC could reach $1 million in the event of a global economic collapse.
As of the evening of February 2, when this review was written, the global economy has not collapsed, BTC/USD has not reached either $1 million or $10 million, and is currently trading around $43,000. The total market capitalization of the crypto market stands at $1.65 trillion (up from $1.61 trillion a week ago). The Crypto Fear & Greed Index has increased to 63 points (from 49 a week ago), moving from the Neutral zone into the Greed zone.
What a Blast
Friday’s abnormally strong jobs data resonated like a bomb across the financial markets. The US economy added 353’000 nonfarm jobs last month versus the consensus of around 185’000 new job additions. The average wage growth unexpectedly accelerated to 4.5%, and the unemployment rate remained steady at 3.7%. Here we are, finding ourselves with an NFP number above 350’000 just a few weeks before the Federal Reserve (Fed) will presumably start cutting interest rates. The jobs numbers are looking great – to say the least, and the US economic growth continues to surprise to the upside. None of these numbers point to recession, or a need for the Fed to start cutting the rates. The only possible pain is the resurfacing regional banks worries. But besides that, nothing suggests that the Fed should be cutting the rates in March, or even in May.
As such, a March rate cut from the Fed looks like a pipe dream. Activity on Fed funds futures now gives less than 20% chance for a rate cut to happen in March. Remember, this probability stood at around 80% at the start of the year. And the probability of a May cut has fallen to around 70%, whereas the market was pricing a May cut near almost 100% before the jobs data.
The dramatic jobs number of Friday met a dramatic reaction from the bond markets. The US 2-year yield which best captures the Fed rate bets jumped more than 20bp, the 10-year yield jumped past 4%, and the US dollar index rallied past its 200-DMA and reached the highest levels since early December. The EURUSD slipped below the 1.08 level on a broad-based rally in the US dollar on Friday and hit my 100-DMA bearish target. Strengthening trend and momentum indicators, and a reasonable RSI index suggests that the euro selloff could extend. Next bearish target stands at 1.0710, the major 61.8% Fibonacci retracement on October to December rally. The USDJPY – which had started to have a taste of the 145s last week is back above 148, and Cable is back testing the 1.26 to the downside.
As we don’t have life changing data, the market will continue to digest the strong US jobs data. The latter could help the US dollar consolidate and extend gains. The most important events on this week’s economic calendar are the Chinese inflation numbers and the Reserve Bank of Australia (RBA) rate decision. Deflation in China is expected to have accelerated and the RBA is expected to keep its rates unchanged. The AUDUSD slipped below its 100-DMA and is testing the 65 cents support to the downside this morning. China’s inability to boost appetite, retreat in iron ore prices and now this strong US dollar should continue to weigh on the Aussie.
Stocks do their own thing
Interestingly – and happily, the jump in the US yields and the severe retreat in Fed rate cut bets didn’t impact the stock markets AT ALL. Stock traders were in such a great mood on Friday that the good jobs data was almost welcome as a sign of strong economic growth and good future earnings. Meta jumped 20% to a fresh all-time high, gained more than $200bn in market value in just one trading session - the biggest one-day gain in the history of one-day gains. Amazon jumped nearly 8% and is finally back to its long-term ascending trend. Nvidia hit a fresh record because – why not! And the S&P500 closed at a fresh record.
The funny thing is that about half of S&P500’s early year gains are due to Magnificent 7 stocks. The equal weight index has been completely flat. And with most of Big Tech earnings out of the way without much disappointment – on the contrary, there is nothing to worry about for the overall trend for the Big Tech. Whatever happens to Fed expectations, there is something good to trade. Bad economic news means sooner and faster Fed cuts. Good economic news means better corporate profits. What can go wrong?
Oil unreactive to US retaliation
The barrel of US crude fell to $72pb level last week and is not much higher this morning despite the US retaliation for last weekend’s attacks. The risk of escalation with Iran remains, but that risk is not being properly priced in. Trend and momentum indicators suggest that there is room for further slide. Any price rallies could be interesting tactical shorts targeting the $70pb level.
Powell Interview Adds to Strong Jobs Data Driving Yields Higher
In focus today
From the US, the ISM Services index is due for release for January. The December data pointed towards weakening growth momentum, but the latest signals from flash PMIs have been more optimistic.
In the euro area, we receive the February Sentix investor confidence indicator as well as December PPI data.
In Sweden, we get the service PMI numbers for January. The increase to 50 in December was the highest level in five months. The NIER's economic tendency survey published last week showed a similar trend with the strongest confidence in the service sector in six months which could indicate a continued increase for today's number.
Overnight, we get December wage data from Japan. Wage growth is key to the outlook for Bank of Japan tightening, but we will probably have to wait for the spring wage negotiations to see wages move much higher.
Early Tuesday morning, the Reserve Bank of Australia will have a monetary policy meeting. The focus will naturally be on the outlook for rate cuts, but we and the markets expect no monetary policy changes just yet.
Fed's Bostic speaks at 20.00 CET.
The remainder of the week is thin on tier 1 data. Sub-zero Chinese inflation will likely pull some headlines on Thursday.
Economic and market news
What happened overnight
Powell interview: In the US, in an interview with the tv show '60 Minutes', Fed's Powell reiterated his comments from the press conference last Wednesday, that the FOMC would most likely not begin cutting rates in March. He also backed the dot plot released at the December meeting indicating FOMC members expect three rate cuts this year. This compares to markets currently pricing in five cuts for 2024. Powell emphasised the strength of the economy, underlining a strong jobs market, and saying how the economic pain he forewarned in Jackson Hole in August 2022 may come with the following rate hikes in large parts have not materialised. The 10-year US Treasury yield had risen around 3.5bp early morning following Powell's comments. The interview was filmed Thursday, a day prior to the release of the surprisingly strong Non-Farm Payroll data (see more below).
Oil began the week slightly up this morning with the ICE Front Month Brent contract trading at around USD77.90/bbl.
In China, the private Caixin services PMI rose less than forecast coming in at 52.7 compared to an expected 53 and down from December's 52.9. The number still indicates the Chinese service sector remains in expansion.
What happened over the weekend and on Friday
US Non-Farm Payroll data for January came in stronger than expected at 353k jobs (consensus expected 185k). December job numbers also saw an upward revision to 333k from 216k. The unemployment rate remained unchanged at 3.7%. On the wage front, average hourly earnings grew by 0.6% m/m, twice the rate expected. This corresponds to a 7% annual increase which does not align with a 2% inflation rate.
US politics: Donald Trump said he would impose tariffs on Chinese goods again if elected. The widely expected Republican nominee for this year's presidential election said tariffs on Chinese goods could exceed 60%. President Joe Biden safely secured victory in the Democratic party primary in South Carolina. The result was widely expected, and the incumbent is expected to safely secure the DNC nomination.
In the Middle East, the US attacked Iran-backed militias in Iraq and Syria in retaliation of an attack in Jordan that killed three US military personnel. US national security advisor Jake Sullivan was cited for saying the strikes were "the beginning, and not the end".
In Yemen, the US and UK conducted another round of strikes against the Iran-backed Houthis. This marks their third joined strike against the Houthis. The US conducted additional strikes on Sunday.
Equities: Global equities rose Friday to end the week at all-time high, driven by solid earnings results and better than expected macro. Friday's NFP report was yet another example of how equity investors are viewing strong macro data very differently now compared to six months ago. Both S&P500 and Nasdaq rose more than 1% despite a very hot NFP print took US 2-year yields up almost 20bp. That would not have happened six months ago. Put on top of this, it was entirely driven by the set of cyclicals while defensives ended lower Friday. It is also worth mentioning that higher yields are still a challenge for long duration small caps and hence regional banks. That fear of CRE related losses has reemerged after the NYCB shocked investors by reducing its dividend, posting a quarterly loss and ramping up loan-loss provisions. In US on Friday, Dow +0.4%, S&P 500 +1.1%, Nasdaq +1.7% and Russell 2000 -0.6%. Asian markets are mostly lower this morning despite solid service PMIs out from the region. Futures in Europe are mixed while a tad lower in US as Powell damped the optimism around rate cuts in a Sunday interview on the tv show "60 Minutes".
FI: Global rates staged a strong sell-off on Friday on the back of the strong US labour market report. With 353k new jobs created in January, markets sold off from the front end, with the March FOMC meeting repricing 4bp higher to only have 5bp priced in. 2y UST rose 15bp on the day to trade at 4.36%. 10y UST rose 12bp on the day. The US curve move took the European rates higher as well, where the 10y German bund yield ended 10bp higher on the day, and thereby erased most of what was otherwise set for a 15bp rally on the week. Markets are pricing 132bp of ECB rate cuts by year end, which is 13bp less than Thursday's close.
FX: Friday's robust US labour market sent US yields soaring which also translated into USD strength and EUR/USD looks set to commence trading this week below 1.08. The effect on Scandies were the opposite, with both SEK and NOK suffering from higher yields and the stronger USD, despite resilient risk sentiment equity-wise.
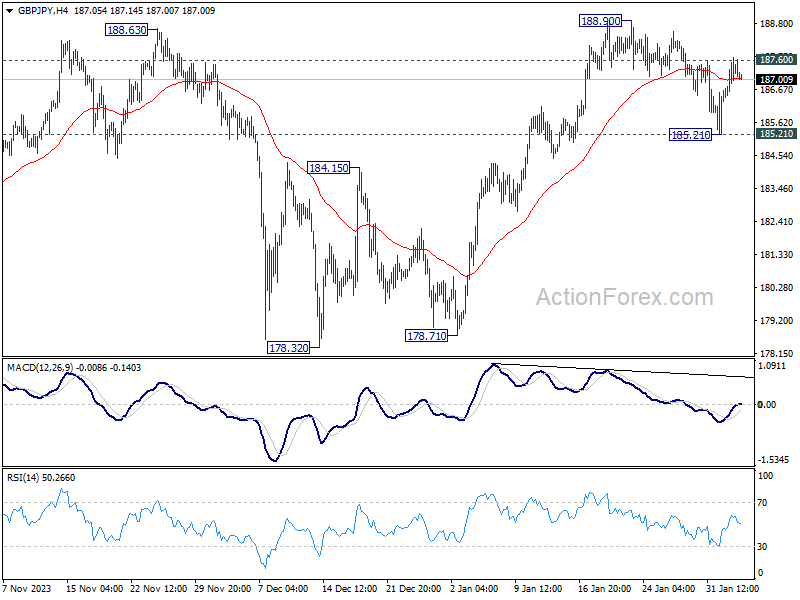
GBP/JPY Daily Outlook
Daily Pivots: (S1) 186.63; (P) 187.18; (R1) 188.00; More...
Intraday bias in GBP/JPY remains neutral for the moment. On the upside, firm break of 187.60 will turn bias to the upside for 188.90. Break there will confirm resumption of larger up trend. Meanwhile, below 185.21 will turn bias to the downside and extend the correction from 188.90.
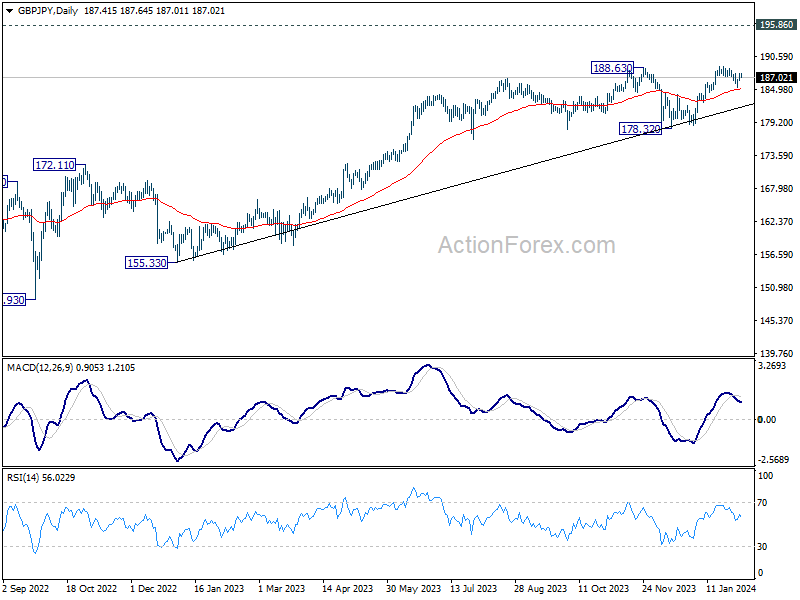
In the bigger picture, up trend from 123.94 (2020 low) in in progress. Medium term outlook will stay bullish as long as 178.32 support holds. Next target is 195.86 long term resistance (2015 high).
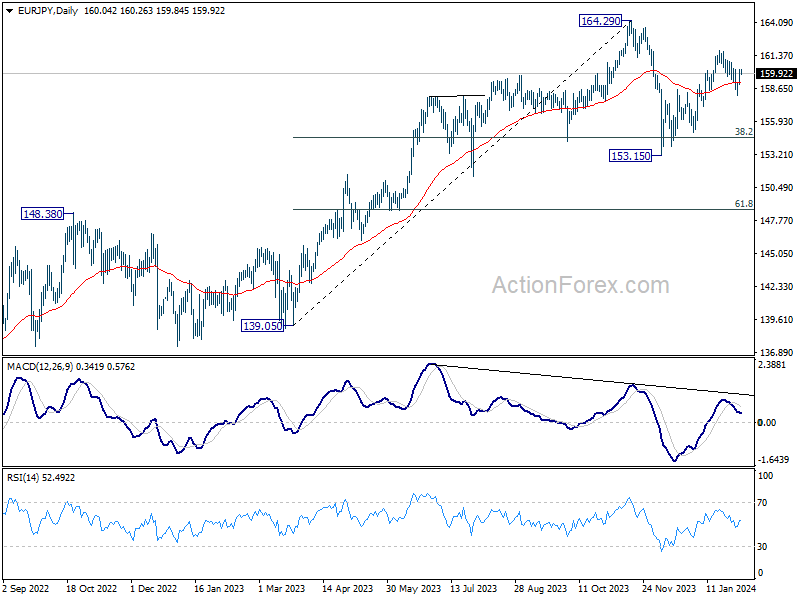
EUR/JPY Daily Outlook
Daily Pivots: (S1) 159.31; (P) 159.79; (R1) 160.52; More...
Intraday bias in EUR/JPY remains neutral for the moment. On the upside, firm break of 160.25 minor resistance will indicate that rise from 153.15 is ready to resume, and turn bias back to the upside for 161.84 first. Nevertheless, break of 158.06 will now suggest that the rise from 153.15 has completed and turn bias back to the downside.
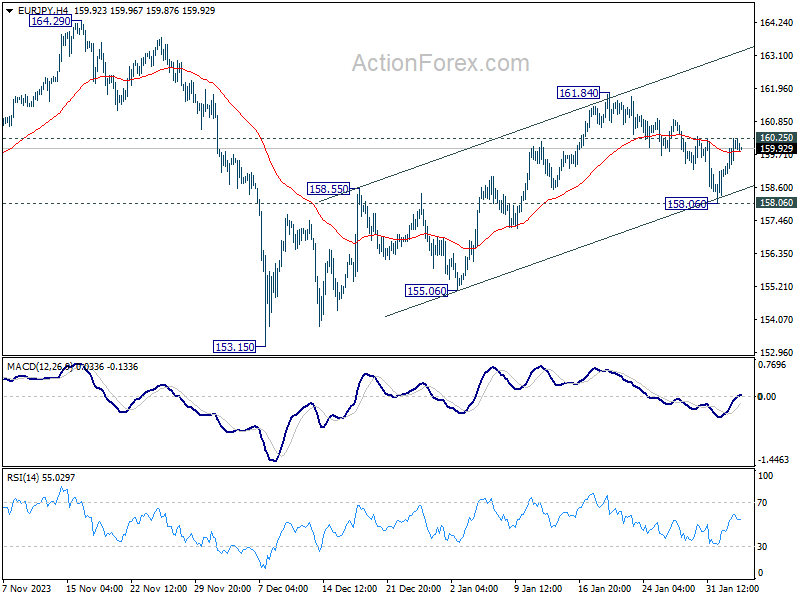
In the bigger picture, price actions from 164.29 medium term top are seen as a correction to rise from 139.05 only. As long as 148.38 resistance turned support holds (2022 high), larger up trend from 114.42 (2020 low) is expected to resume through 164.29 at a later stage.
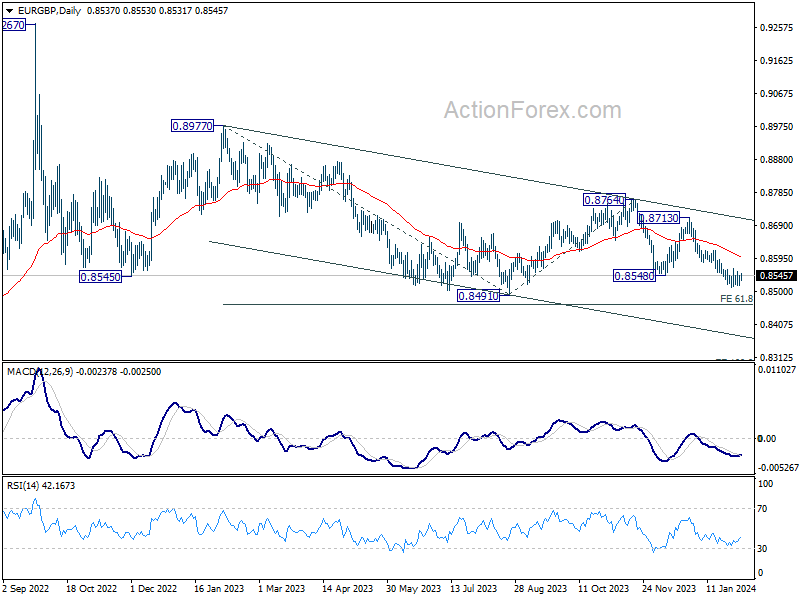
EUR/GBP Daily Outlook
Daily Pivots: (S1) 0.8524; (P) 0.8536; (R1) 0.8551; More...
Intraday bias in EUR/GBP stays neutral for the moment. Near term outlook will stay bearish as long as 0.8591 resistance holds. Below 0.8512 will resume the decline from 0.8713 to 0.8491, and then 0.8464 projection level. However, firm break of 0.8591 will turn bias back to the upside for stronger rebound.
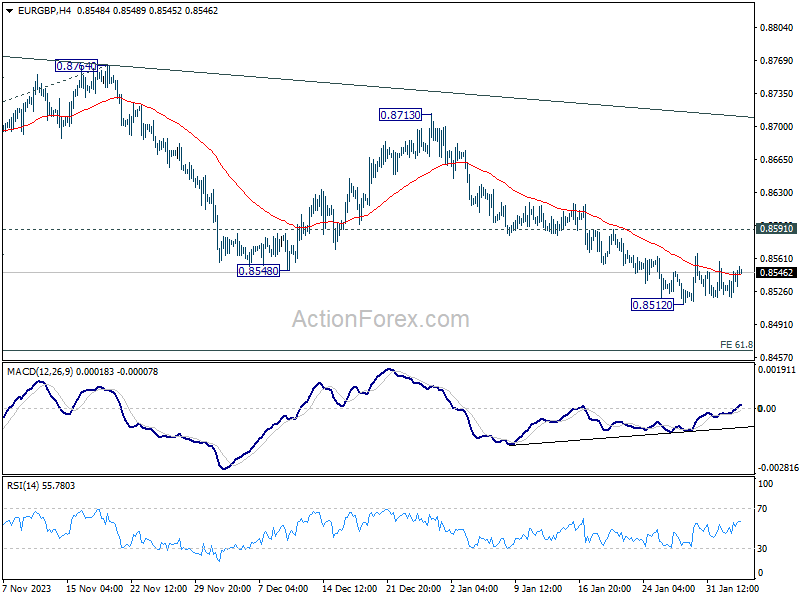
In the bigger picture, fall from 0.8764 is seen as another leg in the whole down trend from 0.9267 (2022 high). Outlook will stay bearish as long as 0.8713 resistance holds. Break of 0.8491 will target 61.8% projection of 0.8977 to 0.8491 from 0.8764 at 0.8464.