Sample Category Title
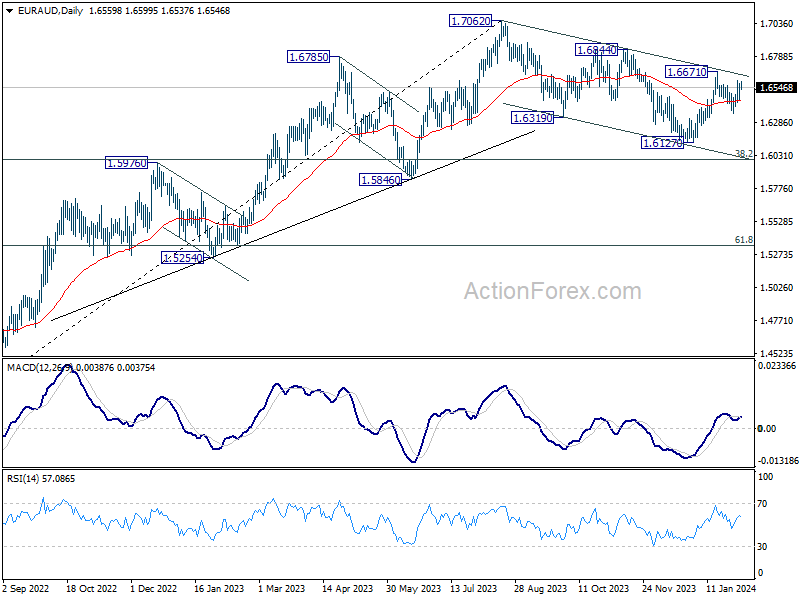
EUR/AUD Daily Outlook
Daily Pivots: (S1) 1.6494; (P) 1.6537; (R1) 1.6610; More...
Intraday bias in EUR/AUD remains neutral for the moment. t. On the upside, decisive break of 1.6671 will revive the case that whole correction from 1.7062 has completed with three waves down to 1.6127. Further rally should then be seen to 1.6844 resistance for confirmation. Nevertheless, break of 1.6438 will bring deeper fall back to 1.6127 support instead.
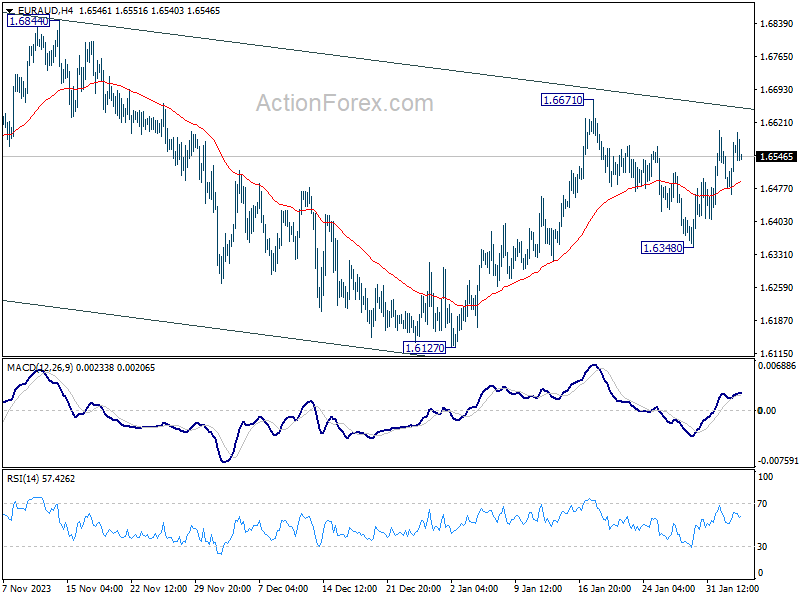
In the bigger picture, fall from 1.7062 medium term top is seen as correction to the up trend from 1.4281 (2022 low). Break of 1.6844 resistance will argue that this up trend is ready to resume through 1.7062 high. In case of another fall, strong support should be seen around 1.5846 and 38.2% retracement of 1.4281 to 1.7062 at 1.6000 to bring rebound.
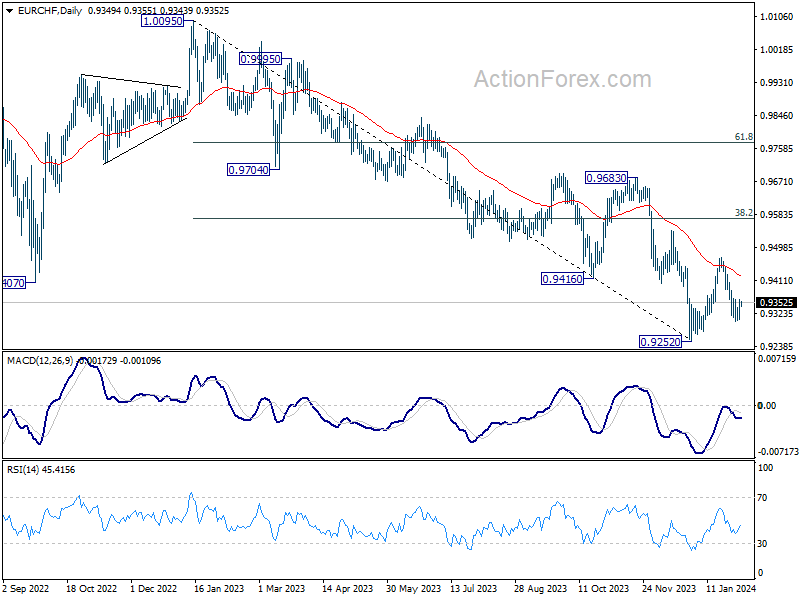
EUR/CHF Daily Outlook
Daily Pivots: (S1) 0.9320; (P) 0.9341; (R1) 0.9372; More...
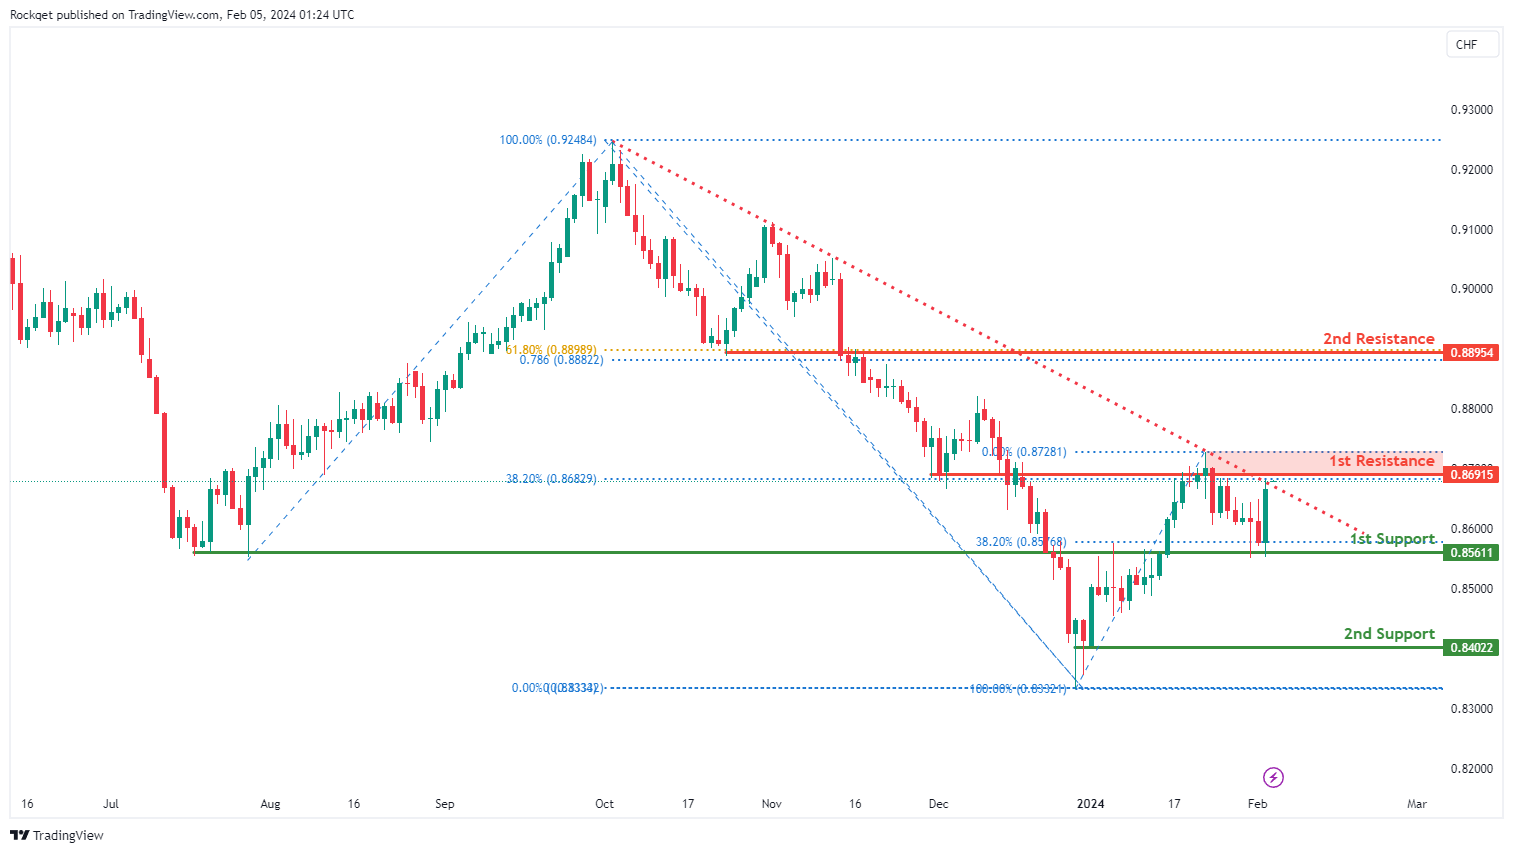
Intraday bias in EUR/CHF remains neutral for the moment. Fall from 0.9471 could still extend lower, but downside should be contained above 0.9252 low to bring rebound. On the upside, firm break of 0.9363 minor resistance will argue that the correction from 0.9471 has completed, and turn bias back to the upside for 0.9471 first.
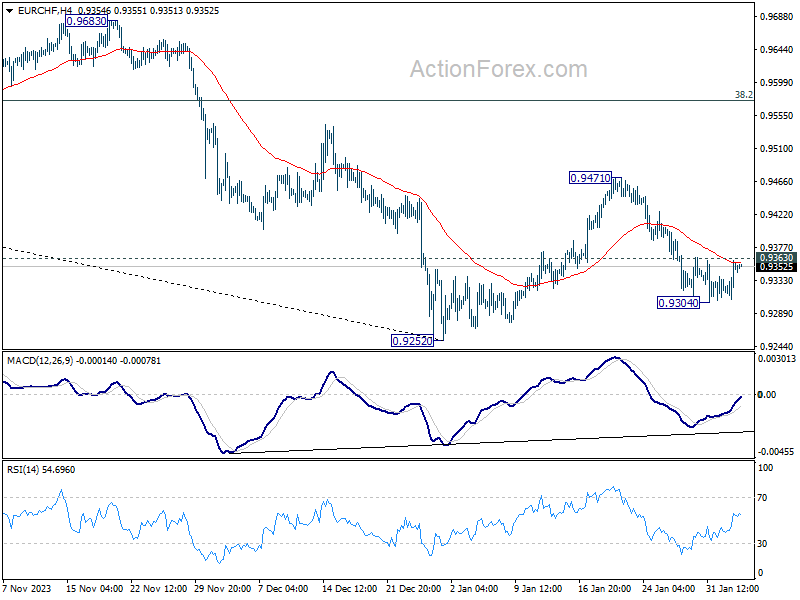
In the bigger picture, price actions from 0.9252 are tentatively seen as a correction to the five-wave down trend from 1.0095 (2023 high). Further rise would be seen to 38.2% retracement of 1.0095 to 0.9252 at 0.9574. But overall medium term outlook will remain bearish as long as 0.9683 resistance holds.
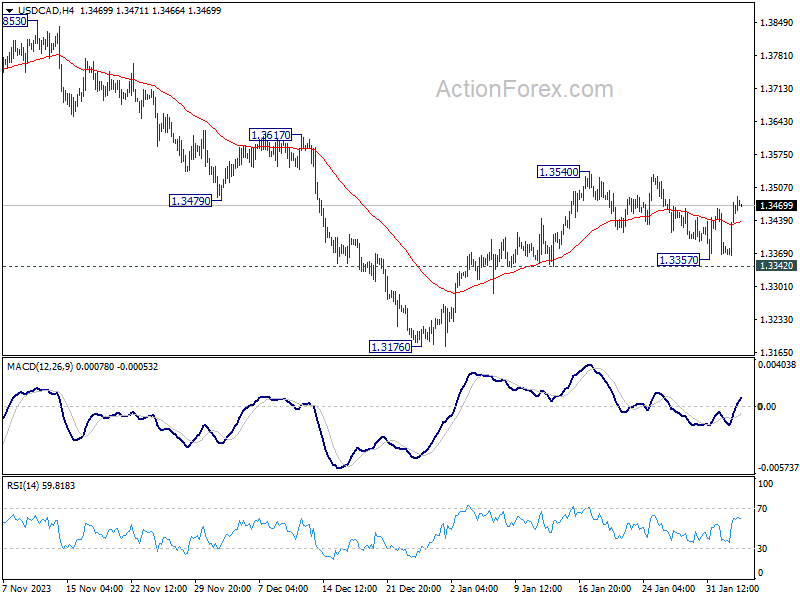
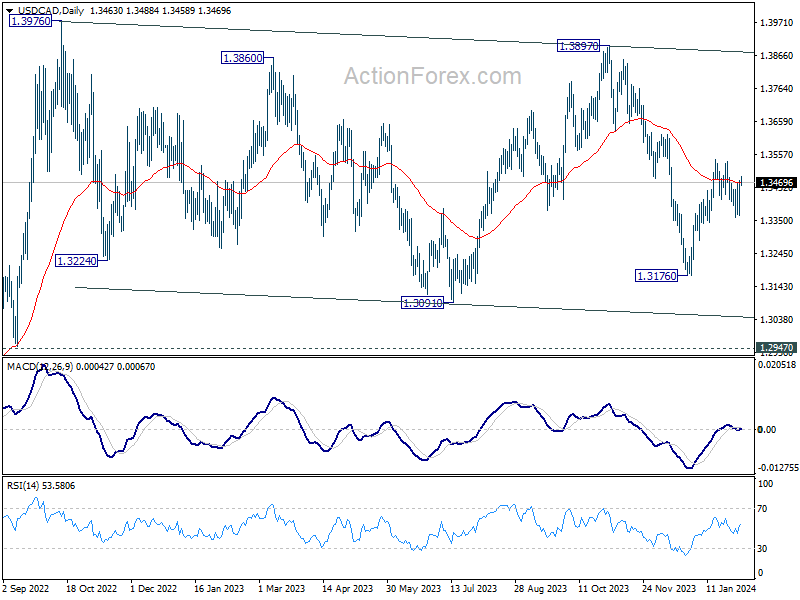
USD/CAD Daily Outlook
Daily Pivots: (S1) 1.3397; (P) 1.3436; (R1) 1.3507; More...
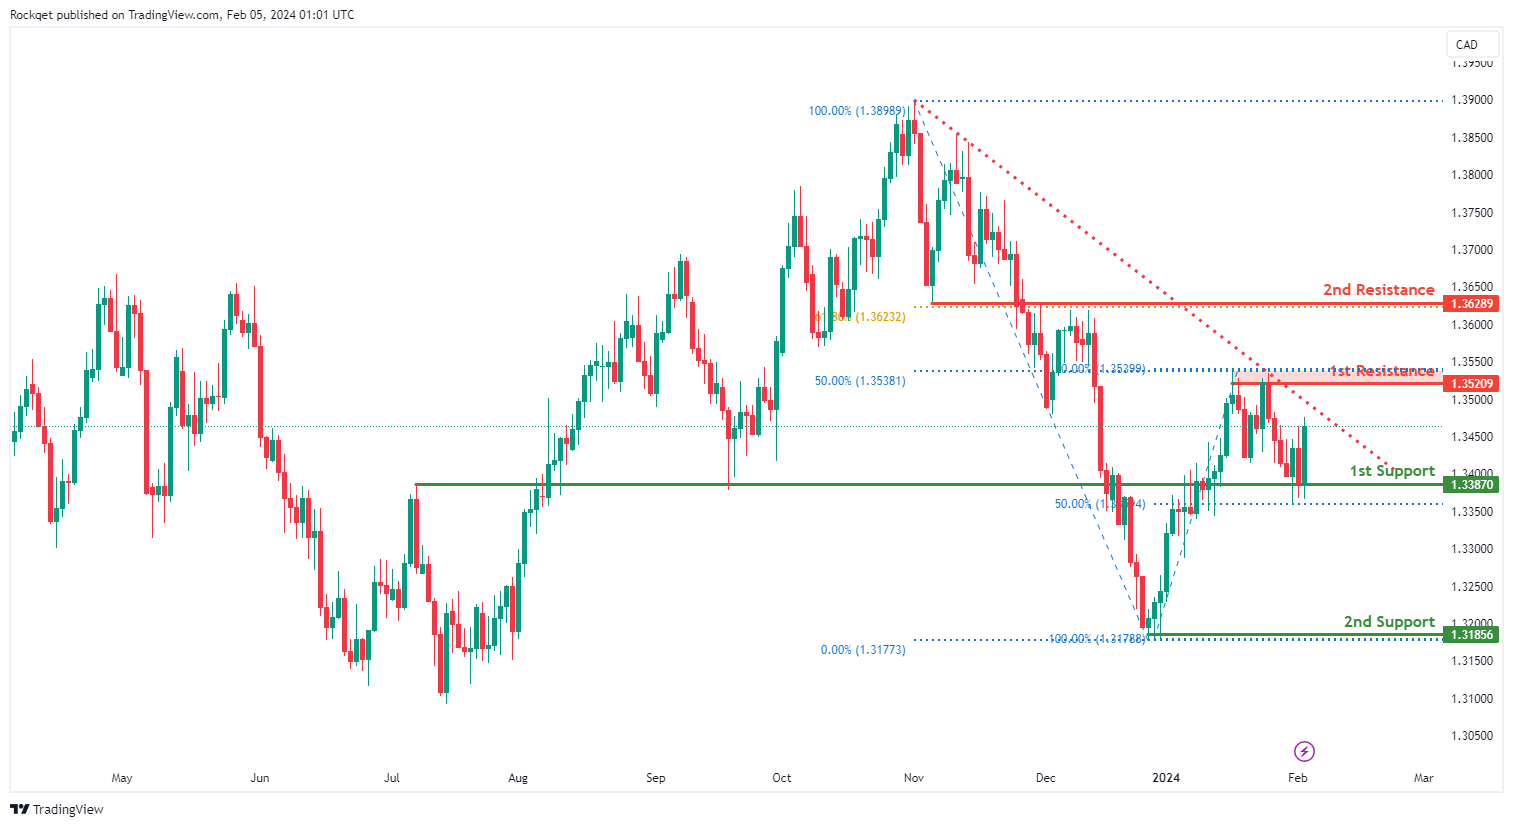
Intraday bias in USD/CAD remains neutral at this point. On the upside, break of 1.3540 will resume the rise from 1.3176. That will also revive that case that whole fall from 1.3897 has completed. Nevertheless, firm break of 1.3342 support will argue that rebound from 1.3176 has completed at 1.3540, and target this low for resuming whole fall from 1.3897.
In the bigger picture, price actions from 1.3976 (2022 high) are viewed as a corrective pattern only. In case of another fall, strong support should emerge above 1.2947 resistance turned support to bring rebound. Overall, larger up trend from 1.2005 (2021 low) is still expected to resume through 1.3976 at a later stage.
AUD/USD Daily Report
Daily Pivots: (S1) 0.6473; (P) 0.6541; (R1) 0.6581; More...
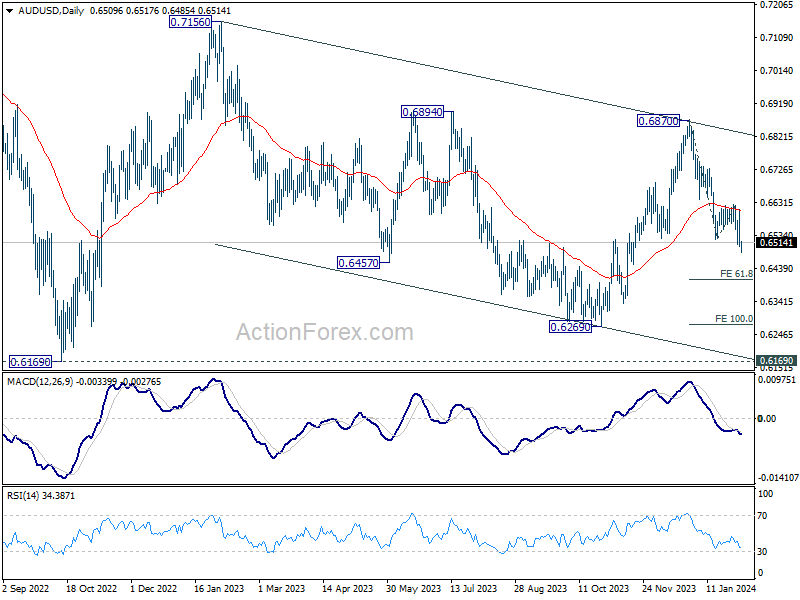
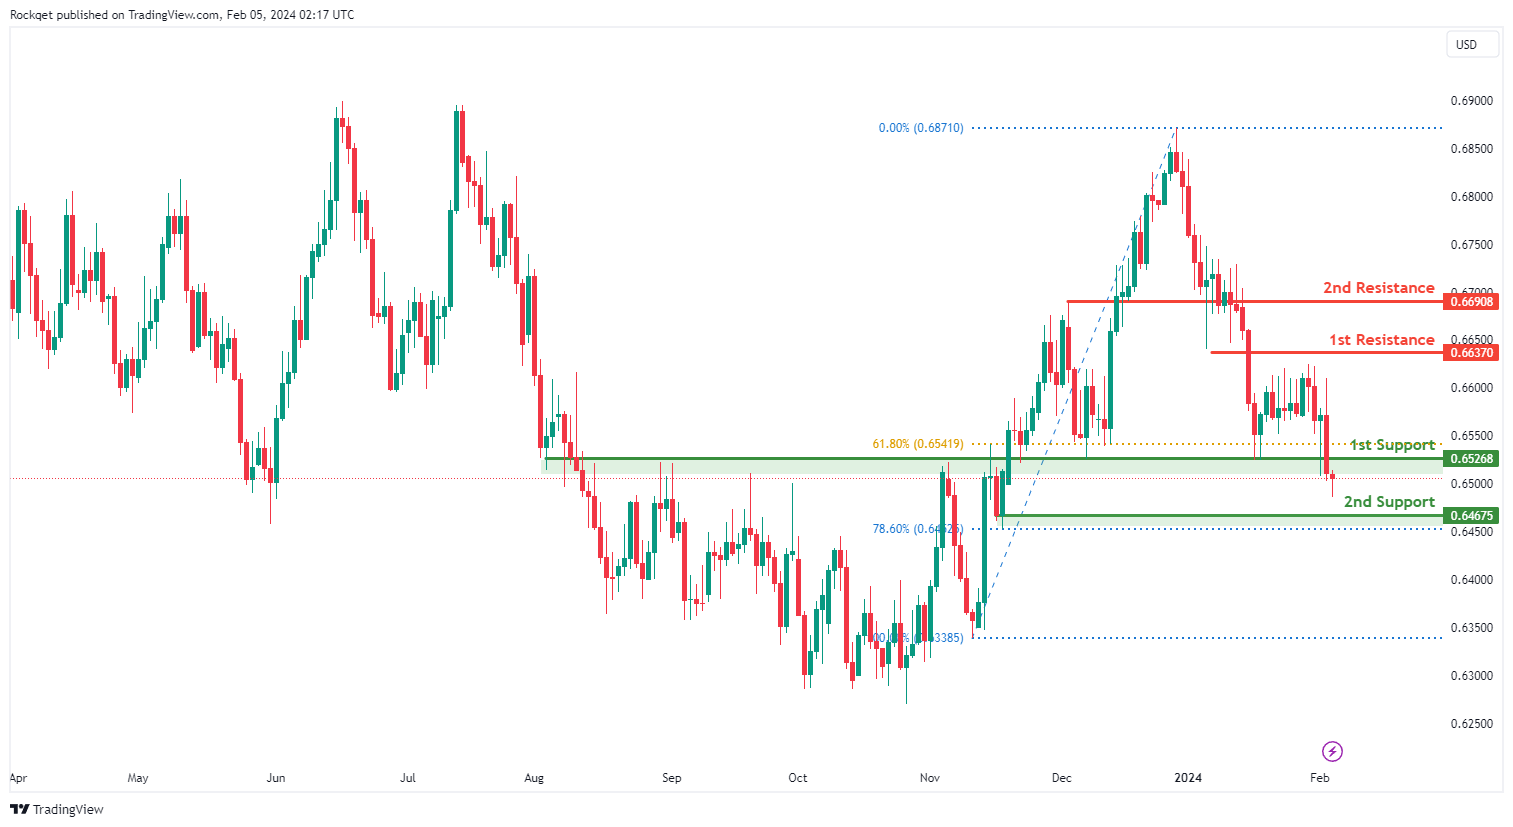
Intraday bias in AUD/USD stays on the downside for the moment. Fall from 0.6870 is in progress for 61.8% projection of 0.6870 to 0.6524 from 0.6621 at 0.6407. On the upside, break of 0.6621 resistance is needed to signal short term bottoming. Otherwise, outlook will stay bearish in case of recovery.
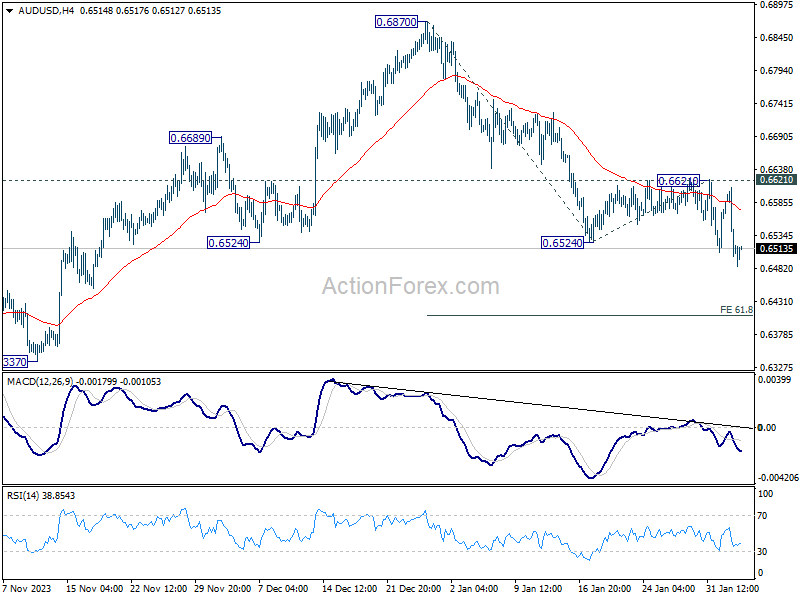
In the bigger picture, price actions from 0.6169 (2022 low) are seen as a medium term corrective pattern to the down trend from 0.8006 (2021 high). Fall from 0.7156 (2023 high) is seen as the second leg, which might still be in progress. Overall, sideway trading could continue in range of 0.6169/7156 for some more time. But as long as 0.7156 holds, an eventual downside breakout would be mildly in favor.
USD/JPY Daily Outlook
Daily Pivots: (S1) 145.85; (P) 146.48; (R1) 147.07; More...
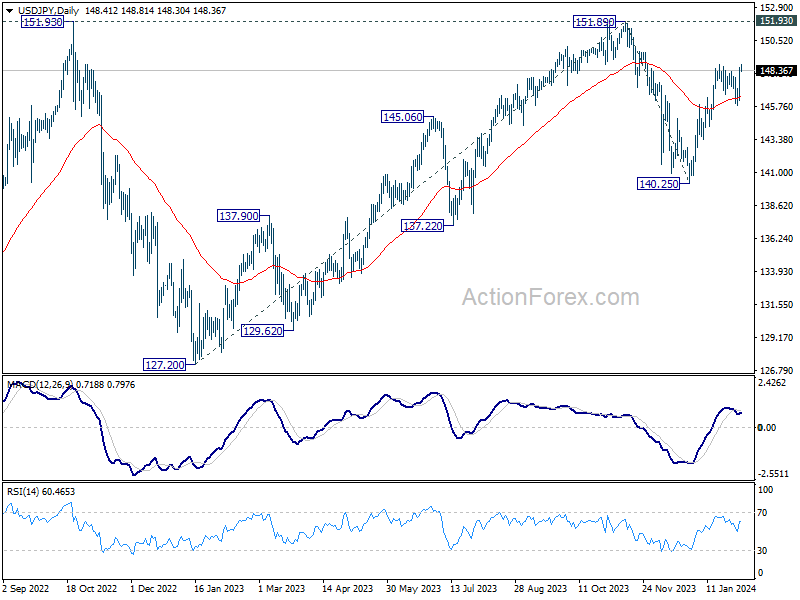
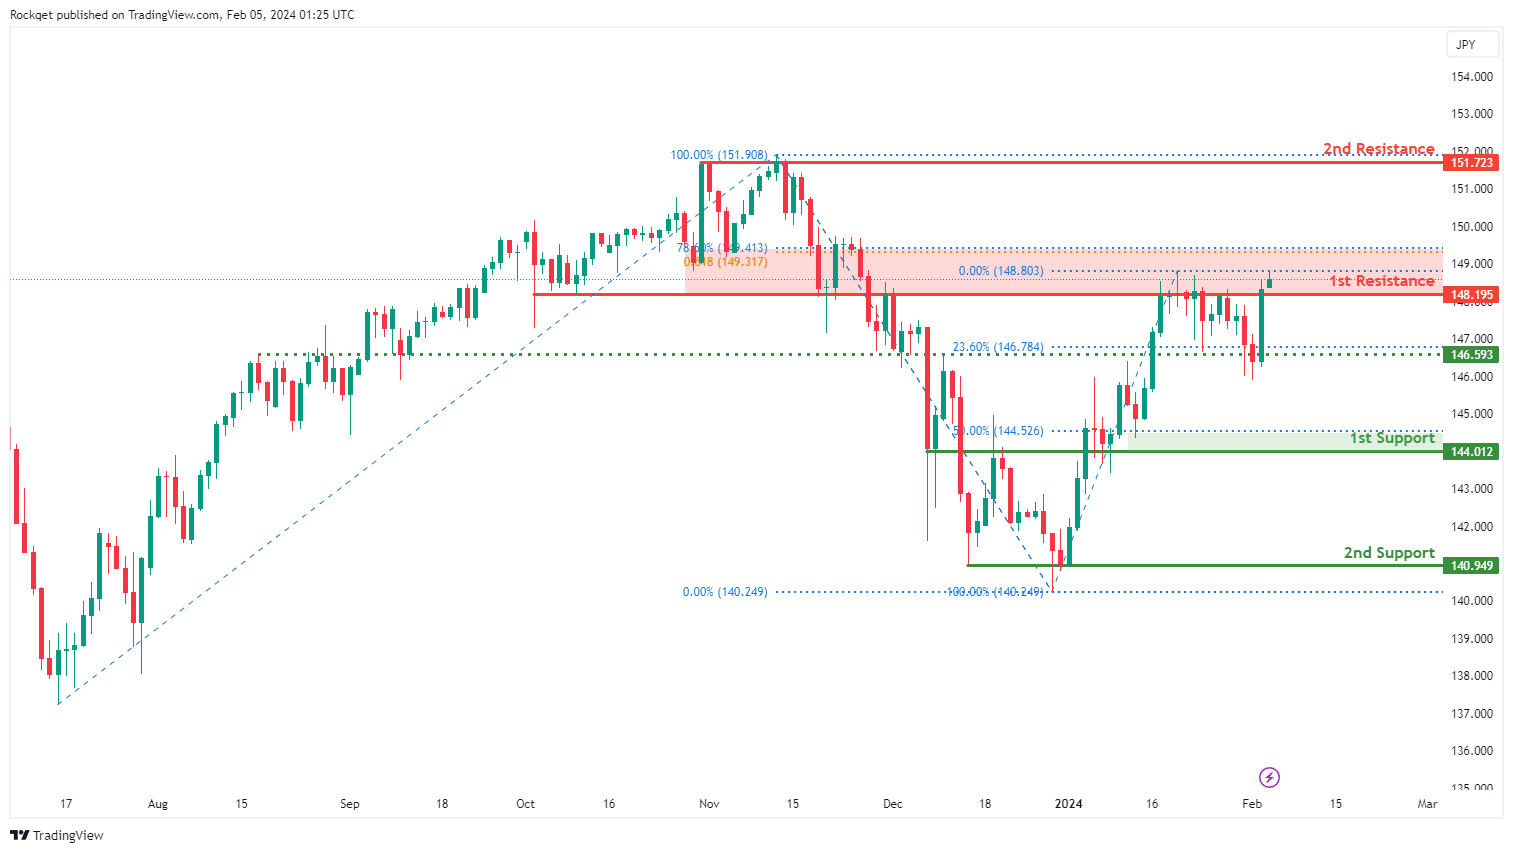
Focus stays on 148.79 resistance in USD/JPY. Firm break there will resume the rally from 140.25 to 151.89/93 key resistance zone. For now, further rise will remain in favor as long as 145.88 holds, in case of retreat.
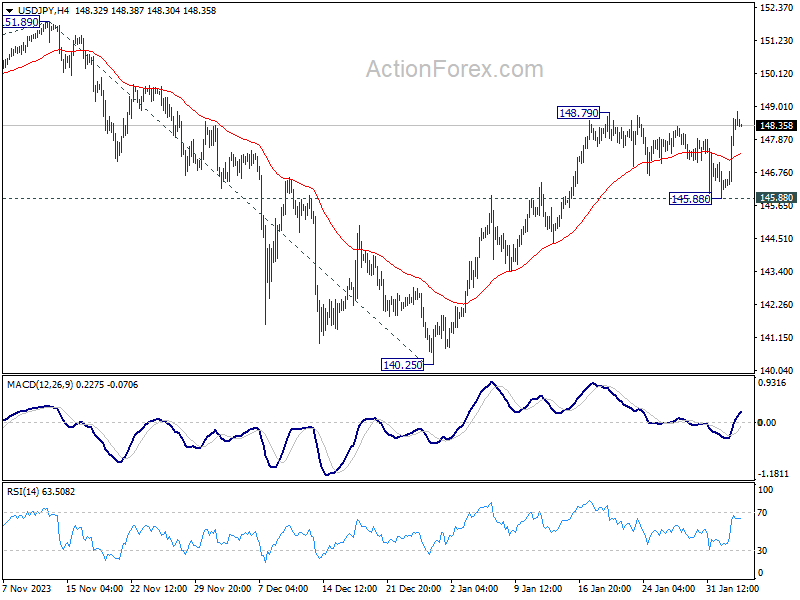
In the bigger picture, fall from 151.89 is seen as a correction to the rally from 127.20, which might have completed at 140.25 already. Firm break of 151.89/93 resistance zone will confirm up trend resumption next target will be 61.8% projection of 127.20 to 151.89 from 140.25 at 155.50. This will now remain the favored case as long as 140.25 support holds.
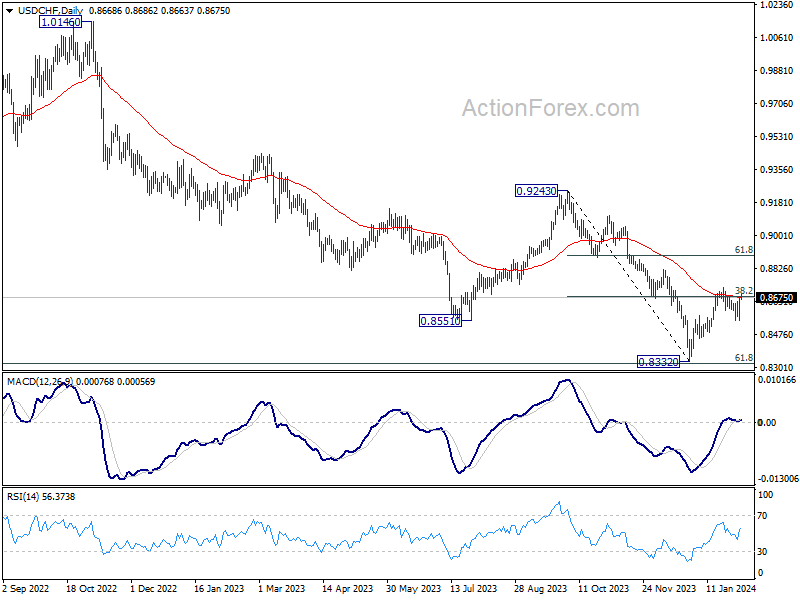
USD/CHF Daily Outlook
Daily Pivots: (S1) 0.8588; (P) 0.8634; (R1) 0.8716; More....
Intraday bias in USD/CHF remains neutral for the moment. On the upside, above 0.8727 will resume the rebound from 0.8332, and target 61.8% retracement of 0.9243 to 0.8332 at 0.8995. On the downside, below 0.8550 will resume the fall from 0.8727 for 0.8487 support.
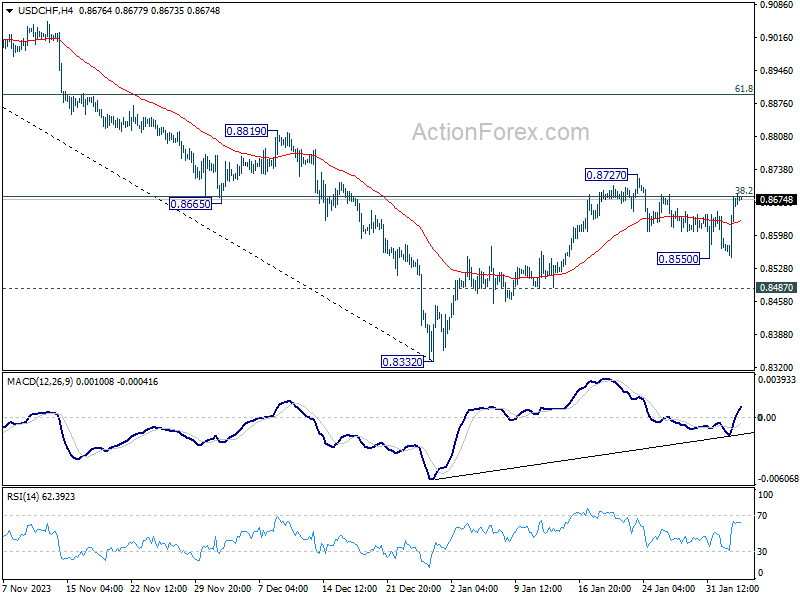
In the bigger picture, there is prospect of medium term bottoming at 0.8332 considering possible bullish convergence condition in W MACD, and the support from 0.8317 long term fibonacci support. Sustained trading above 55 D EMA (now at 0.8672) will affirm this case, and bring stronger rise back towards 0.9243 resistance, even as a corrective move.
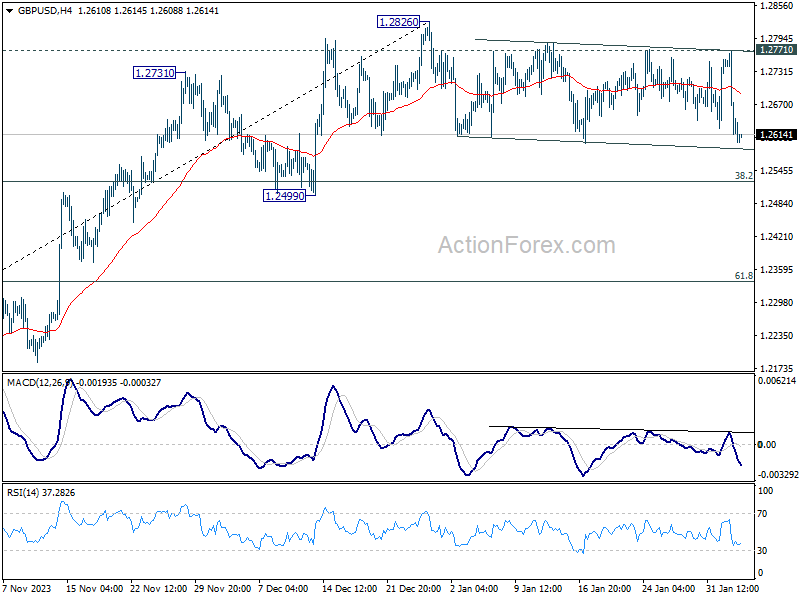
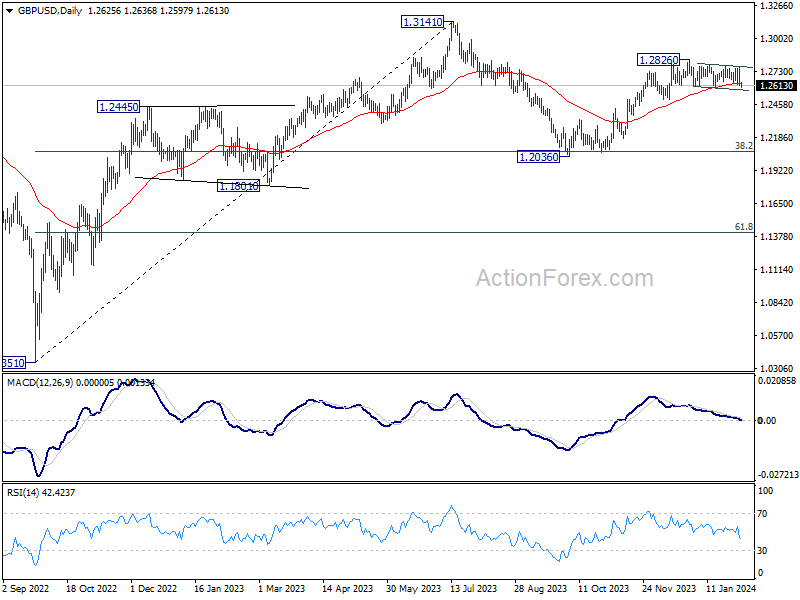
GBP/USD Daily Outlook
Daily Pivots: (S1) 1.2574; (P) 1.2673; (R1) 1.2732; More...
Intraday bias in GBP/USD remains neutral at this point and outlook is unchanged. Price action from 1.2826 are seen as a consolidation pattern. In case of another fall, downside should be contained above 1.2499 support to bring rebound. On the upside, firm break of 1.2774 resistance will suggest that consolidation pattern has completed. Further rise should be seen through 1.2826 to resume the rally from 1.2036. Next target will be 1.3141 high.
In the bigger picture, price actions from 1.3141 medium term top are seen as a corrective pattern to up trend from 1.0351 (2022 low). Rise from 1.2036 is seen as the second leg that's still in progress. Upside should be limited by 1.3141 to bring the third leg of the pattern. Meanwhile, break of 1.2499 support will argue that the third leg has already started for 38.2% retracement of 1.0351 (2022 low) to 1.3141 at 1.2075 again.
EUR/USD Daily Outlook
Daily Pivots: (S1) 1.0747; (P) 1.0822; (R1) 1.0864; More...
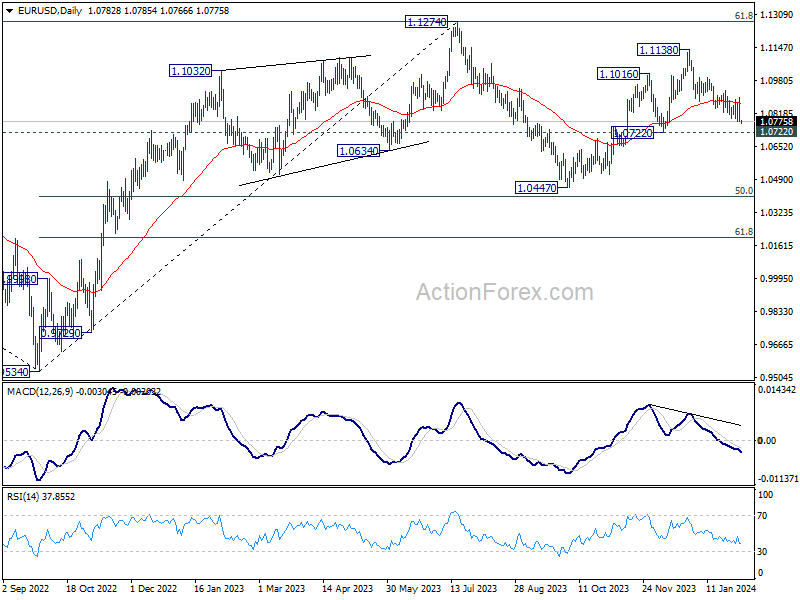
EUR/USD's break of 1.0779 support suggests that fall from 1.1138 is resuming. Intraday bias is back on the downside for 1.0722 support. considering bullish convergence condition in 4H MACD, strong support could be seen there to bring rebound. But break of 1.0896 resistance is needed to signal short term bottoming first. Meanwhile, decisive break of 1.0722 will argue that whole rise from 1.0447 has completed, and target this low.
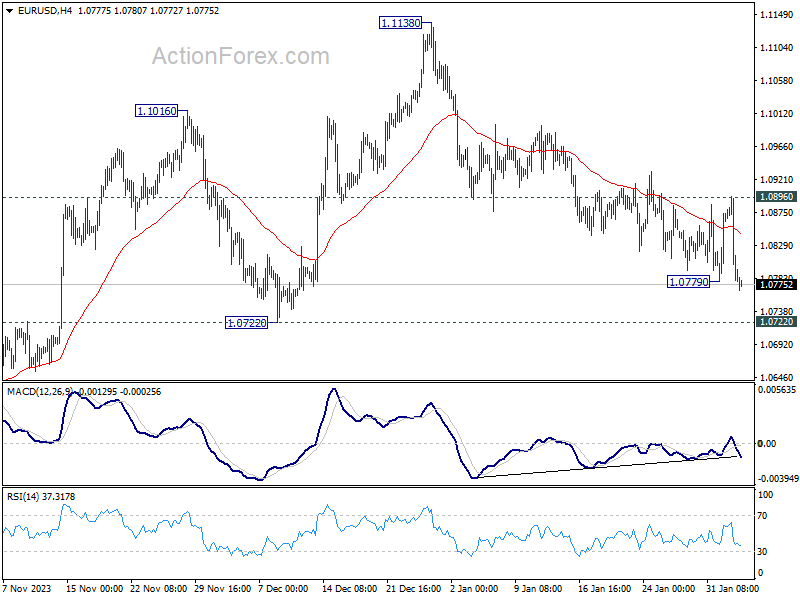
In the bigger picture, price actions from 1.1274 are viewed as a corrective pattern to rise from 0.9534 (2022 low). Rise from 1.0447 is seen as the second leg. While further rally could cannot be ruled out, upside should be limited by 1.1274 to bring the third leg of the pattern. Meanwhile, sustained break of 1.0722 support will argue that the third leg has already started for 1.0447 and possibly below.
Continued Ascendancy of Dollar Awaits Validation from ISM Services Data
Dollar strengthens broadly in Asian session today, extending last week's late rebound. This uptick comes in the wake of Fed Chair Jerome Powell's interview on 60 Minutes, where he reiterated the premature nature of interest rate cuts in March. He also highlighted the underlying economic resilience that affords Fed the luxury of patience. Powell's stance has been interpreted as a positive signal for dollar, while reinforcing investor confidence towards US markets. However, the durability of this optimism remains contingent on the forthcoming ISM Services data, which is keenly anticipated.
The situation in Asia, particularly in China, presents a contrasting picture. The continuing decline in Chinese stock markets underscores investor wariness, despite the Securities Regulatory Commission's recent assurances to stabilize market fluctuations. Announced measures include directing more medium- and long-term funds into the market and a stringent crackdown on illegal trading practices, such as malicious short selling and insider trading. However, these promises have yet to fully assuage trader concerns, reflecting a persistent skepticism towards the government's staggered approach to economic stimulus and market regulation.
Back to the currency markets, European majors, at the time of analysis, are showing clear underperformance, particularly the British Pound, which is leading the downturn among its peers. On the other hand, commodity-linked currencies are maintaining some stability, albeit on the brink of volatility driven by critical economic events on the horizon, including RBA's rate decision and employment data from New Zealand and Canada.
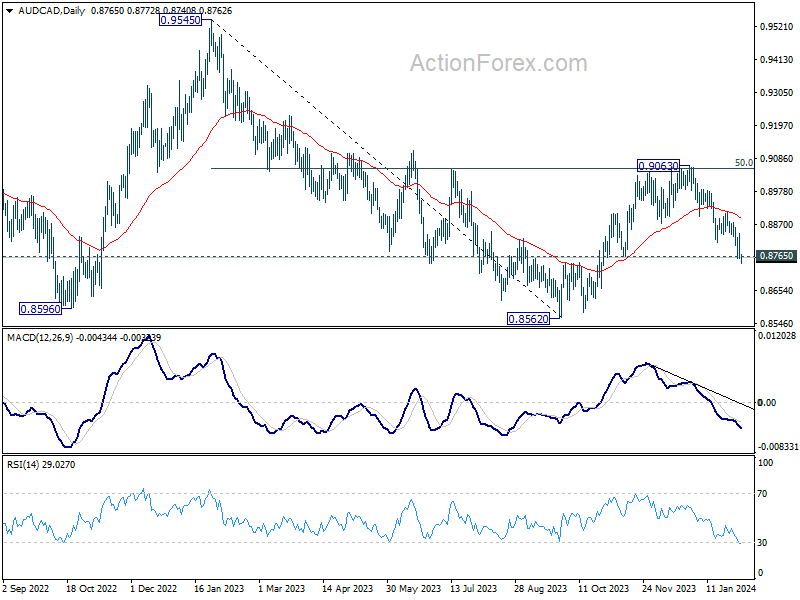
Technically, AUD/CAD is trying get rid of 0.8765 structural support today, but lacks clear follow through momentum yet. But in any case, outlook will stay bearish as long as 55 D EMA (now at 0.8890) holds. Corrective rebound from 0.8562 should have completed at 0.9063 already. Sustained trading below 0.8765 will pave the way to retest 0.8562 low.
In Asia, at the time of writing, Nikkei is up 0.64%. Hong Kong HSI is up 0.82%. China Shanghai SSE is down -0.74%. Singapore Strait Times is down -1.54%. Japan 10-year JGB yield is up 0.0599 at 0.721.
Fed Powell repeats March too soon for interest rate cut
In an interview on CBS's 60 Minutes, Fed Chair Jerome Powell emphasized the importance of ensuring inflation is convincingly on a downward trajectory toward 2% target before the central bank cut interest rates. He candidly stated, "it's not likely that this committee will reach that level of confidence in time for the March meeting," echoing the comments he made last week at the post-FOMC press conference.
Highlighting the collective outlook of FOMC, Powell shared that the majority of its 19 participants anticipate a scenario where cutting federal funds rate would be appropriate within the year. However, he stressed that any such decision would "depend on the evolution of the economy."
Powell also underscored a forward-looking perspective, stating, "we wouldn't wait to get to 2% to cut rates," and acknowledging that rate cuts are "actively being considered" despite current inflation rates hovering between 2-
Expectations for inflation's trajectory were also addressed, with Powell predicting a decrease in the 12-month inflation figures throughout the year. He attributed this anticipated decline to the "unwinding" of "pandemic-related distortions" and the consequential impact of the Fed's "tightening of policy."
Japan's PMI services finalized at 53.1, fueling overall economic growth
Japan's PMI Services was finalized at 53.1 in January, marking a continuous expansion for the 17th month and an improvement from December's 51.5. PMI Composite was finalized at 51.5, up from prior month's 50.0, indicating a modest uptick in overall private sector activity for the first time since October.
According to Usamah Bhatti, Economist at S&P Global Market Intelligence, key observations include accelerated growth in business activity, new orders, and the first rise in exports in five months.
Capacity pressures intensified, with the strongest backlog increase since last June and a sharper job creation rate. Business confidence for the year ahead hit an eight-month high, reflecting robust optimism.
China's PMI services dips slightly to 52.7, significant challenges remain
In January, China's Caixin PMI Services slightly decreased to 52.7 from 52.9, aligning with expectations. PMI Composite also and a minor reduction to 52.5 from 52.6.
Wang Zhe, Senior Economist at Caixin Insight Group, pointed out that the economy faces "significant challenges" including tepid demand, increased employment pressures, and subdued market expectations, indicating that "This status quo has yet to experience a fundamental reversal."
Starting with US ISM services, followed by RBA and employment data from New Zealand and Canada
US ISM Services Index is poised to kick off the week with significant impact. The prevailing market sentiment is marked by robust confidence in the US economy's resilience, which seems to overshadow concerns about Fed's potential delay in commencing interest rate reductions. The forthcoming ISM services data, encompassing key details such as pricing, new orders, and employment, will be a crucial test to this narrative.
RBA's rate decision also occupies a central position in economic discussions. It is widely anticipated that the central bank will maintain cash rate unchanged at 4.35%. More critically, given the satisfactory progress in disinflation observed in Q4 CPI, tightening bias could be dropped, with indication that further further rate hikes in the current cycle are becoming increasingly unlikely.
Opinions on the timing of RBA's interest rate cuts are divided. Westpac and Commonwealth Bank project the initial reduction to occur in September, while NAB anticipates it in December. The debate also encompasses the magnitude and pace of subsequent policy easing, with projections ranging significantly—from Commonwealth Bank's prediction of a decrease to 2.85% by June 2025 to the more conservative estimates by Westpac and NAB of a reduction to 3.10% by September and December 2025, respectively.
In line with new operational changes, RBA will issue the Statement on Monetary Policy alongside the rate decision. This will be followed by a press conference an hour later, providing Governor Michele Bullock with an excellent opportunity to synchronize market expectations with her narratives and the latest economic projections.
BoC Summary of Deliberations and employment data from Canada are also expected to draw significant interest. With BoC maintaining its concern over persistent inflationary pressures, especially in housing costs, policy easing appears to be off the table for now. The forthcoming minutes are anticipated to reveal the extent of the bank's concerns about the persistence of underlying inflation. Meanwhile, signs of ongoing tightness in the job market and strong wage growth could delay BoC's first rate cut to the latter half of the year, contrary to market expectations of a second-quarter adjustment.
Employment data from New Zealand are awaited with considerable interest as well. Paul Conway, RBNZ's Chief Economist, has recently underscored the central bank's increased focus on non-tradable inflation, which remains high at 5.9%, and the slow pace of its reduction. Without marked increase in unemployment and corresponding decrease in wages growth, there is little room for RBNZ to maneuver in terms of reducing interest rates within the year.
Additional data points of interest include Eurozone Sentix Investor Confidence, wage growth in Japan, and China's Caixin PMI services and CPI.
Here are some highlights for the week:
- Monday: Australia goods trade balance; China Caixin PMI services; Germany trade balance; Eurozone PMI services final, Sentix investor confidence, PPI; UK PMI services; US ISM services.
- Tuesday: Japan average cash earnings, household spending; RBA rate decision; Germany factory orders;l UK construction PMI; Eurozone retail sales; Canada Ivey PMI.
- Wednesday; New Zealand employment, labor cost index; Swiss unemployment rate, foreign currency reserves; Germany industrial production; France trade balance; Canada trade balance, BoC summary of deliberations; US trade balance.
- Thursday: Japan bank lending, current account; China CPI, PPI; ECB monthly bulletin; US jobless claims.
- Friday: Germany CPI final; Canada employment.
EUR/USD Daily Outlook
Daily Pivots: (S1) 1.0747; (P) 1.0822; (R1) 1.0864; More...
EUR/USD's break of 1.0779 support suggests that fall from 1.1138 is resuming. Intraday bias is back on the downside for 1.0722 support. considering bullish convergence condition in 4H MACD, strong support could be seen there to bring rebound. But break of 1.0896 resistance is needed to signal short term bottoming first. Meanwhile, decisive break of 1.0722 will argue that whole rise from 1.0447 has completed, and target this low.
In the bigger picture, price actions from 1.1274 are viewed as a corrective pattern to rise from 0.9534 (2022 low). Rise from 1.0447 is seen as the second leg. While further rally could cannot be ruled out, upside should be limited by 1.1274 to bring the third leg of the pattern. Meanwhile, sustained break of 1.0722 support will argue that the third leg has already started for 1.0447 and possibly below.
Economic Indicators Update
| GMT | Ccy | Events | Actual | Forecast | Previous | Revised |
|---|---|---|---|---|---|---|
| 00:00 | AUD | TD Securities Inflation M/M Jan | 0.30% | 1.00% | ||
| 00:30 | AUD | Goods Trade Balance (AUD) Jan | 10.96B | 10.50B | 11.44B | |
| 01:45 | CNY | Caixin Services PMI Jan | 52.7 | 52.7 | 52.9 | |
| 07:00 | EUR | Germany Trade Balance (EUR) Dec | 22.3B | 20.4B | ||
| 08:45 | EUR | Italy Services PMI Jan | 50.8 | 49.8 | ||
| 08:50 | EUR | France Services PMI Jan F | 45 | 45 | ||
| 08:55 | EUR | Germany Services PMI Jan F | 47.6 | 47.6 | ||
| 09:00 | EUR | Eurozone Services PMI Jan F | 48.4 | 48.4 | ||
| 09:30 | EUR | Eurozone Sentix Investor Confidence Feb | -15 | -15.8 | ||
| 09:30 | GBP | Services PMI JanF | 53.8 | 53.8 | ||
| 10:00 | EUR | Eurozone PPI M/M Dec | -0.20% | -0.30% | ||
| 10:00 | EUR | Eurozone PPI Y/Y Dec | -8.80% | |||
| 14:45 | USD | Services PMI Jan F | 52.9 | 52.9 | ||
| 15:00 | USD | ISM Services PMI Jan | 52.1 | 50.6 |
Technical Outlook and Review
DXY:
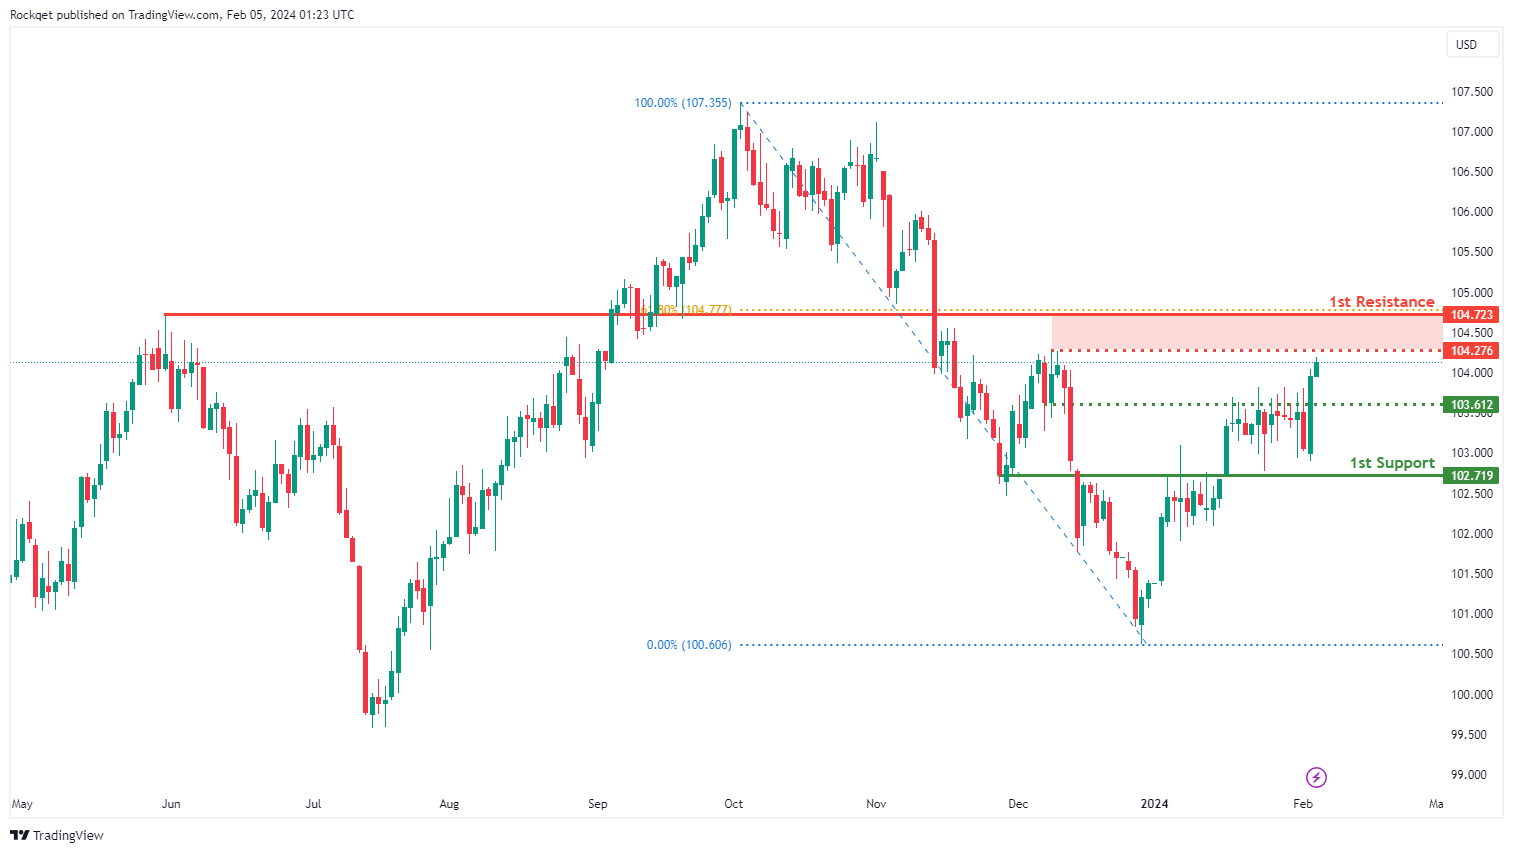
The DXY chart currently exhibits a bearish overall momentum, indicating a downward trend. According to the analysis, the price could potentially rise towards the 1st resistance in the short term before reversing off it and dropping towards the 1st support.
The 1st support level at 102.71 is identified as an overlap support, suggesting that it has historical significance and could potentially act as a strong support level where selling pressure may subside.
There is also an intermediate support level at 103.61, described as a pullback support, which further emphasizes its importance as a potential support zone.
On the resistance side, the 1st resistance level at 104.72 is categorized as a pullback resistance, and it is reinforced by the presence of the 61.80% Fibonacci Retracement. This level may pose a temporary obstacle to the bearish momentum.
There is also an intermediate resistance level at 104.61, identified as a swing high resistance, suggesting that it represents a historical point where the price has encountered resistance.
EUR/USD:
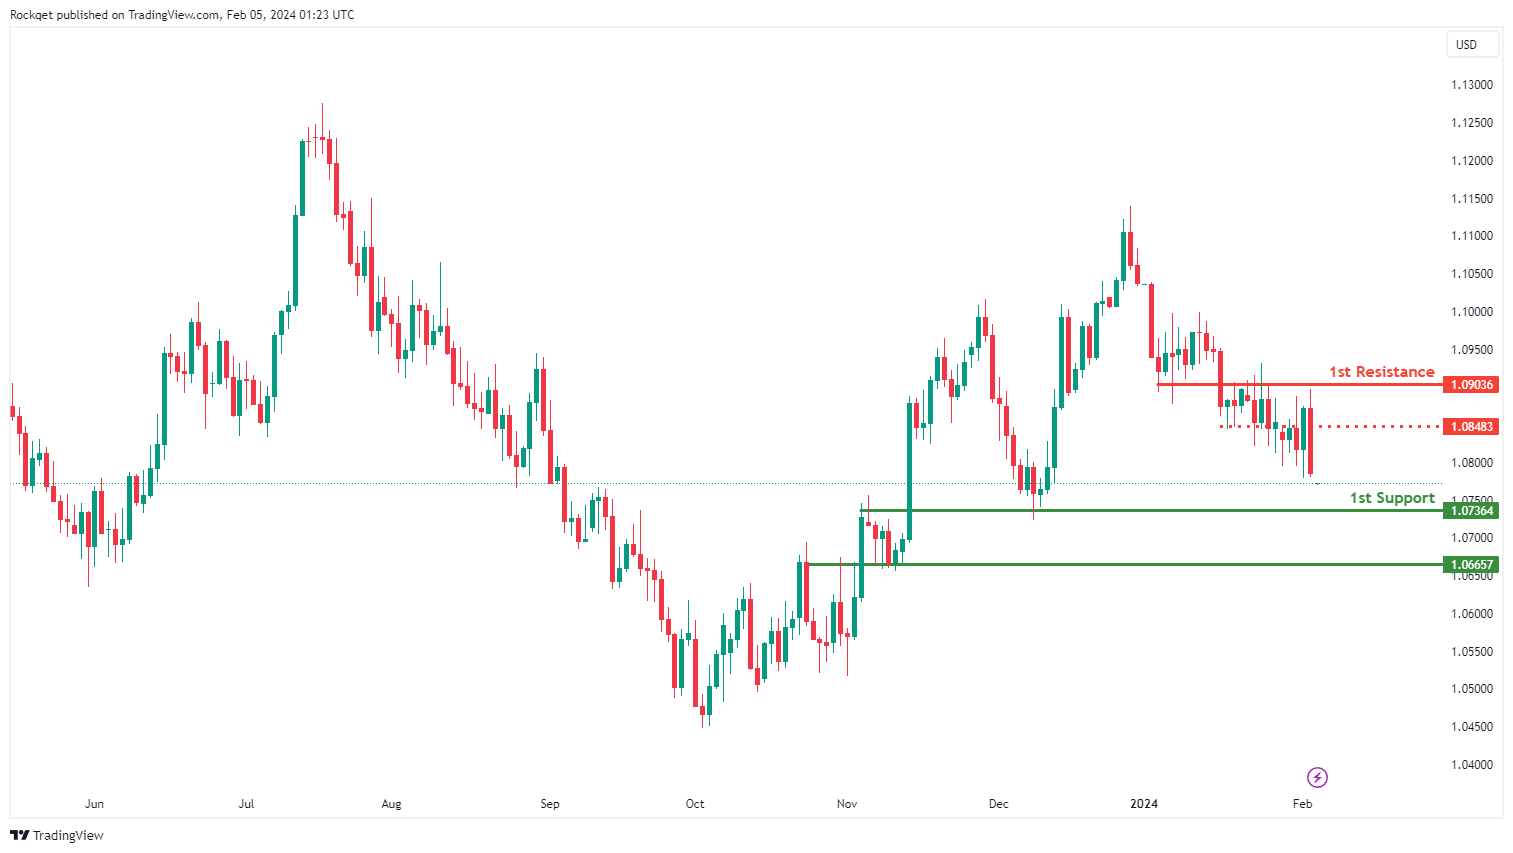
The EUR/USD chart currently exhibits a bullish overall momentum, indicating an upward trend. According to the analysis, the price could potentially make a bullish bounce off the 1st support level and head towards the 1st resistance.
The 1st support level at 1.0736 is identified as an overlap support, suggesting that it has historical significance and could potentially act as a strong support level where buying interest may emerge.
There is also a 2nd support level at 1.0665, described as an overlap support, which further emphasizes its importance as a potential support zone.
On the resistance side, the 1st resistance level at 1.0903 is categorized as an overlap resistance, indicating that it represents a historical point where the price has encountered resistance in the past.
There is also an intermediate resistance level at 1.0848, identified as a pullback resistance, suggesting that it may pose a temporary obstacle to the bullish momentum.
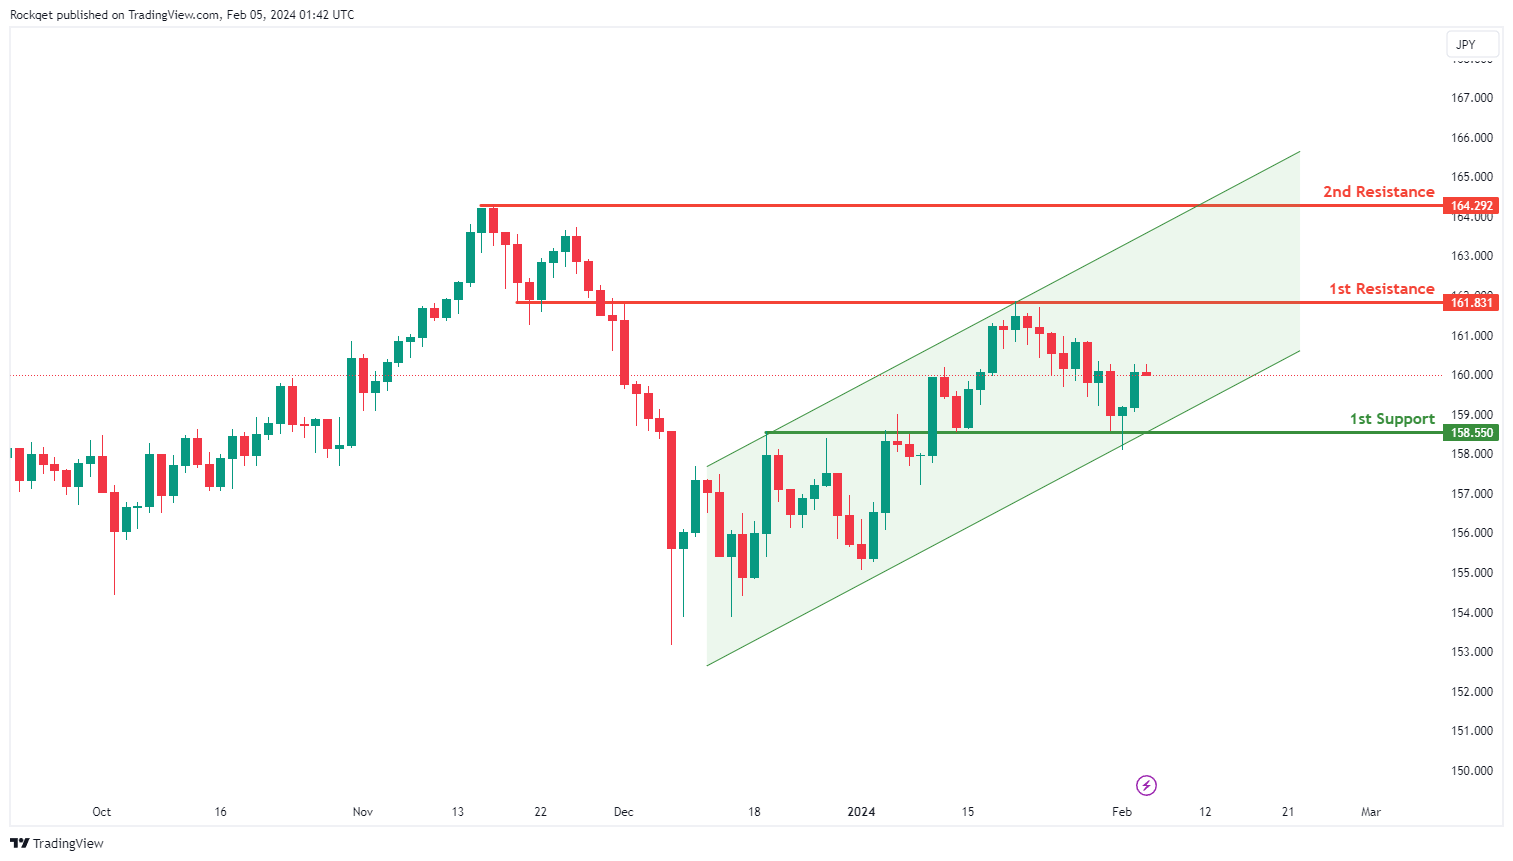
EUR/JPY:
The EUR/JPY chart currently exhibits a bullish overall momentum, signaling a predominant upward trend in the market. Several factors contribute to this positive sentiment, reinforcing the potential for sustained upward movement in the price.
The 1st support at 158.550 is considered advantageous for several reasons. Primarily, it is identified as an overlap support, aligning with a historical level where buying interest has previously materialized.
Additionally, the 2nd support, which is not specified, would benefit from additional clarification to enhance the depth of the analysis.
On the resistance side, the 1st resistance at 161.831 is highlighted for its alignment with an overlap resistance, indicating a historical area where selling pressure has been evident.
The 2nd resistance at 164.292 is also noted, coinciding with swing high resistance, contributing to its significance as a potential barrier to bullish momentum.
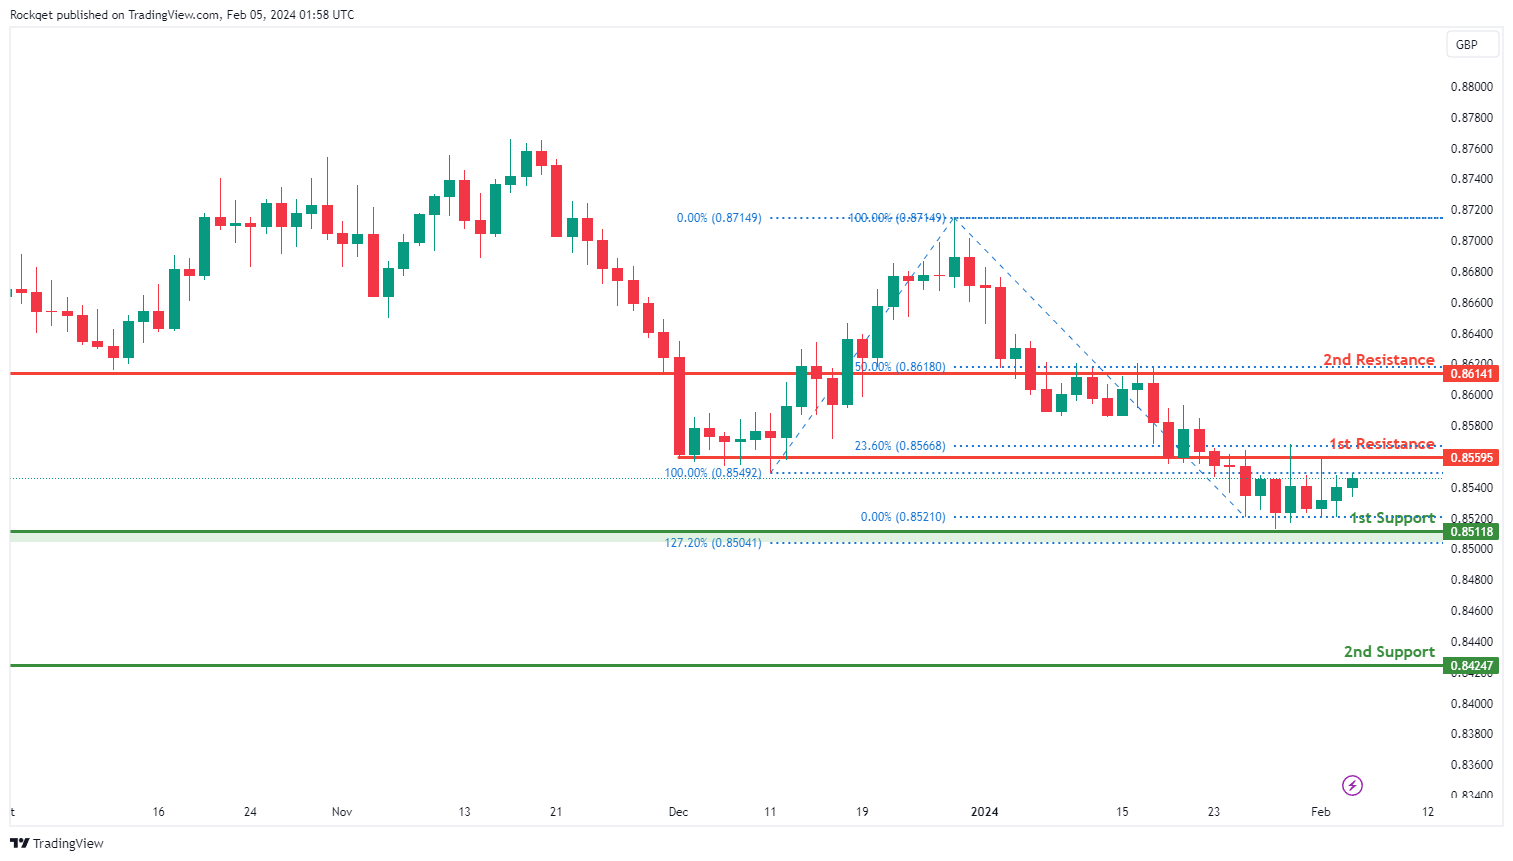
EUR/GBP:
The EUR/GBP chart currently indicates a bullish overall momentum, suggesting a prevailing upward trend. Various factors contribute to this bullish sentiment, pointing towards the potential for continued upward movement in the price.
The 1st support at 0.85118 is considered advantageous for several reasons. It is identified as a swing low support and aligns with the 127.20% Fibonacci Extension, indicating a historical level where buying interest has previously emerged.
The 2nd support at 0.84247 is also recognized as a swing low support, further strengthening the potential support zone.
On the resistance side, the 1st resistance at 0.85595 is highlighted for its alignment with an overlap resistance and the 23.60% Fibonacci Retracement. This suggests a potential barrier to the bullish momentum.
The 2nd resistance at 0.86141 is also noted, coinciding with an overlap resistance and the 50% Fibonacci Retracement, adding further significance to this resistance level.
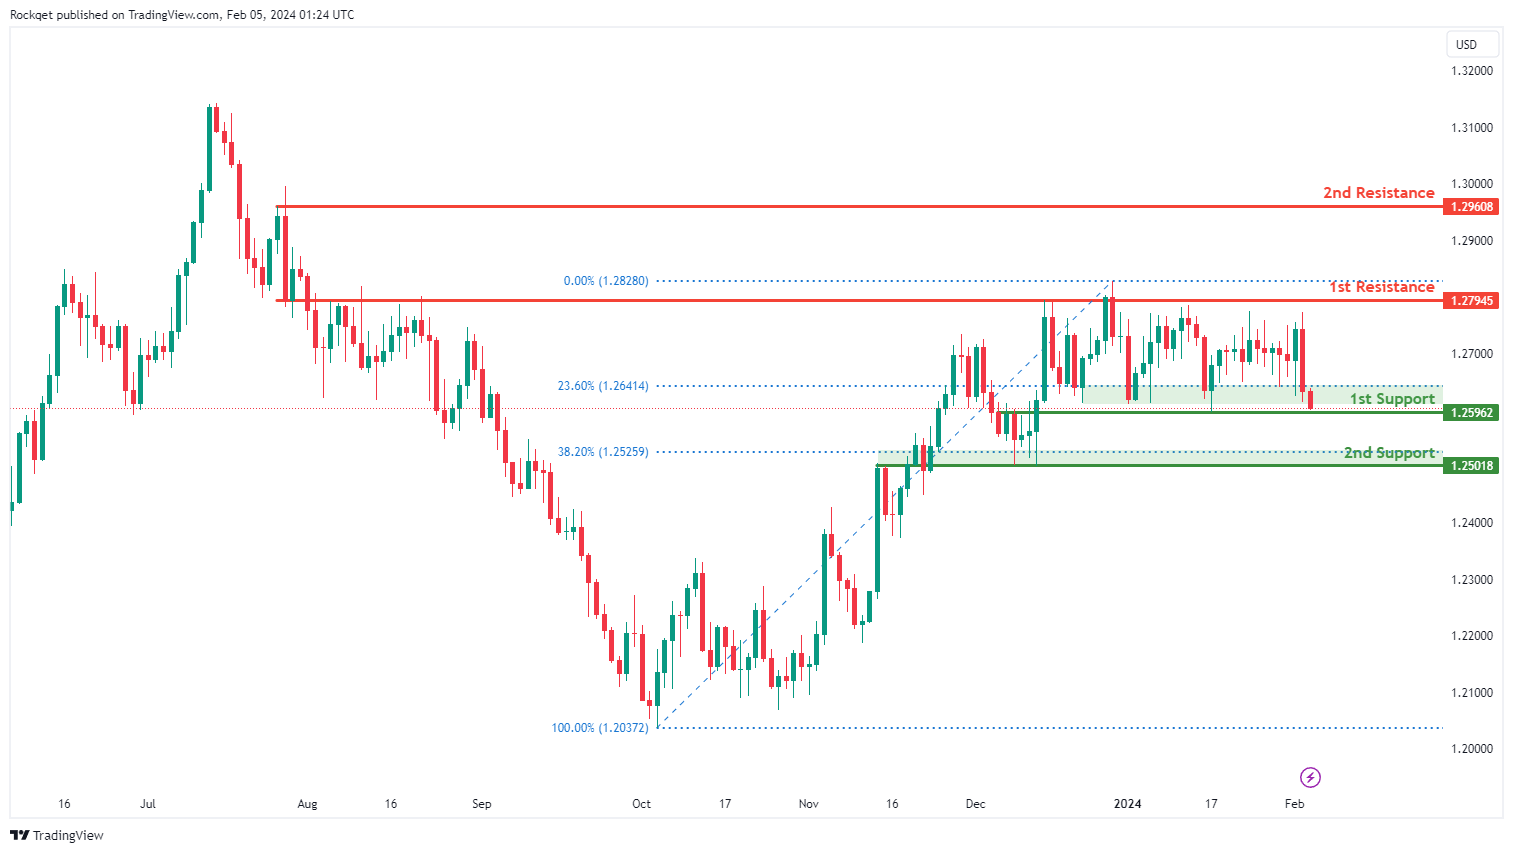
GBP/USD:
The GBP/USD chart currently exhibits a bullish overall momentum, indicating an upward trend. According to the analysis, the price could potentially experience a bullish bounce off the 1st support level and head towards the 1st resistance.
The 1st support level at 1.2596 is identified as an overlap support and is reinforced by the presence of the 23.60% Fibonacci Retracement. This suggests that it has historical significance and could potentially act as a strong support level where buying interest may emerge.
There is also a 2nd support level at 1.2501, described as an overlap support, and it is associated with the 38.20% Fibonacci Retracement, further emphasizing its importance as a potential support zone.
On the resistance side, the 1st resistance level at 1.2794 is categorized as an overlap resistance, indicating that it represents a historical point where the price has encountered resistance in the past.
There is also a 2nd resistance level at 1.2960, identified as a swing high resistance, suggesting that it is another historical level where the price has faced resistance.
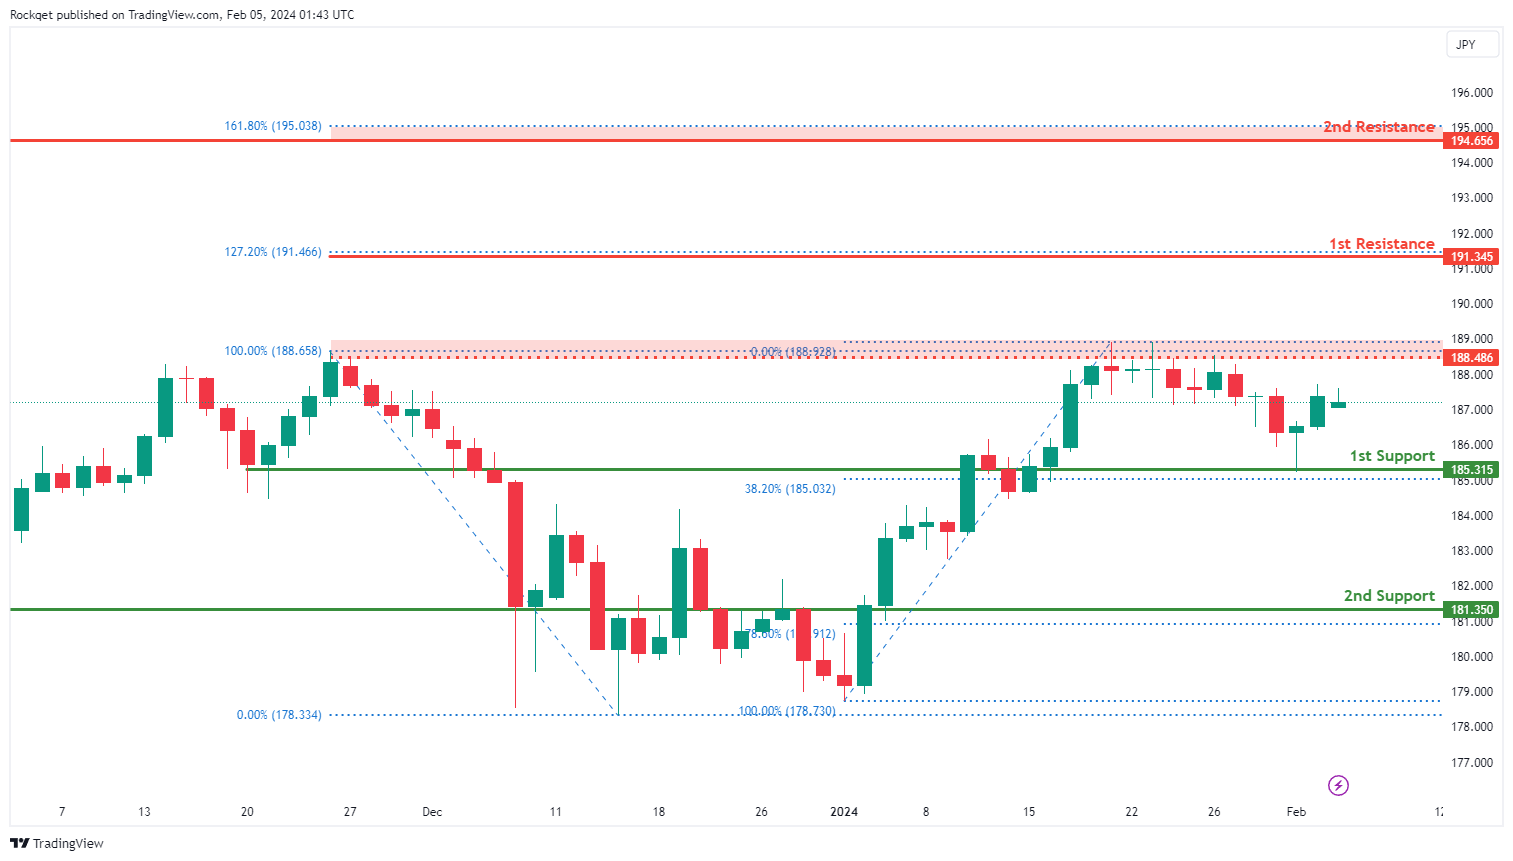
GBP/JPY:
The GBP/JPY chart currently reflects a neutral overall momentum, indicating a lack of a clear trend direction. The price could potentially exhibit a range-bound movement, fluctuating between the 1st resistance and 1st support levels.
The 1st support at 185.315 is viewed favorably for multiple reasons. It is identified as an overlap support and coincides with the 38.20% Fibonacci Retracement, suggesting a historical level where buying interest has previously been observed.
The 2nd support at 181.350 is also recognized as an overlap support and aligns with the 78.60% Fibonacci Retracement, providing additional strength to the potential support zone.
On the resistance side, the 1st resistance at 191.345 is emphasized, aligning with the 127.20% Fibonacci Extension. This level suggests a potential barrier to the price movement.
The 2nd resistance at 194.656 is also noted, coinciding with a swing high resistance and the 161.80% Fibonacci Extension, adding further significance to this resistance level.
Intermediate resistance at 188.49 is highlighted as well, indicating a potential level of pullback resistance.
USD/CHF:
The USD/CHF chart currently exhibits a bearish overall momentum, indicating a downward trend. According to the analysis, the price could potentially experience a bearish reaction off the 1st resistance level and drop to the 1st support.
The 1st support level at 0.8561 is identified as an overlap support and is reinforced by the presence of the 38.20% Fibonacci Retracement. This suggests that it has historical significance and could potentially act as a strong support level where buying interest may emerge.
There is also a 2nd support level at 0.8402, described as a multi-swing low support, further emphasizing its importance as a potential support zone.
On the resistance side, the 1st resistance level at 0.8691 is categorized as an overlap resistance, indicating that it represents a historical point where the price has encountered resistance in the past.
There is also a 2nd resistance level at 0.8895, identified as an overlap resistance with the presence of both the 61.80% Fibonacci Retracement and the 78.60% Fibonacci Projection. This confluence of Fibonacci levels suggests a stronger resistance zone.
USD/JPY:
The USD/JPY chart currently exhibits a bearish overall momentum, indicating a downward trend. According to the analysis, the price could potentially experience a bearish reaction off the 1st resistance level and drop to the 1st support.
The 1st support level at 144.01 is identified as an overlap support and is reinforced by the presence of the 50% Fibonacci Retracement. This suggests that it has historical significance and could potentially act as a strong support level where buying interest may emerge.
There is also a 2nd support level at 140.94, described as a multi-swing low support, further emphasizing its importance as a potential support zone.
On the resistance side, the 1st resistance level at 148.19 is categorized as an overlap resistance, indicating that it represents a historical point where the price has encountered resistance in the past.
There is also a 2nd resistance level at 151.72, identified as a multi-swing high resistance, suggesting that it is another historical level where the price has faced resistance.
Intermediate support at 146.59 is also noted, marked as an overlap support with the presence of the 23.60% Fibonacci Retracement.
USD/CAD:
The USD/CAD chart currently exhibits an overall bullish momentum. In this context, there is a potential scenario for price to make a bullish continuation towards the 1st resistance should it break above the descending trendline.
The 1st resistance level at 1.3520 is identified as a pullback resistance that aligns close to the 50.00% Fibonacci retracement level. Higher up, the 2nd resistance level at 1.3628 is noted as an overlap resistance that aligns with the 61.80% Fibonacci retracement level, further highlighting its importance as a potential resistance point.
To the downside, the 1st support level at 1.3387 is identified as an overlap support that aligns close to the 50.00% Fibonacci Retracement level. Further below, the 2nd support level at 1.3185 is marked as a swing-low support, further emphasizing its importance as a potential support zone.
AUD/USD:
The AUD/USD chart currently exhibits an overall bearish momentum. In this context, there is a potential scenario for price to fall towards the 1st support and make a small bullish bounce before resuming the downturn.
The 1st support level at 0.6526 is identified as an overlap support that aligns close to the 61.80% Fibonacci retracement level. Further below, the 2nd support level at 0.6467 is also noted as a pullback support that aligns close to the 78.60% Fibonacci Retracement level, further emphasizing its importance as a potential support zone.
To the upside, the 1st resistance level at 0.6637 is identified as a pullback resistance. Higher up, the 2nd resistance level at 0.6690 is marked as an overlap resistance, further highlighting its importance as a potential resistance point.
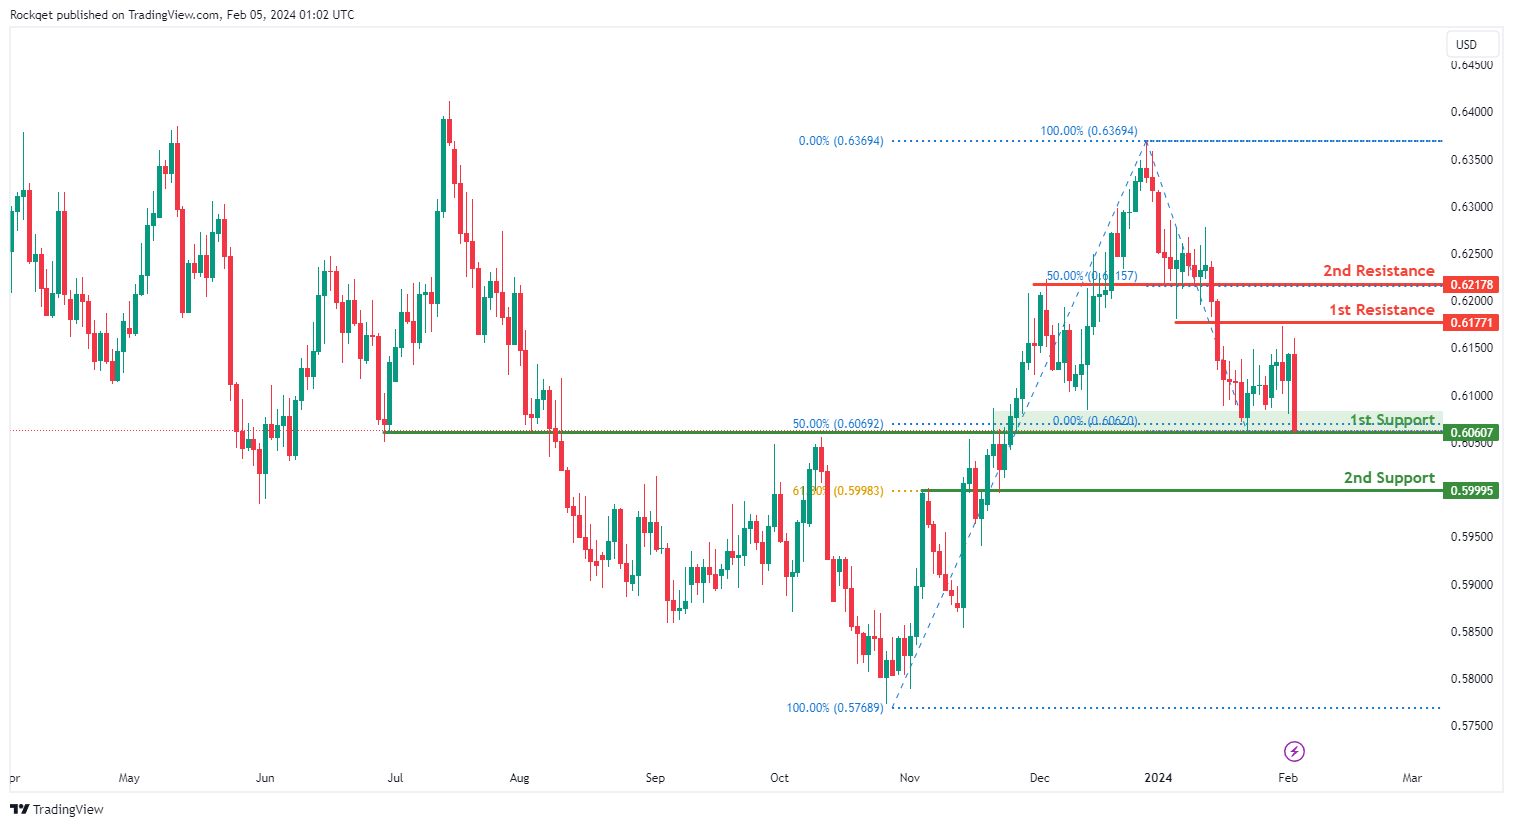
NZD/USD
The NZD/USD chart currently exhibits an overall bearish momentum. In this context, there is a potential scenario for price to fall towards the 1st support and make a small bullish bounce before resuming the downturn.
The 1st support level at 0.6060 is identified as an overlap support that aligns close to the 50.00% Fibonacci Retracement level. Further below, the 2nd support level at 0.5999 is also noted as an overlap support that aligns with the 61.80% Fibonacci Retracement level, further emphasizing its importance as a potential support zone.
To the upside, the 1st resistance level at 0.6177 is identified as an overlap resistance. Higher up, the 2nd resistance level at 0.6217 is also marked as an overlap resistance that aligns with the 50.00% Fibonacci Retracement level, further highlighting its importance as a potential resistance point.
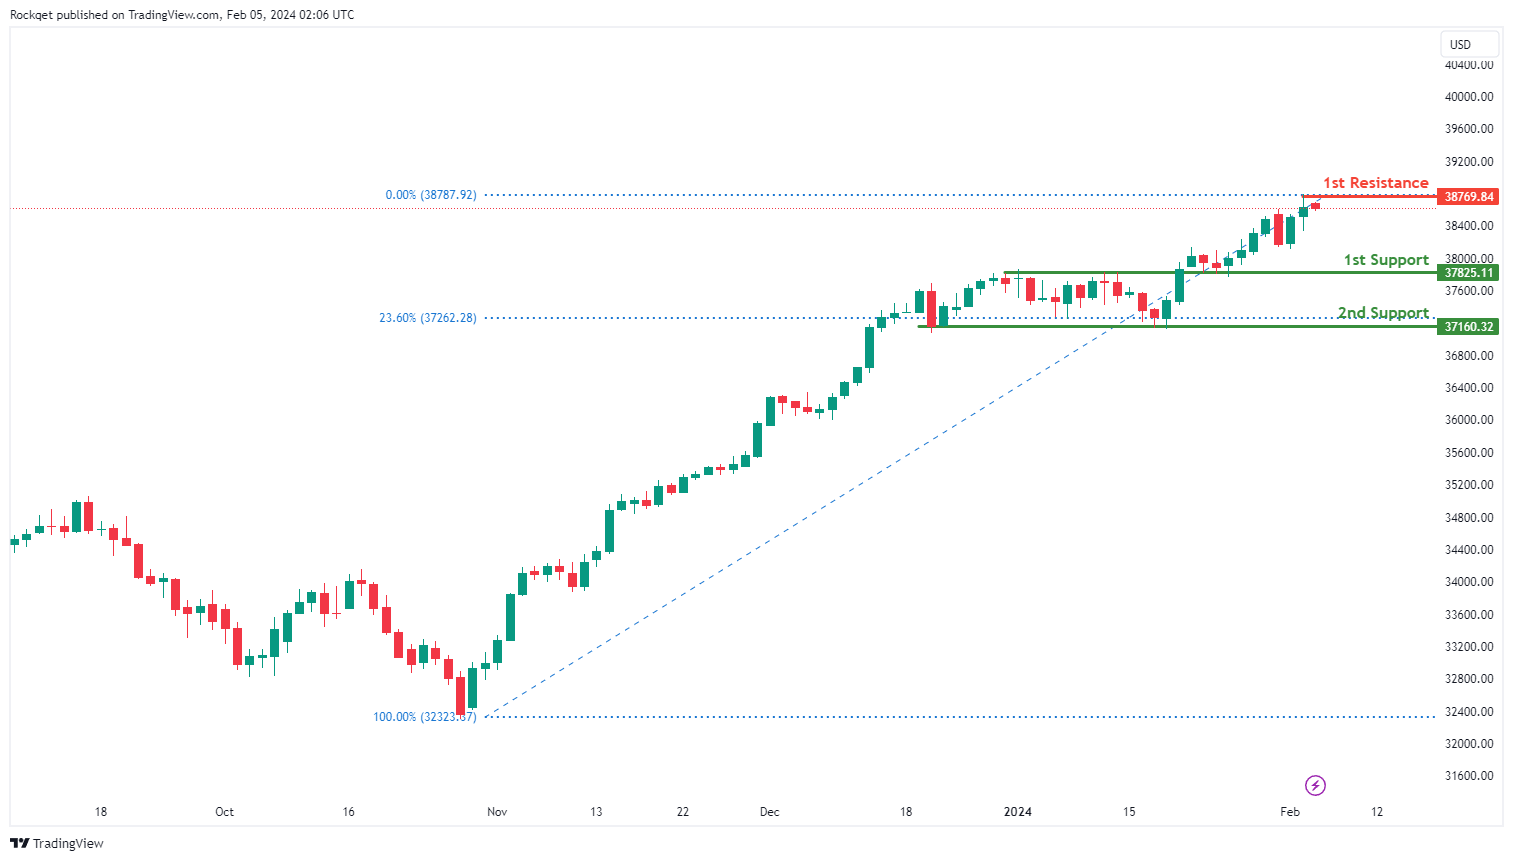
DJ30:
The DJ30 chart currently displays a bullish overall momentum, indicating a prevailing upward trend. There is a potential for a bullish continuation towards the 1st resistance level.
The 1st support at 37825.11 is considered favorable for several reasons. Firstly, it is identified as an overlap support, signifying a historical level where buying interest has previously emerged.
The 2nd support at 37160.32 is recognized as a pullback support, providing additional reinforcement to the potential support zone.
On the resistance side, the 1st resistance at 38769.84 is highlighted, aligning with a swing high resistance. This level suggests a potential barrier to the bullish momentum.
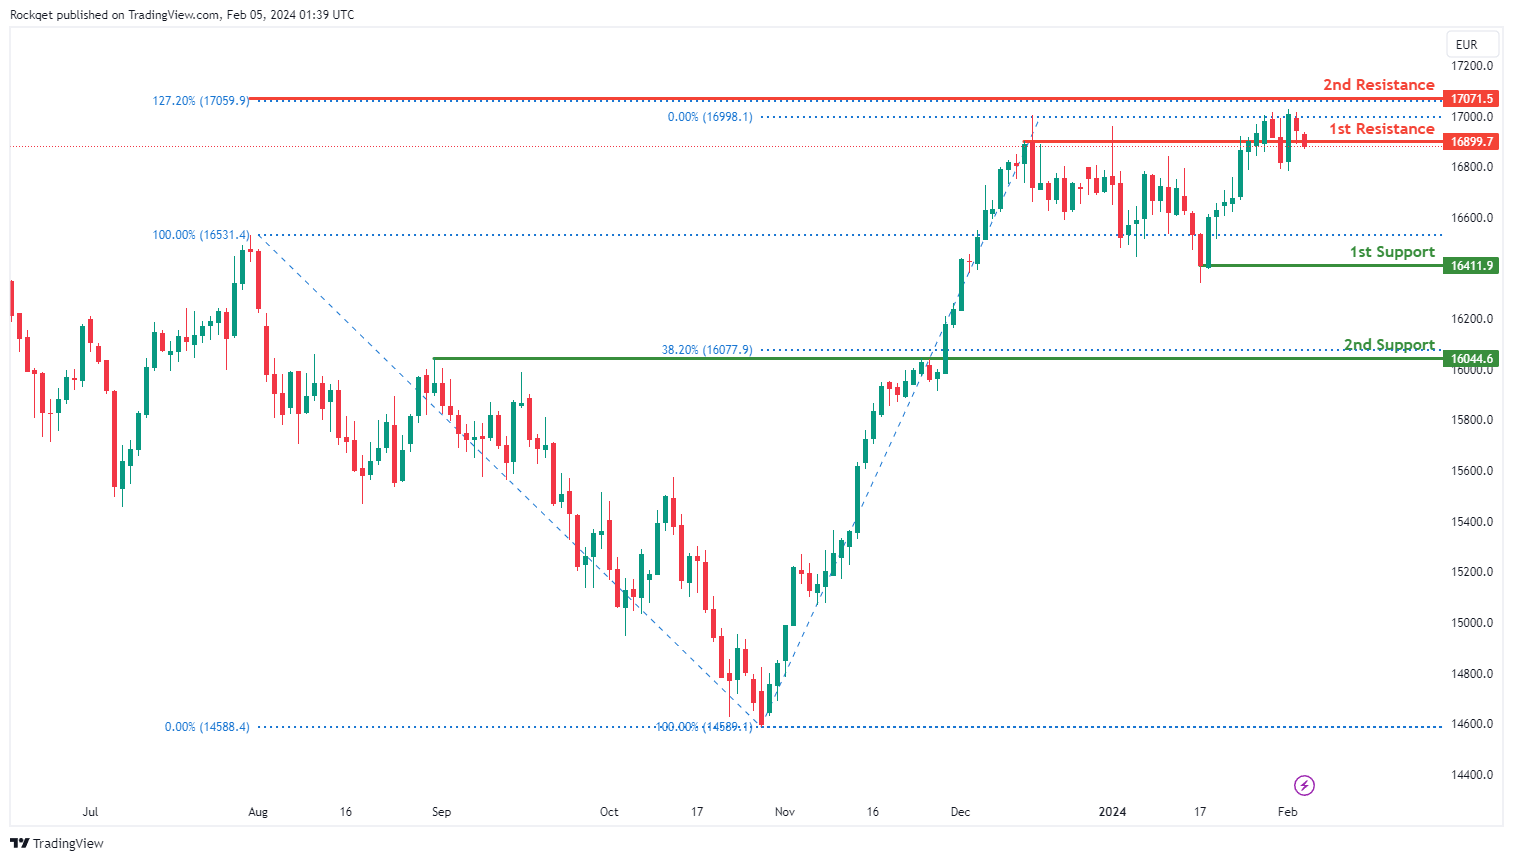
GER40:
The GER40 chart currently exhibits a bearish overall momentum, indicating a prevailing downward trend. Several factors contribute to this bearish sentiment, supporting the potential for continued downward movement in the price.
The 1st support at 16411.9 is considered favorable for various reasons. Firstly, it is identified as an overlap support, suggesting a historical level where buying interest has previously emerged.
Additionally, the 2nd support at 16044.6 is recognized as both an overlap support and aligns with the 38.20% Fibonacci Retracement, providing additional strength to the potential support zone.
On the resistance side, the 1st resistance at 16899.7 is highlighted as it aligns with a pullback resistance, indicating a potential barrier to the bearish momentum.
The 2nd resistance at 17071.5 is also recognized, coinciding with the 127.20% Fibonacci Extension, adding further significance to this resistance level.
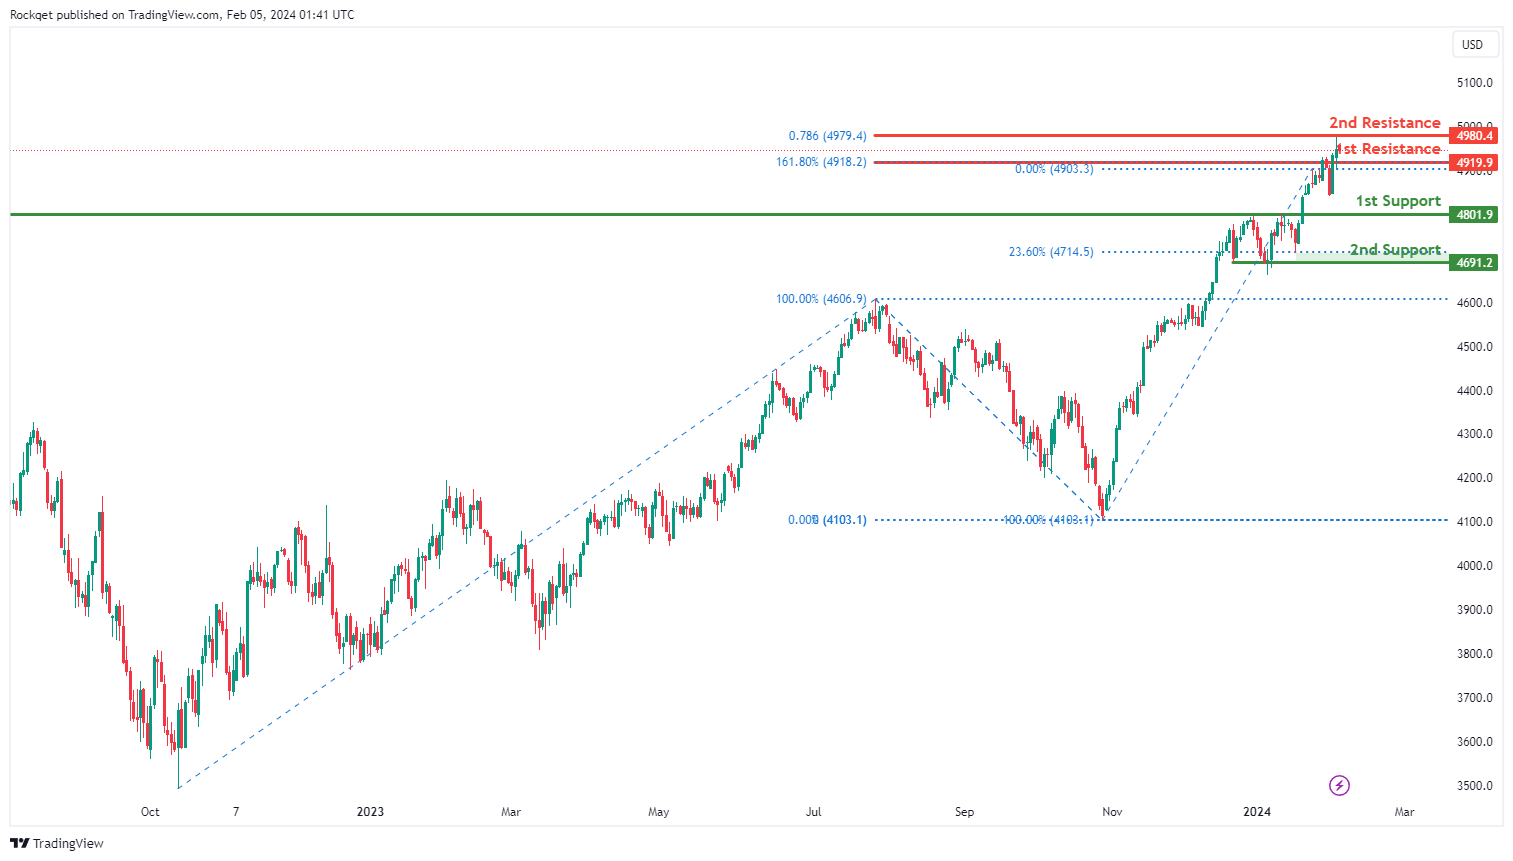
US500:
The US500 chart currently exhibits a bullish overall momentum, indicating a prevailing upward trend. There is a potential for a bullish breakthrough of the 1st resistance, with a subsequent rise to the 2nd resistance.
The 1st support at 4801.9 is considered favorable for various reasons. It is identified as an overlap support, suggesting a historical level where buying interest has previously emerged.
The 2nd support at 4691.2 is also recognized as a pullback support and aligns with the 23.60% Fibonacci Retracement, providing additional strength to the potential support zone.
On the resistance side, the 1st resistance at 4919.9 is highlighted, aligning with the 161.80% Fibonacci Extension. This suggests a potential breakout level where bullish momentum may accelerate.
The 2nd resistance at 4980.4 is also recognized, coinciding with the 78.60% Fibonacci Projection, adding further significance to this resistance level.
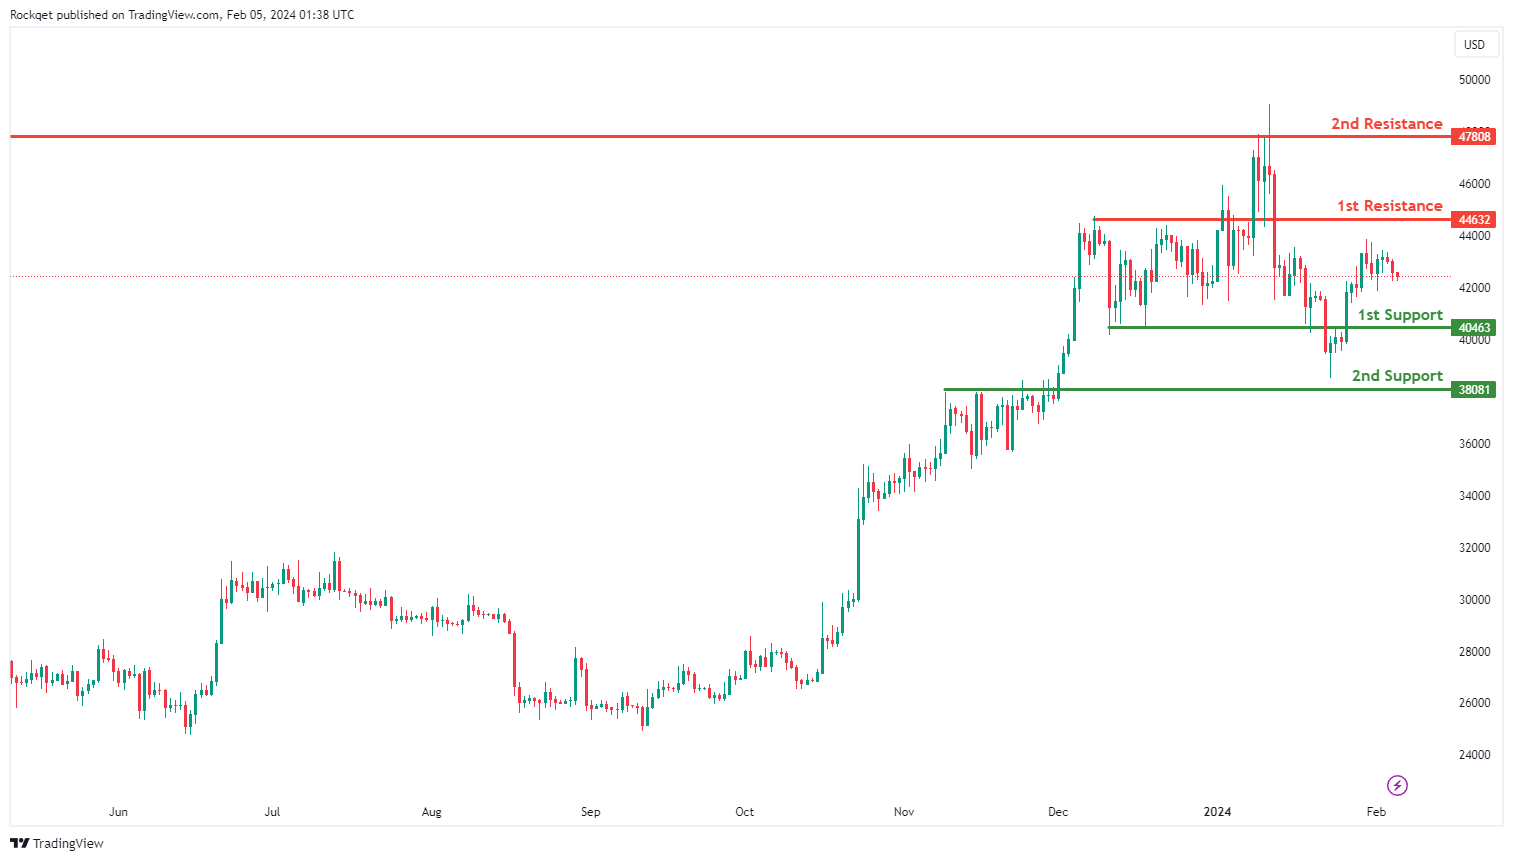
BTC/USD:
The BTC/USD chart currently demonstrates a neutral overall momentum, indicating a lack of a clear trend direction. The price could potentially make fluctuations between the 1st resistance and 1st support levels.
The 1st support at 40463 is viewed favorably for several reasons. Firstly, it is identified as an overlap support, suggesting a historical level where buying interest has previously emerged.
Additionally, the 2nd support at 38081 is recognized as a pullback support, providing additional strength to the potential support zone.
On the resistance side, the 1st resistance at 44632 is emphasized, aligning with an overlap resistance. This suggests a potential barrier to upward movement in the price.
The 2nd resistance at 47808 is also recognized, coinciding with multi-swing high resistance, adding further significance to this resistance level.
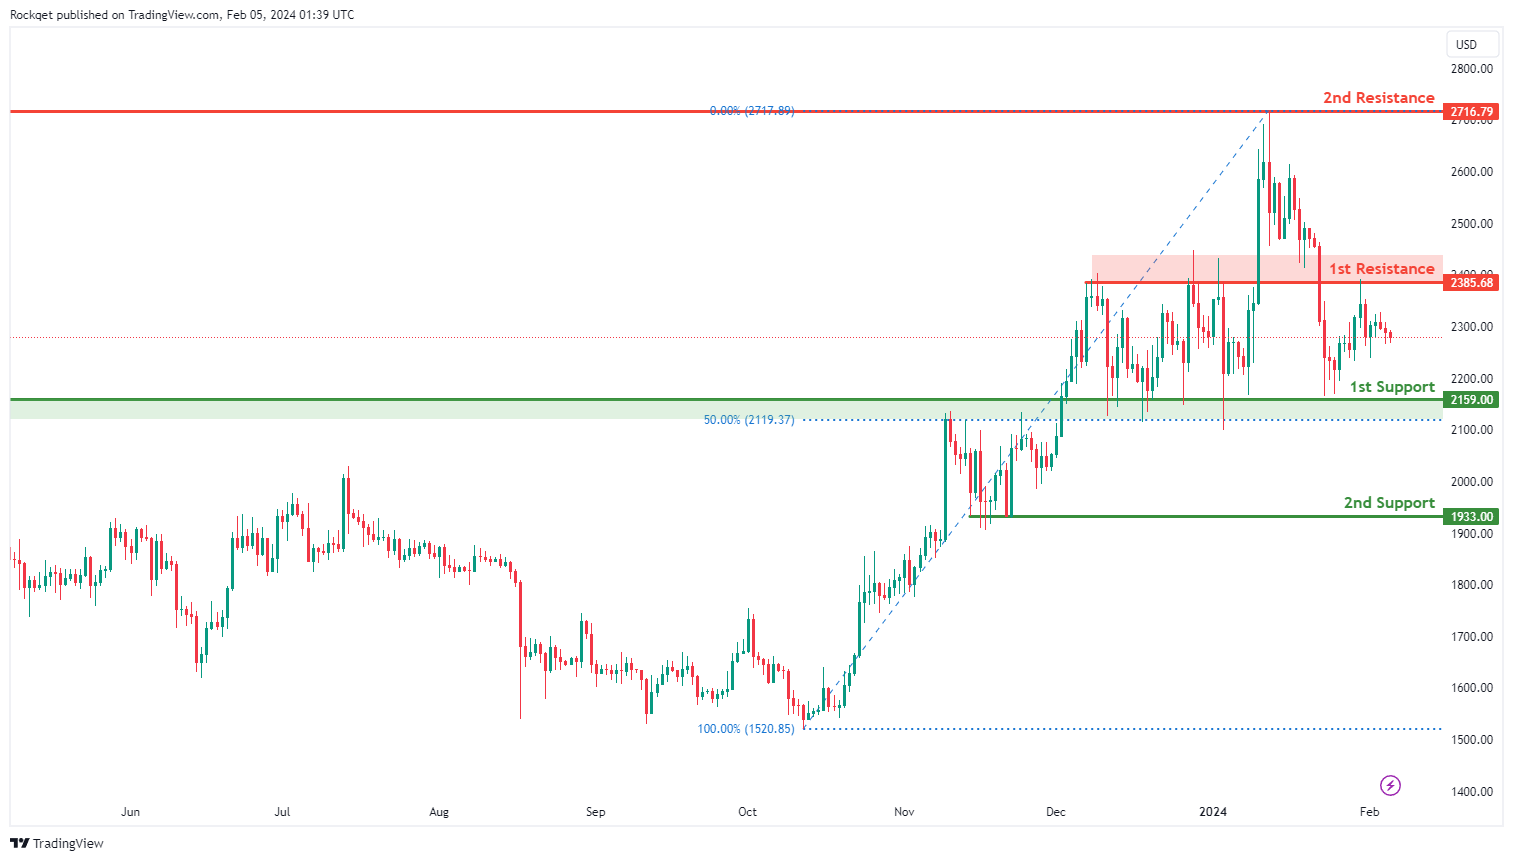
ETH/USD:
The ETH/USD chart currently demonstrates a neutral overall momentum, suggesting a lack of a clear directional trend. There is a potential for price to fluctuate between the 1st resistance and 1st support levels.
The 1st support at 2159.00 is considered favorable for various reasons. It is identified as an overlap support and aligns with the 50% Fibonacci Retracement, indicating a historical level where buying interest has previously emerged.
The 2nd support at 1933.00 is recognized as a pullback support, providing additional strength to the potential support zone.
On the resistance side, the 1st resistance at 2385.68 is highlighted, representing a level where selling pressure may emerge.
The 2nd resistance at 2716.79 is also recognized as an overlap resistance, adding further significance to this resistance level.
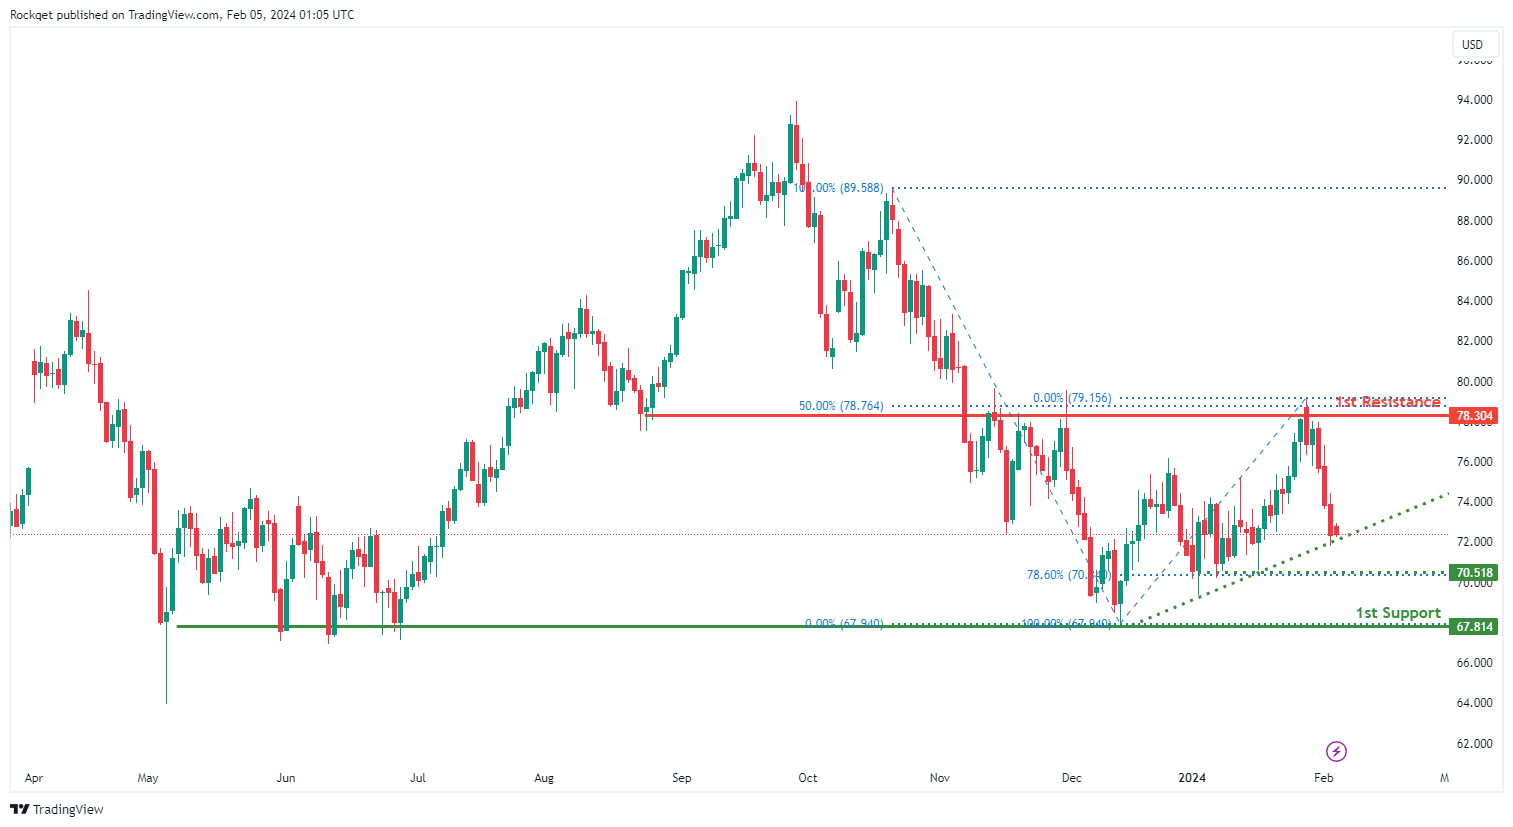
WTI/USD:
The WTI (West Texas Intermediate) chart currently exhibits an overall bearish momentum.In this context, there is a potential scenario for price to fall towards the 1st support should it break below the ascending trendline.
The intermediate support level at 70.51 is identified as a pullback support that aligns with the 78.60% Fibonacci retracement level while the 1st support level at 67.81 is noted as a multi-swing-low support, reinforcing its significance as a key support level.
To the upside, the 1st resistance level at 78.30 is identified as an overlap resistance that aligns with the 50.00% Fibonacci retracement level, further highlighting its importance as a potential resistance point.
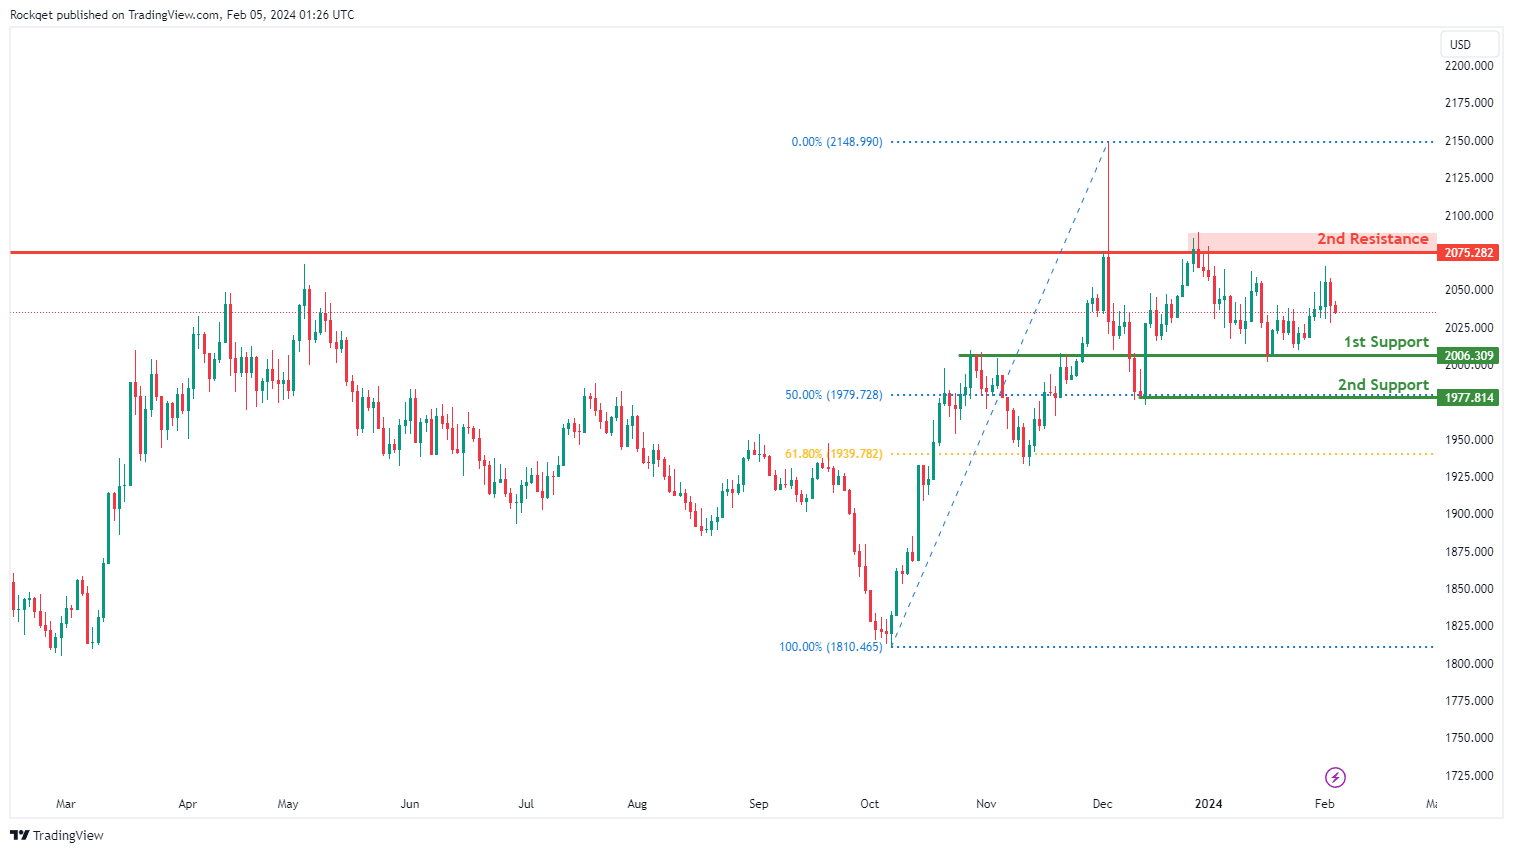
XAU/USD (GOLD):
The XAU/USD chart currently exhibits a bearish overall momentum, indicating a downward trend. According to the analysis, the price could potentially experience a bearish continuation towards the 1st support.
The 1st support level at 2006.30 is identified as an overlap support, suggesting that it represents a historical point where the price has found support in the past.
There is also a 2nd support level at 1977.81, characterized as a swing low support and associated with the 50% Fibonacci Retracement. This further reinforces its significance as a potential support zone.
On the resistance side, the 1st resistance level at 2975.28 is categorized as an overlap resistance, indicating that it represents a historical point where the price has encountered resistance.