
Sample Category Title
USD/JPY Daily Outlook
Daily Pivots: (S1) 145.85; (P) 146.48; (R1) 147.07; More...
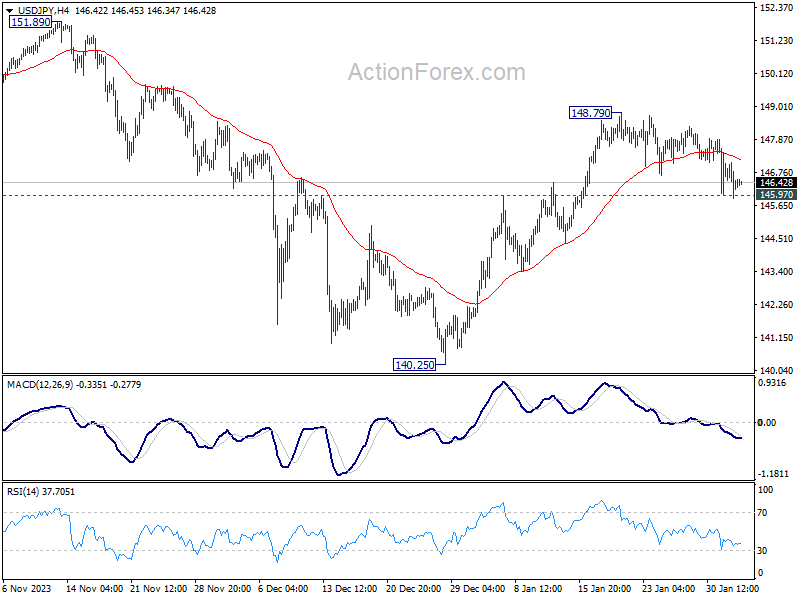
Intraday bias in USD/JPY remains neutral for the moment. Further rally will remain mildly in favor as long as 145.97 resistance turned support holds. Above 148.79 will resume the rebound from 140.25 to retest 151.89/93 key resistance zone. However, firm break of 145.97 will turn bias to the downside for deeper fall towards 140.25.
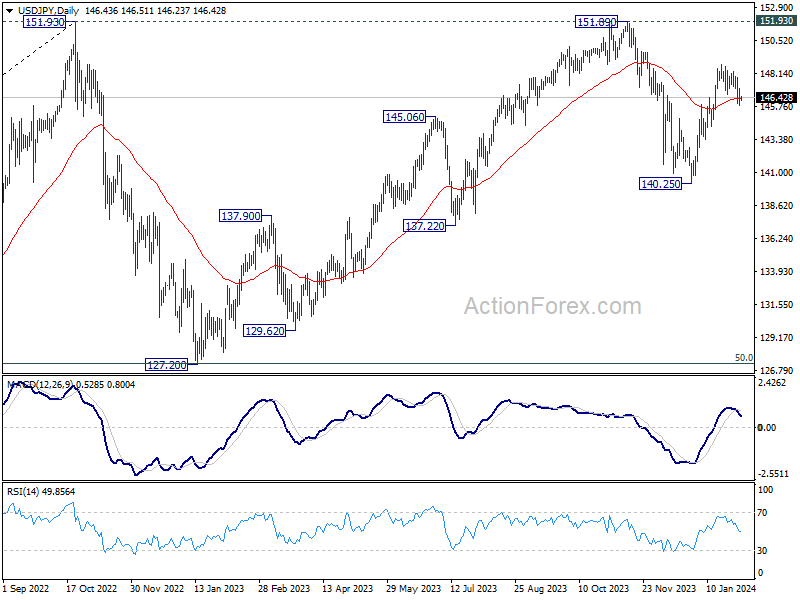
In the bigger picture, stronger than expected rebound from 140.25 dampened the original bearish review. Strong support from 55 W EMA (now at 142.49) is also a medium term bullish sign. Fall from 151.89 could be a correction to rise from 127.20 only. Decisive break of 151.89/93 will confirm resumption of long term up trend. This will now be the favored case as long as 140.25 support holds.
USD/CHF Daily Outlook
Daily Pivots: (S1) 0.8549; (P) 0.8599; (R1) 0.8628; More....
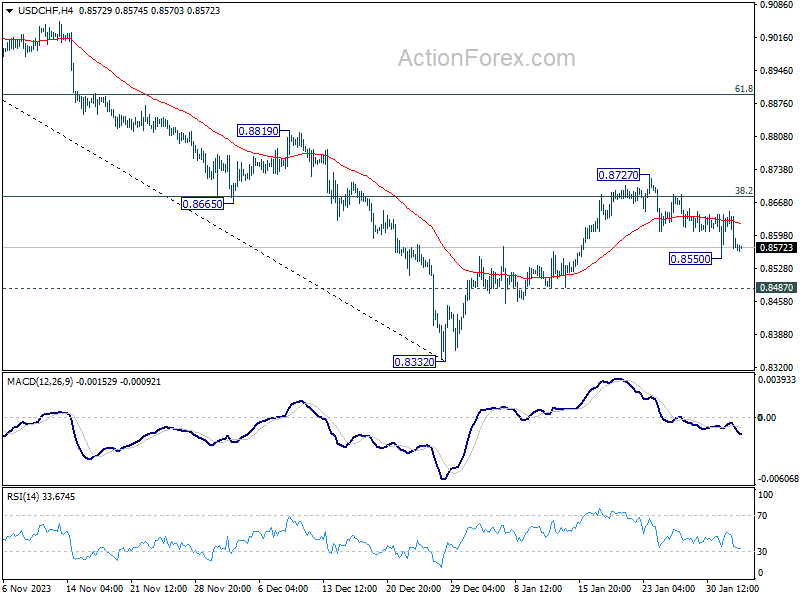
Outlook in USD/CHF remains unchanged and intraday bias stays neutral for the moment. On the downside, below 0.8550 will resume the fall from 0.8727 for 0.8487 support. Break there will argue that rebound from 0.8332 has completed, and bring retest of this low. On the upside, firm break of 0.8727 will resume the rebound to 61.8% retracement of 0.9243 to 0.8332 at 0.8995 instead.
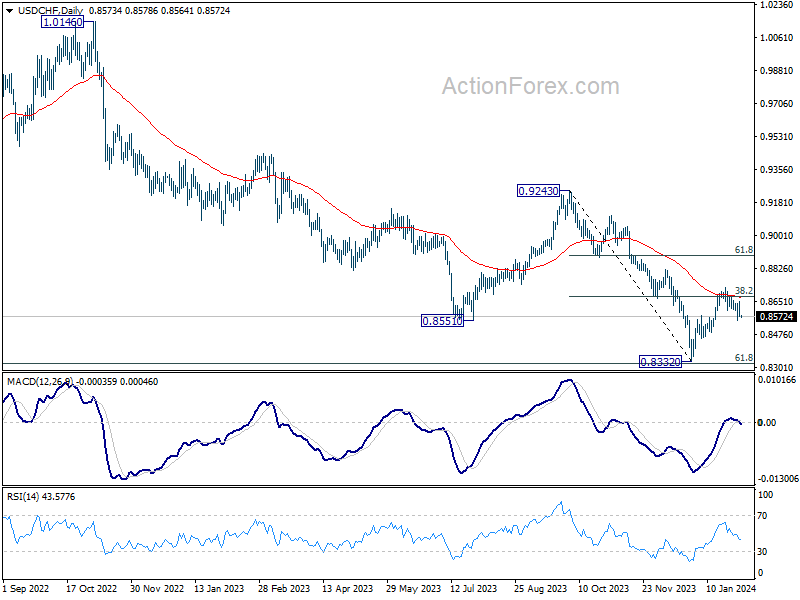
In the bigger picture, while rebound from 0.8332 could be strong, there is no clear sign of medium term bottoming yet. This rebound is tentatively seen as a corrective move for now. Also, outlook will stay bearish as long as 0.9243 resistance holds. Larger down trend from 1.0146 (2022 high) should resume through 0.8332 low at a later stage.
GBP/USD Daily Outlook
Daily Pivots: (S1) 1.2661; (P) 1.2708; (R1) 1.2792; More...
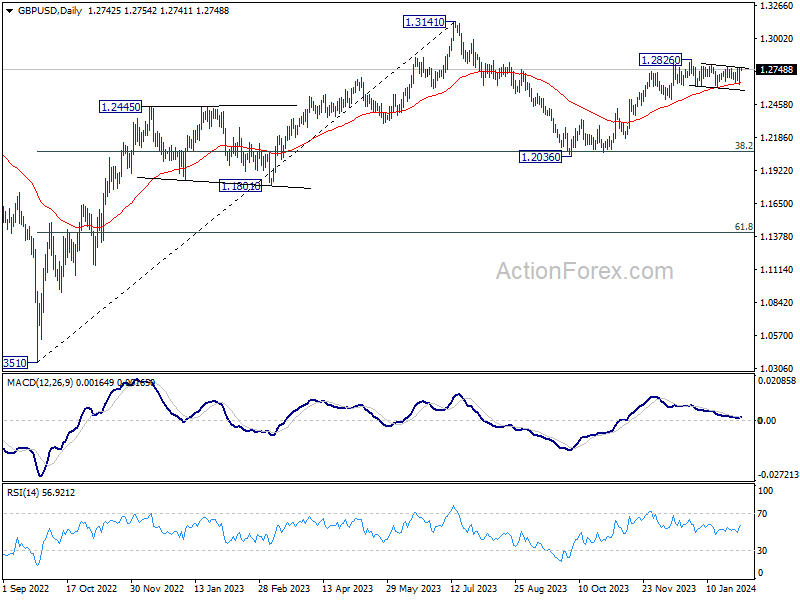
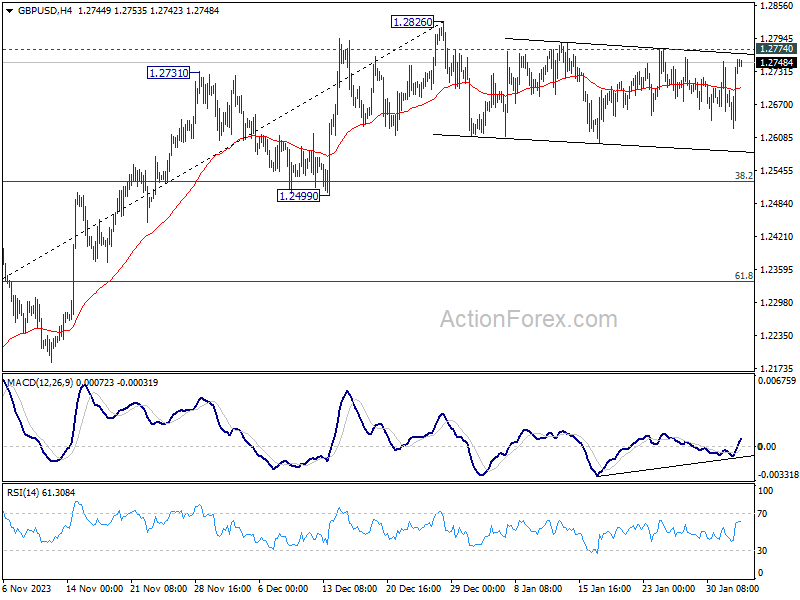
Range trading continues in GBP/USD and intraday bias remains neutral. Consolidation from 1.2826 could still extend further, and deeper fall cannot be ruled out. But downside should be contained above 1.2499 support to bring rebound. On the upside, firm break of 1.2774 resistance will suggest that consolidation pattern has completed. Further rise should be seen through 1.2826 to resume the rally from 1.2036. Next target will be 1.3141 high.
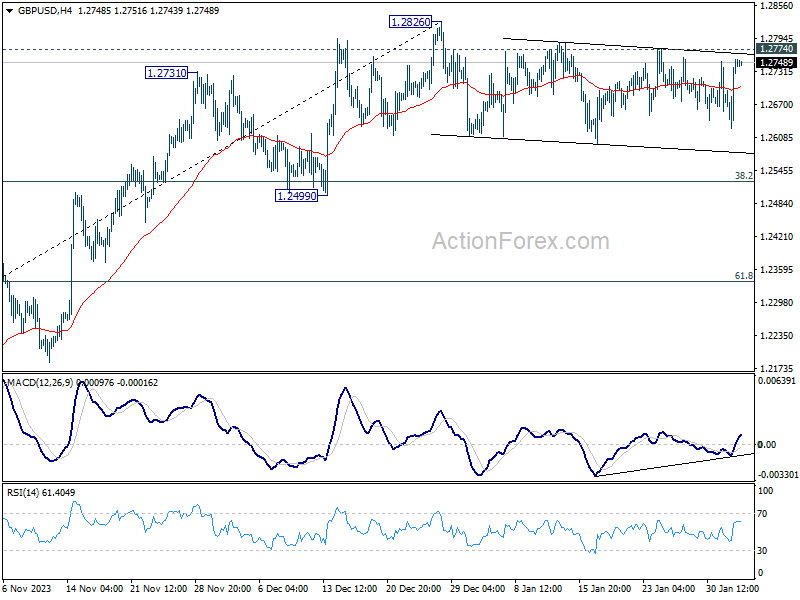
In the bigger picture, price actions from 1.3141 medium term top are seen as a corrective pattern to up trend from 1.0351 (2022 low). Rise from 1.2036 is seen as the second leg that's in progress. Upside should be limited by 1.3141 to bring the third leg of the pattern. Meanwhile, break of 1.2499 support will argue that the third leg has already started for 38.2% retracement of 1.0351 (2022 low) to 1.3141 at 1.2075 again.
EUR/USD Daily Outlook
Daily Pivots: (S1) 1.0810; (P) 1.0843; (R1) 1.0905; More...
Intraday bias in EUR/USD is turned neutral again as it recovered after dipping to 1.0779. While another fall cannot be ruled out, considering persistent bullish convergence condition in 4H MACD, downside should be contained by 1.0722 key structural support. On the upside, firm break of 1.0886 will confirm short term bottoming, and bring stronger rebound back towards 1.1138 resistance. Nevertheless, decisive break of 1.0722 will argue that whole rise from 1.0447 has completed, and target this low.
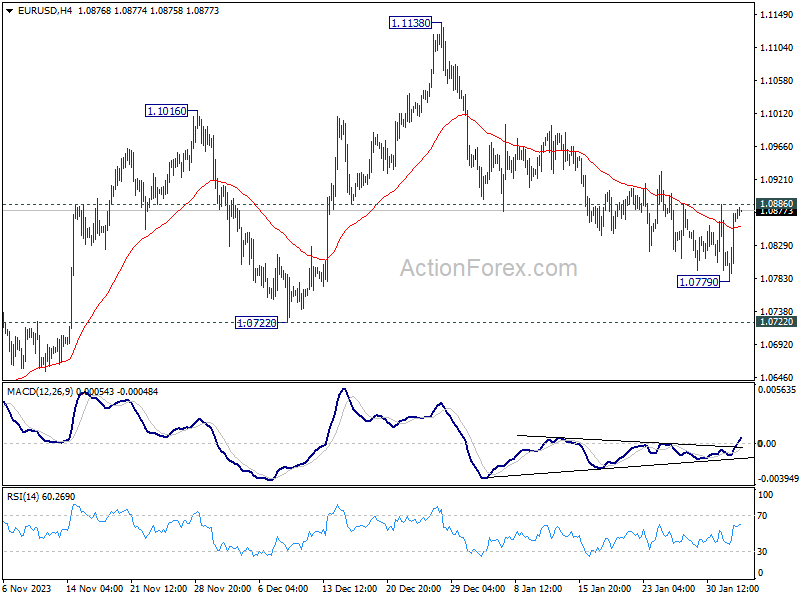
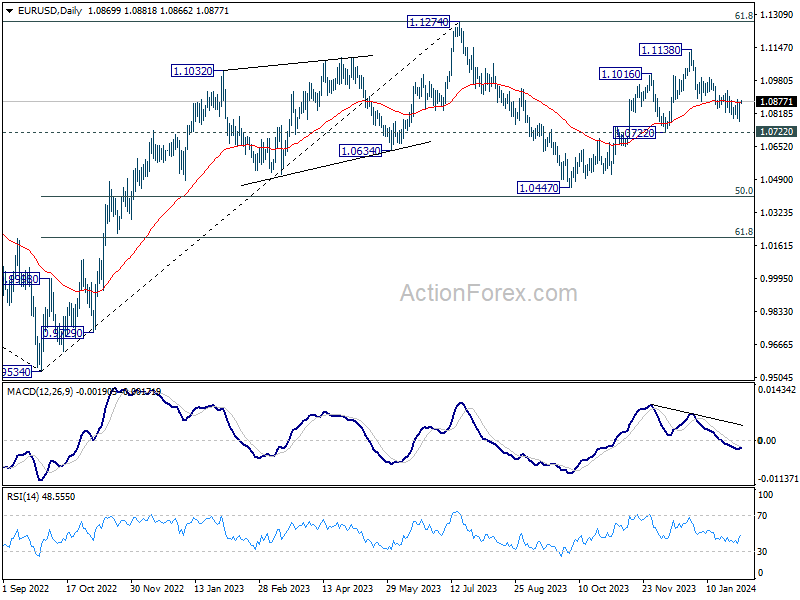
In the bigger picture, price actions from 1.1274 are viewed as a corrective pattern to rise from 0.9534 (2022 low). Rise from 1.0447 is seen as the second leg. While further rally could cannot be ruled out, upside should be limited by 1.1274 to bring the third leg of the pattern. Meanwhile, sustained break of 1.0722 support will argue that the third leg has already started for 1.0447 and below.
Dollar Vulnerable after Dramatic Turnaround, Next Move Hinges on NFP
Dollar had a dramatic turnaround in its fortune overnight, following the significant slide in US 10-year yield, which coincided with robust rally in US stock markets. Major indexes effectively wiped out the sharp declines seen on Wednesday. Anticipation of a Fed rate cut in March has notably dwindled, with fed fund futures now showing a mere 37.5% probability. Conversely, likelihood of a cut in May has escalated markedly, with market bets nearing 92%. Against this backdrop, today's Non-Farm payroll data looms large, poised to influence Dollar's next move, along with broader implications for risk sentiment and the outlook of treasury bonds.
Throughout this week, Dollar has turned into the weakest link among major currencies, with Euro trailing as the second weakest, then. Australian Dollar and British Pound. Though Aussie has managed to derive some benefit from risk-on market sentiment. its progress is constrained by the ongoing downturn in Chinese markets. Meanwhile, Sterling is in search of direction, with market participants keenly awaiting comments from BoE Chief Economist Huw Pill for insights into BoE's monetary policy outlook, especially in the wake of yesterday's confusing rate decision.
Japanese Yen continues to stand out as the strongest currency for the time being, although its rally appears to be past its limits. New Zealand Dollar secures the position as the second strongest, with Swiss Franc also showing strength. Canadian Dollar, however, maintains a neutral stance in the midst of its peers.
Technically, after failing to follow through with this week's rally attempt, Dollar is starting to look vulnerable for a reversal. Levels to watch today include 1.0886 resistance in EUR/USD, 1.2774 resistance in GBP/USD, 0.6639 resistance in AUD/USD, 145.97 support in USD/JPY, as well as 1.3342 support in USD/CAD. Simultaneous break of these levels could mark the beginning of more pronounced weakness in Dollar, and set the stage for further decline in February.
In Asia, at the time of writing, Nikkei is up 0.60%. Hong Kong HSI is up 0.21%. China Shanghai SSE is down -1.12%. Singapore Strait Times is up 1.24%. Japan 10-year JGB yield is down -0.0237 at 0.671. Overnight, DOW rose 0.97%. S&P 500 rose 1.25%. NASDAQ rose 1.30%. 10-year yield fell -0.104 to 3.863.
BoC's Macklem: Inflation decline expected to be gradual and uneven
BoC Governor Tiff Macklem emphasized the anticipated "gradual and uneven" decline in inflation towards 2% target. Speaking to the House of Commons Finance Committee, he noted that the journey to achieving inflation target "will be slow," highlighting the persistence of risks along the way.
The central bank's focus has evolved from assessing the sufficiency of current restrictive monetary policy stance to "how long to maintain the current restrictive stance," he added.
Macklem also pointed out that while the Bank is keen on starting to reduce interest rates to support economic growth, it remains vigilant. The decision to lower rates will be contingent on a clear trajectory towards the inflation target, ensuring premature policy easing does not derail the progress made.
He stated, "you do want to start lowering interest rates before you're all the way back, but you don't want to lower them until you're convinced…that you're really on a path to get there."
Additionally, the Governor reiterated the Bank's readiness to adjust rates upwards should "new developments" warrant further action to curb inflation.
Gold pressing 2061 resistance after strong bounce
Gold jumped notably overnight following extended decline in benchmark treasury yields, as well as broad selloff in Dollar. Technically speaking, immediate attention is now on 2061.99 resistance. Decisive break there should confirm that corrective pullback from 2088.24 has completed with three waves down to 2001.58. More importantly, rally from 1972.86 would then be ready to resume through 2088.24. This will now be the favored case as long as 2029.79 minor support holds.
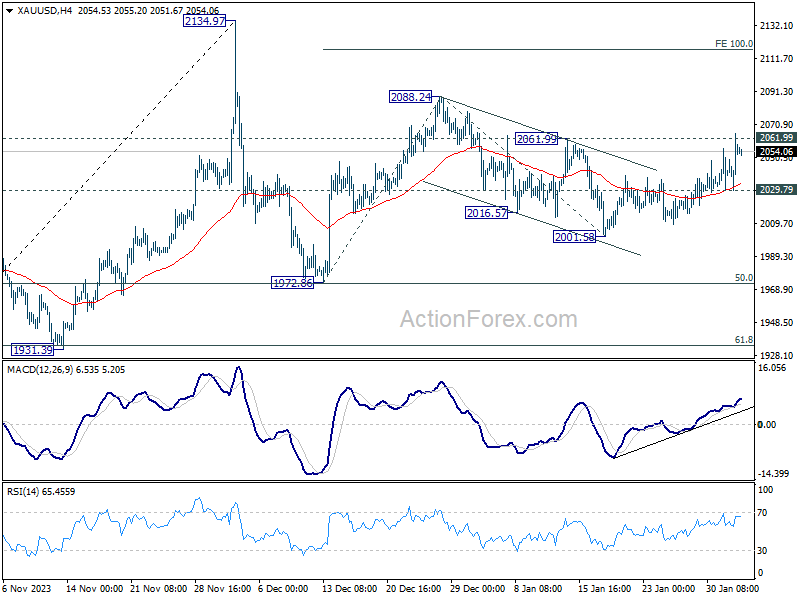
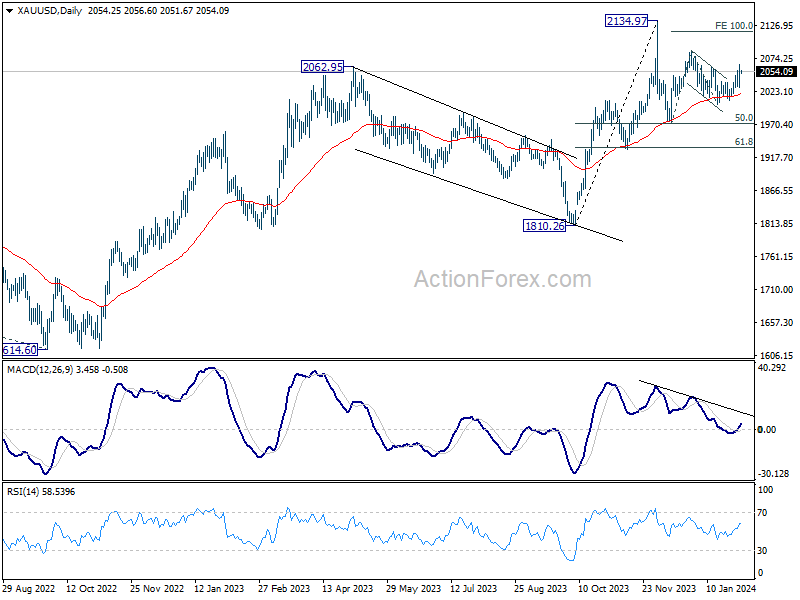
However, in the bigger picture, Gold might not be ready to break through 2134.97 record high yet. Current bounce from 1972.86 is seen as the second leg of a medium term corrective pattern from 2134.97. Upside will likely be limited by 100% projection of 1972.86 to 2088.24 from 2001.58 at 2116.96 to start the third leg.
NFP to conclude eventful week, 10-year yield in focus
Today's US Non-Farm Payroll report is poised to be the focal point, concluding a week brimming with significant market events. Expectations are set for moderation in headline job growth to 178k in January, from December's robust 216k. Additionally, unemployment rate is anticipated to inch higher to 3.8% from 3.7%, while the pace of average hourly earnings growth is projected to decelerate to 0.3% mom.
Preliminary indicators such as ADP private employment figure, which registered growth of only 107k, and a slight dip in ISM manufacturing employment component to 47.1, suggest potential softness in the headline job growth. However, wage growth aspect remains a wildcard, capable of influencing market dynamics significantly.
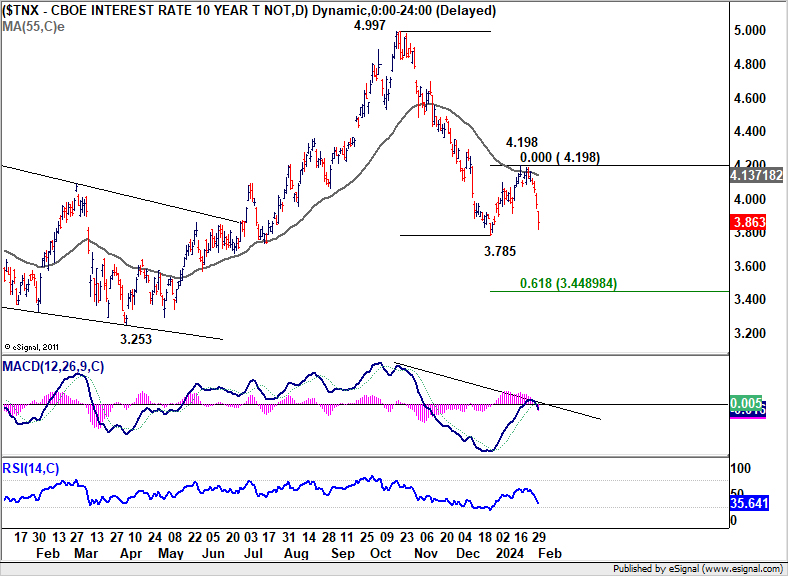
A key post-NFP development to watch is in 10-year yield, which has witnessed a marked decline throughout the week. The strong downside momentum now amplifies the likelihood that the overarching downward trend from 4.997 peak is resuming.
A weekly close below 3.785 support would corroborate the bearish case, and steer 10-year yield to 61.8% projection of 4.997 to 3.785 from 4.198 at 3.448 this quarter, before it could find a bottom. That would also keep Dollar pressured, in particular against Yen.
EUR/USD Daily Outlook
Daily Pivots: (S1) 1.0810; (P) 1.0843; (R1) 1.0905; More...
Intraday bias in EUR/USD is turned neutral again as it recovered after dipping to 1.0779. While another fall cannot be ruled out, considering persistent bullish convergence condition in 4H MACD, downside should be contained by 1.0722 key structural support. On the upside, firm break of 1.0886 will confirm short term bottoming, and bring stronger rebound back towards 1.1138 resistance. Nevertheless, decisive break of 1.0722 will argue that whole rise from 1.0447 has completed, and target this low.
In the bigger picture, price actions from 1.1274 are viewed as a corrective pattern to rise from 0.9534 (2022 low). Rise from 1.0447 is seen as the second leg. While further rally could cannot be ruled out, upside should be limited by 1.1274 to bring the third leg of the pattern. Meanwhile, sustained break of 1.0722 support will argue that the third leg has already started for 1.0447 and below.
Economic Indicators Update
| GMT | Ccy | Events | Actual | Forecast | Previous | Revised |
|---|---|---|---|---|---|---|
| 21:45 | NZD | Building Permits M/M Dec | 3.70% | -10.60% | ||
| 23:50 | JPY | Monetary Base Y/Y Jan | 4.80% | 7.50% | 7.80% | |
| 00:30 | AUD | PPI Q/Q Q4 | 0.90% | 1.90% | 1.80% | |
| 00:30 | AUD | PPI Y/Y Q4 | 4.10% | 3.80% | ||
| 07:45 | EUR | France Industrial Output M/M Dec | 0.20% | 0.50% | ||
| 13:30 | USD | Nonfarm Payrolls Jan | 178K | 216K | ||
| 13:30 | USD | Unemployment Rate Jan | 3.80% | 3.70% | ||
| 13:30 | USD | Average Hourly Earnings M/M Jan | 0.30% | 0.40% | ||
| 15:00 | USD | Factory Orders M/M Dec | 0.50% | 2.60% | ||
| 15:00 | USD | Michigan Consumer Sentiment Index Jan F | 78.8 | 78.8 |
Cliff Notes: The Promise of Disinflation
Key insights from the week that was.
In Australia, the Q4 CPI printed 0.6% (4.1%yr) for headline inflation and 0.8% (4.2%yr) for core trimmed mean inflation, meaningfully lower than the RBA’s forecast of 4.5%yr across both indicators. The detail of the report confirmed disinflation’s pace is faster than expected and it has breadth. Indeed, the proportion of expenditure classes that are tracking a pace above 3.0%yr has fallen drastically, from 71% in September to 56% in December. The largest downside surprise in the quarter was utilities (0.6% vs. 5.0% forecast) – State Government rebates clearly still effective in shielding households from specific cost-of-living pressures – in addition to tradable goods (–0.7%, 1.5%yr), as the disinflationary pulse from easing global supply chain disruptions continues to materialise. Some categories have moved only slightly below recent peaks, namely housing-related expenses such as rents (+7.3%yr) and dwelling purchase costs (+5.1%yr), while some have reached new heights, with insurance premiums (+16.2%yr) now tracking its highest rate of price growth since March 2001.
As detailed by Chief Economist Luci Ellis, these results are consistent with a softer set of data prints over recent months, not only with regards to inflation but also the labour market and economic growth. All-in-all, we continue to anticipate that there will be no change to the RBA’s policy stance next week; however, given the Board’s sensitivity to upside surprises, it is unlikely that the RBA will entirely rule out further rate hikes in their post-meeting communications. In time, the Board will be encouraged by the ongoing downtrend in inflation, and with growth likely to continue hovering well-below trend – a consequence of weak consumption (see below) and stalling business investment – there will be scope to lessen the contractionary setting of monetary policy. We are forecasting a rate cutting cycle to begin in Q3 2024, at a measured pace of 25bps per quarter until Q3 2025, to a terminal rate of 3.10%. Markets are on a similar page, now pricing in the first rate cut by Sep-24, two before Dec-24, and nearly four in total by Jun-25.
Other updates on the Australian economy this week were soft. On housing, the CoreLogic home value index reported a 0.4% lift in house prices in January, a further step-down in the pace of monthly gains. Moderation is clearest in markets where affordability is exceptionally stretched – Sydney and Melbourne in particular – a consequence of limited supply and contractionary policy. With dwelling approvals struggling to produce any signs of headway (–24%yr), affordability will continue to weigh on national price outcomes near-term, while state performances are likely to diverge based on how these factors evolve.
On the consumer, it was a disappointing end to the year for nominal retail sales, December’s decline (–2.7%) more than offsetting November’s Black Friday bounce (+2.2%). Shifting seasonal patterns aside, on balance these results continue to speak to a fragile consumer sector, with disposable incomes being hit by the trifecta of high prices, elevated interest rates and a rising tax take. For an in-depth assessment on the current state of the Australian consumer, see our latest Westpac Red Book.
In the US, the FOMC’s first meeting made clear they are in ‘risk management mode’. While inflation prints have been constructive, Chair Powell was looking for more of the same to ‘feel more confident’ that inflation risks are behind them. Headline and core PCE inflation prints of 2.6%yr and 2.9%yr in December saw Chair Powell characterise inflation as ‘elevated’. This is despite both headline and core PCE inflation having annualised at the 2.0% target throughout the second half of 2023. Much of the disinflation has come from goods, a function of easing supply chains, leading to some concerns around the stickiness of services inflation.
While the FOMC is not expecting the labour market to weaken materially, should downside risks assert, they will not hesitate to act with rate cuts. For the first time, Chair Powell outlined that rate cuts will come ‘some time this year’, but suggested that March may be too soon for the Committee to have the confidence they need. There are two payroll prints before the March meeting and we believe they are likely to decide when the first cut is seen. You can read more about our views here. Other indicators of the labour market were on the softer side this week, 0.9%qtr growth in the employment cost index the lowest quarterly increase since Q1 2021, and a modest deterioration in the ISM Manufacturing PMI's employment sub-index despite a rise in the headline index.
Across the pond, the Bank of England also opted to keep rates steady at 5.25%; while the majority were for no change, votes were cast for both a hike and a cut. While inflation and wages data came in softer than the Bank expected in November, there is concern around inflation’s persistence. CPI is expected to remain elevated as energy subsidies roll off, and geopolitical conflicts skew near-term risk up. Growth is still expected to be very weak and the labour market deteriorating. Forecasts indicate that the BoE is likely to sustainably reach their inflation target later in the forecast period despite a near-term downgrade. While a cut can be expected, market pricing, which sees the base rate at 4.2% in 2024, is too aggressive for the BoE’s taste. The Bank remains concerned of inflation becoming stuck above 2% and so will be patient. This is also likely to prove the case in Europe. Their CPI eased to 2.8%yr in December, with food the principle driver; services stayed robust at 4.0%yr however, and core inflation ticked down to 3.3%yr overall.
Finally in Asia, China's NBS PMIs showed slight increases, manufacturing at 49.2 (+0.2pts) and non-manufacturing at 50.7 (+0.3pts), likely aided by 2024’s mid-February timing of Lunar New Year. Employment and prices in China remained weak however, highlighting the difficulty authorities face in accelerating growth outside high-tech manufacturing and infrastructure investment.
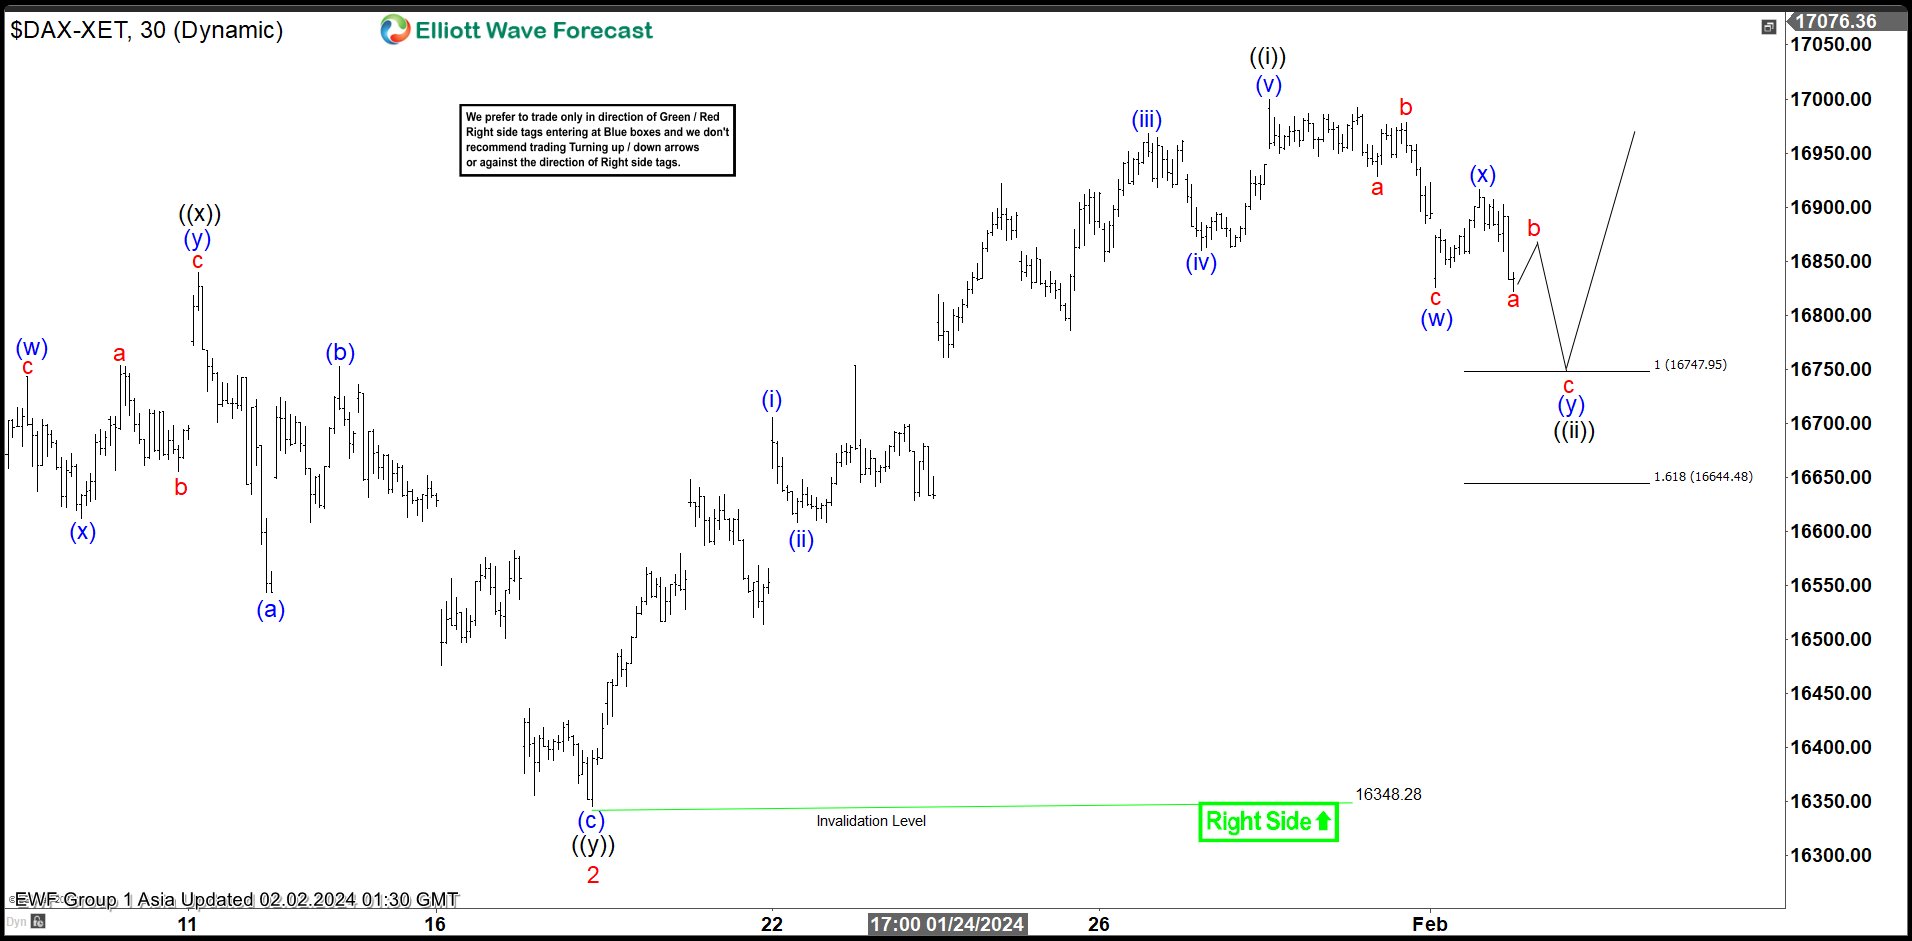
DAX Near Term Support Area
Short Term Elliott Wave view in DAX suggests the rally from 10.23.2023 low is unfolding as a 5 waves impulse. Up from 10.23.2023 low, wave 1 ended at 17003.28. Wave 2 pullback subdivided into a double three Elliott Wave structure. Down from wave 1, wave ((w)) ended at 16448.71 and wave ((x)) rally ended at 16839.49. Wave ((y)) lower subdivided into a zigzag like the 30 minutes chart below shows. Down from wave ((x)), wave (a) ended at 16542.99 and wave (b) ended at 16752.24. Wave (c) lower ended at 16348.28 which completed wave ((y)) of 2 in higher degree.
Index has resumed higher in wave 3. Up from wave 2, wave (i) ended at 16705.49 and wave (ii) ended at 16607.72. Wave (iii) higher ended at 16967.72 and pullback in wave (iv) ended at 16860.05. Wave (v) higher ended at 16999.58 which completed wave ((i)) in higher degree. Pullback in wave ((ii)) is in progress as a double three Elliott Wave structure. Down from wave ((i)), wave (w) ended at 16825.43 and wave (x) ended at 16915.92. Expect wave (y) to extend lower to reach 16644.48 – 16747.95 area to complete wave (y) of ((ii)). Near term, as far as pivot at 16348.28 low stays intact, expect pullback to find support in 3, 7, 11 swing for further upside.
DAX 30 Minutes Elliott Wave Chart
DAX Elliott Wave Video
https://www.youtube.com/watch?v=KhFuX4IH3lo
Technical Outlook and Review
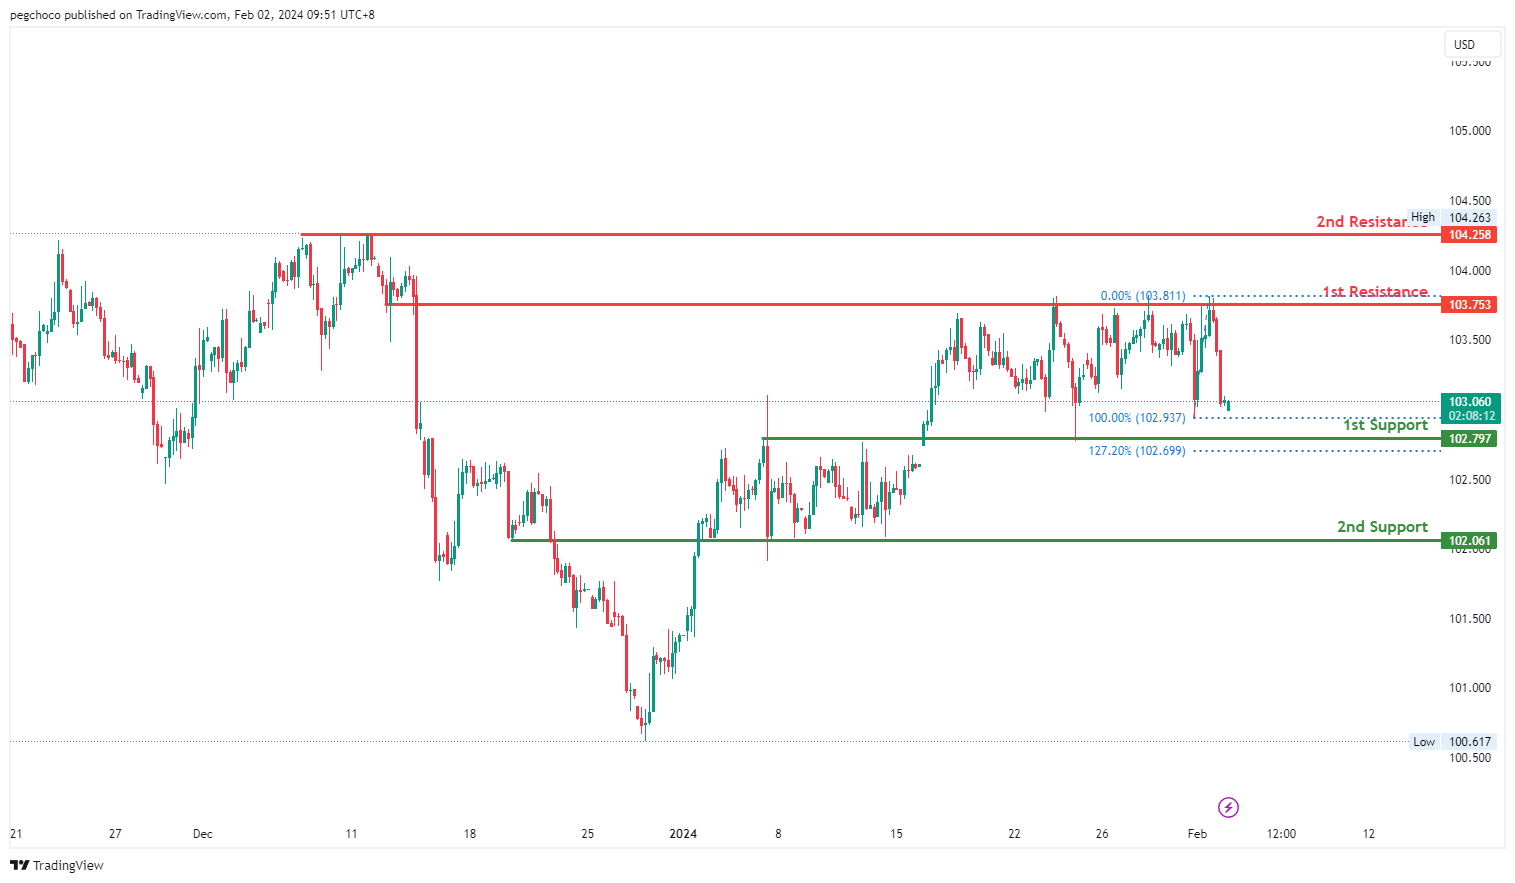
DXY:
The DXY (US Dollar Index) chart currently exhibits a neutral overall momentum, suggesting a lack of a strong trend in either direction. Price could potentially fluctuate between the 1st resistance and 1st support levels.
The 1st support level at 102.79 is identified as an overlap support and is reinforced by the presence of the 127.20% Fibonacci Extension. This suggests that it has historical significance and could potentially act as a strong support level where buying interest may emerge.
There is also a 2nd support level at 102.06, described as an overlap support, further emphasizing its importance as a potential support zone.
On the resistance side, the 1st resistance level at 103.75 is categorized as an overlap resistance, indicating that it represents a historical point where the price has encountered resistance in the past.
The 2nd resistance level at 104.25 is identified as a multi-swing high resistance, suggesting that it is another historical level where the price has faced resistance.
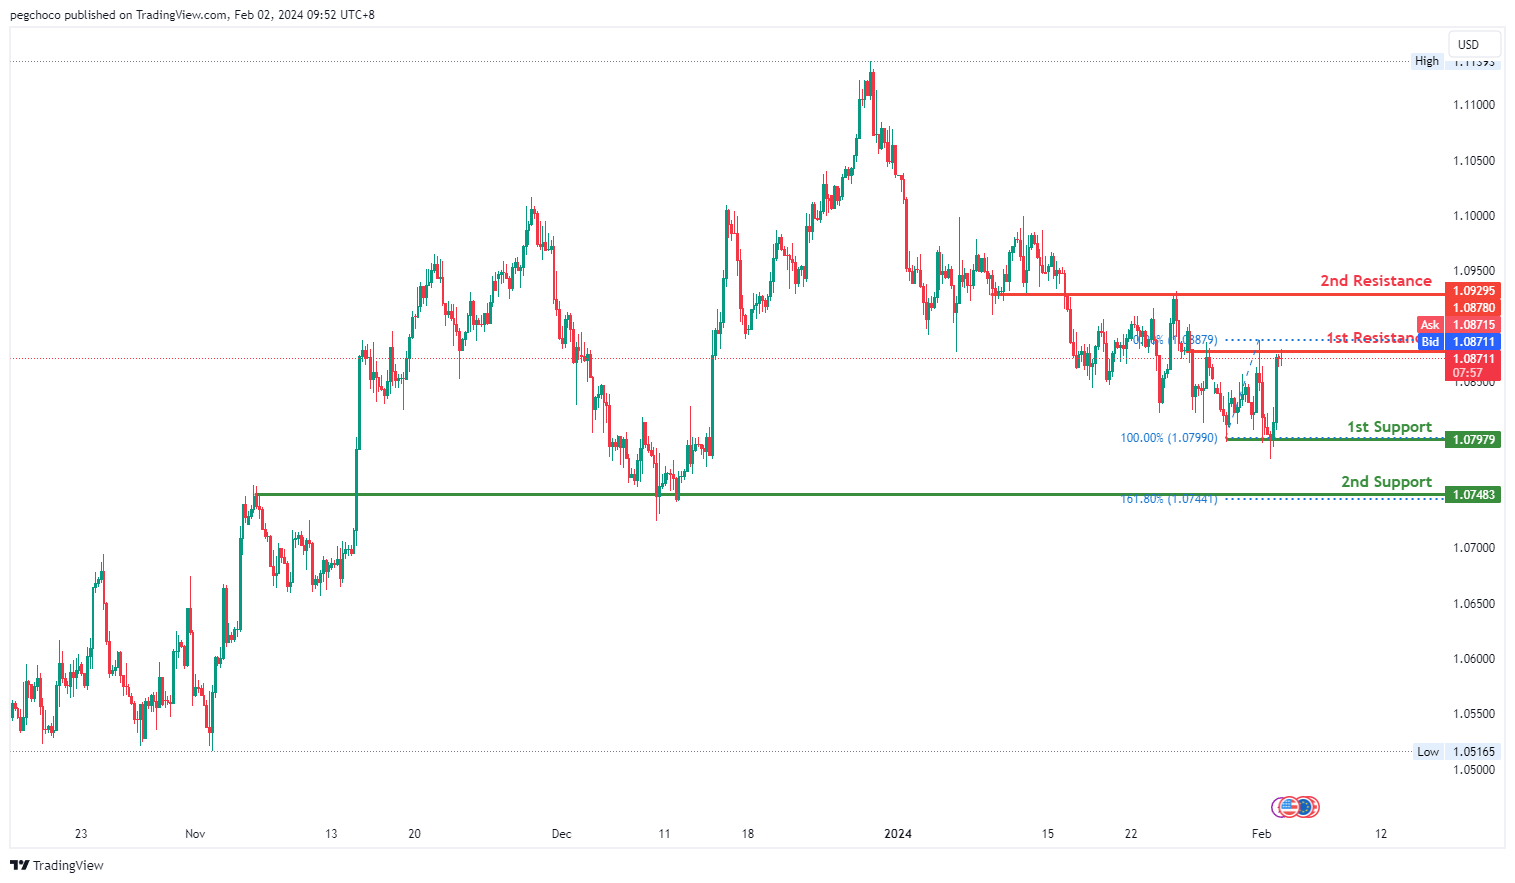
EUR/USD:
The EUR/USD chart currently exhibits a bearish overall momentum, indicating a downward trend. According to the analysis, the price could potentially experience a bearish reaction off the 1st resistance level and drop to the 1st support.
The 1st support level at 1.0797 is identified as a multi-swing low support, suggesting that it has historical significance as a potential support level where buying interest may emerge.
There is also a 2nd support level at 1.0748, described as an overlap support, and it is reinforced by the presence of the 161.80% Fibonacci Extension, further emphasizing its importance as a potential support zone.
On the resistance side, the 1st resistance level at 1.0878 is categorized as an overlap resistance, indicating that it represents a historical point where the price has encountered resistance in the past.
The 2nd resistance level at 1.0929 is identified as another overlap resistance, suggesting that it is another historical level where the price has faced resistance.
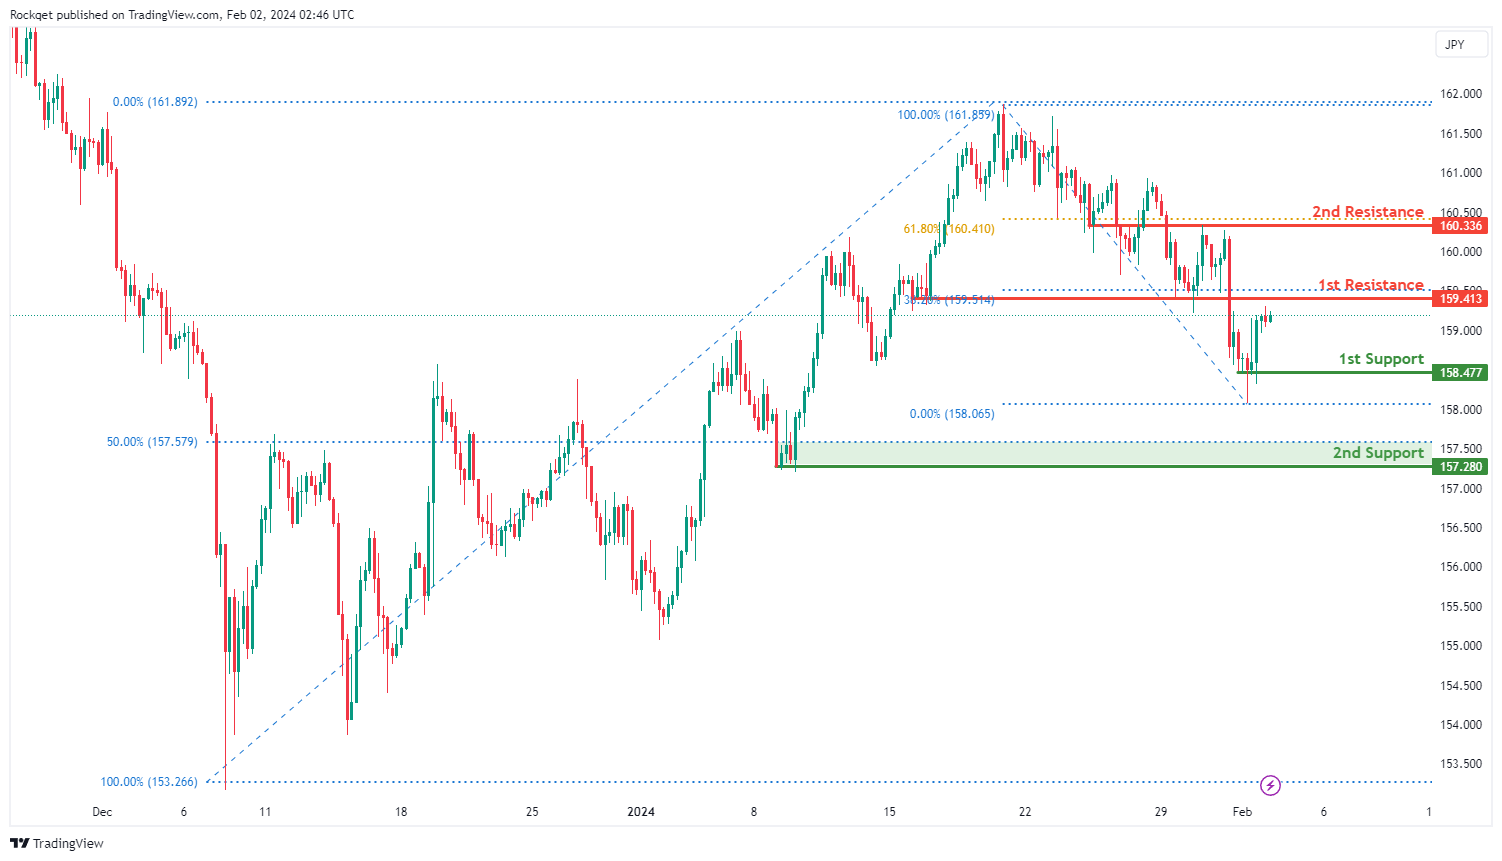
EUR/JPY:
The EUR/JPY chart currently exhibits a bullish overall momentum, indicating a prevailing upward trend. Price could potentially experience a bullish continuation towards the 1st resistance level.
The 1st support at 158.477 is considered favorable for being a swing low support, indicating a historical level where buying interest has previously emerged.
The 2nd support at 157.280 is recognized as a swing low support and aligns with the 50% Fibonacci Retracement, adding confluence to its significance.
On the resistance side, the 1st resistance at 159.413 is highlighted as a pullback resistance and coincides with the 38.20% Fibonacci Retracement, potentially acting as a barrier to the bullish momentum.
The 2nd resistance at 160.336 is identified as an overlap resistance and aligns with the 61.80% Fibonacci Retracement, further strengthening the potential resistance zone.
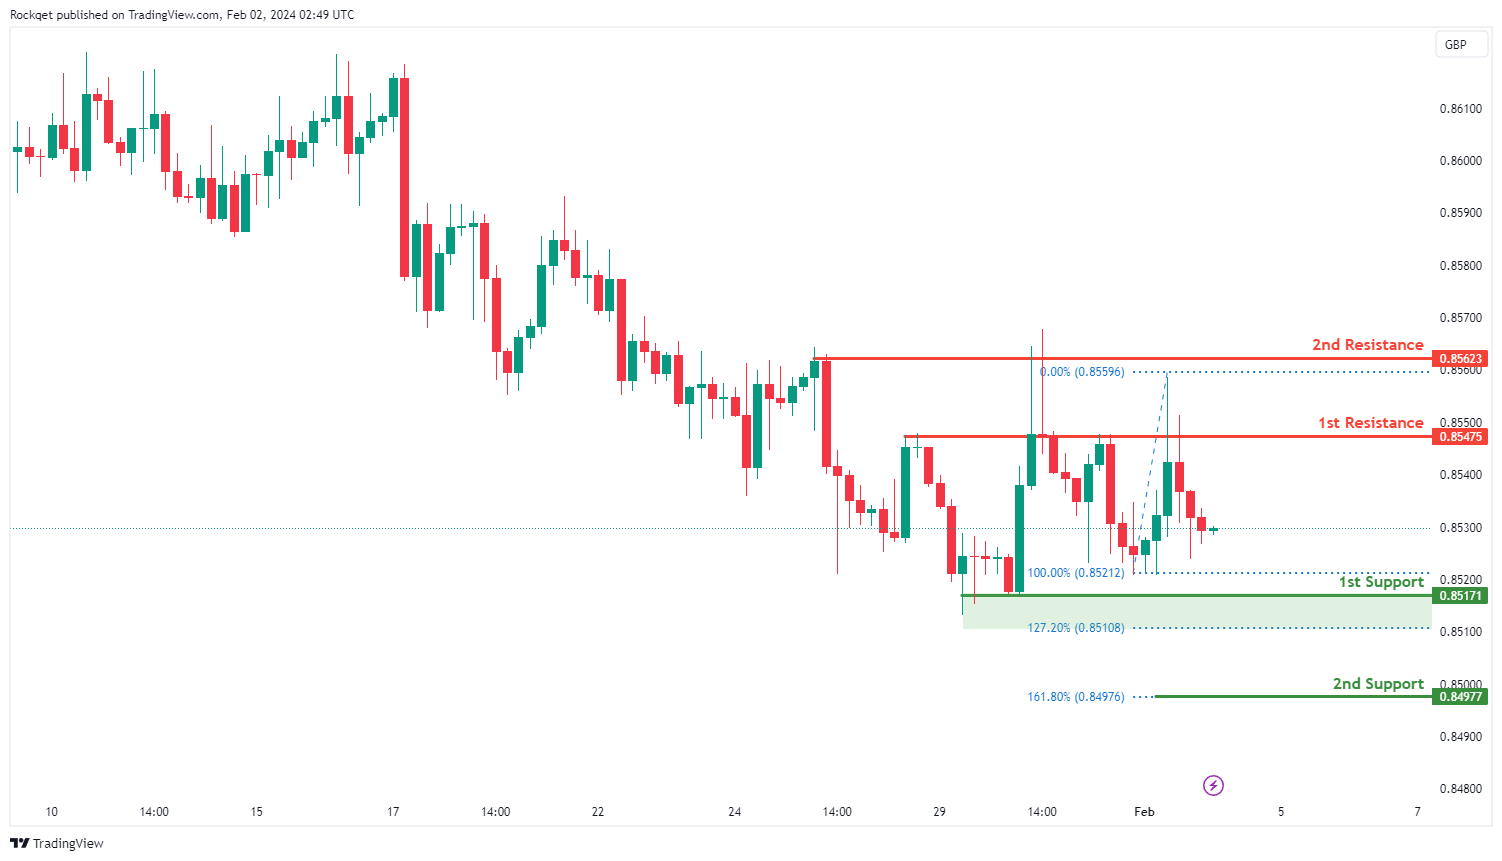
EUR/GBP:
The EUR/GBP chart currently indicates a neutral overall momentum, suggesting a lack of a clear trend direction. Price could potentially experience fluctuations between the 1st support and 1st resistance levels.
The 1st support at 0.85171 is considered favorable for being a swing low support and aligns with the 127.20% Fibonacci Extension, providing a historical level where buying interest has previously emerged.
The 2nd support at 0.84977 is identified as the 161.80% Fibonacci Extension, adding confluence to its significance.
On the resistance side, the 1st resistance at 0.85450 is highlighted as a pullback resistance, potentially acting as a barrier to upward movements.
The 2nd resistance at 0.85623 is recognized as another pullback resistance, suggesting a potential upper limit to the price fluctuations.
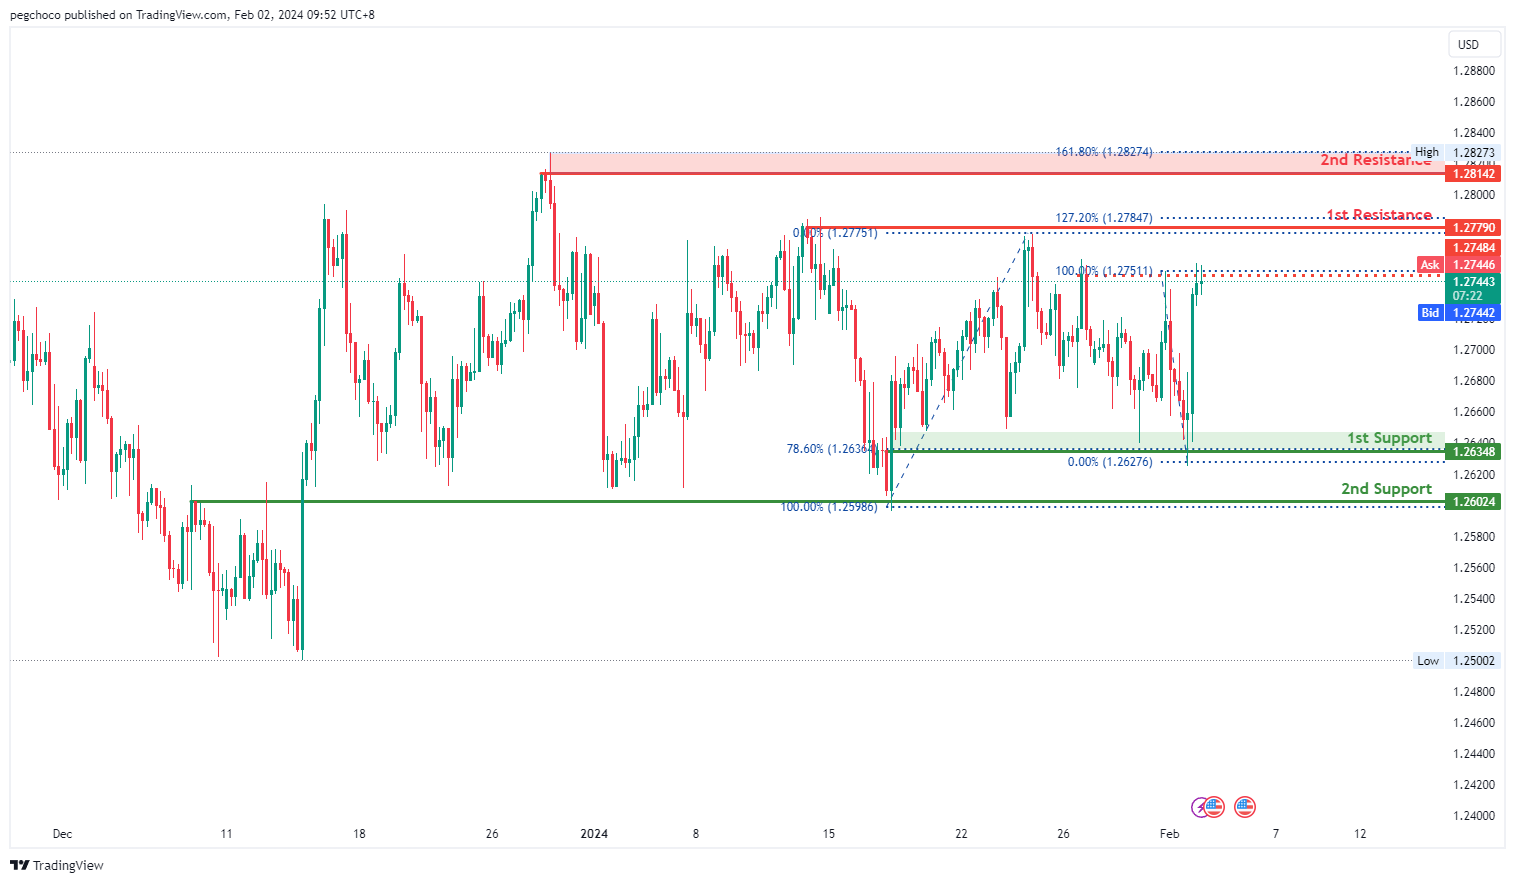
GBP/USD:
The GBP/USD chart currently exhibits a bearish overall momentum, indicating a downward trend. As per the analysis, the price could potentially undergo a bearish reaction off the 1st resistance level and subsequently drop to the 1st support.
The 1st support level at 1.2648 is identified as a multi-swing low support and is reinforced by the presence of the 78.60% Fibonacci Retracement, suggesting that it has historical significance and may act as a strong support level where buying interest could emerge.
There is also a 2nd support level at 1.2601, described as an overlap support, further emphasizing its importance as a potential support zone.
On the resistance side, the 1st resistance level at 1.2779 is categorized as a multi-swing high resistance and is reinforced by the presence of the 127.20% Fibonacci Extension.
The 2nd resistance level at 1.2815 is identified as a swing high resistance and is further reinforced by the presence of the 161.80% Fibonacci Extension. Additionally, there is an intermediate resistance level at 1.2748, categorized as a multi-swing high resistance.
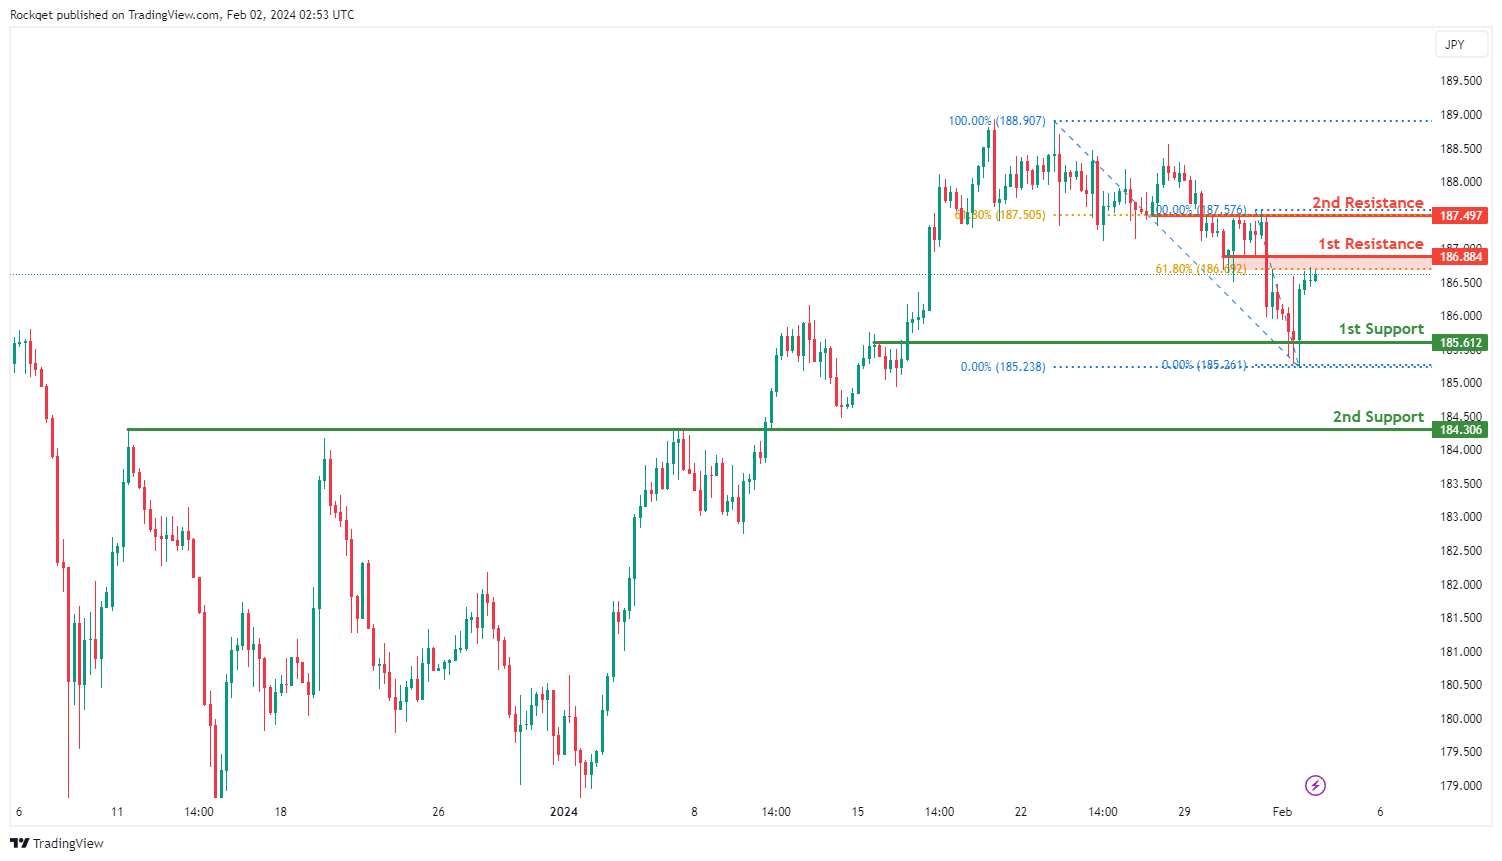
GBP/JPY:
The GBP/JPY chart currently indicates a bullish overall momentum, suggesting a prevailing upward trend. There are indications that the price could potentially continue its bullish movement towards the 1st resistance level.
The 1st support at 185.612 is considered favorable as it aligns with an overlap support, indicating a historical level where buying interest has previously emerged.
Additionally, the 2nd support at 184.306 is identified as a pullback support, providing additional strength to the potential support zone.
On the resistance side, the 1st resistance at 186.884 is highlighted as it coincides with an overlap resistance and the 61.80% Fibonacci Retracement, suggesting a potential barrier to the bullish momentum.
The 2nd resistance at 187.497 is also recognized as an overlap resistance and aligns with the 61.80% Fibonacci Retracement, adding further significance.
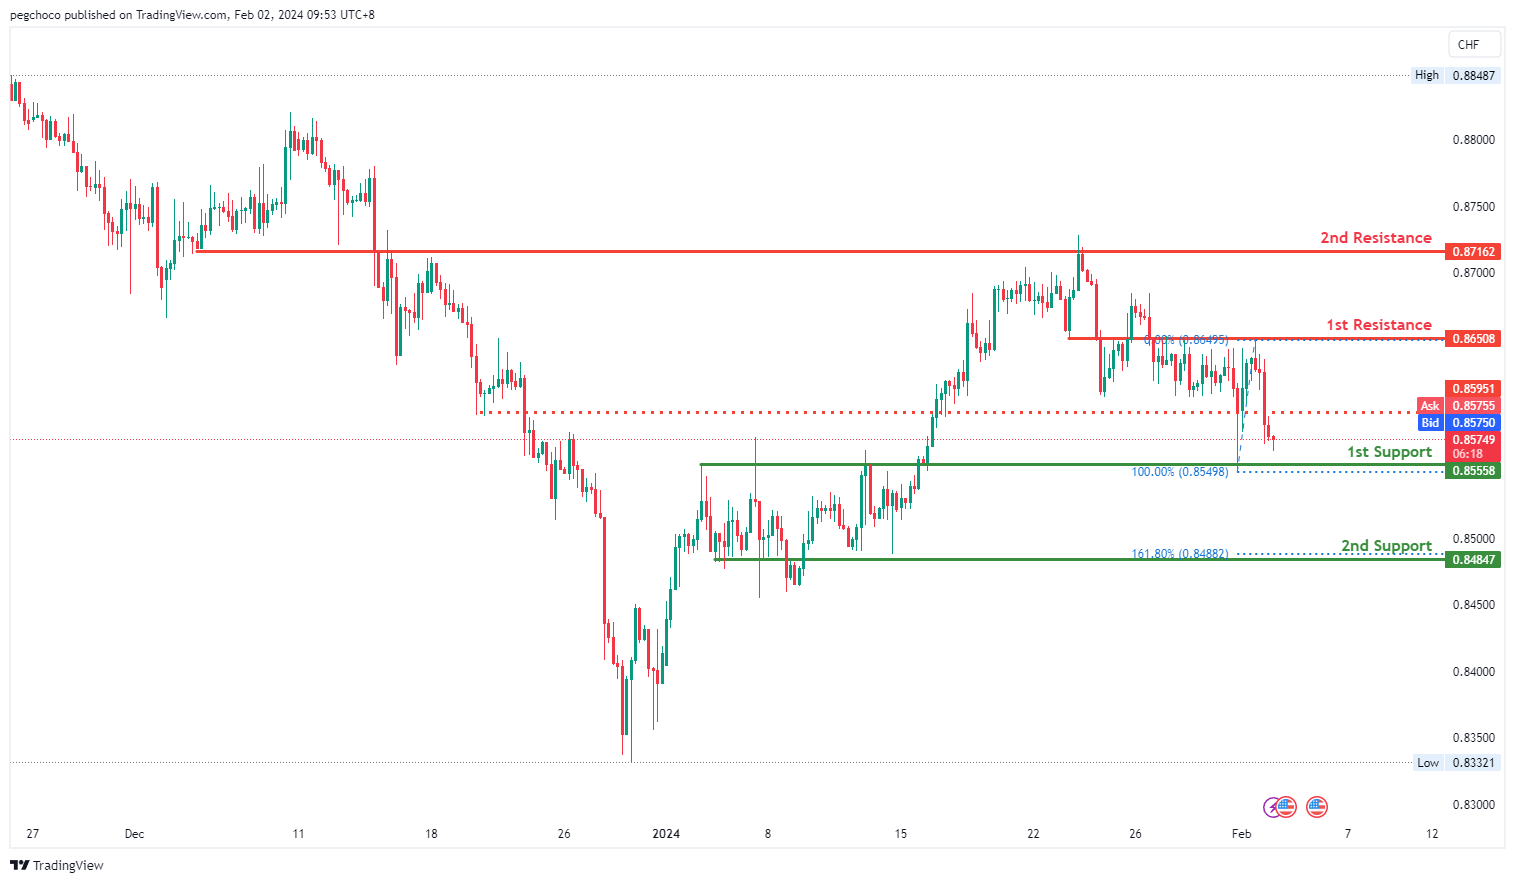
USD/CHF:
The USD/CHF chart currently exhibits a bearish overall momentum, indicating a downward trend. According to the analysis, the price could potentially experience a rise towards the 1st resistance level in the short term before reversing off it and dropping towards the 1st support.
The 1st support level at 0.8555 is identified as an overlap support, suggesting that it represents a historical point where the price has found support in the past.
There is also a 2nd support level at 0.8840, described as a pullback support and associated with the 161.80% Fibonacci Extension, further emphasizing its importance as a potential support zone.
On the resistance side, the 1st resistance level at 0.8650 is categorized as an overlap resistance, indicating that it represents a historical point where the price has encountered resistance in the past.
The 2nd resistance level at 0.8716 is also identified as an overlap resistance, further reinforcing its significance as a potential barrier to upward movement. Additionally, there is an intermediate resistance level at 0.8595, categorized as a pullback resistance.
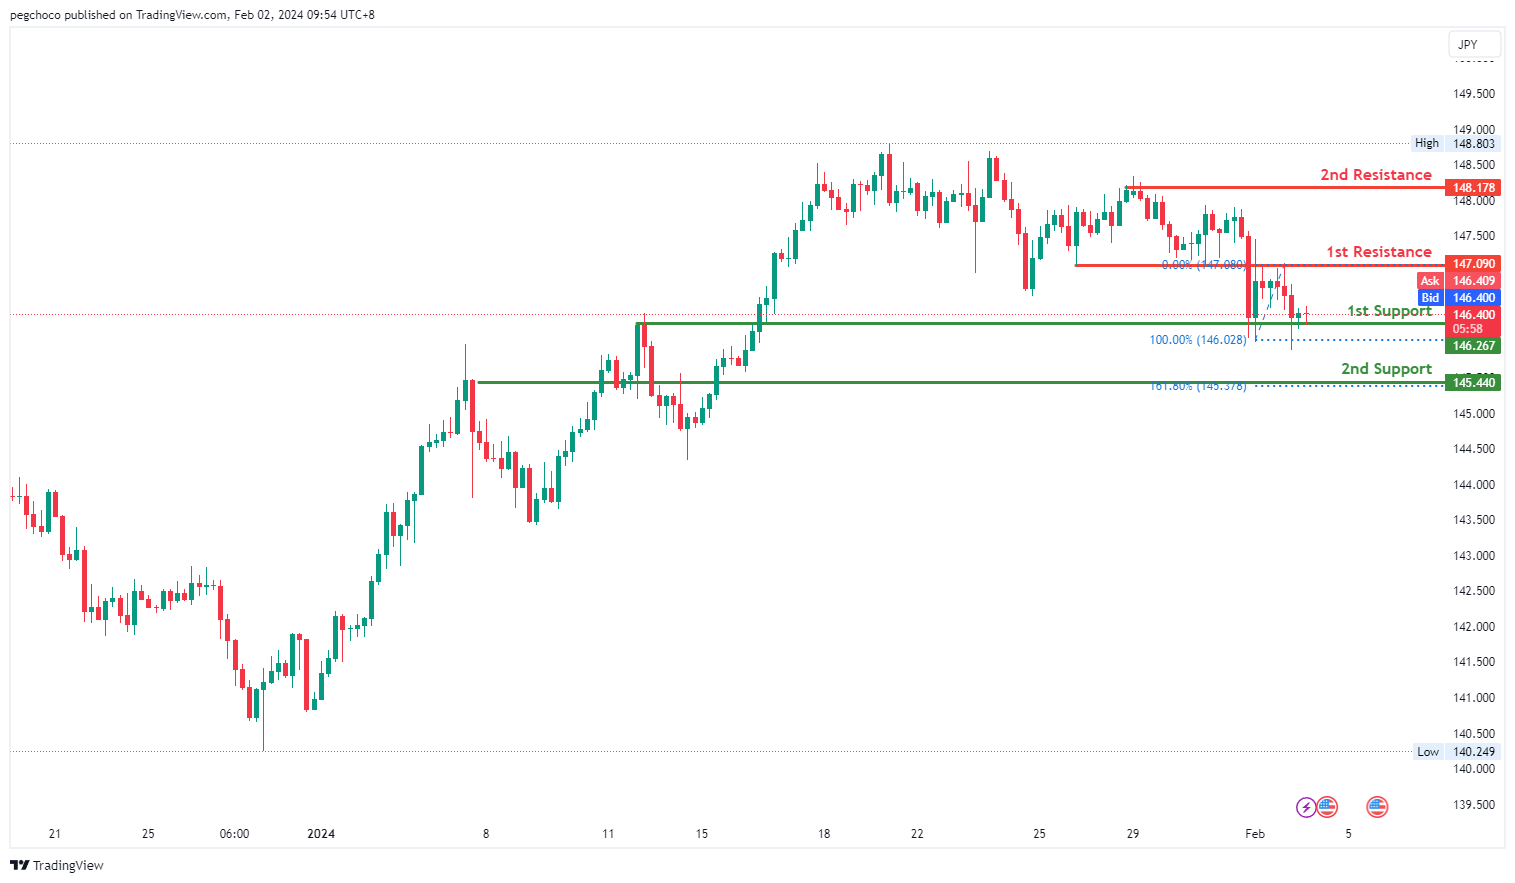
USD/JPY:
The USD/JPY chart currently exhibits a bearish overall momentum, indicating a downward trend. According to the analysis, the price could potentially experience a rise towards the 1st resistance level in the short term before reversing off it and dropping towards the 1st support.
The 1st support level at 146.26 is identified as an overlap support and is reinforced by the presence of the 127.20% Fibonacci Extension. This suggests that it has historical significance and could potentially act as a strong support level where buying interest may emerge.
There is also a 2nd support level at 145.44, described as a pullback support and associated with the 161.80% Fibonacci Extension, further emphasizing its importance as a potential support zone.
On the resistance side, the 1st resistance level at 147.09 is categorized as an overlap resistance, indicating that it represents a historical point where the price has encountered resistance in the past.
The 2nd resistance level at 148.17 is identified as a multi-swing high resistance, suggesting that it is another historical level where the price has faced resistance.
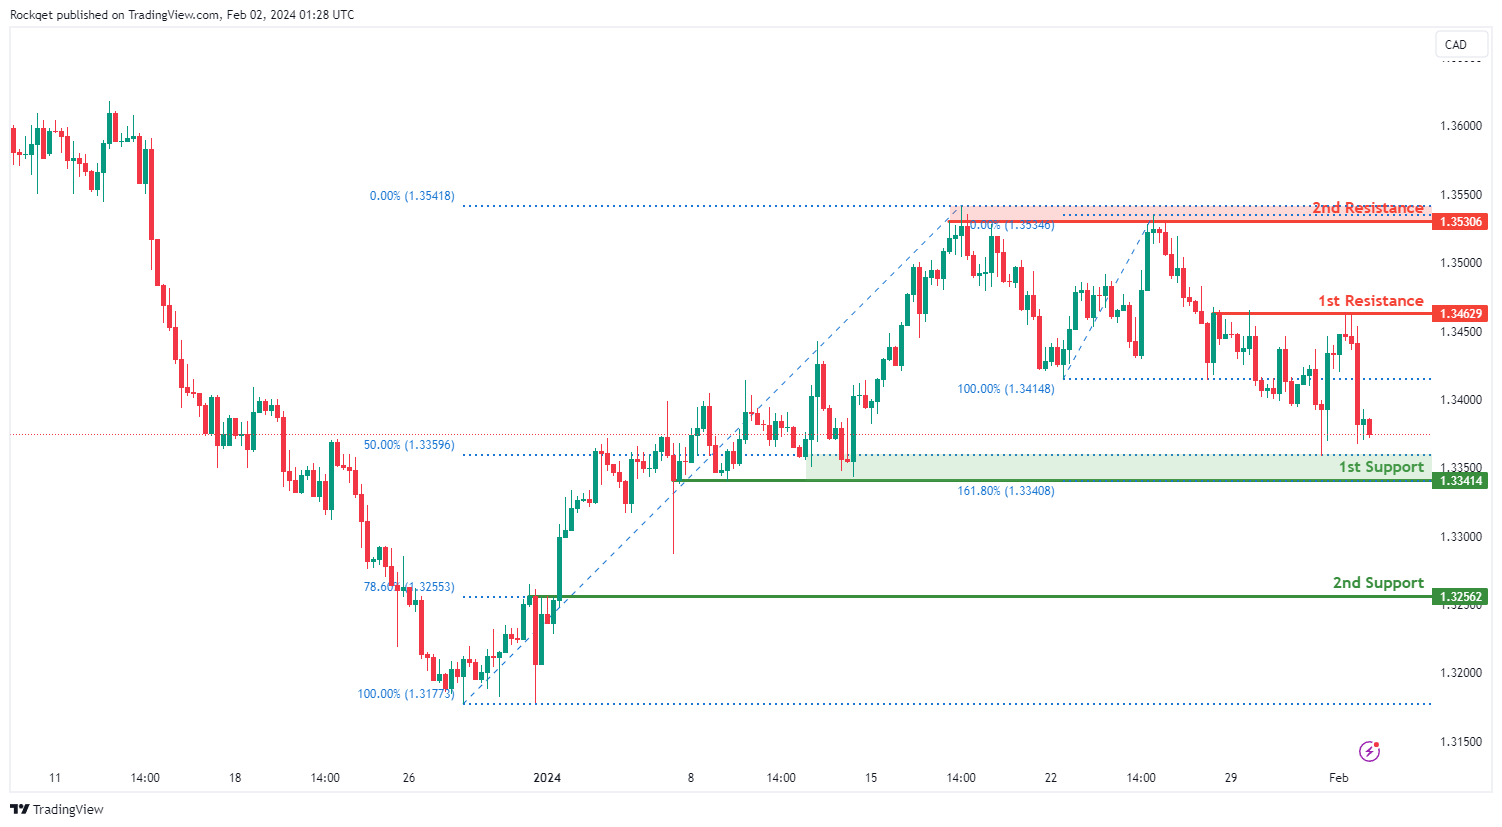
USD/CAD:
The USD/CAD chart currently exhibits an overall bearish momentum. In this context, there is a potential scenario for price to make a bearish continuation towards the 1st support level.
The 1st support level at 1.3341 is identified as a pullback support that aligns with a confluence of Fibonacci levels i.e. the 50.00% Retracement and the 161.80% Extension. Further below, the 2nd support level at 1.3256 is also marked as a pullback support that aligns with the 78.60% Fibonacci Retracement level, further emphasizing its importance as a potential support zone.
On the resistance side, the 1st resistance level at 1.3462 is identified as a pullback resistance. Higher up, the 2nd resistance level at 1.3530 is noted as a multi-swing-high resistance, further highlighting its importance as a potential resistance point.
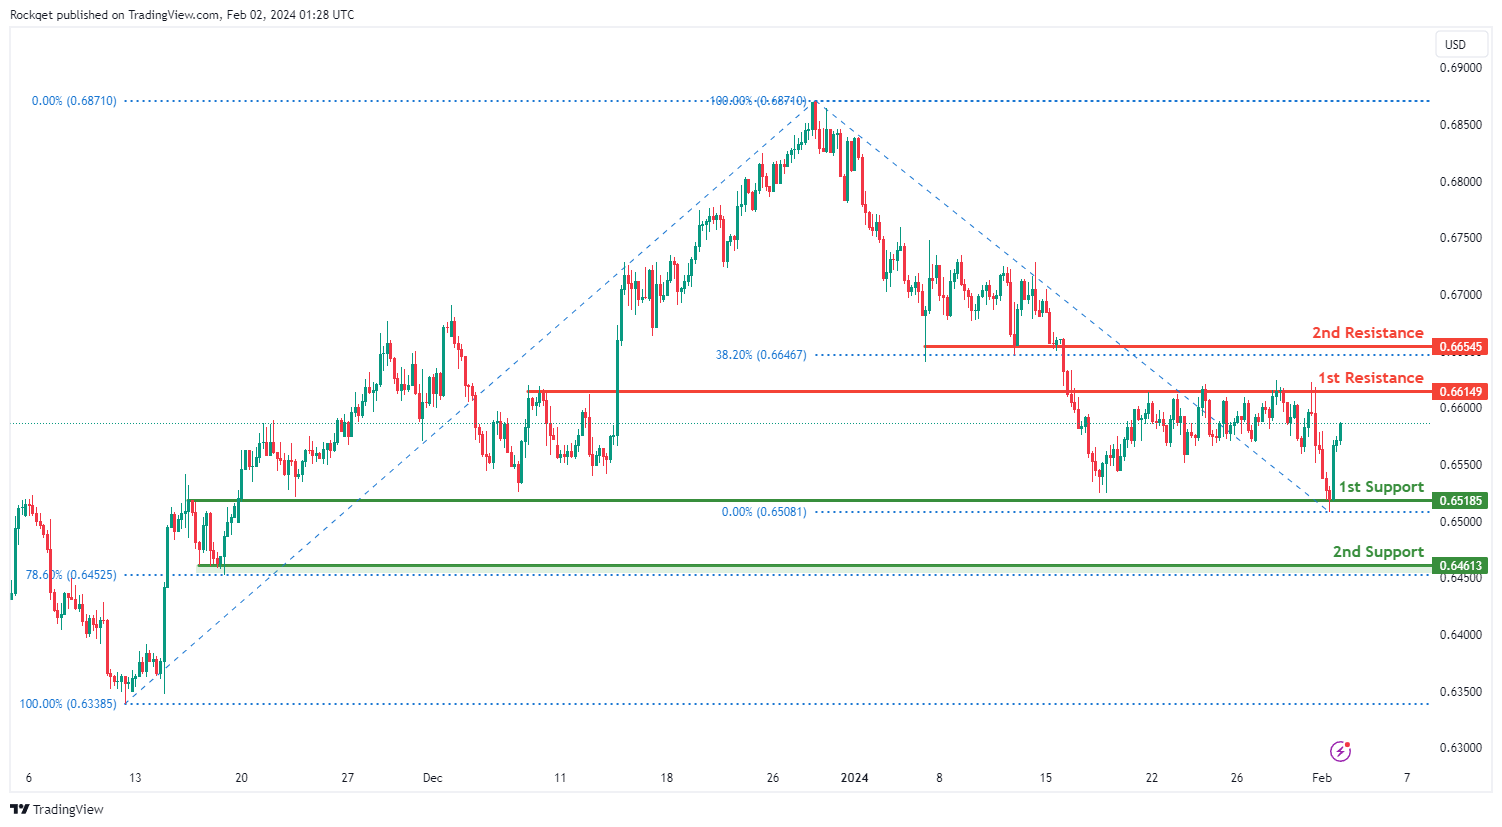
AUD/USD:
The AUD/USD chart currently exhibits a neutral bias. In this context, there is a potential scenario for price to fluctuate between the 1st resistance and 1st support.
The 1st resistance level at 0.6614 is identified as a pullback resistance. Higher up, the 2nd resistance level at 0.6654 is also marked as a pullback resistance that aligns with the 38.20% Fibonacci Retracement level, further highlighting its importance as a potential resistance point.
On the support side, the 1st support level at 0.6518 is identified as a pullback support. Further below, the 2nd support level at 0.6461 is also noted as a pullback support that aligns close to the 78.60% Fibonacci Retracement level, further emphasizing its importance as a potential support zone.
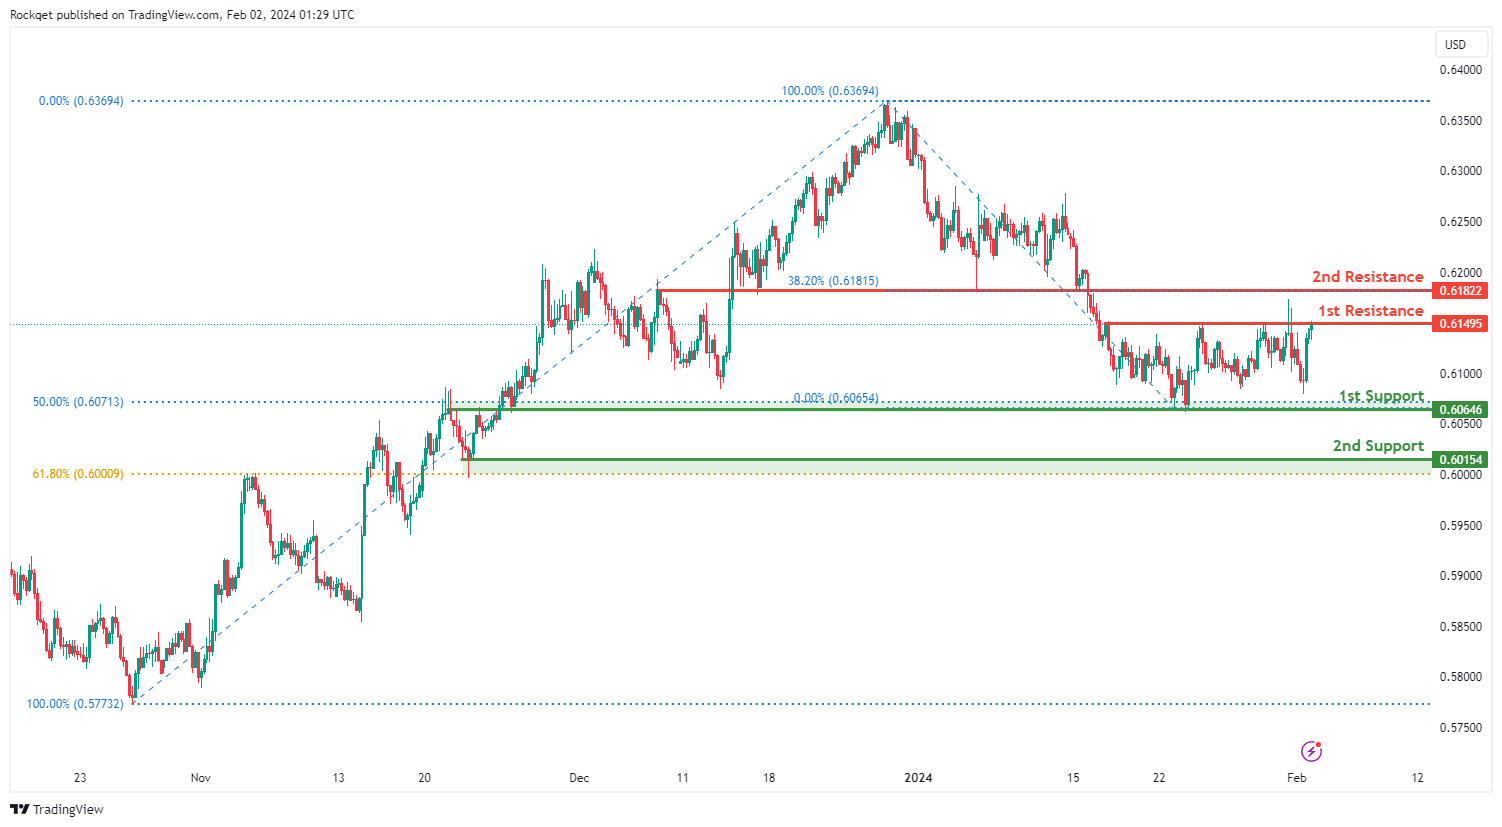
NZD/USD
The NZD/USD chart currently exhibits a neutral bias. In this context, there is a potential scenario for price to fluctuate between the 1st resistance and 1st support.
The 1st resistance level at 0.6149 is identified as a pullback resistance. Higher up, the 2nd resistance level at 0.6182 is marked as an overlap resistance that aligns with the 38.20% Fibonacci Retracement level, further highlighting its importance as a potential resistance point.
On the support side, the 1st support level at 0.6064 is identified as an overlap support that aligns with the 50.00% Fibonacci Retracement level. Further below, the 2nd support level at 0.6015 is noted as a pullback support that aligns close to the 61.80% Fibonacci Retracement level, further emphasizing its importance as a potential support zone.
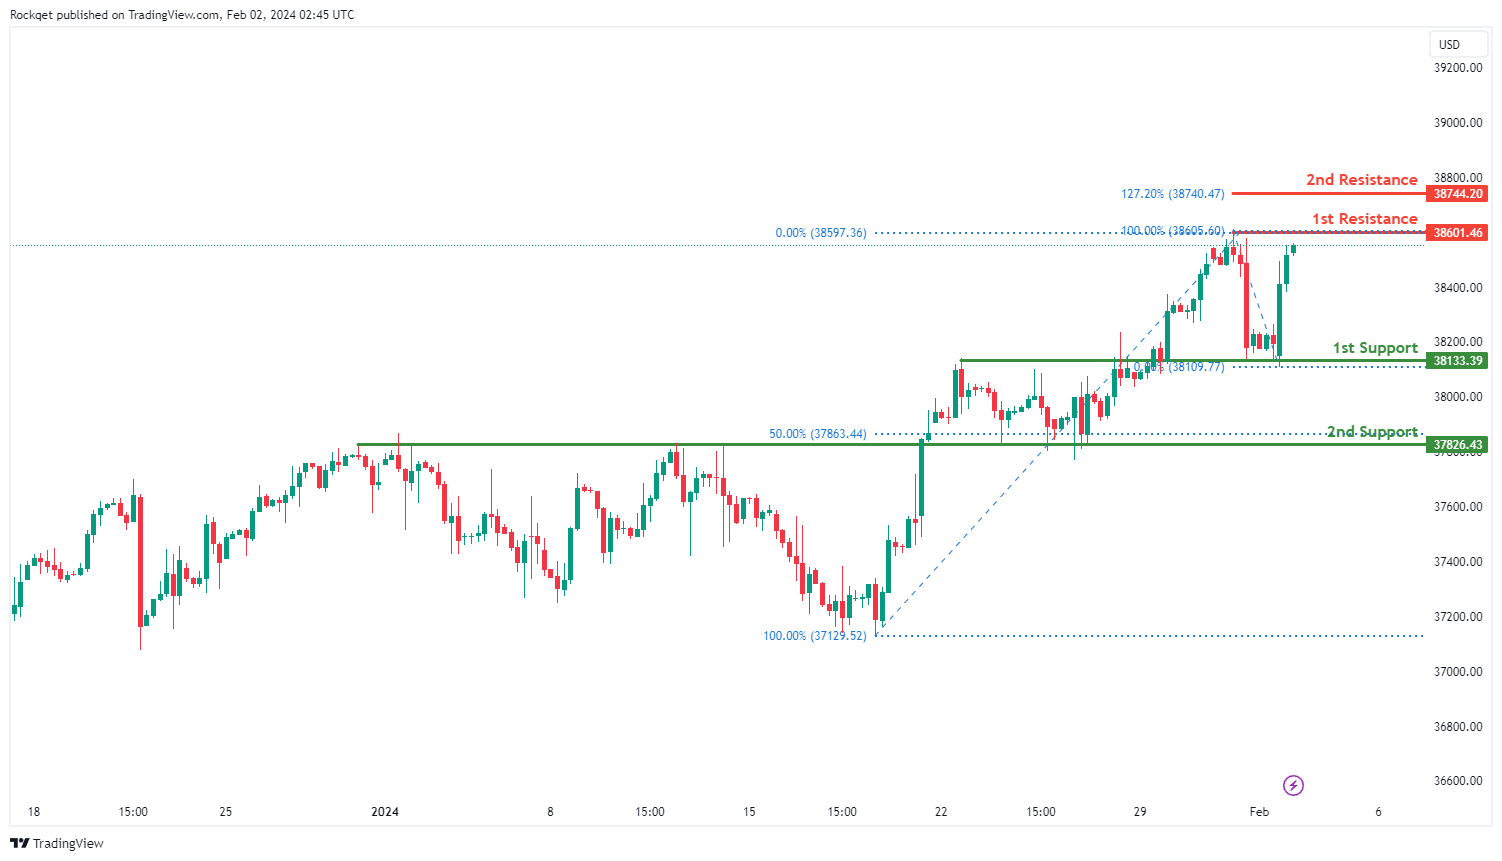
DJ30:
The DJ30 chart currently displays a bullish overall momentum, indicating a prevailing upward trend. There are indications that the price could potentially continue its bullish movement towards the 1st resistance level.
The 1st support at 38133.39 is considered favorable as it aligns with an overlap support, indicating a historical level where buying interest has previously emerged.
Additionally, the 2nd support at 37826.43 is identified as an overlap support and coincides with the 50% Fibonacci Retracement, providing additional strength to the potential support zone.
On the resistance side, the 1st resistance at 38601.46 is highlighted as it aligns with a swing high resistance, suggesting a potential barrier to the bullish momentum.
The 2nd resistance at 38744.20 is recognized as it coincides with the 127.20% Fibonacci Extension, adding further significance to this resistance level.
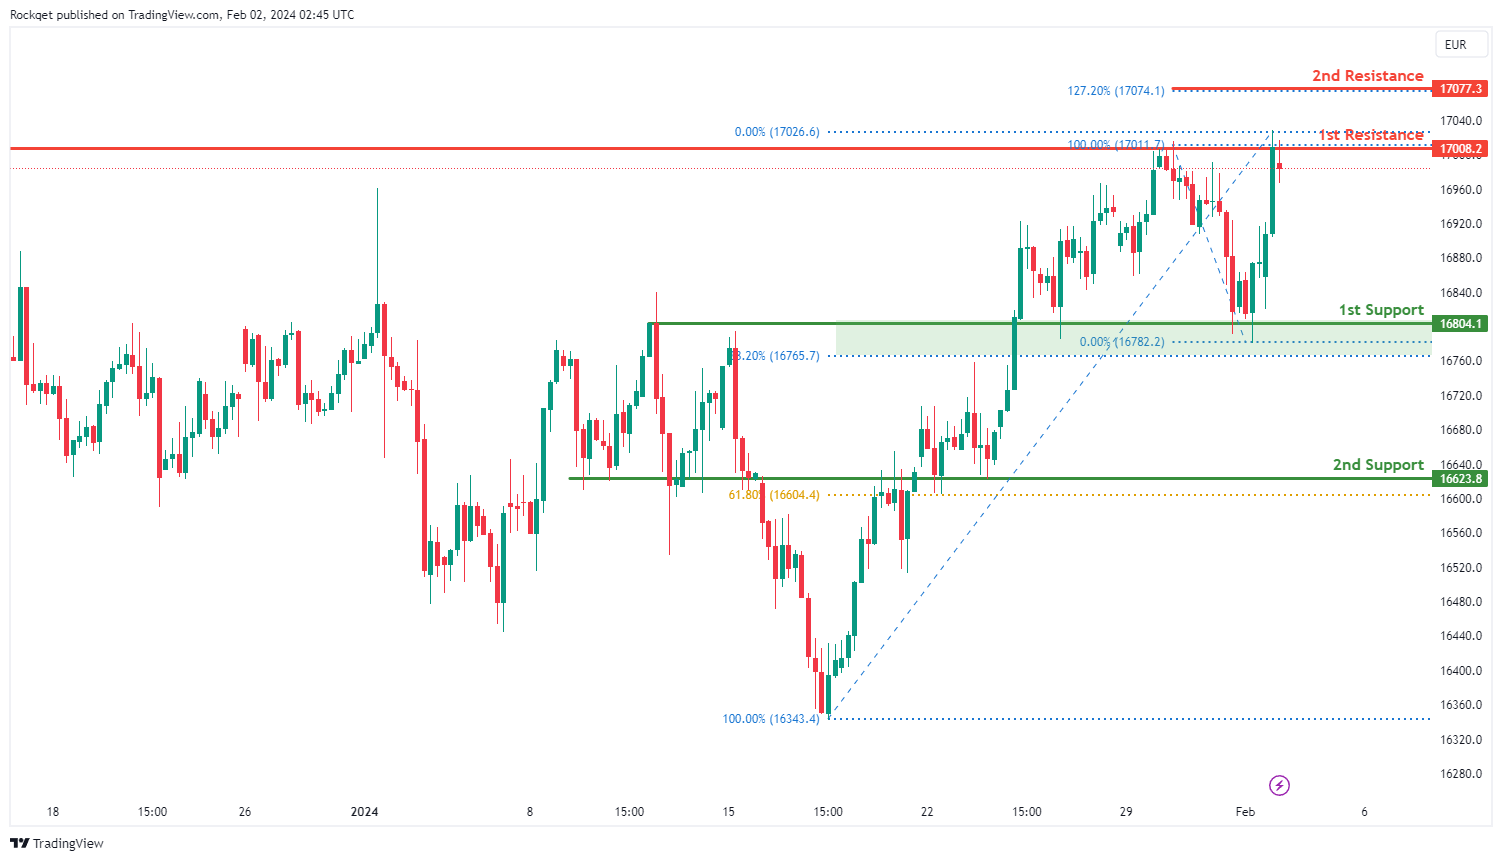
GER40:
The GER40 chart currently exhibits a bullish overall momentum, suggesting a prevailing upward trend. Several factors contribute to this bullish momentum, indicating a potential continuation of the upward movement in the price.
The 1st support at 16804.1 is considered favorable for several reasons. It aligns with an overlap support, indicating a historical level where buying interest has previously emerged. Additionally, this support level coincides with the 38.20% Fibonacci Retracement, adding confluence to its significance.
The 2nd support at 16623.8 is identified as an overlap support and aligns with the 61.80% Fibonacci Retracement, providing additional strength to the potential support zone.
On the resistance side, the 1st resistance at 17008.2 is highlighted as it aligns with multi-swing high resistance, suggesting a potential barrier to the bullish momentum.
The 2nd resistance at 17077.3 is recognized as it coincides with the 127.20% Fibonacci Extension, adding further significance to this resistance level.
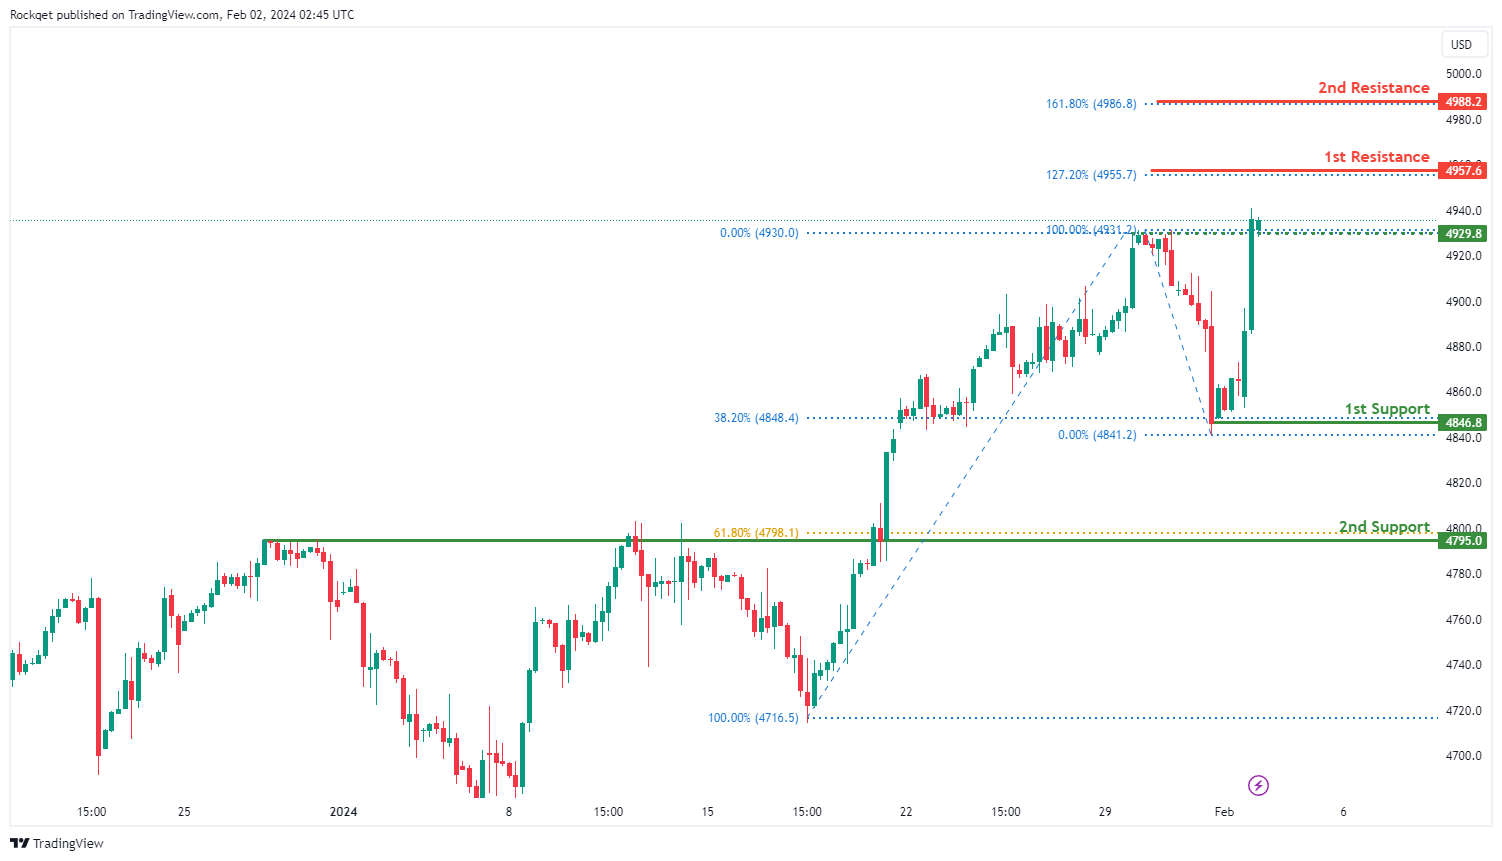
US500:
The US500 chart currently demonstrates a bullish overall momentum, indicating a prevailing upward trend. Several factors contribute to this bullish momentum, suggesting the potential for continued upward movement in the price.
The 1st support at 4846.8 is considered favorable for multiple reasons. Firstly, it is identified as a swing low support, signifying a historical level where buying interest has previously emerged. Additionally, this support level aligns with the 38.20% Fibonacci Retracement, adding confluence to its significance.
The 2nd support at 4795.0 is recognized as an overlap support and coincides with the 61.80% Fibonacci Retracement, providing additional strength to the potential support zone.
The intermediate support at 4929.8 is identified as a pullback support, contributing further to the robustness of the support levels.
On the resistance side, the 1st resistance at 4957.6 is highlighted as it aligns with the 127.20% Fibonacci Extension, suggesting a potential barrier to the bullish momentum.
The 2nd resistance at 4988.2 is also recognized, coinciding with the 161.80% Fibonacci Extension, adding additional significance to this resistance level.
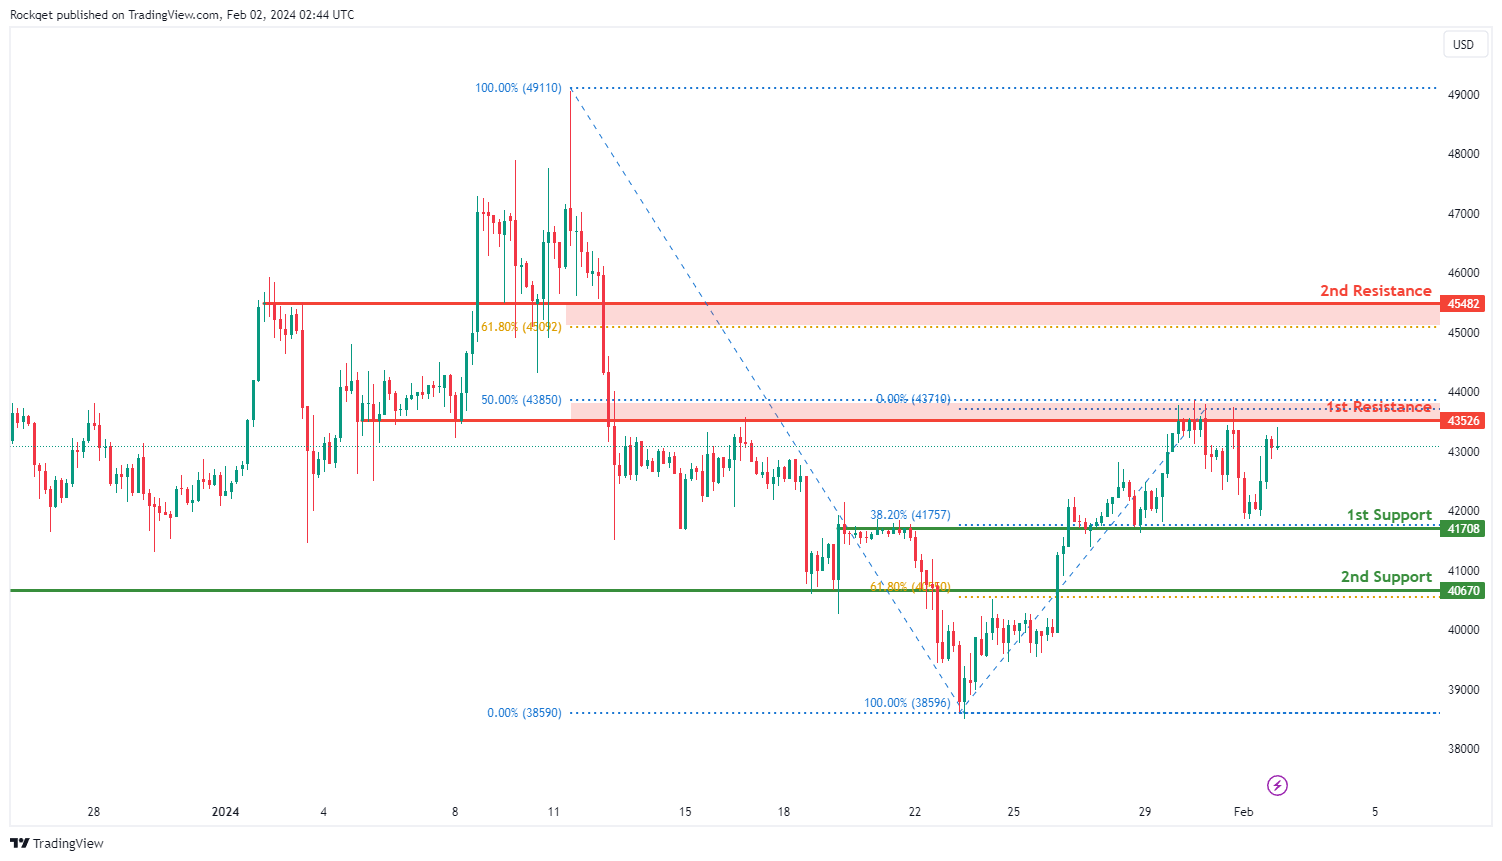
BTC/USD:
The BTC/USD chart currently exhibits a bullish overall momentum, suggesting a prevailing upward trend. Several factors contribute to this bullish momentum, indicating the potential for continued upward movement in the price.
The 1st support at 41708 is considered favorable for various reasons. Firstly, it is identified as an overlap support and aligns with the 38.20% Fibonacci Retracement, indicating a historical level where buying interest has previously emerged.
The 2nd support at 40670 is also recognized as an overlap support and coincides with the 61.80% Fibonacci Retracement, providing additional strength to the potential support zone.
On the resistance side, the 1st resistance at 43526 is highlighted as it aligns with the 50% Fibonacci Retracement, suggesting a potential barrier to the bullish momentum.
The 2nd resistance at 45482 is also recognized, coinciding with the 61.80% Fibonacci Retracement, adding additional significance to this resistance level.
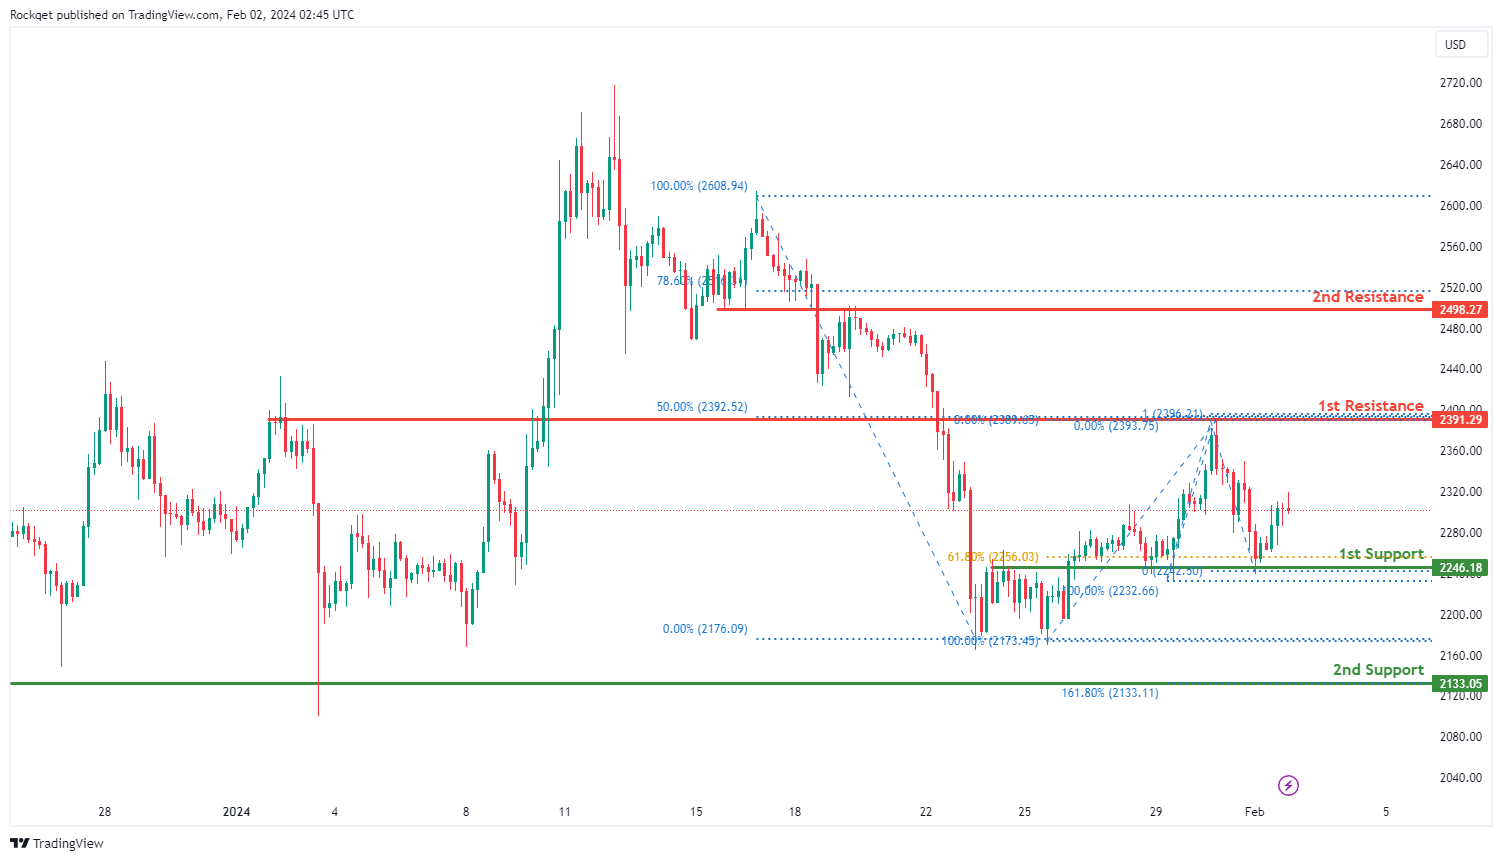
ETH/USD:
The ETH/USD chart currently demonstrates a bullish overall momentum, indicating a prevailing upward trend. Multiple factors contribute to this bullish sentiment, supporting the potential for sustained upward movement in the price.
The 1st support at 2246.18 is viewed favorably for several reasons. Firstly, it is recognized as an overlap support and coincides with the 61.80% Fibonacci Retracement, highlighting a historical level where buying interest has previously surfaced.
Additionally, the 2nd support at 2133.05 is identified as an overlap support and aligns with the 161.80% Fibonacci Extension, providing added strength to the potential support zone.
On the resistance side, the 1st resistance at 2391.29 is emphasized, aligning with the 50% Fibonacci Retracement and the 100% Fibonacci Projection. This suggests a potential obstacle to the bullish momentum.
The 2nd resistance at 2498.27 is also recognized, coinciding with the 78.60% Fibonacci Retracement, adding further significance to this resistance level.
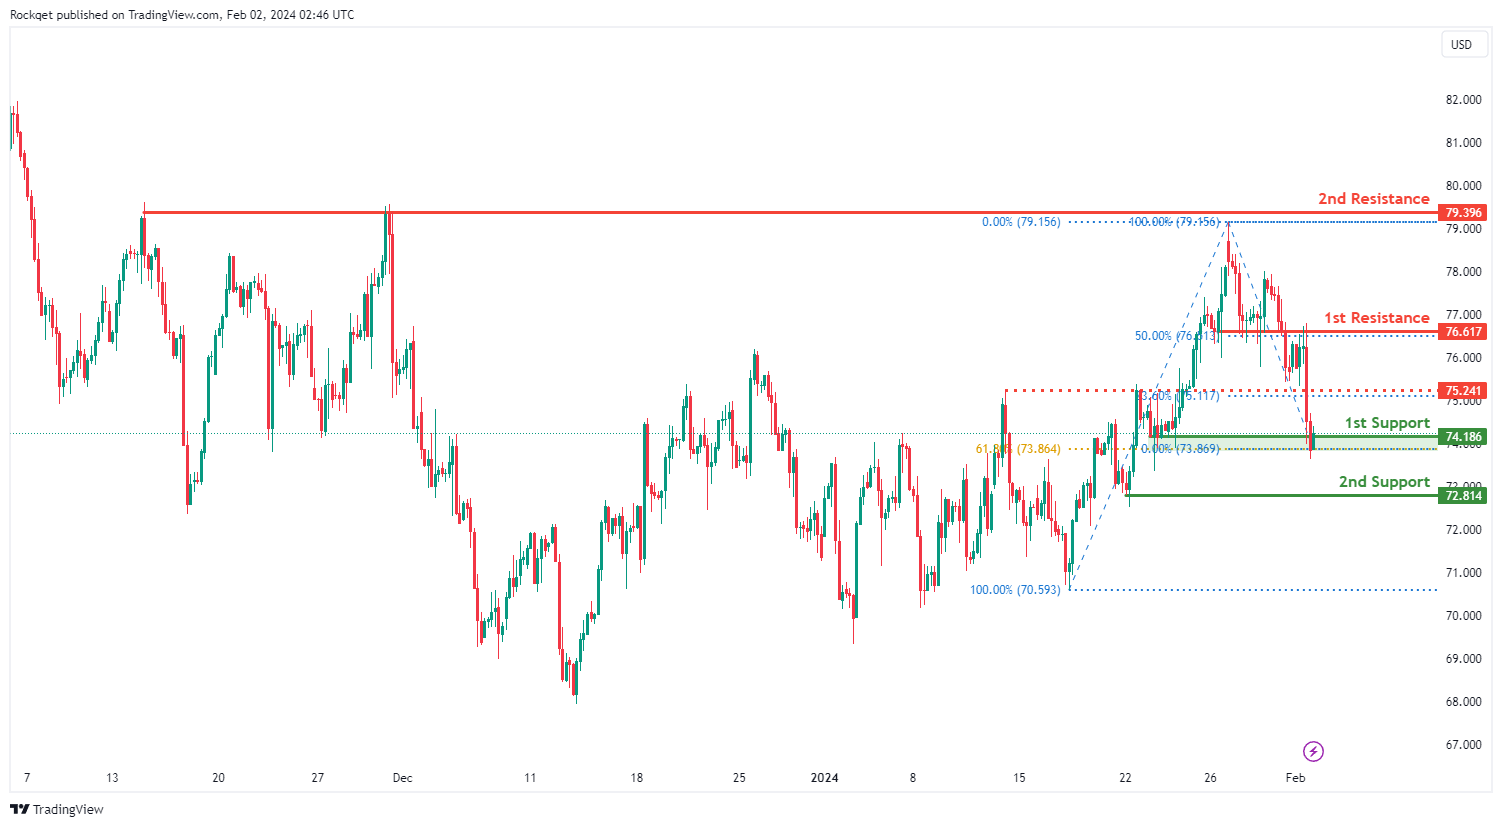
WTI/USD:
The WTI (West Texas Intermediate) chart currently exhibits a bearish momentum. However, there is a potential scenario for price to rise towards the intermediate resistance before resuming the downtrend.
The intermediate resistance at 75.24 is identified as a pullback resistance that aligns with the 23.60% Fibonacci retracement level while the 1st resistance level at 76.61 is identified as an overlap resistance that aligns with the 50.00% Fibonacci retracement level. Higher up, the 2nd resistance level at 79.39 is noted as a multi-swing-high resistance, further highlighting its importance as a potential resistance point.
On the support side, the 1st support level at 74.18 is identified as a pullback support that aligns close to the 61.80% Fibonacci Retracement level. Further below, the 2nd support level at 72.81 is also marked as a pullback support, reinforcing its significance as a key support level.
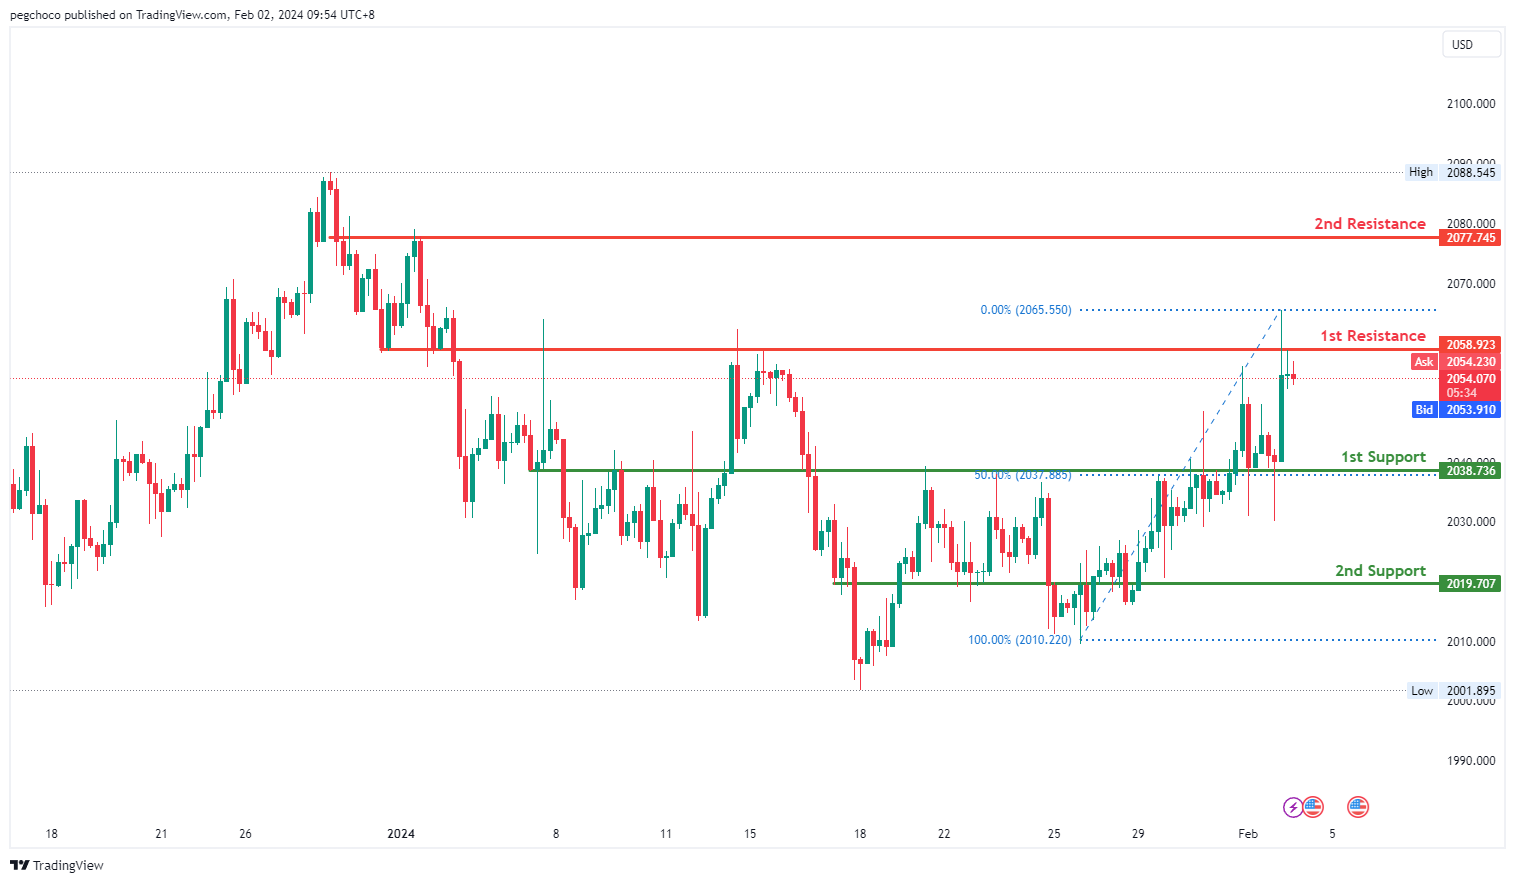
XAU/USD (GOLD):
The XAU/USD chart currently exhibits a bearish overall momentum, indicating a downward trend. According to the analysis, the price could potentially experience a bearish reaction off the 1st resistance level and drop to the 1st support.
The 1st support level at 2038.73 is identified as an overlap support and is reinforced by the presence of the 50% Fibonacci Retracement. This suggests that it has historical significance and could potentially act as a strong support level where buying interest may emerge.
There is also a 2nd support level at 2019.70, described as an overlap support, which further emphasizes its importance as a potential support zone.
On the resistance side, the 1st resistance level at 2058.92 is categorized as an overlap resistance, indicating that it represents a historical point where the price has encountered resistance in the past.
The 2nd resistance level at 2077.74 is also identified as an overlap resistance, suggesting that it is another historical level where the price has faced resistance.
NFP to conclude eventful week, 10-year yield in focus
Today's US Non-Farm Payroll report is poised to be the focal point, concluding a week brimming with significant market events. Expectations are set for moderation in headline job growth to 178k in January, from December's robust 216k. Additionally, unemployment rate is anticipated to inch higher to 3.8% from 3.7%, while the pace of average hourly earnings growth is projected to decelerate to 0.3% mom.
Preliminary indicators such as ADP private employment figure, which registered growth of only 107k, and a slight dip in ISM manufacturing employment component to 47.1, suggest potential softness in the headline job growth. However, wage growth aspect remains a wildcard, capable of influencing market dynamics significantly.
A key post-NFP development to watch is in 10-year yield, which has witnessed a marked decline throughout the week. The strong downside momentum now amplifies the likelihood that the overarching downward trend from 4.997 peak is resuming.
A weekly close below 3.785 support would corroborate the bearish case, and steer 10-year yield to 61.8% projection of 4.997 to 3.785 from 4.198 at 3.448 this quarter, before it could find a bottom. That would also keep Dollar pressured, in particular against Yen.
USD/JPY Forms Another Bullish Pattern, US NFP Report Next
Key Highlights
- USD/JPY is correcting gains from the 148.80 resistance zone.
- A key bullish flag is forming with resistance near 147.80 on the 4-hour chart.
- EUR/USD is gaining bearish momentum below the 1.0820 support.
- Gold prices could attempt a steady increase above the $2,050 resistance.
USD/JPY Technical Analysis
The US Dollar rallied above the 146.20 and 147.50 levels against the Japanese Yen. USD/JPY tested the 148.80 resistance and recently started a downside correction.
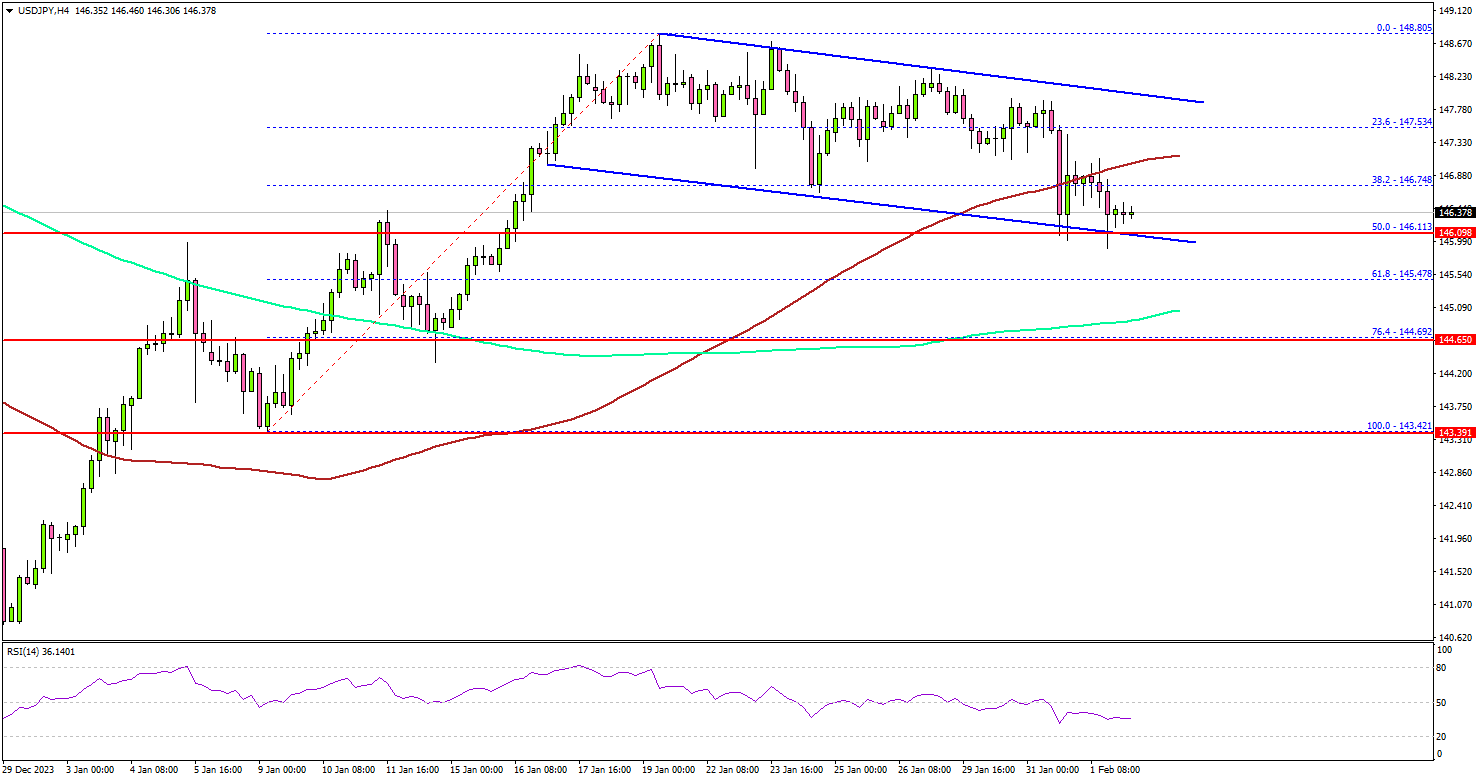
Looking at the 4-hour chart, the pair traded below the 148.20 and 148.00 levels. The bears were able to push the pair below the 23.6% Fib retracement level of the upward move from the 143.42 swing low to the 148.80 high.
There was a spike below the 100 simple moving average (red, 4 hours). The pair tested the 50% Fib retracement level of the upward move from the 143.42 swing low to the 148.80 high.
It seems like there is a key bullish flag forming with resistance near 147.80 on the same chart. The first major support sits near the 146.10 level. The next major support sits at the 200 simple moving average (green, 4 hours) at 145.00, below which the pair might gain bearish momentum.
On the upside, the bulls are facing hurdles near the 147.20 level. The next key resistance is near the 147.80 level. A close above the 147.80 zone could open the doors for more upsides. The next stop for the bulls might be 148.80. Any more gains might send USD/JPY toward the 150.00 level.
Looking at Gold, the bulls are still active, and it seems like they might aim for a steady increase above the $2,050 resistance if the US NFP figure misses the market forecast.
Economic Releases
- US nonfarm payrolls for Jan 2023 – Forecast 180K, versus 216K previous.
- US Unemployment Rate for Jan 2023 - Forecast 3.8%, versus 3.7% previous.