Sample Category Title
Gold pressing 2061 resistance after strong bounce
Gold jumped notably overnight following extended decline in benchmark treasury yields, as well as broad selloff in Dollar. Technically speaking, immediate attention is now on 2061.99 resistance. Decisive break there should confirm that corrective pullback from 2088.24 has completed with three waves down to 2001.58. More importantly, rally from 1972.86 would then be ready to resume through 2088.24. This will now be the favored case as long as 2029.79 minor support holds.
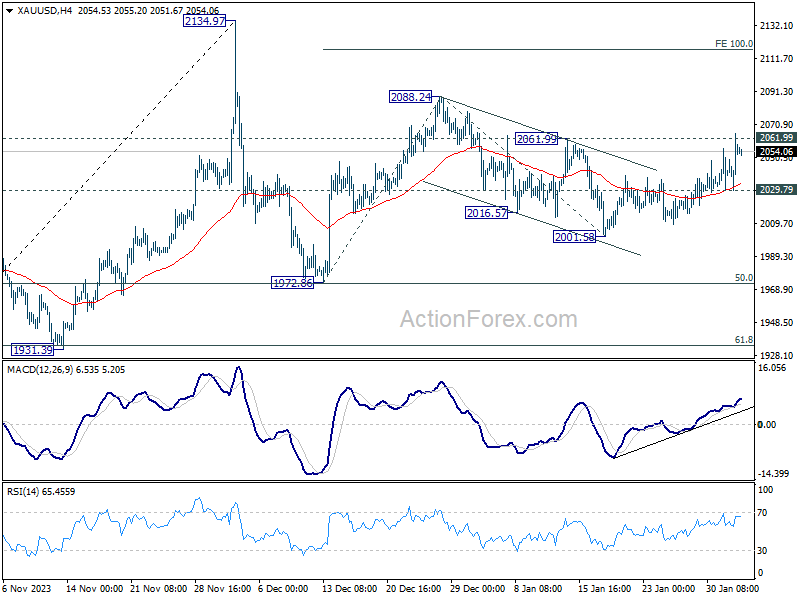
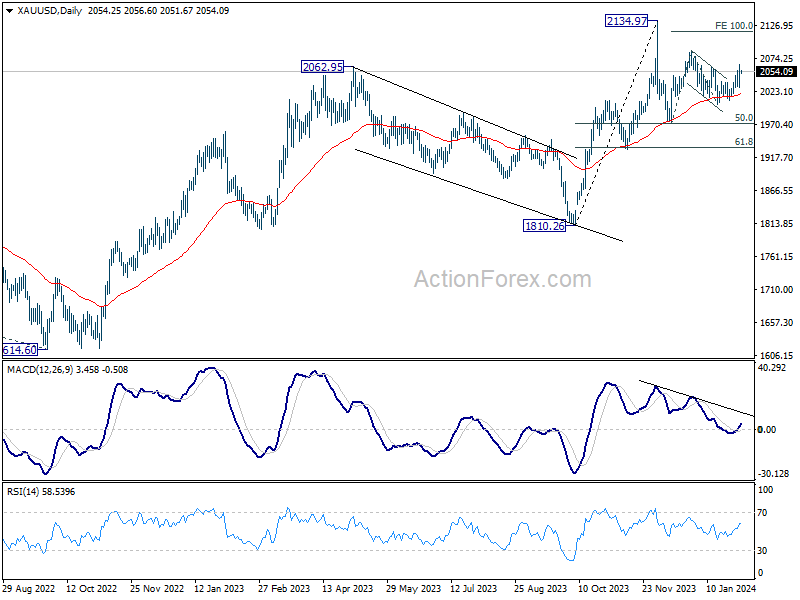
However, in the bigger picture, Gold might not be ready to break through 2134.97 record high yet. Current bounce from 1972.86 is seen as the second leg of a medium term corrective pattern from 2134.97. Upside will likely be limited by 100% projection of 1972.86 to 2088.24 from 2001.58 at 2116.96 to start the third leg.
BoC’s Macklem: Inflation decline expected to be gradual and uneven
BoC Governor Tiff Macklem emphasized the anticipated "gradual and uneven" decline in inflation towards 2% target. Speaking to the House of Commons Finance Committee, he noted that the journey to achieving inflation target "will be slow," highlighting the persistence of risks along the way.
The central bank's focus has evolved from assessing the sufficiency of current restrictive monetary policy stance to "how long to maintain the current restrictive stance," he added.
Macklem also pointed out that while the Bank is keen on starting to reduce interest rates to support economic growth, it remains vigilant. The decision to lower rates will be contingent on a clear trajectory towards the inflation target, ensuring premature policy easing does not derail the progress made.
He stated, "you do want to start lowering interest rates before you're all the way back, but you don't want to lower them until you're convinced…that you're really on a path to get there."
Additionally, the Governor reiterated the Bank's readiness to adjust rates upwards should "new developments" warrant further action to curb inflation.
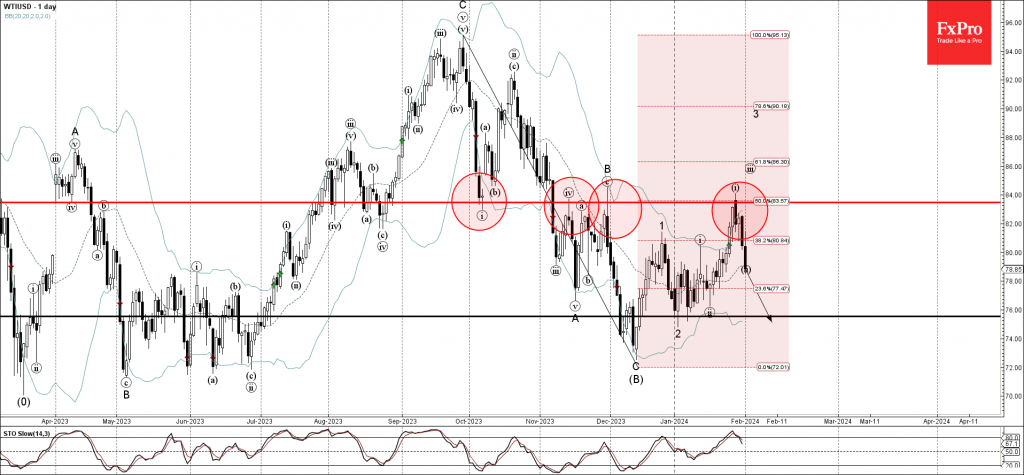
WTI Wave Analysis
- WTI reversed from resistance level 83.50
- Likely to fall to support level 76.00
WTI crude oil falling after the price reversed down from the pivotal resistance level 83.50 (former strong support from October), which has been reversing the price from November.
The resistance level 83.50 was strengthened by the upper daily Bollinger Band and by the intersecting 50% Fibonacci retracement of the earlier downward impulse from September.
WTI can be expected to fall further to the next support level 76.00 (low of wave 2 from the start of December).
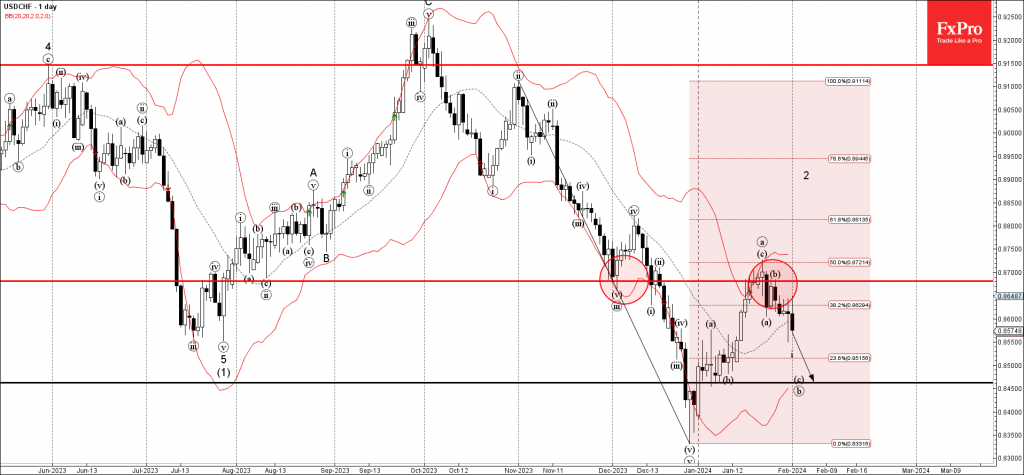
USDCHF Wave Analysis
- USDCHF reversed from resistance level 0.8680
- Likely to fall to support level 0.8460
USDCHF currency pair recently reversed down from the key resistance level 0.8680, former strong support from August and December.
The resistance level 0.8680 was strengthened by the upper daily Bollinger Band and by the 50% Fibonacci correction of the sharp downward impulse from October.
USDCHF can be expected to fall further to the next support level 0.8460 (low of wave b from the start of this month, target for the completion of the active wave b).
ISM Shows Contraction in U.S. Manufacturing Sector Slowed in January
The ISM Manufacturing Index ticked up to 49.1 in January, handily beating the 47.2 level markets had expected. Four industries reported growth in January, up from one in December.
The new orders sub-index flipped to growth, rising 5.5 percentage points (pp) to 52.5. Unfortunately, the contraction in new export orders deepened as the index tumbled 4.7 pp to 45.2. The employment index continued to signal contraction (47.1) for fourth month in a row.
Production flipped back to growth in January, rising 0.5 pp to 50.4. Despite an uptick in demand, the backlog of orders continued to fall for the 16th month in a row (44.7).
The prices paid sub-index jumped 7.7 points to 52.9. This is the first time raw materials prices have risen since April 2023.
Key Implications
The headline figure suggests another month of contraction in the manufacturing sector, but it wasn't without a silver lining. The new orders subindex rose to its highest level since May 2022 and broke a streak of 16 consecutive months of decline.
Overall, this month's manufacturing report is a solid data point showing that the weakness in the manufacturing sector may have found a floor. Looking ahead to the rest of the year, the much anticipated reduction in interest rates should provide a tailwind for goods demand, and help support a recovery in the sector.
Will RBA Drop Its Tightening Bias?
- RBA stands pat in December after considering a hike
- Rate cut bets come forth after weak data and slowing inflation
- But CPI details may allow officials to keep the tightening door open
- The decision will be announced on Tuesday at 03:30 GMT
December’s hawkish hold
At its December decision, the Reserve Bank of Australia (RBA) kept interest rates unchanged after raising them by 25bps in November. The November hike followed a period of four months where borrowing costs remained steady, and it was based on the assessment that the progress in driving inflation back within the 2-3% target range was slower than previously expected.
Officials took the sidelines again in December as the limited information on the domestic economy since November had been broadly in line with their expectations. However, they did not close the door to further tightening, noting that whether this will be needed will depend on the data and the evolving assessment of risks. The minutes of the gathering revealed that the board even discussed whether it was appropriate to raise rates by another 25bps.
Weak data spark rate cut speculation
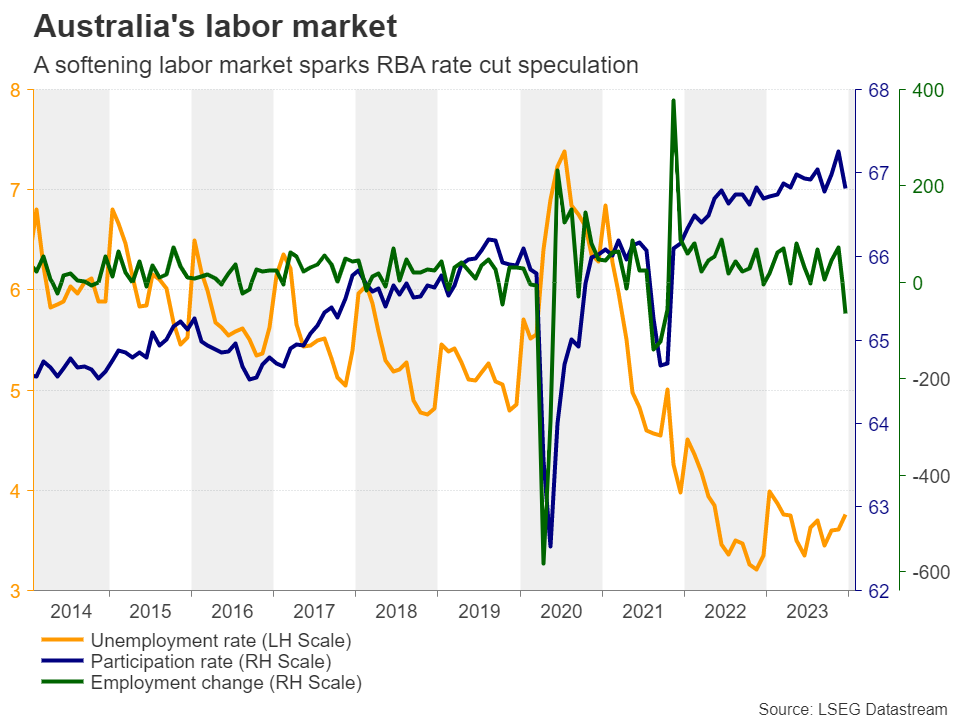
After the meeting, data revealed that the Australian economy continued to slow to 0.2% q/q from 0.4% in Q3, 2023, and although the employment and retail sales numbers for November came in better than expected, the December prints revealed weakness, with the labor market losing 106.6k jobs, which is the most since the COVID-related lockdowns.
This has led investors to start speculating that interest rates have already peaked, and that the RBA’s next move will be a cut. Ahead of Wednesday’s CPI numbers, the market’s implied path was indicating a first 25bps reduction to be delivered in September. But that timing came forth following the bigger than expected slowdown in Australian inflation for Q4.
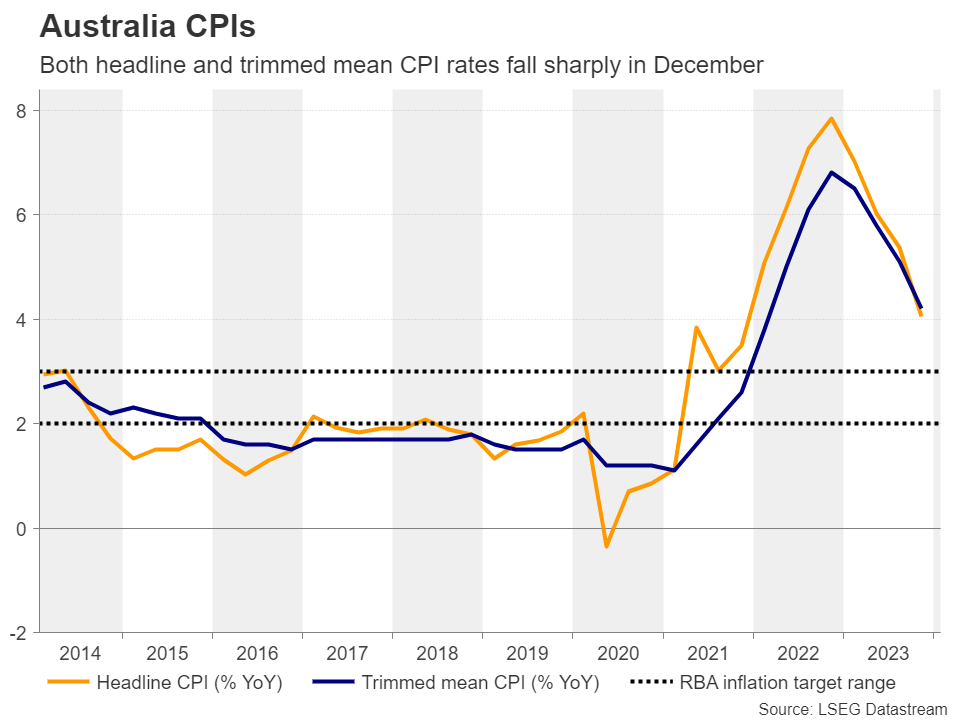
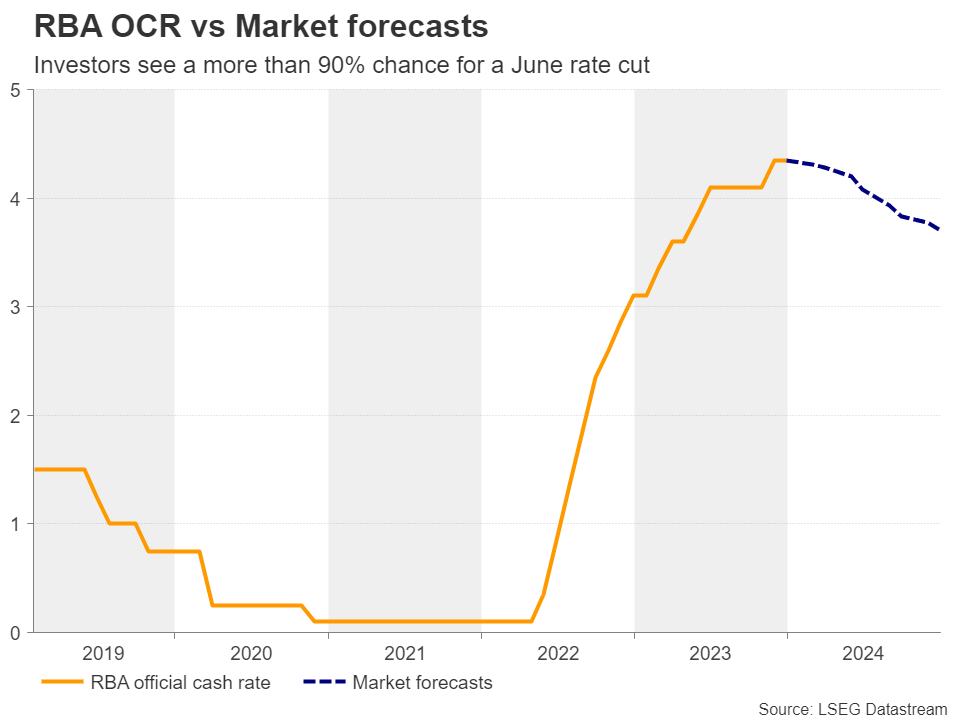
The headline CPI rate for the quarter dropped by more than a percentage point, to 4.1% from 5.4%, while the monthly y/y rate for December slipped to 3.4% from 4.3%, suggesting that it may not take long for inflation to return within the RBA’s target range of 2-3%. Investors are now pricing in a more than 90% probability for the Bank to cut rates in June, while they are factoring in nearly another 40bps worth of rate cuts by the end of the year.
Is this tightening crusade over?
The weak economic data and the slowdown in inflation may prompt policymakers to stay sidelined again when they meet for the first time this year, this coming Tuesday. However, with Governor Michelle Bullock making her latest appearances in her hawkish suit, they are unlikely to suddenly switch from a hiking bias to signaling rate cuts. Thus, the big question on everyone’s mind may be whether they will keep or drop their hiking bias.
The details of the CPI report revealed that non-tradable goods and services inflation, which are mostly driven by domestic demand, held at 5.4%, while rent inflation, although it eased somewhat, remained well elevated at 7.3%. With that in mind, policymakers may decide to keep the option of higher rates on the table for a while longer, at least until they are assured that inflation will not spiral out of control again.
China worries may keep aussie in check
Such a decision could prove positive for the aussie, but will it be enough to help the currency stage a long-lasting recovery? After all, apart from the market’s repricing regarding the future of Australian interest rates, the aussie is also affected by developments surrounding China, the world’s second largest economy and Australia’s main trading partner.
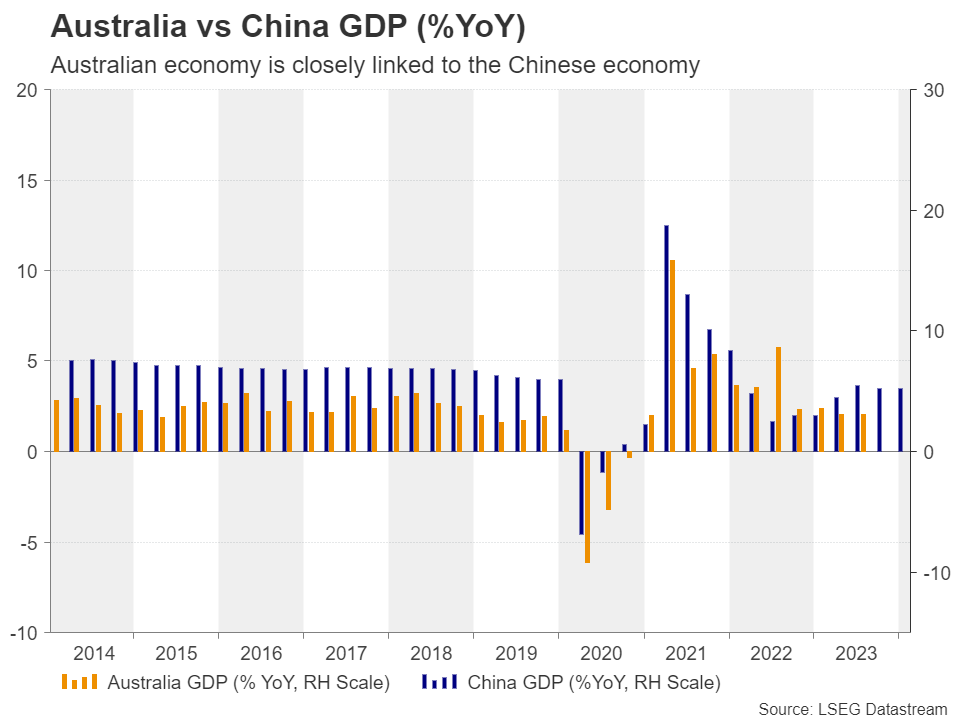
Although China’s decision to take measures and stabilize market confidence helped the risk-linked currency temporarily, the optimism was overshadowed by intensifying concerns about China’s real-estate sector after Evergrande was ordered to be liquidated. The improvement in the Chinese PMIs for January did not help either, perhaps as the manufacturing sector continued contracting for the fourth straight month.
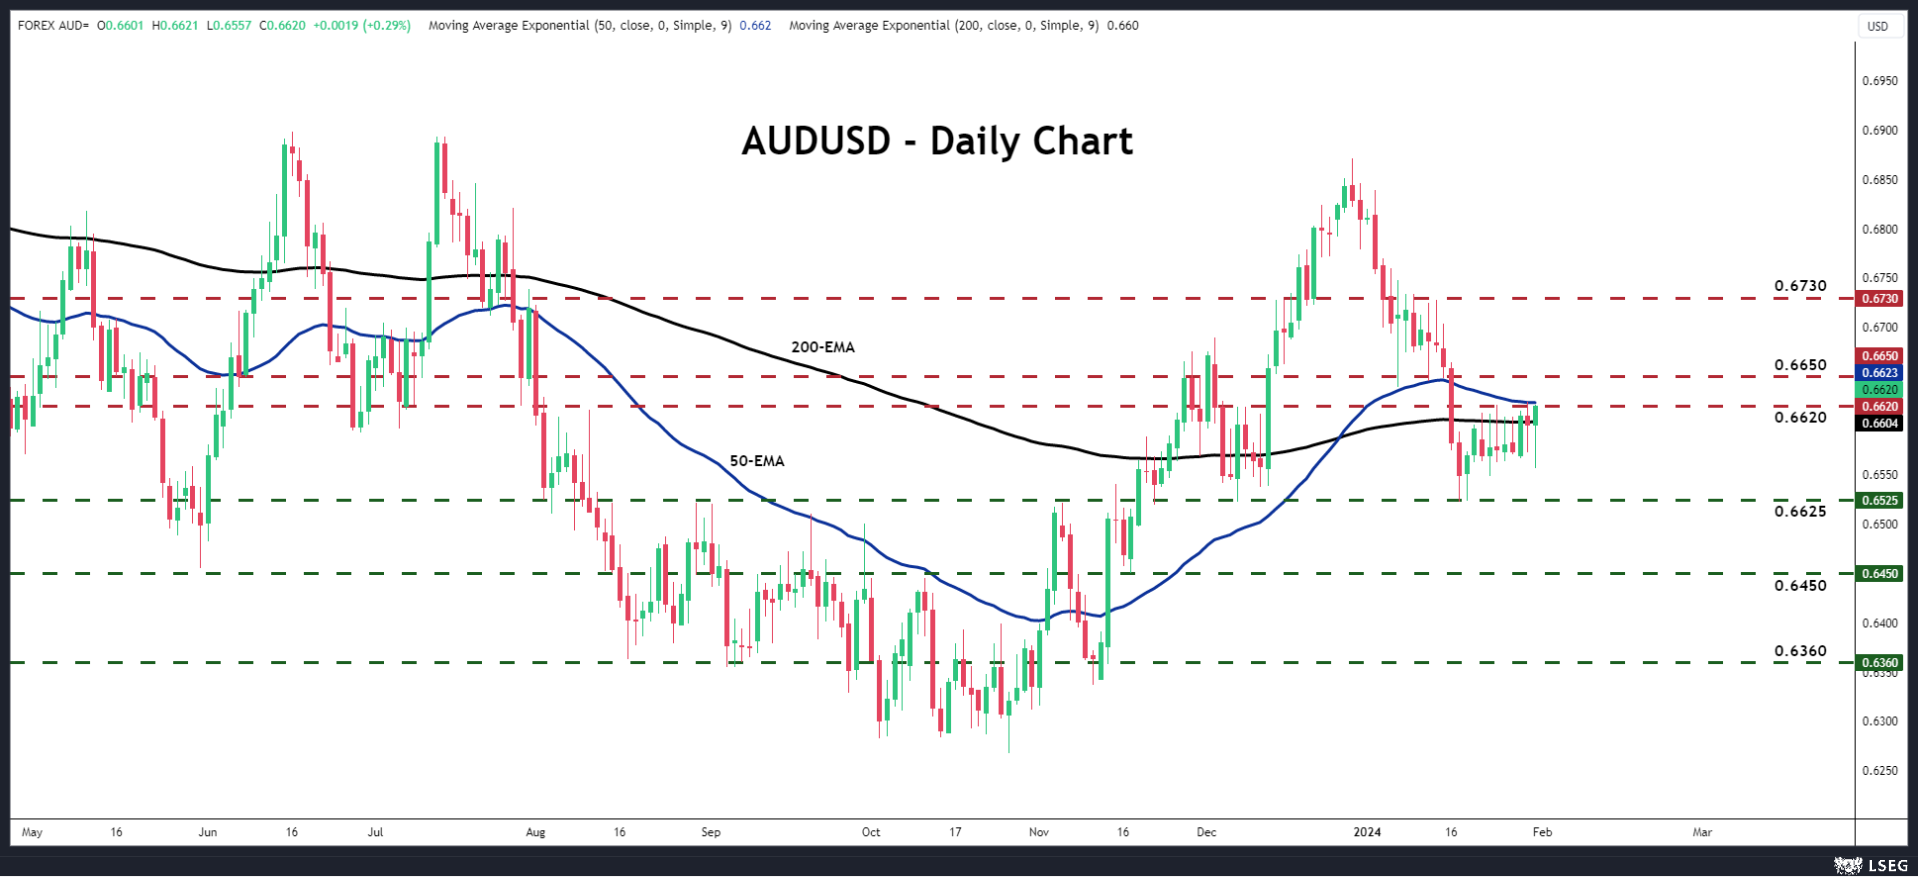
Thus, should the RBA maintain its tightening bias, aussie/dollar could gain and perhaps break above 0.6620 or even above the 0.6650 barrier. However, any advances could remain limited near the 0.6730 area.
Now, in case the RBA signals the end of its tightening crusade, the pair may drop back down to the low of January 17, at around 0.6525, the break of which would confirm a lower low on the daily chart and perhaps pave the way towards the low of November 17 at around 0.6450.
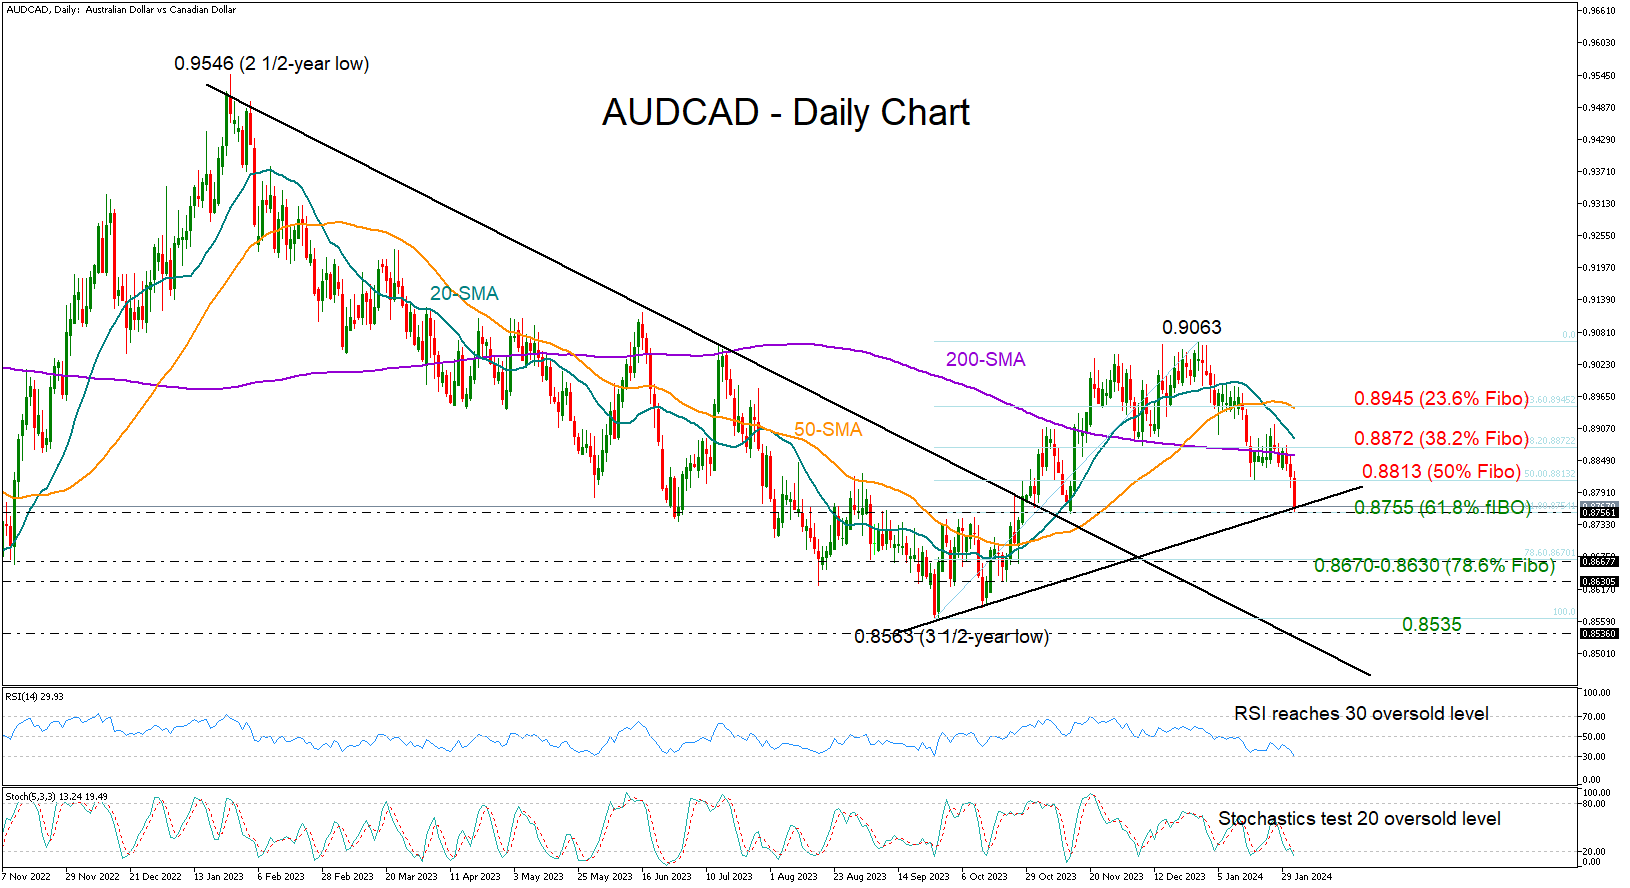
AUDCAD Examines Potential Pivot Point
- AUDCAD continues to trim gains, reaches key support level
- Technical picture reflects oversold conditions
AUDCAD erased more than half of its October-December upleg to find support around the November 13 low of 0.8755, which overlaps with the 61.8% Fibonacci retracement level of the bullish wave.
Both the RSI and the stochastic oscillators hint at oversold conditions, signaling that the bearish action could soon stabilize. If that proves to be the case, the bulls might again fight for a close above the 50% Fibonacci level of 0.8813 and then battle the tricky region around the 38.2% Fibonacci mark of 0.8872, where the 200- and 20-day simple moving averages (SMAs) are converging towards. A successful extension higher could boost sentiment, lifting the price up to the 23.6% Fibonacci of 0.8945.
Should the floor at 0.8755 collapse, the price could tumble towards the 78.6% Fibonacci of 0.8670 and perhaps test the 0.8630 constraining zone too. A break below the latter point could pick up steam towards the 3½-year low of 0.8563 registered in September and then examine the broken resistance trendline drawn from January 2023 at 0.8535.
In summary, the latest downfall in AUDCAD seems overdone, making an upside correction possible in the coming sessions. Yet, whether the pair will find enough buyers to overcome key resistance levels on the upside remains to be seen.
Bank of England Review – Removing the Tightening Bias
- At today's monetary policy meeting the BoE left the Bank Rate unchanged at 5.25% as widely expected.
- The BoE explicitly removed its tightening bias and signalled a shift to a more neutral stance on monetary policy.
- The reaction in EUR/GBP was muted with EUR/GBP set to end the day higher.
As expected, the Bank of England (BoE) decided to keep the Bank Rate unchanged at 5.25%. The vote split indicated a continued split committee, as 6 members voted for an unchanged decision, 2 for a 25bp hike and 1 for a 25bp cut.
The BoE shifted towards a more neutral approach to monetary policy by removing its tightening bias, a less hawkish vote split than previously and overall being more confident in developments in the persistence of inflation, as expected. More explicitly, the BoE removed the phrase "further tightening in monetary policy would be required if there were evidence of more persistent inflationary pressures" and added that "the MPC will keep under review for how long the Bank Rate should be maintained at its current level".
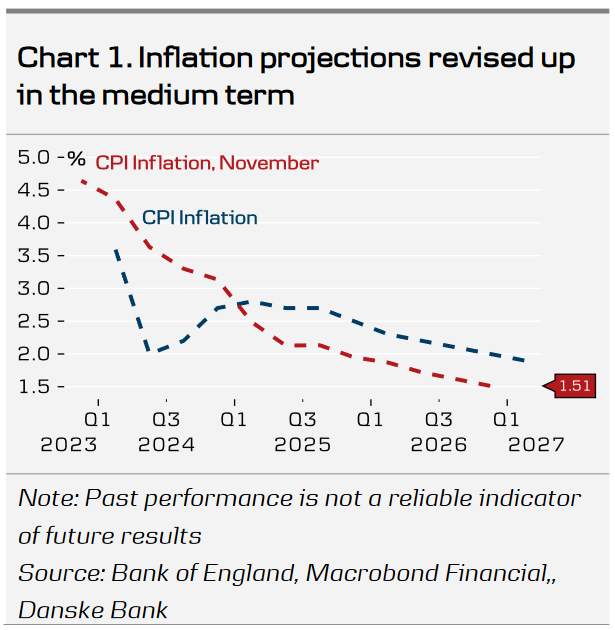
The inflation forecast was revised down in the near-term but revised higher in the medium-term with headline inflation set to reach target in Q4 2026, using a significantly lower trajectory for the Bank Rate (chart 1). This is a year later than expected in the November monetary policy report (MPR)). While the MPC still judges the risks as skewed to the upside for the inflation outlook due to geopolitical factors, it sees the risks from domestic price and wage pressures "more evenly balanced". Additionally, GDP growth forecast was revised higher across the forecast period.
While the dovish tilt fell slightly short of market expectations, today's meeting marks an important shift in communication from the MPC, opening the door for impending rate cuts. Before the next meeting on 21 March, we will get a lot of data, namely two job reports (including a continuation of LFS-based data) and inflation data for January and February. Overall, we expect the UK economy to show further signs of weakness, inflation to level off and wage growth to have peaked as shown by recent data releases.
Rates. The reaction in rates markets was very muted. 2Y Gilt yields moved 5bp higher on the statement but fully retraced the move during the press conference. Markets have shifted the probability of the first rate cut further out, now expecting the first 25bp cut by June 2024.
FX. Following the release of the statement, EUR/GBP dipped slightly lower but is set to end the day higher. On balance we still see relative rates as a slight negative for GBP but note that risks are more balanced. We see the recent rebound as attractive levels to sell GBP and continue to forecast EUR/GBP to move higher the coming year to 0.89.
Our call. We continue to expect the first rate cut of 25bp in June 2024, which we think today's meeting supports. We subsequently expect 25bp cuts in the following quarters, totalling of 75bp of cuts for 2024. This is less than current market pricing (110bp). We do not see the BoE deviating from the Fed and ECB by the extent currently priced by markets and expect markets to scale back on expectations from the latter.
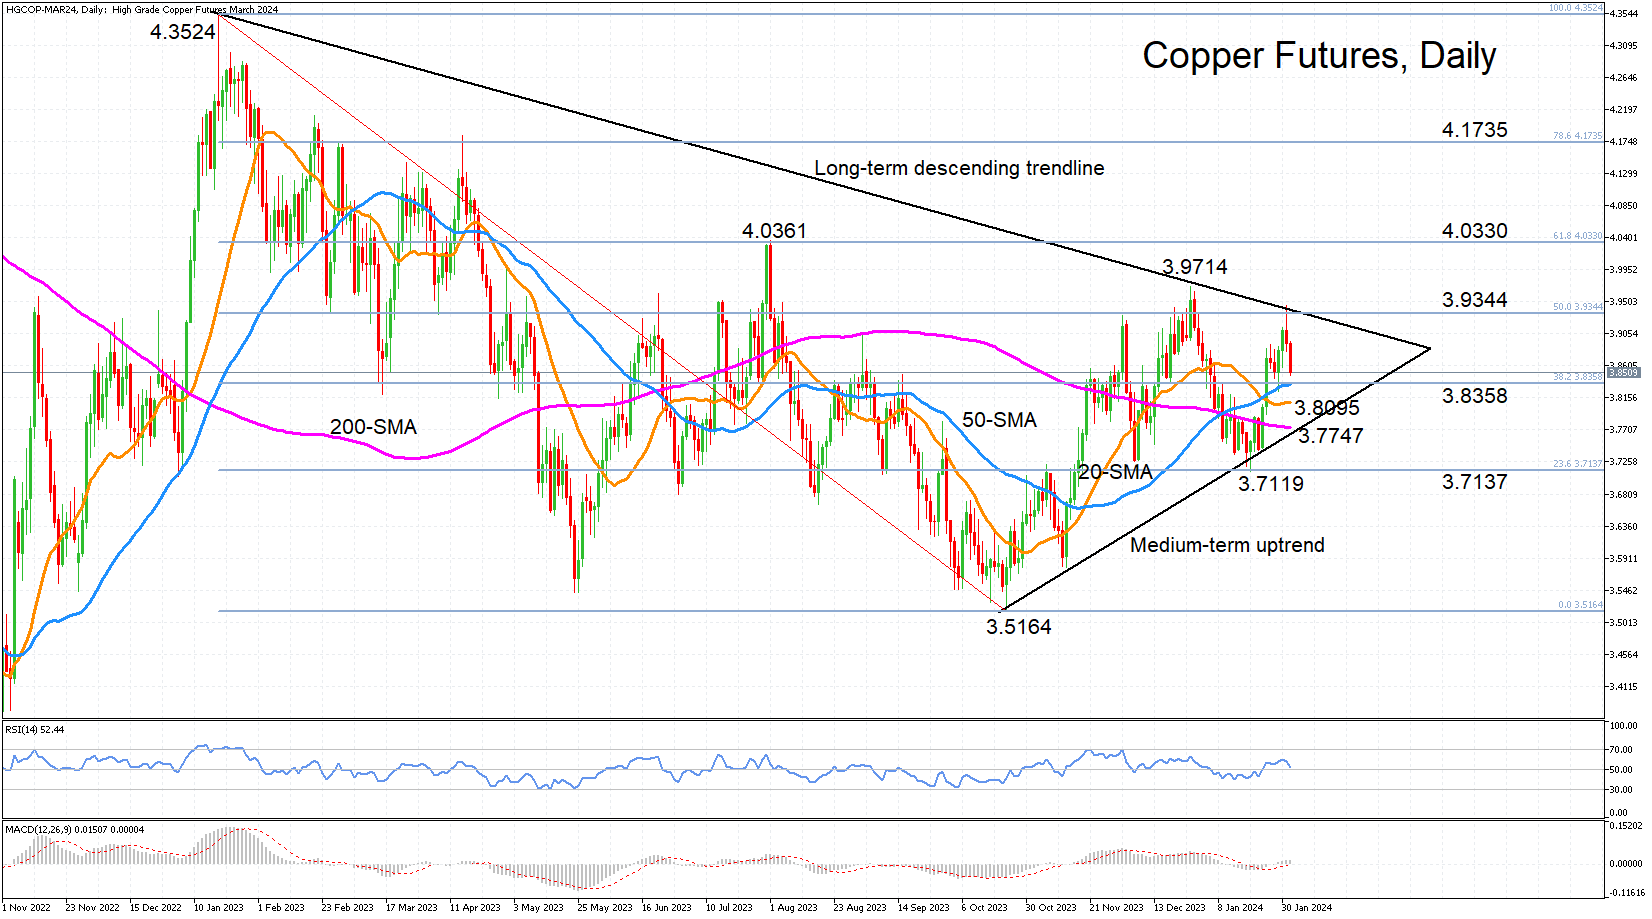
Copper Futures Slip after Failing to Break 50% Fibo
- Copper prices on the retreat after hitting wall at 50% Fibonacci
- But head towards breakout from bullish pennant
- Near-term bias is neutral
Copper futures (HGCOP) confirmed the formation of a bullish pennant pattern after failing to post a higher high on Wednesday. Advances were rejected for a second time by both the 50% Fibonacci retracement level of the January-October 2023 downtrend as well as the long-term descending trendline.
The momentum indicators are somewhat mixed, underscoring the neutral picture until prices reach the end of the pennant for a possible breakout, which could still be weeks away. The RSI is pointing downwards but is holding above the 50 neutral level, while the MACD remains positively aligned with its red signal line even though it has begun to flatline.
Should the commodity remain under pressure, the 50-day simple moving average (SMA) is expected to act as immediate support as it converges with the 38.2% Fibonacci of 3.8358. A drop lower would see the 20- and 200-day SMA also coming to copper’s defence at 3.8095 and 3.7747, respectively.
Breaching the 200-day SMA would take the price below the medium-term uptrend line, potentially shifting the outlook to neutral. The focus would then turn to the January low of 3.7119, which corresponds with the 23.6% Fibonacci.
However, should the moving averages succeed in preventing a deeper fall, any rebound would first have to see off the challenge at the 50% Fibonacci of 3.9344. This would clear the path towards the 61.8% Fibonacci of 4.0330, which is where prices stalled in July 2023, and signal a continuation of not only the recent uptrend that began in October, but also of the bullish phase that goes all the way back to July 2022.
To sum up, prices will likely develop within the pennant pattern in the short-term timeframe. An upside break would boost copper’s bullish prospects in the medium term, while a breakout to the downside would signal a prolonged period of consolidation.