
Sample Category Title
BoE watched with focus on voting dynamics and economic projections
Expectations are firmly set for BoE to keep interest rate unchanged at 5.25% today, marking the fourth consecutive session without a change. Several crucial factors could inject volatility into the financial markets, including the vote split, updated economic projections, and guidance.
A critical aspect to watch is the voting pattern among the MPC's nine members. It is unlikely that any member will advocate for an interest rate hike. The central question is whether any members, like known dove Swati Dhingra, will begin to vote for a rate cut.
Another key area of interest lies in the revised economic forecasts. Given recent economic developments, it's plausible that the growth forecasts may see a notable upgrade, while the near-term inflation outlook could be revised downwards. These changes would come with a lowered condition rate path.
The meeting is also expected to see BoE finally dropping its tightening bias, aligning with the broader global central banking trend. However, BoE would likely try to temper any enthusiasm for imminent rate cuts by emphasizing the necessity of maintaining higher interest rates "for longer." The central bank would require more evidence of wage growth deceleration before feeling confident enough to reduce rates.
There is a divergence of opinions among economists regarding the timing of the first rate cut, with general consensus fluctuates between May and August of this year. Currently, August is the more probable scenario for the initial cut. However, if today's meeting leans more dovishly than anticipated, it could tilt the scales in favor of a May cut.
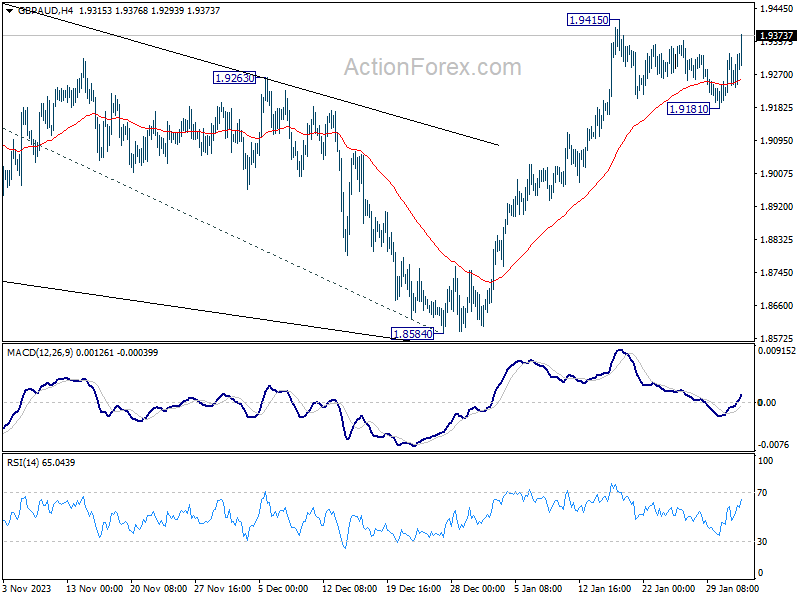
With today's strong bounce, GBP/AUD's sideway consolidation from 1.9415 appears to have completed at 1.9181 already. Rise from 1.8584 is probably ready to resume. Firm break of 1.9415 will confirm this bullish case. Nevertheless, break of 1.9181 support will dampen this view and mix up the outlook.
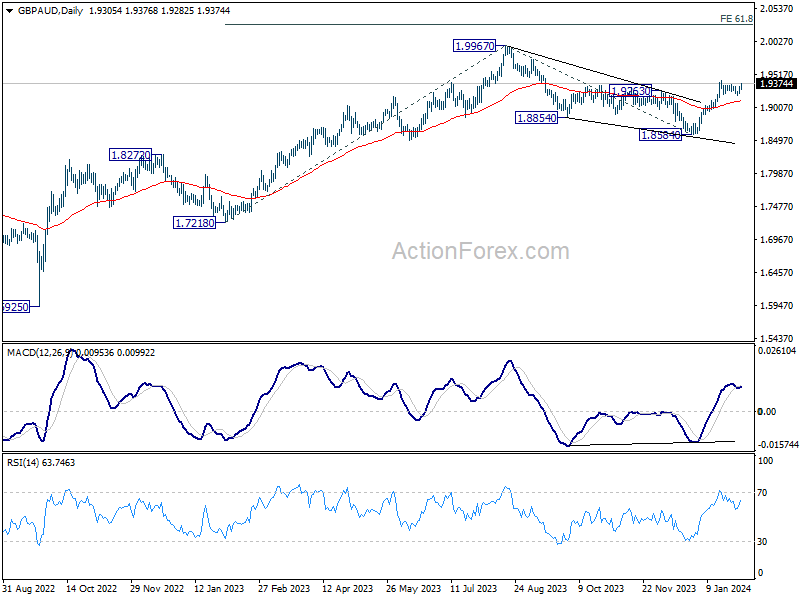
In the bigger picture, corrective pattern from 1.9967 (2023 high) should have completed with three waves down to 1.8584 already. Rise from from there is resuming the long term up trend. Next target is 1.9967 high, with prospect of hitting 61.8% projection of 1.7218 to 1.9967 from 1.8584 at 2.0283.
Technical Outlook and Review
DXY:
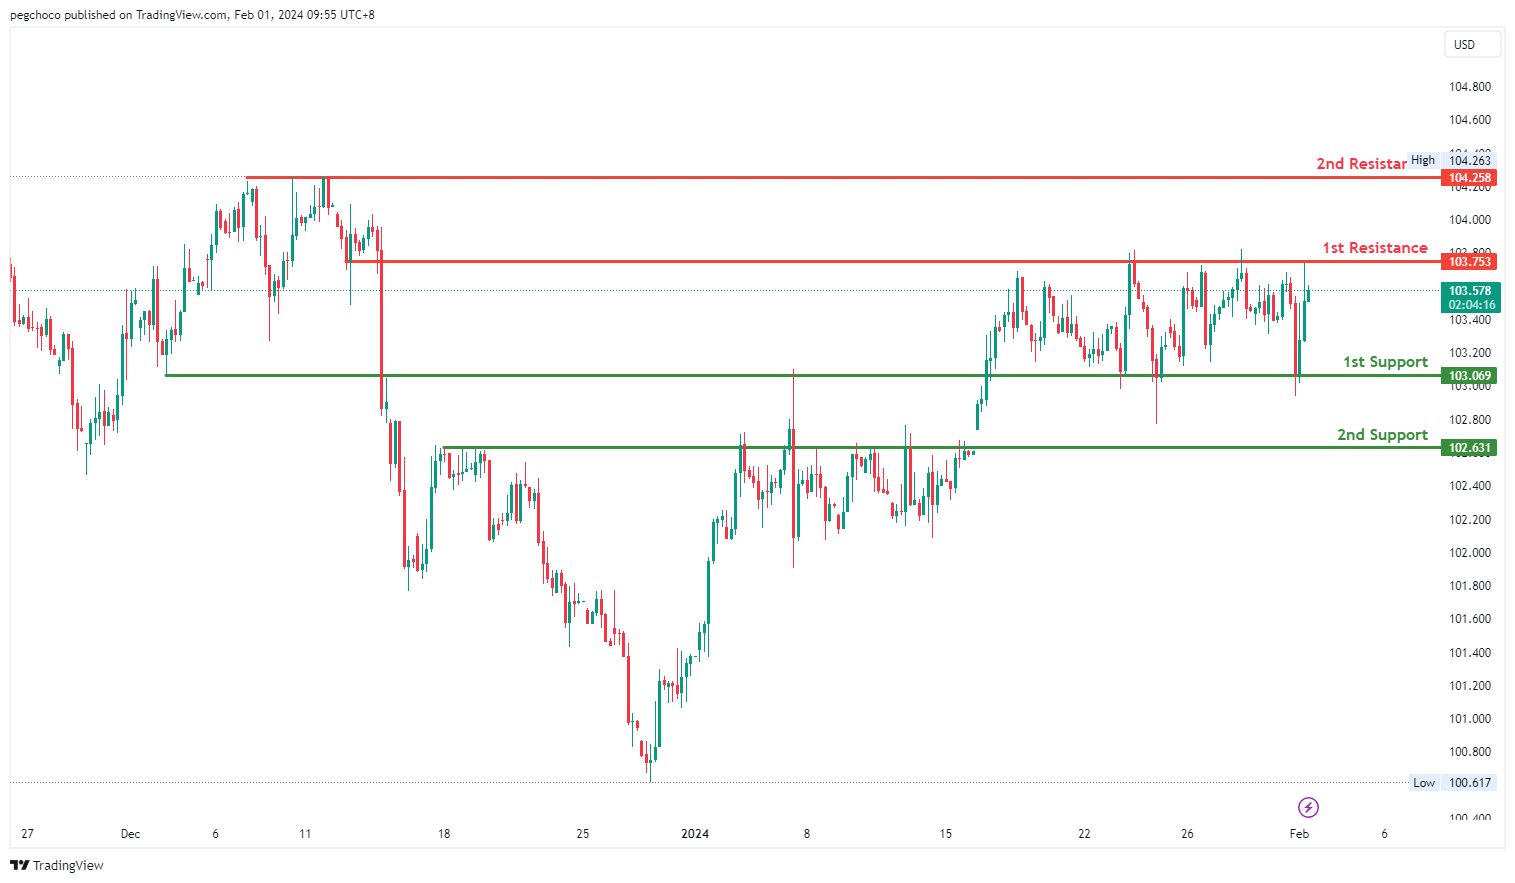
The DXY chart currently exhibits a neutral overall momentum, indicating a lack of a clear trend direction. The price could potentially fluctuate between the 1st resistance and 1st support levels.
The 1st support level at 103.06 is identified as an overlap support, suggesting that it has historical significance and could act as a support level where buying interest may emerge.
Additionally, there is a 2nd support level at 102.63, categorized as a pullback support, further emphasizing its potential importance as a support zone.
On the resistance side, the 1st resistance level at 103.75 is categorized as an overlap resistance, indicating a historical point where the price has encountered resistance.
The 2nd resistance level at 104.25 is identified as a multi-swing high resistance, suggesting that it represents another historical level where the price has faced resistance.
EUR/USD:
The EUR/USD chart currently exhibits a bearish overall momentum, indicating a downward trend. The price could potentially make a bearish break off the 1st support level and drop towards the 2nd support level.
The 1st support level at 1.0812 is identified as an overlap support, suggesting that it has historical significance and could potentially act as a strong support level where buying interest may emerge.
There is also a 2nd support level at 1.0748, which is categorized as an overlap support and is reinforced by the presence of the 161.80% Fibonacci Extension. This further emphasizes its importance as a potential support zone.
On the resistance side, the 1st resistance level at 1.0927 is categorized as an overlap resistance, indicating that it represents a historical point where the price has encountered resistance.
The 2nd resistance level at 1.0982 is also identified as an overlap resistance, suggesting that it is another historical level where the price has faced resistance.
Additionally, there is an intermediate resistance level at 1.0877, which is also an overlap resistance.

EUR/JPY:
The EUR/JPY chart currently exhibits a bullish overall momentum, suggesting an upward trend. Despite this bullish sentiment, there is a potential short-term scenario indicating a drop to the 1st support before a subsequent bounce, leading to a rise towards the 1st resistance.
The 1st support at 158.570 is considered favorable for several reasons. Firstly, it is identified as an overlap support, indicating a historical level where buying interest has previously emerged. Additionally, this support level aligns with the 161.80% Fibonacci Extension and the 38.20% Fibonacci Retracement, adding confluence to its significance.
The 2nd support at 157.280 is recognized as a swing low support and coincides with the 50% Fibonacci Retracement, providing additional strength to the potential support zone.
On the resistance side, the 1st resistance at 159.413 is noteworthy for being a pullback resistance, indicating a level where selling interest might emerge.
Furthermore, the 2nd resistance at 160.336 is identified as an overlap resistance, adding significance to this potential resistance level.

EUR/GBP:
The EUR/GBP chart currently exhibits a bearish overall momentum, indicating a prevailing downward trend.
The 1st support at 0.85070 is considered favorable for several reasons. Firstly, it is identified as a swing low support, denoting a historical level where buying interest has previously emerged. Additionally, this support level aligns with the 127.20% Fibonacci Extension, providing additional strength to the potential support zone.
The 2nd support at 0.84859 is also notable, representing the 161.80% Fibonacci Extension, adding further confluence to the support area.
On the resistance side, the 1st resistance at 0.85470 is significant as it is identified as a pullback resistance, suggesting a level where selling interest may emerge.
Furthermore, the 2nd resistance at 0.85683 is recognized as an overlap resistance, contributing to the overall resistance zone. The intermediate resistance at 0.85346 is also considered noteworthy, being an overlap resistance.

GBP/USD:
The GBP/USD chart currently exhibits a neutral overall momentum, suggesting a lack of a clear trend direction. Price could potentially fluctuate between the 1st resistance and 1st support levels.
The 1st support level at 1.2648 is identified as a multi-swing low support, and it is reinforced by the presence of the 78.60% Fibonacci Retracement. This suggests that it has historical significance and could potentially act as a strong support level where buying interest may emerge.
There is also a 2nd support level at 1.2601, categorized as an overlap support and associated with the 127.20% Fibonacci Extension, further emphasizing its importance as a potential support zone.
On the resistance side, the 1st resistance level at 1.2763 is identified as a multi-swing high resistance, indicating that it represents a historical point where the price has encountered resistance.
The 2nd resistance level at 1.2815 is categorized as a swing high resistance, suggesting that it is another historical level where the price has faced resistance.

GBP/JPY:
The GBP/JPY chart currently indicates a bullish overall momentum, suggesting a potential short-term drop to the 1st support level before bouncing back and rising towards the 1st resistance.
The 1st support at 185.879 is considered significant for several reasons. Firstly, it is identified as an overlap support, indicating a historical level where buying interest has previously emerged. Additionally, this support level aligns with the 161.80% Fibonacci Extension, adding confluence to its significance.
The 2nd support at 184.256 is recognized as a pullback support, providing additional strength to the potential support zone.
On the resistance side, the 1st resistance at 187.479 is considered notable as it is identified as an overlap resistance, suggesting a level where selling interest may emerge.
Furthermore, the 2nd resistance at 188.412 is recognized as a pullback resistance, contributing to the overall resistance zone. The intermediate resistance at 186.87 is also considered noteworthy, being a pullback resistance.

USD/CHF:
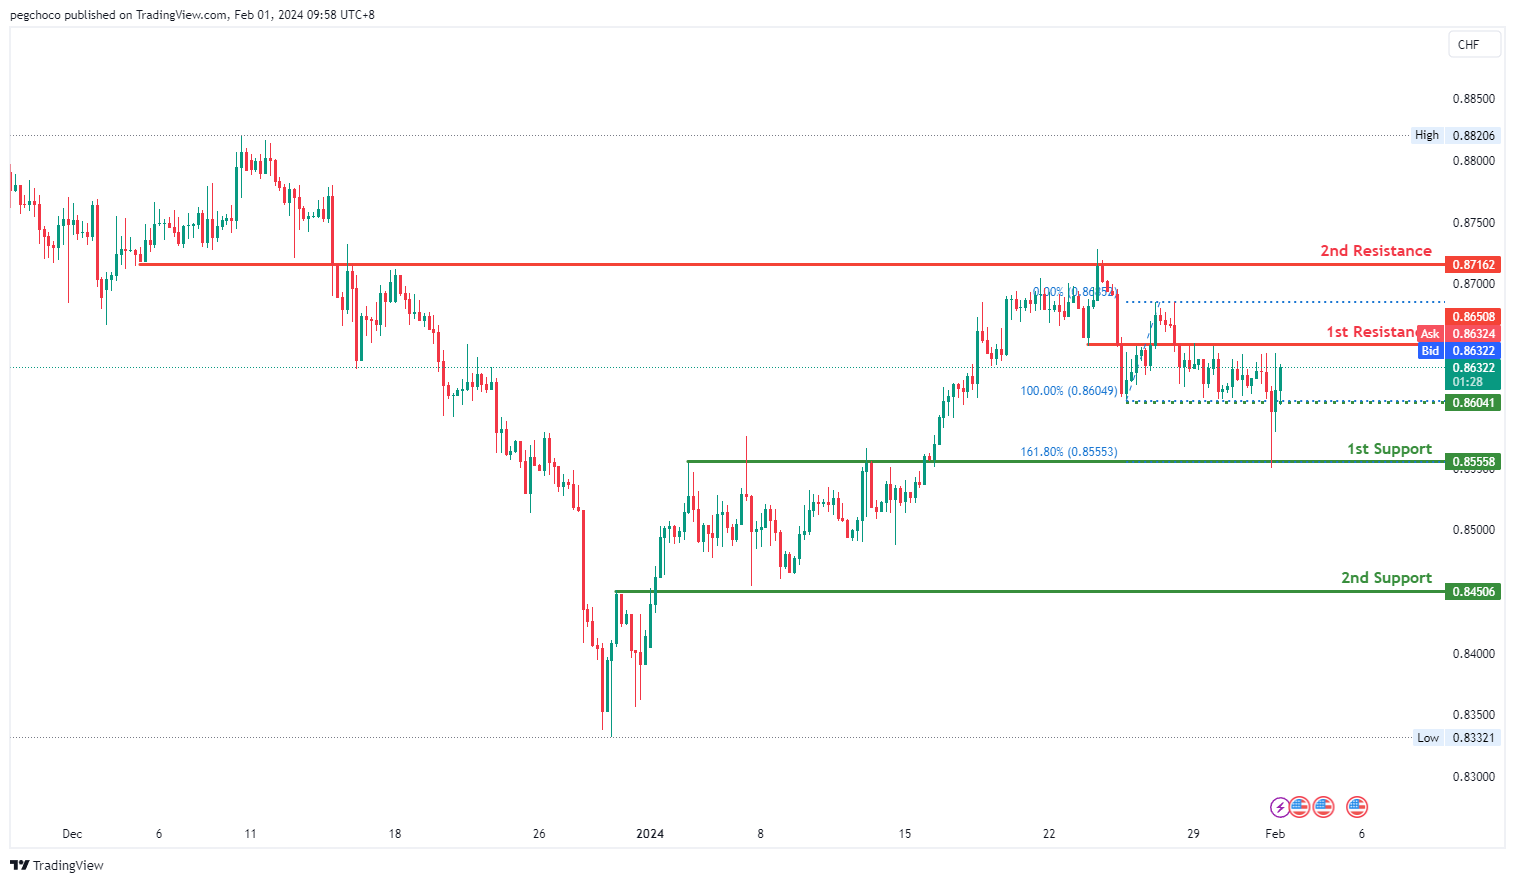
The USD/CHF chart currently exhibits a bearish overall momentum, indicating a downward trend. Price could potentially experience a bearish reaction off the 1st resistance level and drop towards the 1st support level.
The 1st support level at 0.8555 is identified as an overlap support, and it is reinforced by the presence of the 161.80% Fibonacci Extension. This suggests that it has historical significance and could potentially act as a strong support level where buying interest may emerge.
There is also a 2nd support level at 0.8450, categorized as a pullback support, further emphasizing its importance as a potential support zone.
On the resistance side, the 1st resistance level at 0.8650 is identified as an overlap resistance, indicating that it represents a historical point where the price has encountered resistance.
The 2nd resistance level at 0.8716 is also categorized as an overlap resistance, suggesting that it is another historical level where the price has faced resistance.
Additionally, there is an intermediate support level at 0.8604, categorized as a pullback support, which could also play a role in providing support if the price drops.
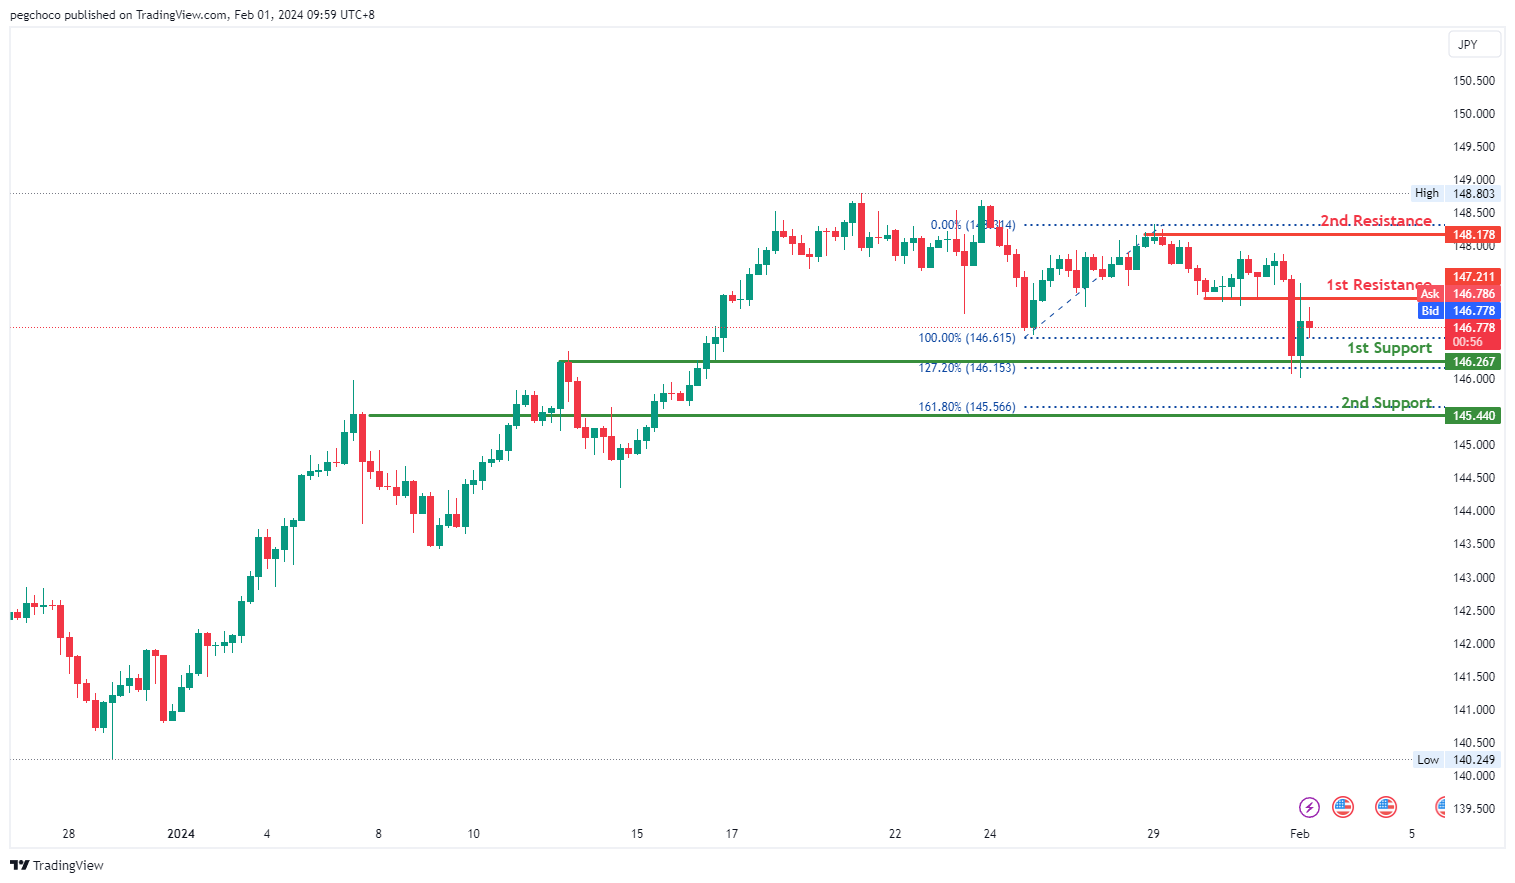
USD/JPY:
The USD/JPY chart currently exhibits a bearish overall momentum, indicating a downward trend. Price could potentially experience a bearish reaction off the 1st resistance level and drop to the 1st support level.
The 1st support level at 146.26 is identified as an overlap support, and it is reinforced by the presence of the 127.20% Fibonacci Extension. This suggests that it has historical significance and could potentially act as a strong support level where buying interest may emerge.
There is also a 2nd support level at 145.44, categorized as a pullback support, further emphasizing its importance as a potential support zone.
On the resistance side, the 1st resistance level at 147.21 is identified as an overlap resistance, indicating that it represents a historical point where the price has encountered resistance.
The 2nd resistance level at 148.17 is categorized as a multi-swing high resistance, suggesting that it is another historical level where the price has faced resistance.
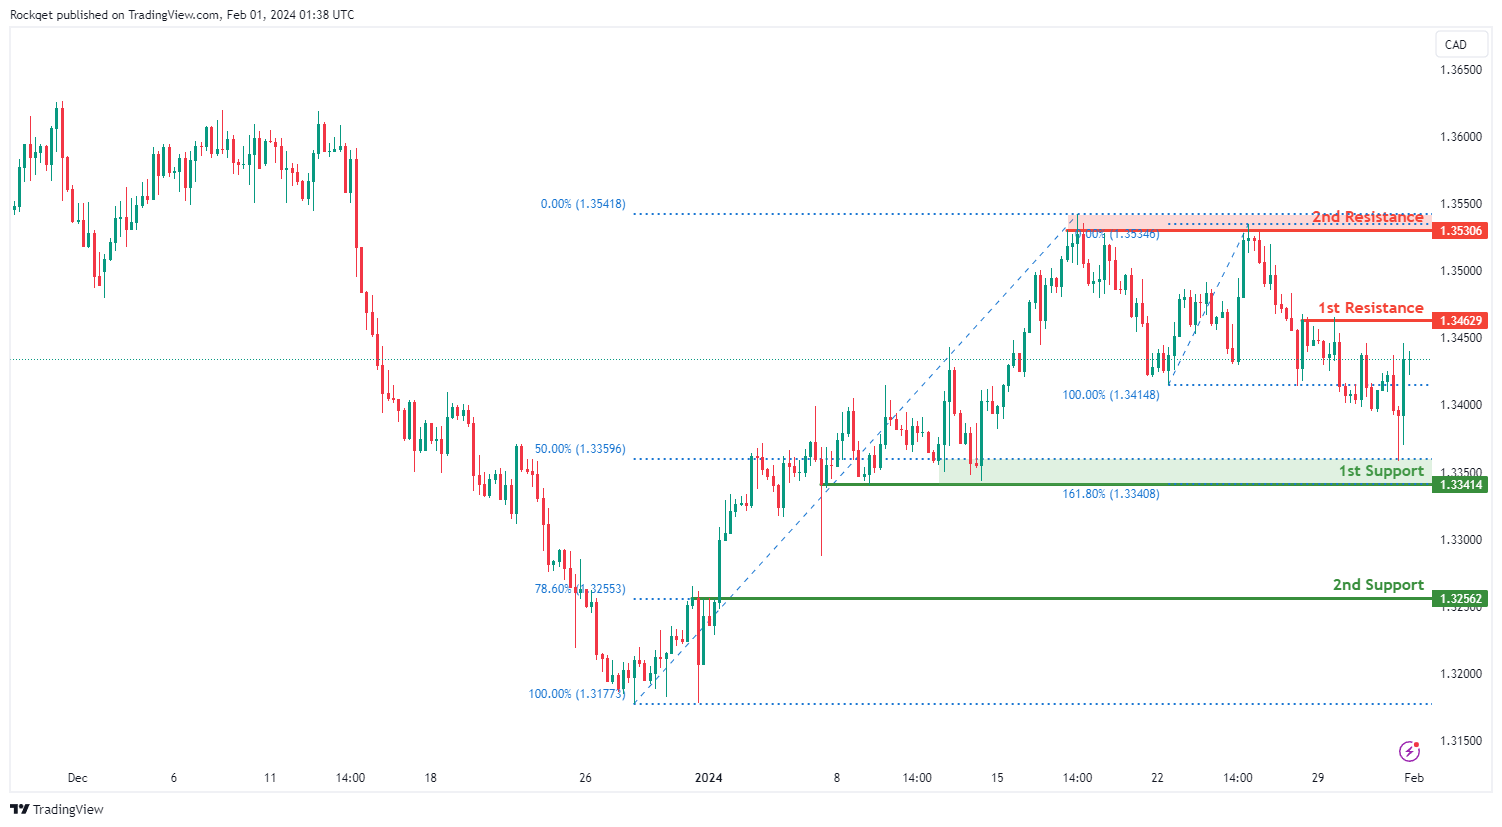
USD/CAD:
The USD/CAD chart currently exhibits an overall bearish momentum. In this context, there is a potential scenario for price to make a bearish continuation towards the 1st support level.
The 1st support level at 1.3341 is identified as a pullback support that aligns close to the 50.00% Fibonacci Retracement level. Further below, the 2nd support level at 1.3256 is also marked as a pullback support that aligns with the 78.60% Fibonacci Retracement level, further emphasizing its importance as a potential support zone.
On the resistance side, the 1st resistance level at 1.3462 is identified as a pullback resistance. Higher up, the 2nd resistance level at 1.3530 is noted as a multi-swing-high resistance, further highlighting its importance as a potential resistance point.
AUD/USD:
The AUD/USD chart currently exhibits a neutral bias. In this context, there is a potential scenario for price to fluctuate between the 1st resistance and 1st support.
The 1st resistance level at 0.6614 is identified as a pullback resistance. Higher up, the 2nd resistance level at 0.6654 is also marked as a pullback resistance that aligns with the 38.20% Fibonacci Retracement level, further highlighting its importance as a potential resistance point.
On the support side, the 1st support level at 0.6534 is identified as a pullback support. Further below, the 2nd support level at 0.6461 is also noted as a pullback support that aligns close to the 78.60% Fibonacci Retracement level, further emphasizing its importance as a potential support zone.

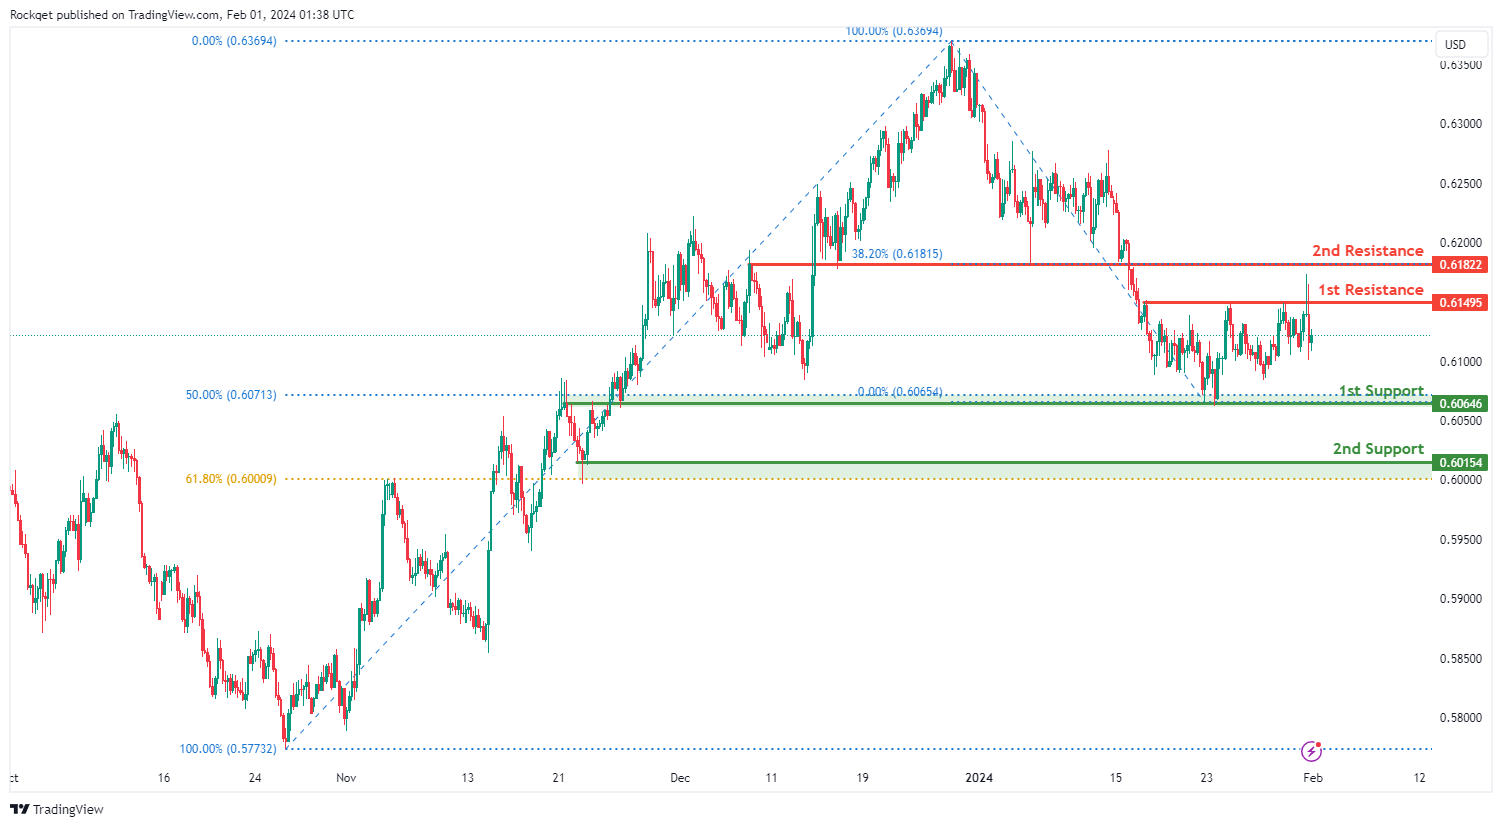
NZD/USD
The NZD/USD chart currently exhibits a neutral bias. In this context, there is a potential scenario for price to fluctuate between the 1st resistance and 1st support.
The 1st resistance level at 0.6149 is identified as a pullback resistance. Higher up, the 2nd resistance level at 0.6182 is marked as an overlap resistance that aligns with the 38.20% Fibonacci Retracement level, further highlighting its importance as a potential resistance point.
On the support side, the 1st support level at 0.6064 is identified as an overlap support that aligns with the 50.00% Fibonacci Retracement level. Further below, the 2nd support level at 0.6015 is noted as a pullback support that aligns close to the 61.80% Fibonacci Retracement level, further emphasizing its importance as a potential support zone.
DJ30:
The DJ30 (Dow Jones Industrial Average) chart currently exhibits a bearish overall momentum, indicating a potential continuation of the downward trend. Several factors contribute to this bearish momentum, suggesting the possibility of further price decline.
The 1st support at 37819.05 is considered significant for multiple reasons. Firstly, it is identified as an overlap support, indicating a historical level where buying interest has previously emerged. Additionally, this support level aligns with the 50% Fibonacci Retracement, adding confluence to its significance.
The 2nd support at 37161.98 is recognized as a pullback support, providing additional strength to the potential support zone.
On the resistance side, the 1st resistance at 38540.06 is considered notable as it is identified as a swing high resistance. This level may act as a barrier to the bearish momentum. The intermediate support at 38112.49 is also recognized as an overlap support, adding further relevance to the support zone.

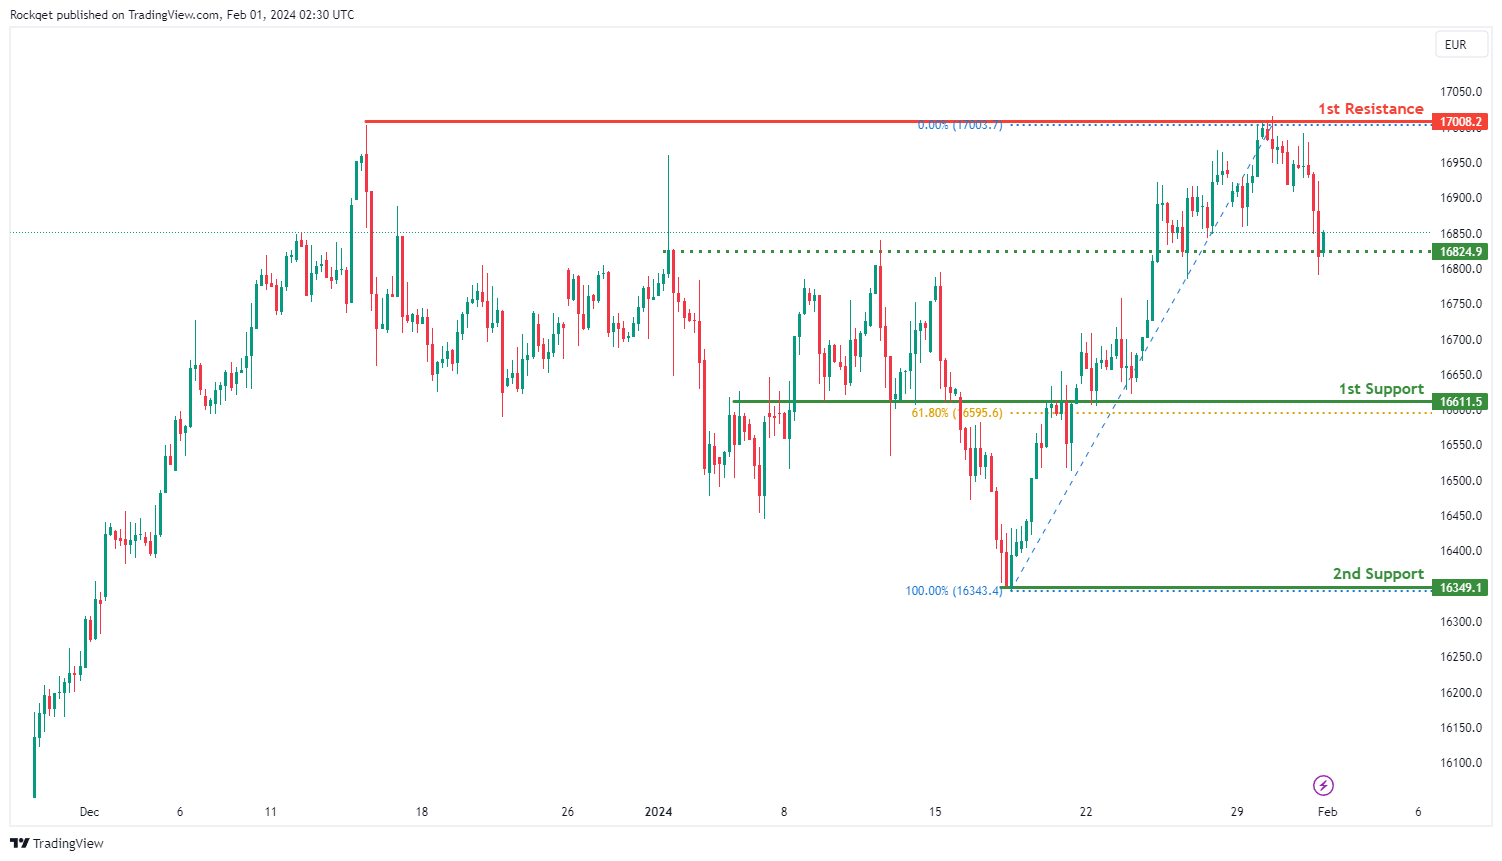
GER40:
The GER40 chart currently maintains a bearish overall momentum, with several factors contributing to the downward trend. The price is displaying indications that support a potential bearish continuation.
The 1st support at 16611.5 holds significance for various reasons. Firstly, it is identified as an overlap support, denoting a historical level where buying interest has previously been observed. Additionally, this support level aligns with the 61.80% Fibonacci Retracement, adding to its significance.
The 2nd support at 16349.1 is recognized as a swing low support, further strengthening the potential support zone.
On the resistance side, the 1st resistance at 17008.2 is considered noteworthy as it is identified as a multi-swing high resistance. This level may act as a barrier to the bearish momentum. The intermediate support at 16824.9 is also recognized as an overlap support, providing additional relevance to the potential support zone.
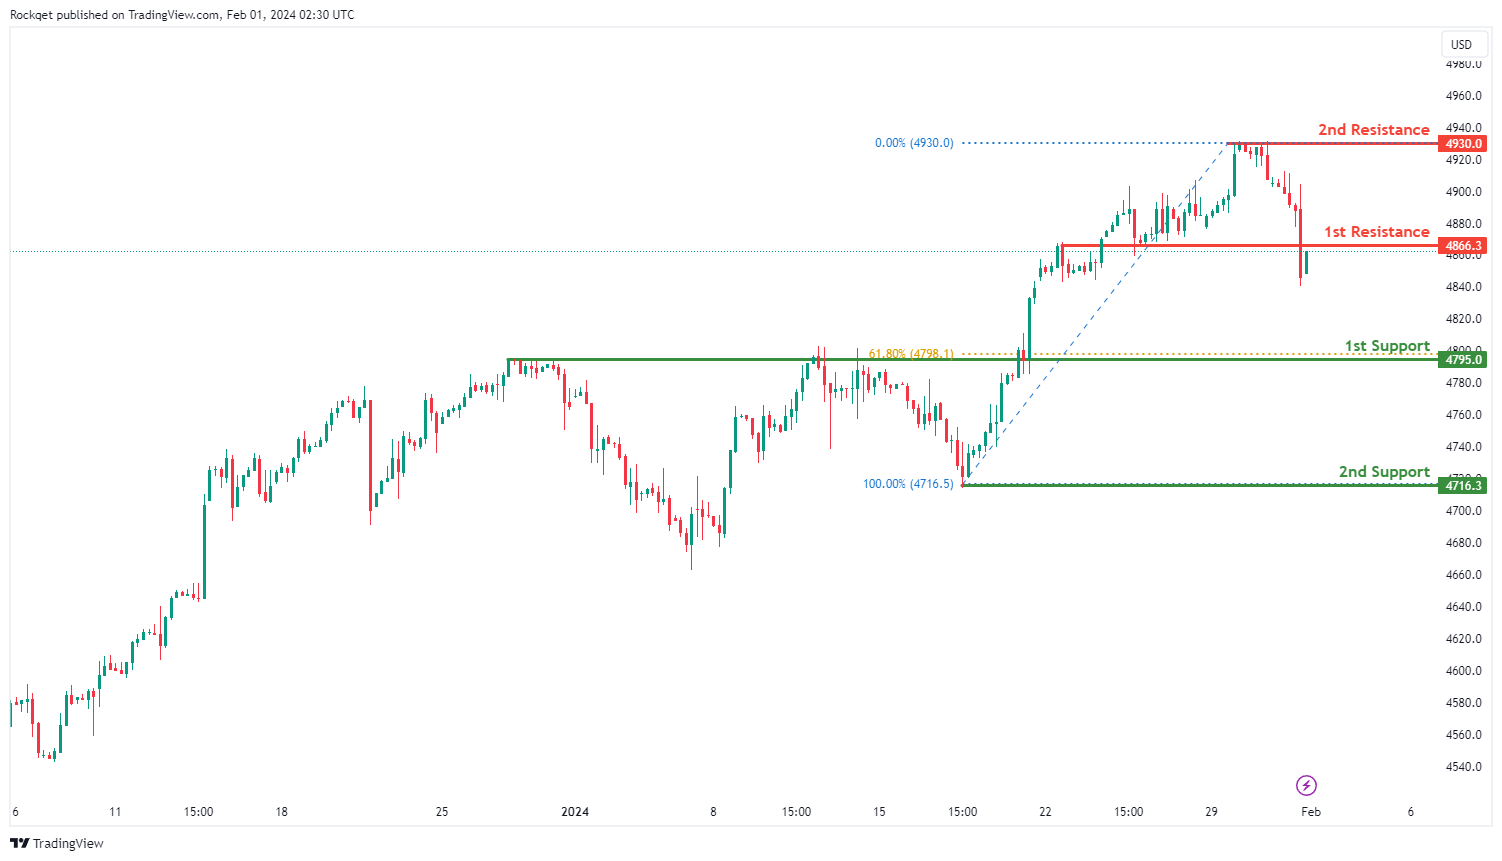
US500:
The US500 chart currently indicates a bearish overall momentum, suggesting a potential continuation of the downward trend. Several factors contribute to this bearish sentiment, signalling the possibility of further price depreciation.
The 1st support at 4795.0 is considered significant for multiple reasons. Firstly, it is identified as an overlap support, denoting a historical level where buying interest has previously emerged. Additionally, this support level aligns with the 61.80% Fibonacci Retracement, adding confluence to its importance.
The 2nd support at 4716.3 is recognized as a swing low support, providing additional strength to the potential support zone.
On the resistance side, the 1st resistance at 4866.3 is highlighted as an overlap resistance, which may act as a barrier to bearish momentum. The 2nd resistance at 4930.0 is identified as a swing high resistance, further reinforcing the potential resistance zone.
BTC/USD:
The BTC/USD chart currently displays a bearish overall momentum, indicating a potential continuation of the downward trend. Several factors contribute to this bearish sentiment, suggesting the possibility of a bearish reaction off the 1st resistance and a subsequent drop to the 1st support.
The 1st support at 40670 is deemed significant for several reasons. Firstly, it is identified as an overlap support, signifying a historical level where buying interest has previously emerged. Additionally, this support level aligns with the 61.80% Fibonacci Retracement, adding confluence to its importance.
The 2nd support at 38807 is recognized as a swing low support, providing additional strength to the potential support zone. Additionally, the intermediate support at 41708 is noted as an overlap support and aligns with the 38.20% Fibonacci Retracement.
On the resistance side, the 1st resistance at 43526 is highlighted as an overlap resistance, which may act as a barrier to the bearish momentum. The 2nd resistance at 45482 is identified as a swing high resistance, further reinforcing the potential resistance zone.

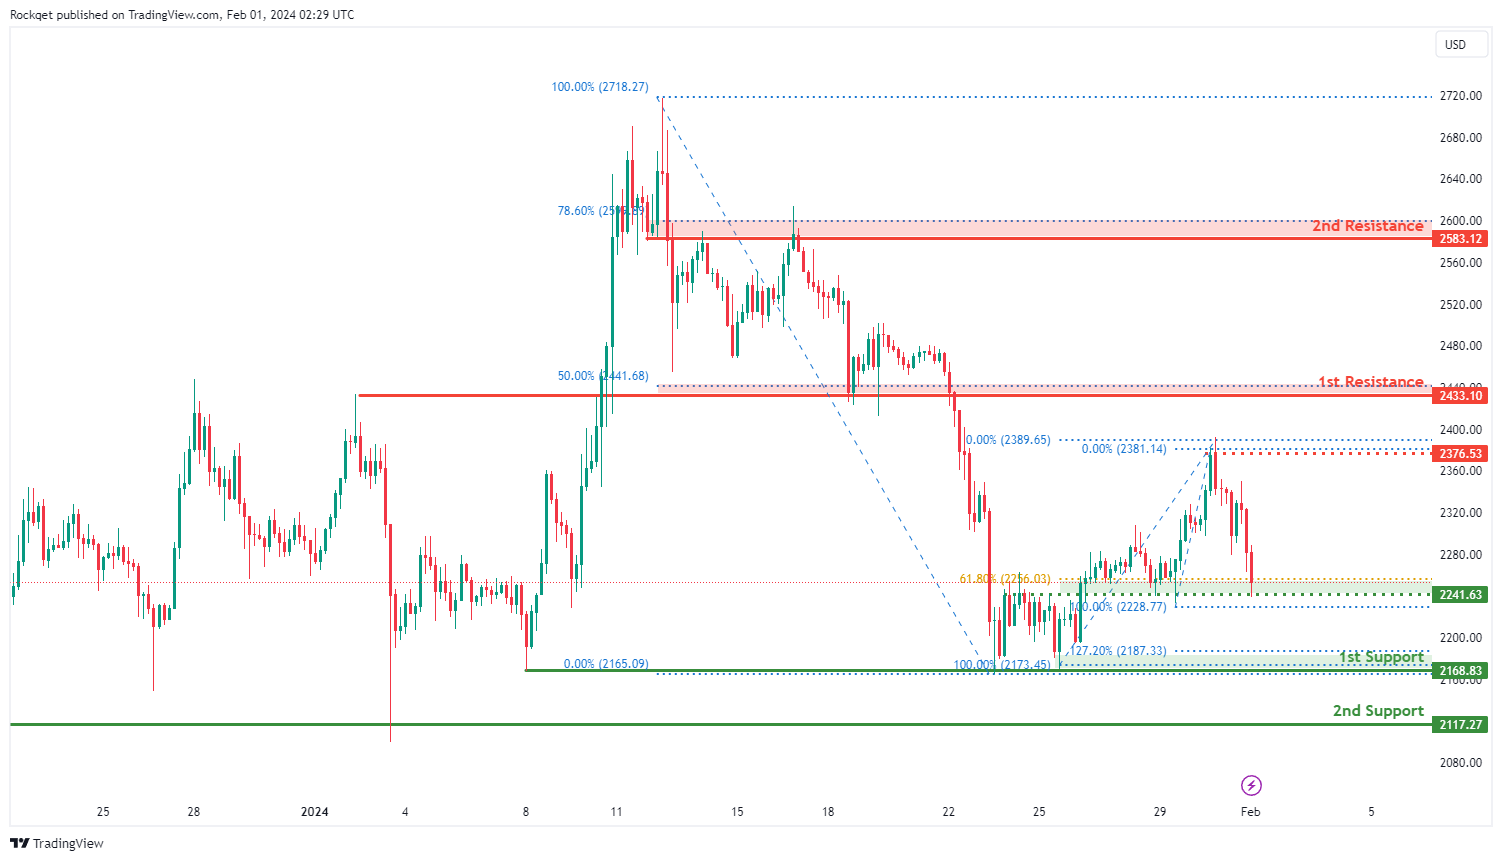
ETH/USD:
The ETH/USD chart currently exhibits a bearish overall momentum, signalling a prevailing downward trend. The analysis suggests that the price could potentially experience a bearish continuation towards the 1st support level.
The 1st support at 2168.83 holds significance for several reasons. Firstly, it is identified as an overlap support, denoting a historical level where buying interest has previously emerged. Additionally, this support level aligns with the 127.20% Fibonacci Extension, adding confluence and strength to its importance.
The 2nd support at 2117.27 is recognized as a multi-swing low support, providing additional reinforcement to the potential support zone. Furthermore, the intermediate support at 2376.53 is noted as an overlap support and aligns with the 61.80% Fibonacci Retracement.
On the resistance side, the 1st resistance at 2433.10 is highlighted as an overlap resistance, potentially acting as a barrier to the bearish momentum.
The 2nd resistance at 2583.12 is identified as an overlap resistance and coincides with the 78.60% Fibonacci Retracement, further strengthening the potential resistance zone. Additionally the immediate resistance at 2376.53 is identified as swing-high resistance further reinforcing the resistance zone.
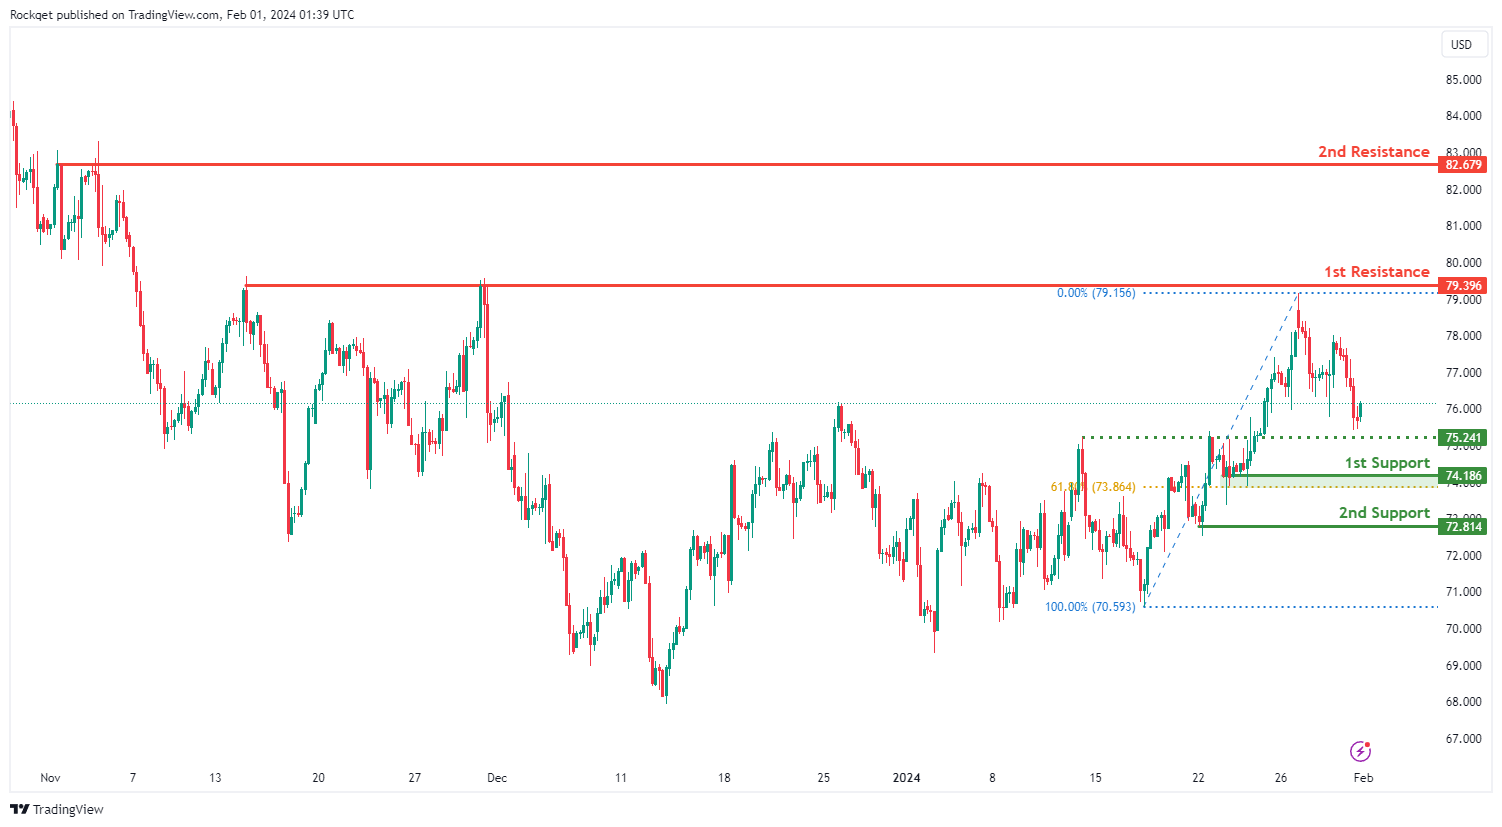
WTI/USD:
The WTI (West Texas Intermediate) chart currently exhibits a weak bullish momentum. In this context, there is a potential scenario for price to make a bullish rise towards the 1st resistance.
The 1st resistance level at 79.39 is identified as a multi-swing-high resistance. Higher up, the 2nd resistance level at 82.67 is noted as a pullback resistance, further highlighting its importance as a potential resistance point.
On the support side, the intermediate support level at 75.24 is identified as a pullback support while the 1st support level at 74.18 is also noted as a pullback support that aligns close to the 61.80% Fibonacci Retracement level. Further below, the 2nd support level at 72.81 is also marked as a pullback support, reinforcing its significance as a key support level.
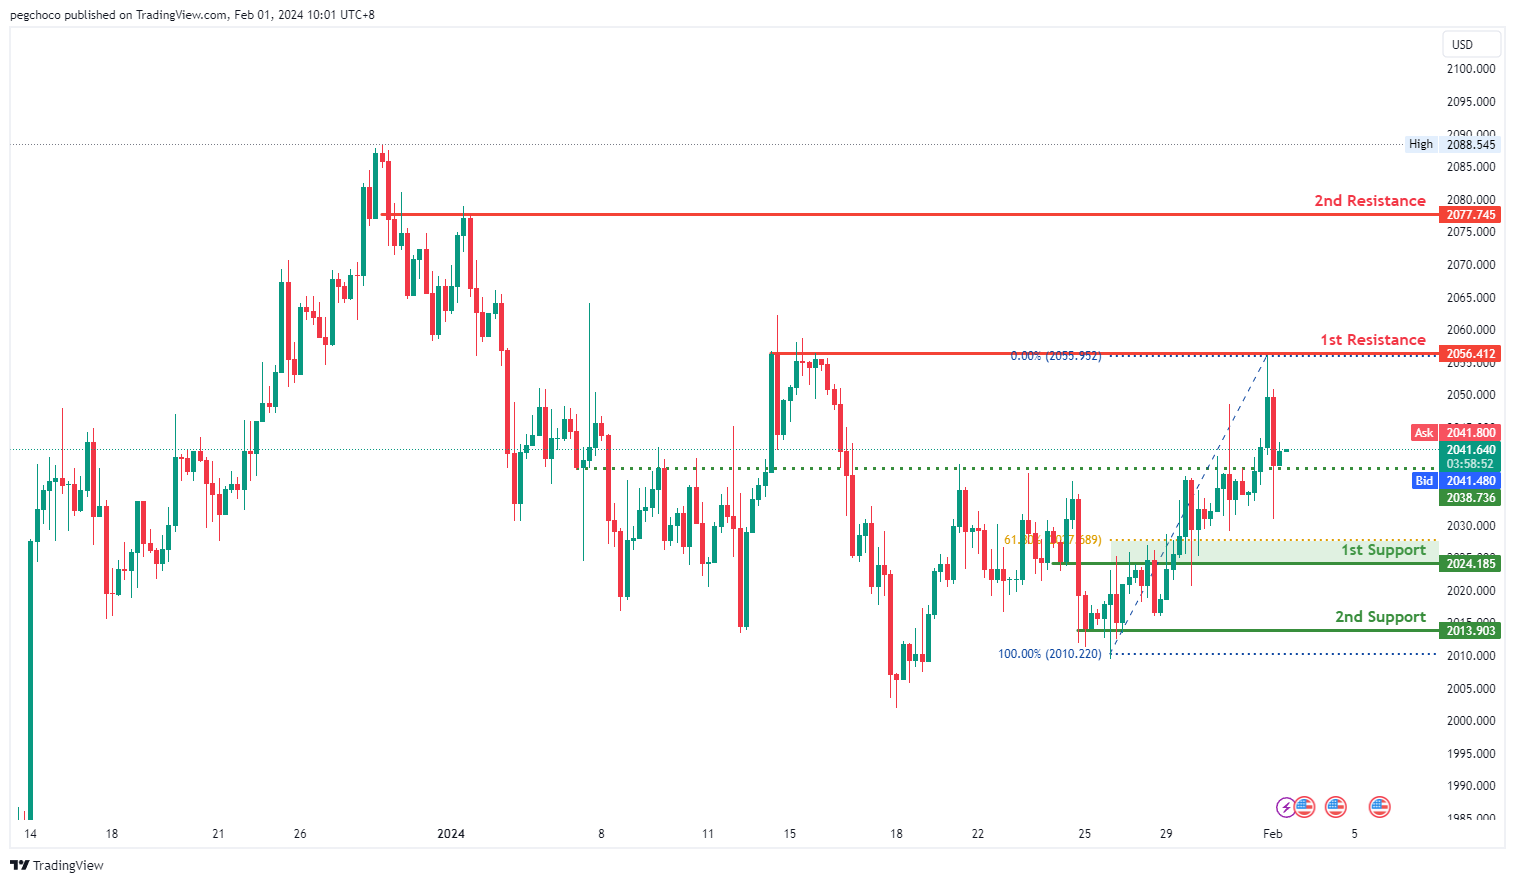
XAU/USD (GOLD):
The XAU/USD chart currently exhibits a bullish overall momentum, indicating an upward trend. Price could potentially experience a short-term drop to the 1st support level before bouncing from there and rising to the 1st resistance level.
The 1st support level at 2024.18 is identified as an overlap support, and it is reinforced by the presence of the 61.80% Fibonacci Retracement. This suggests that it has historical significance and could potentially act as a strong support level where buying interest may emerge.
There is also a 2nd support level at 2013.90, described as a multi-swing low support, further emphasizing its importance as a potential support zone.
On the resistance side, the 1st resistance level at 2056.41 is categorized as a multi-swing high resistance, indicating that it is a historical level where the price has faced resistance.
The 2nd resistance level at 2077.74 is also identified as a multi-swing high resistance, reinforcing the significance of this level as a potential barrier for price movement.
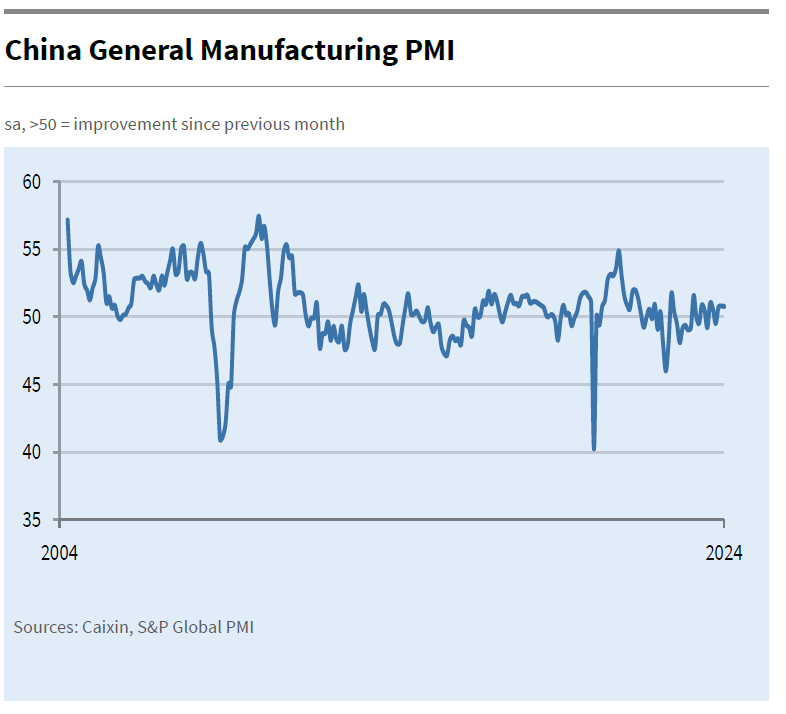
China’s Caixin PMI manufacturing unchanged at 50.8, economic challenges persist
China's Caixin PMI Manufacturing was unchanged at 50.8 in January, matched expectations. The sector showed modest production growth, although the overall sales expansion softened. Notably, this period marked the first rise in new export business in seven months, and business confidence reached a nine-month high. However, the employment sector continued to contract, and the market faced ongoing deflationary pressures.
Wang Zhe, Senior Economist at Caixin Insight Group, highlighted that despite the stability in manufacturing, the Chinese economy still grapples with "significant challenges", including weak demand, employment pressures, and subdued market expectations. He emphasized that these issues are yet to see a "fundamental shift reversal".
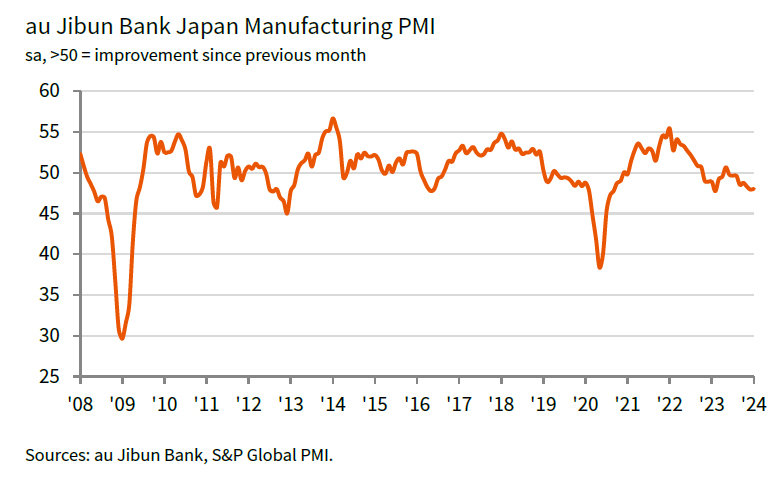
Japan’s PMI manufacturing finalized at 48.0, depressed economy and escalating cost pressures
Japan's PMI Manufacturing was finalized at 48.0 in January, a minimal increase from December's 47.9, yet still indicative of ongoing challenges in the sector.
According to S&P Global, this figure represents a "modest deterioration" in the health of the manufacturing sector, marking a "sustained downturn" at the start of the year.
Usamah Bhatti of S&P Global Market Intelligence highlights the "depressed economic conditions" both domestically and globally as significant contributors to the sector's struggles. The data also shows notable declines in both output and new orders, with the latter experiencing a particularly sharp drop.
Manufacturers in Japan are also facing heightened pressures related to costs and supply. The cost burdens have been rising sharply, driven by increased prices of raw materials, labor, and fuel.
Additionally, supplier performance has deteriorated significantly, marked as the worst in three months. Issues such as delivery and logistical delays have been frequently mentioned, with some attributing these challenges to the ongoing disruption in the Red Sea.
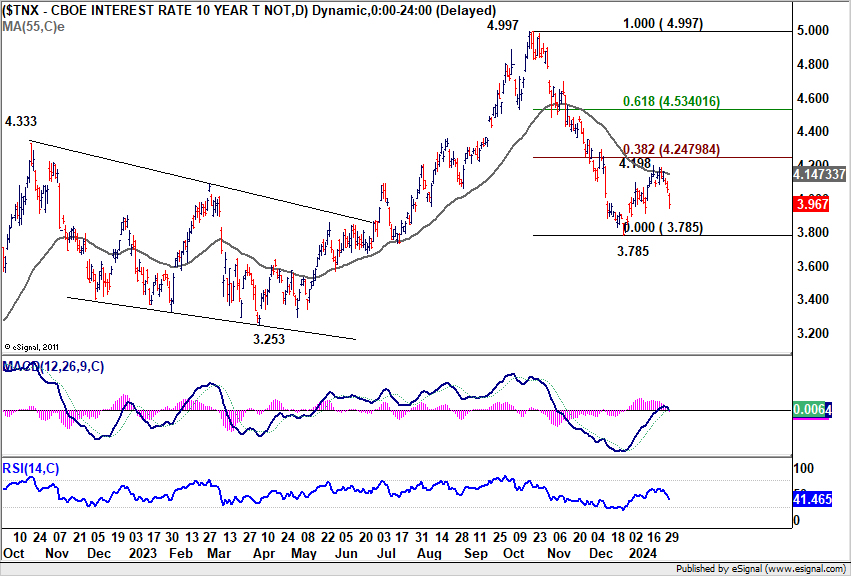
US 10-year yield dives below 4% as fresh bank fears prompt flight-to-safety
US 10-year yield declined significant overnight, closing below 4% psychological at 3.967, as investors flocked to the safety of bonds amidst growing concerns over the banking sector. This shift in sentiment was triggered by New York Community Bancorp's unexpected quarterly loss and subsequent dividend cut, which led to a steep 34% drop in its stock. The unease quickly spread to other smaller lending institutions, reigniting memories of last year's brief banking crisis and spurring a rush towards Treasury bonds.
This flight to safety was further influenced by the Treasury Department's announcement. It revealed moderate increases in upcoming Treasury auctions for shorter-duration bonds, specifically two-, three-, and five-year government bonds, while signaling only minimal increases for longer durations, including 10 years and beyond. Notably, the Treasury indicated that these adjustments are likely to be the last for several quarters.
Technically, 10-year yield's rebound from 3.785 should have completed at 4.198, after rejection by 55 D EMA (now at 4.147), and ahead of 38.2% retracement of 4.997 to 3.785 at 4.247. Deeper fall is expected towards 3.785 low, but stronger support should be seen there to bring rebound, to extend sideway trading first. However, firm break of 3.785 will resume the whole decline from 4.997, with 3.253 medium term support as next target.
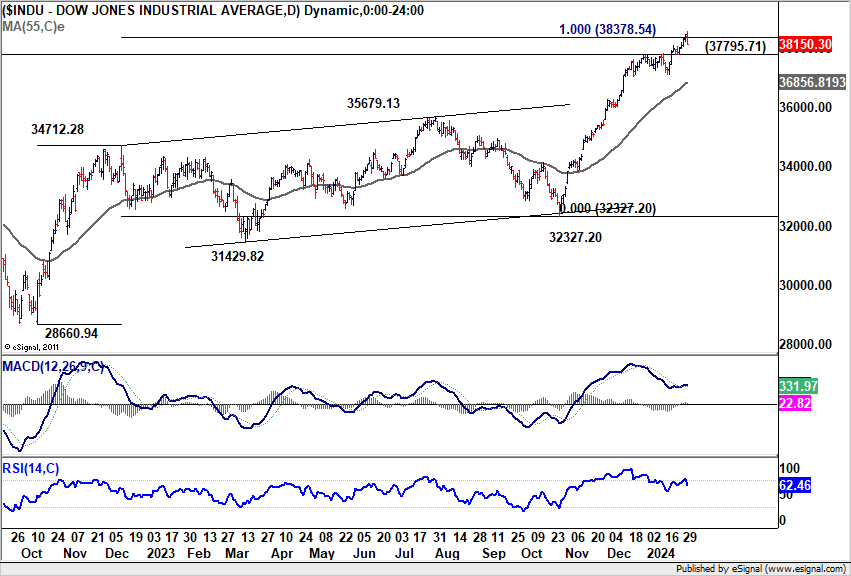
Dow tumbles as Fed Powell rules out March rate cut
US stocks plunged sharply overnight, following Fed's decision to maintain the interest rate at 5.25-5.50%. While Fed finally dropped tightening bias, indicating the peak of the tightening cycle, it firmly dismissed the possibility of an imminent rate cut in March.
Chair Jerome Powell's statement during the post-meeting press conference was clear: "I don't think it's likely that the committee will reach a level of confidence by the time of the March meeting to identify March is the time to do that".This comment has effectively quashed hopes for an early rate cut.
Policy loosening is still underway, echoing December's dot plot. Powell said, "We believe that our policy rate is likely at its peak for this tightening cycle and that if the economy evolves broadly as expected, it will likely be appropriate to begin dialing back policy restraint, at some point this year."
- Fed Review: In a Risk Management Mode
- FOMC Removes "Bias" To Tighten, but Don't Expect Imminent Easing
- Fed Holds Rates, Signals No Rush to Start Cutting
In response to these developments, DOW closed down -317.01 pts or -0.81% at 38150.30. Near term focus is now on 37795.71 support. Decisive break there will confirm initial rejection by 100% projection of 28660.94 to 34712.28 from 32327.20, possibly on bearish divergence condition in D MACD too. That would kick start a correction phase back to 55 D EMA (now at 36856.81).
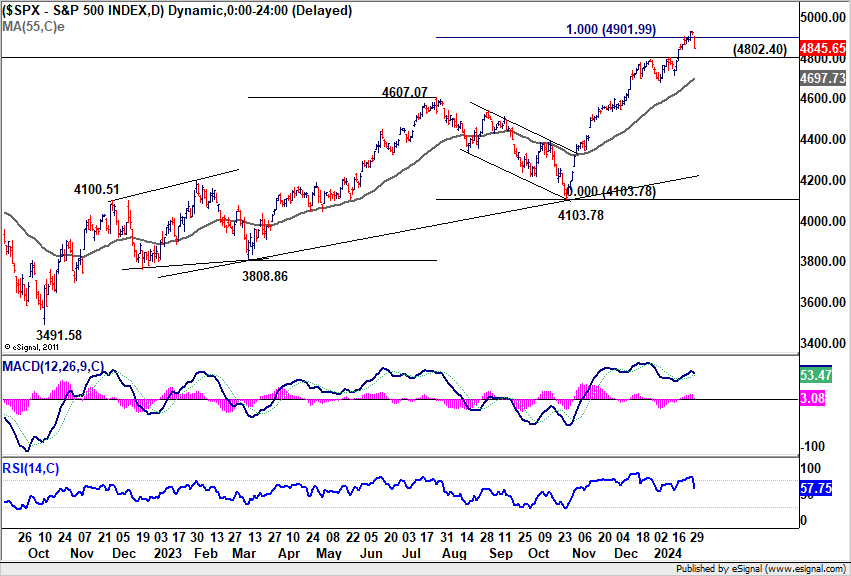
Similarly, for S&P 500, break of 4802.40 support will confirm short term bottoming, after rejection by 100% projection of 3808.86 to 4607.07 from 4103.78, on bearish divergence condition in D MACD. Deeper correction should then be seen to 55 D EMA (now at 4697.73).
EURCAD: Price Approaches A Crucial Pivot
As Germany faces consecutive economic contractions and the broader Eurozone grapples with diverse economic conditions, the upcoming flash CPI inflation figures take center stage. These figures will shape market expectations regarding potential rate cuts, with the ECB carefully navigating uncertainties surrounding global conflicts, labor shortages, and inflationary pressures. The Eurozone's economic trajectory remains fluid, and policymakers must strike a delicate balance to ensure stability and address emerging challenges in the months ahead.
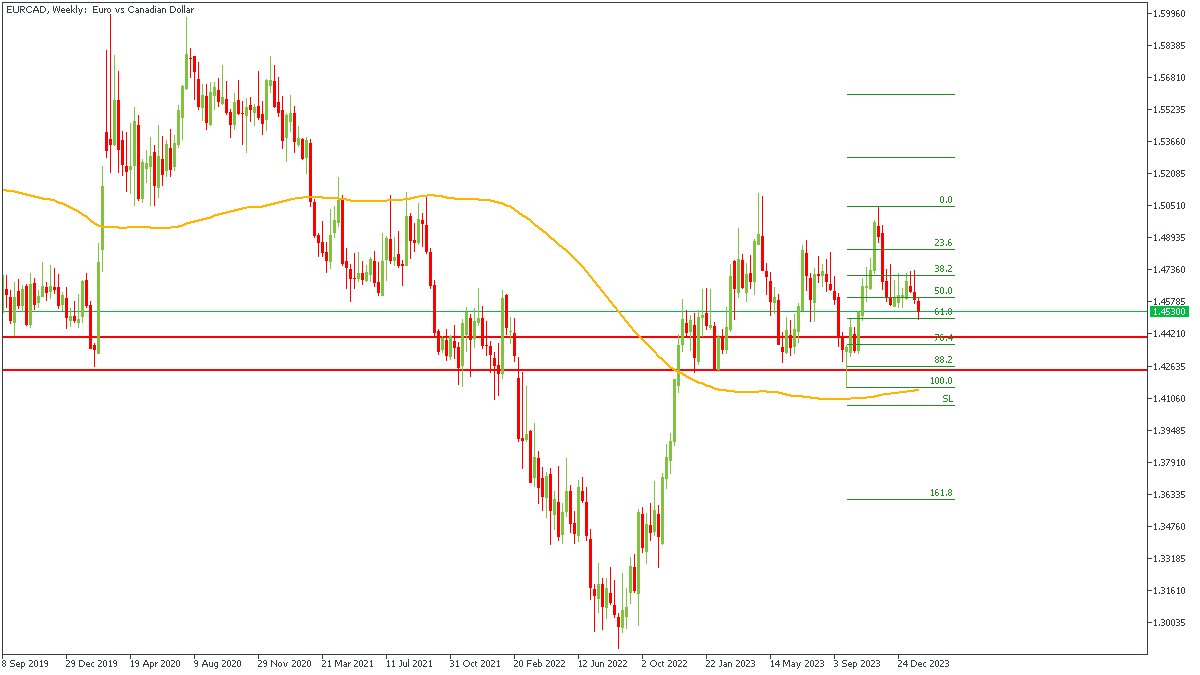
EURCAD - W1 Timeframe
EURCAD on the weekly timeframe is approaching the key pivot zone. It is important to note that this pivot zone rests between the 76% and 88% of the Fibonacci retracement levels, making it an even more powerful area of support. The 100-period moving average is also within close range, and can be expected to provide further support as may be required.
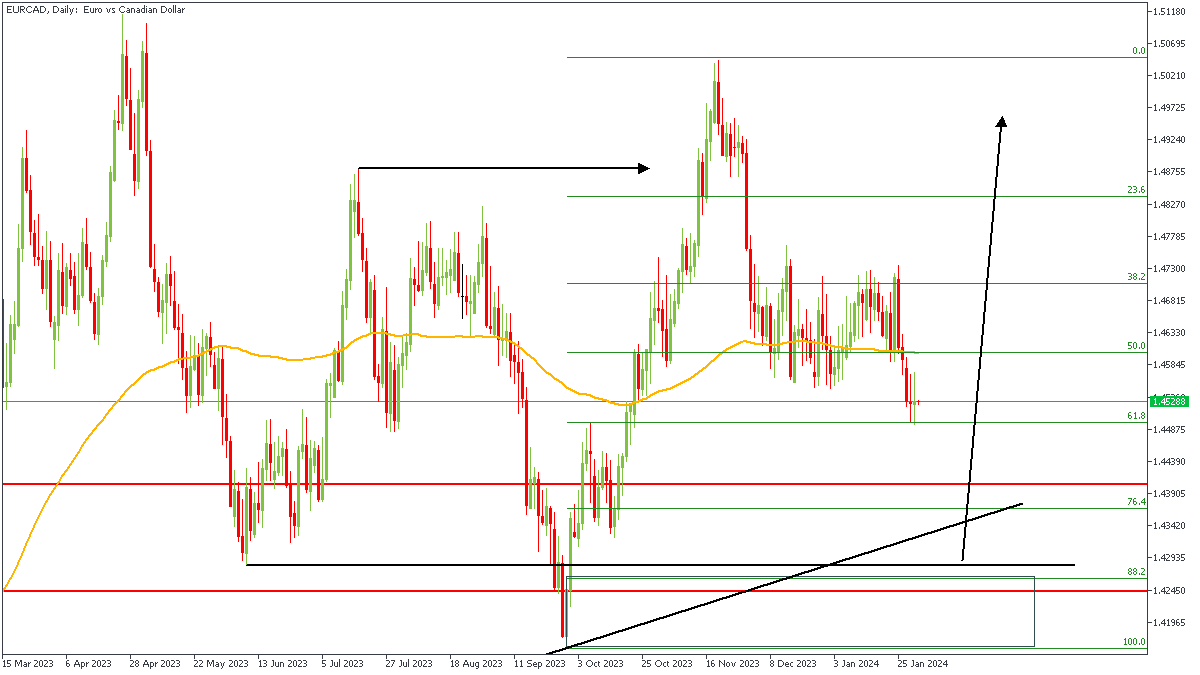
EURCAD - D1 Timeframe
On the Daily timeframe, we see what looks like an inverted head-and-shoulders pattern, with the demand zone formed at the head fitting perfectly into the pivot zone. There is also a trendline support in sight, and the market structure is clearly bullish following the break above the previous high as highlighted on the chart with the horizontal arrow.
Analyst’s Expectations:
- Direction: Bullish
- Target: 1.49717
- Invalidation: 1.41530
CONCLUSION
The trading of CFDs comes at a risk. Thus, to succeed, you have to manage risks properly. To avoid costly mistakes while you look to trade these opportunities, be sure to do your due diligence and manage your risk appropriately.
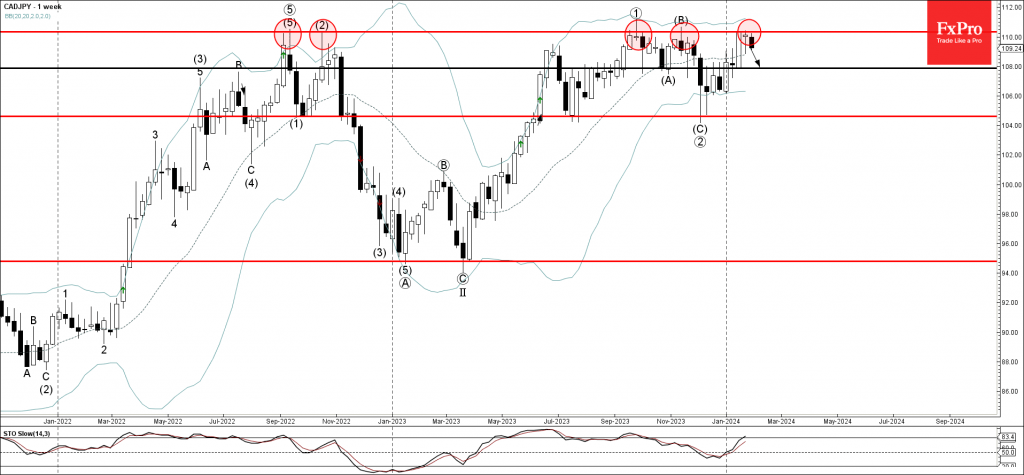
CADJPY Wave Analysis
- CADJPY reversed from long-term resistance level 110.30
- Likely to fall to support level 108.00
CADJPY currency pair recently reversed down from the major long-term resistance level 110.30, which reversed the price twice in 2022.
The resistance level 110.30 was strengthened by the upper weekly and the daily Bollinger Bands.
Given the strength of the resistance level 110.30 and the overbought weekly Stochastic, CADJPY can be expected to fall further to the next support level 108.00.
(FED) Federal Reserve Issues FOMC Statement
Recent indicators suggest that economic activity has been expanding at a solid pace. Job gains have moderated since early last year but remain strong, and the unemployment rate has remained low. Inflation has eased over the past year but remains elevated.
The Committee seeks to achieve maximum employment and inflation at the rate of 2 percent over the longer run. The Committee judges that the risks to achieving its employment and inflation goals are moving into better balance. The economic outlook is uncertain, and the Committee remains highly attentive to inflation risks.
In support of its goals, the Committee decided to maintain the target range for the federal funds rate at 5-1/4 to 5-1/2 percent. In considering any adjustments to the target range for the federal funds rate, the Committee will carefully assess incoming data, the evolving outlook, and the balance of risks. The Committee does not expect it will be appropriate to reduce the target range until it has gained greater confidence that inflation is moving sustainably toward 2 percent. In addition, the Committee will continue reducing its holdings of Treasury securities and agency debt and agency mortgage-backed securities, as described in its previously announced plans. The Committee is strongly committed to returning inflation to its 2 percent objective.
In assessing the appropriate stance of monetary policy, the Committee will continue to monitor the implications of incoming information for the economic outlook. The Committee would be prepared to adjust the stance of monetary policy as appropriate if risks emerge that could impede the attainment of the Committee's goals. The Committee's assessments will take into account a wide range of information, including readings on labor market conditions, inflation pressures and inflation expectations, and financial and international developments.
Voting for the monetary policy action were Jerome H. Powell, Chair; John C. Williams, Vice Chair; Thomas I. Barkin; Michael S. Barr; Raphael W. Bostic; Michelle W. Bowman; Lisa D. Cook; Mary C. Daly; Philip N. Jefferson; Adriana D. Kugler; Loretta J. Mester; and Christopher J. Waller.
Fed Review: In a Risk Management Mode
- The Fed maintained its monetary policy unchanged, as widely expected. Powell signalled optimism on inflation but pushed back on March cut.
- We still stick to our call for a first cut in the next meeting, and will focus on labour supply and leading growth data during the intermeeting period. Phasing out QT will also be discussed more in-depth in March, no new signals today.
- EUR/USD price action around the FOMC meeting should be viewed in light of the drop in US rates following renewed concerns about the health of US regional banks. In the end, EUR/USD finished close to the 1.08 level and about flat on the day, we still look for 1.07 in 6M and 1.05 in 12M.
The Fed remains firmly 'in a risk management mode' as it continues to make progress on both sides of the dual mandate. Powell struck an optimistic tone on inflation, stating that data seen so far has been 'good enough' and that the Fed simply needs to see more similar evidence on disinflation in order to initiate the cutting cycle. There are two-sided risks to starting either too late or too early, but the cuts are ultimately on the way in any case.
We stick to our call for a first cut in March followed by gradual quarterly reductions thereafter, as we think the approach still fits well with the Fed's risk management stance. Market prices in around 35% probability for the March cut.
What would be needed for the Fed to opt for a cut already in the next meeting? Powell continued to emphasize recovering labour supply as a key factor balancing the labour market. The flow of workers from outside the labour force and into employment slowed abruptly in December (Chart 1), and we will see if the tide turned higher again in the Friday's Jobs Report. Powell was confident that housing inflation would continue to slow down as past moderation in rental price growth feeds into the official measures. According to the NY Fed's Multivariate Core estimate, sector-specific housing is clearly the most important contributor to underlying inflation, while other factors have already eased markedly, suggesting that further positive news on inflation might be on the way.
We will also closely follow early indicators for growth. The uptick in January Flash PMIs rhymed well with the late-2023 easing in financial conditions, recovery in household real incomes and also Powell's comments on anecdotal evidence. That said, some regional manufacturing indices have flashed downside risks ahead of the ISM release tomorrow.
On the balance sheet, Powell gave no concrete signals on the timing of QT endgame, and simply stated that the issue would be discussed more in detail in the next meeting. We still think that QT will likely continue at least until the end of 2024.
EUR/USD price action around the FOMC meeting should be viewed in light of the rally ahead of the meeting triggered by renewed concerns about the health of US regional banks. In the end, EUR/USD finished close to the 1.08 level and about flat on the day as the market and the Fed remain undecided on the prospects of a cut in March. We keep our forecasts for EUR/USD unchanged at 1.07 on 6M and 1.05 on 12M.