
Sample Category Title
Gold Price and Crude Oil Price Eye Additional Gains
Gold price started a decent increase above the $2,025 resistance level. Crude oil prices are gaining bullish momentum and might rise toward $82.00.
Important Takeaways for Gold and Oil Prices Analysis Today
- Gold price started a decent increase from the $2,025 zone against the US Dollar.
- A connecting bullish trend line is forming with support near $2,032 on the hourly chart of gold at FXOpen.
- Crude oil prices rallied above the $74.90 and $76.00 resistance levels.
- There was a break above a key bearish trend line with resistance near $76.80 on the hourly chart of XTI/USD at FXOpen.
Gold Price Technical Analysis
On the hourly chart of Gold at FXOpen, the price found support near the $2,008 zone. The price formed a base and started a fresh increase above the $2,025 level.
There was a decent move above the 50-hour simple moving average and $2,032. The bulls pushed the price above the $2,040 resistance zone. Finally, the bears appeared near $2,050, A high is formed near $2,048.32 and the price is now consolidating gains.
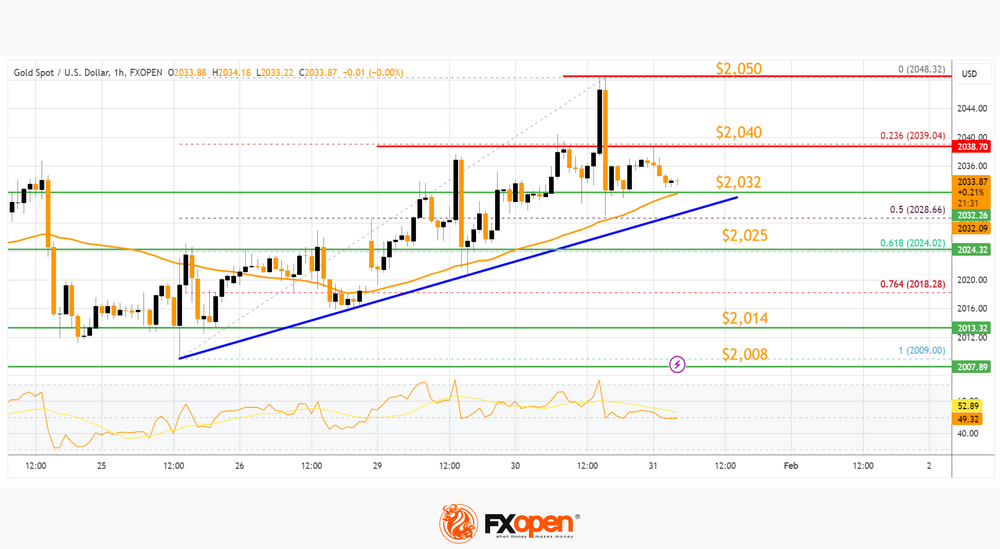
There was a minor move below the 23.6% Fib retracement level of the upward move from the $2,009 swing low to the $2,048 high. The RSI is still stable above 50 and the price could aim for more gains. Immediate resistance is near the $2,040 level.
The next major resistance is near the $2,050 level. An upside break above the $2,050 resistance could send Gold price toward $2,065. Any more gains may perhaps set the pace for an increase toward the $2,080 level.
Initial support on the downside is near the 50-hour simple moving average or $2,032. There is also a connecting bullish trend line forming with support near $2,032. The trend line is close to the 50% Fib retracement level of the upward move from the $2,009 swing low to the $2,048 high.
If there is a downside break below the $2,032 support, the price might decline further. In the stated case, the price might drop toward the $2,014 support.
Oil Price Technical Analysis
On the hourly chart of WTI Crude Oil at FXOpen, the price started a major rally against the US Dollar. The price gained bullish momentum after it broke the $74.90 resistance.
There was a sustained upward move above the $76.00 and $77.85 resistance levels. The bulls pushed the price toward $79.00. The current price action is positive above the 50-hour simple moving average and RSI is stable above 50.
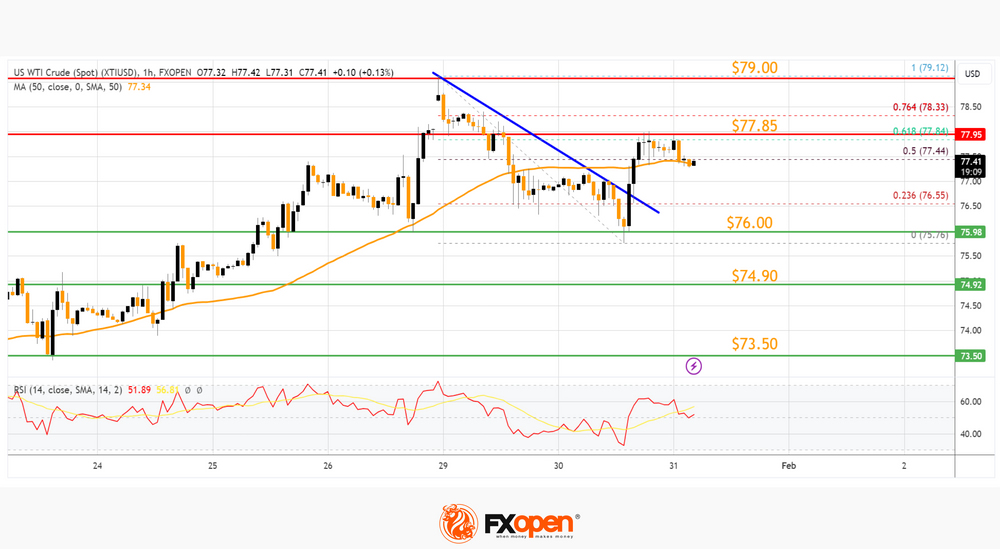
Recently, there was a minor decline from the $79.12 high. The price tested the $76.00 support. It is again rising above the $76.50 level. There was a break above a key bearish trend line with resistance near $76.80.
There was a move above the 50% Fib retracement level of the downward move from the $79.12 swing high to the $75.76 low. If the price climbs further higher, it could face resistance near $77.85.
The 61.8% Fib retracement level of the downward move from the $79.12 swing high to the $75.76 low is also near the $77.85 zone. The next major resistance is near the $79.00 level. Any more gains might send the price toward the $82.00 level.
Conversely, the price might correct gains below the $77.00 zone. The next major support on the WTI crude oil chart is near the $76.00 zone.
If there is a downside break, the price might decline toward $74.90. Any more losses may perhaps open the doors for a move toward the $73.50 support zone.
Start trading commodity CFDs with tight spreads. Open your trading account now or learn more about trading commodity CFDs with FXOpen.
This article represents the opinion of the Companies operating under the FXOpen brand only. It is not to be construed as an offer, solicitation, or recommendation with respect to products and services provided by the Companies operating under the FXOpen brand, nor is it to be considered financial advice.
NASDAQ Falls by 1.5% after Tech Giants Reports
NASDAQ E-Mini futures fell 1.5% in early trading after the publication of quarterly earnings reports from technology giants Google (GOOG), Microsoft (MSFT) and Advanced Micro Devices (AMD):
→ The parent company of Google, Alphabet Inc., reported revenue of 86.3 billion dollars (forecast = 85.2), however, the slowdown in advertising revenue – the most important article in the company's revenue – caused the price of GOOG shares to drop by 2.7% after publication report
→ Microsoft's revenue amounted to 62.0 billion US dollars, increasing by 10% (forecast = 61.2%). Despite the high performance of the cloud segment Azure, the price of Microsoft shares decreased by 3.2% after the publication. Perhaps the MSFT stock market is overbought due to the extreme optimism associated with AI implementation.
→ AMD, the leading semiconductor manufacturing company, also exceeded expectations. Its income was 6.16 billion US dollars (forecast = 6.12). However, the company made a cautious forecast for the next quarter. The price of AMD shares fell by 4.5%.
The cumulative effect of these messages strongly influenced the price of the NASDAQ E-Mini index. Perhaps the market is “letting off steam” after the impressive growth that began in 2023. MarketWatch conveys the opinions of JPMorgan analysts — they believe that today's stock market, which is dominated by large technology companies, has signs of a dotcom bubble.
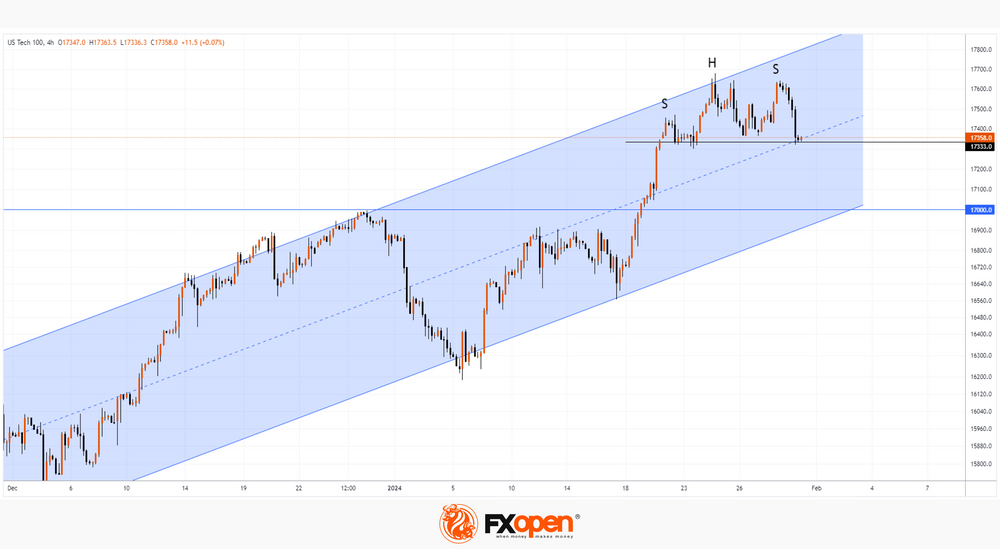
The NASDAQ 100 chart shows that:
→ price forms a bear pattern head-and-shoulders;
→ the price is located near the support block, which forms the median line of the ascending channel (shown in blue) and the support level is 17333.
If bearish sentiments intensify at the opening of the main trading session, the bears can break through the specified support block and direct the price to the block that forms the psychological level of 17,000 and the lower border of the channel.
This article represents the opinion of the Companies operating under the FXOpen brand only. It is not to be construed as an offer, solicitation, or recommendation with respect to products and services provided by the Companies operating under the FXOpen brand, nor is it to be considered financial advice.
CADJPY Perfect Reaction Higher From Equal Legs Area
In this technical blog, we will look at the past performance of the 1-hour Elliott Wave Charts of the CADJPY. The rally from the 07 December 2023 low showed a higher high sequence & provided a short-term extreme trading opportunity. In this case, the pullback managed to reach the equal legs area & provided a perfect reaction higher. So, we advised members not to sell it but to buy the equal legs area for a minimum reaction higher to happen. We will explain the structure & forecast below:
CADJPY 1-Hour Elliott Wave Chart From 1.25.2024
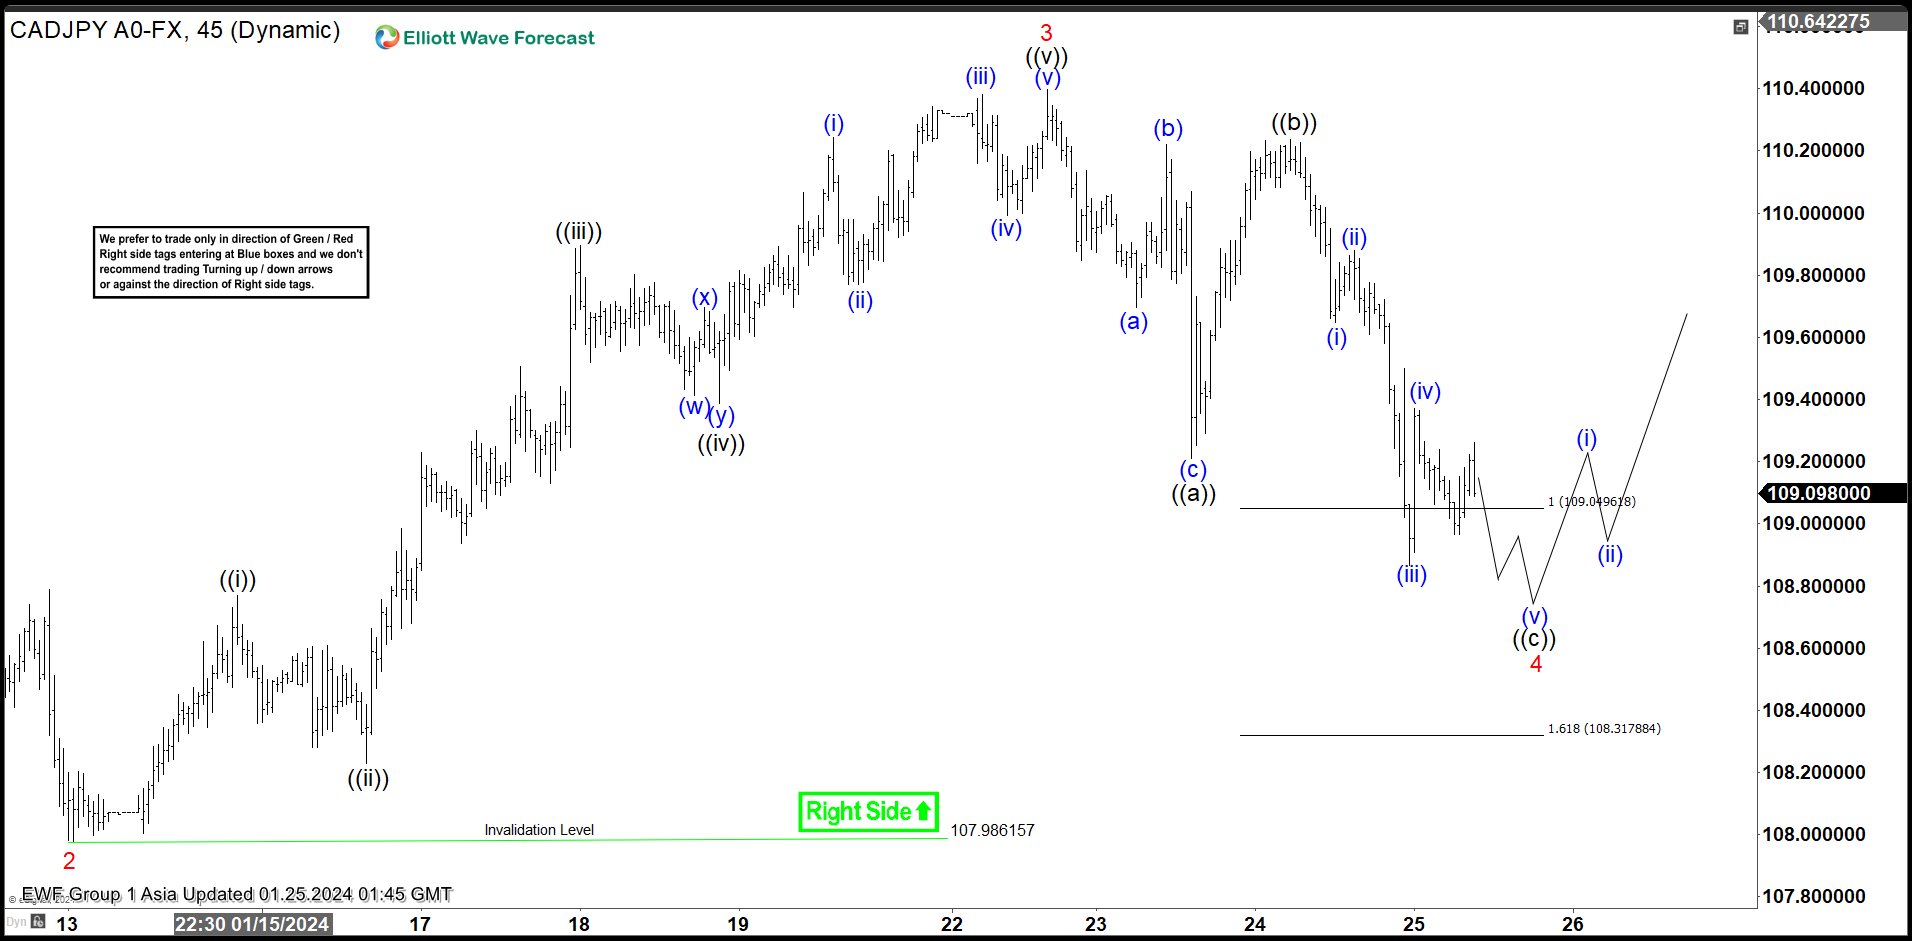
Here’s the 1-hour Elliott wave Chart from the 01/25/2024 Asia update. In which, the rally to 110.29 high ended wave 3 & made a pullback in wave 4. The internals of that pullback unfolded as Elliott wave flat structure where wave ((a)) ended at 109.21 low. Then a short-term bounce to 110.23 high-ended wave ((b)) & started the next leg lower in wave ((c)) towards 109.04- 108.31 equal legs area. From there, buyers were expected to appear looking for new highs ideally or for a 3-wave bounce minimum.
CADJPY Latest 1-Hour Elliott Wave Chart From 1.31.2024
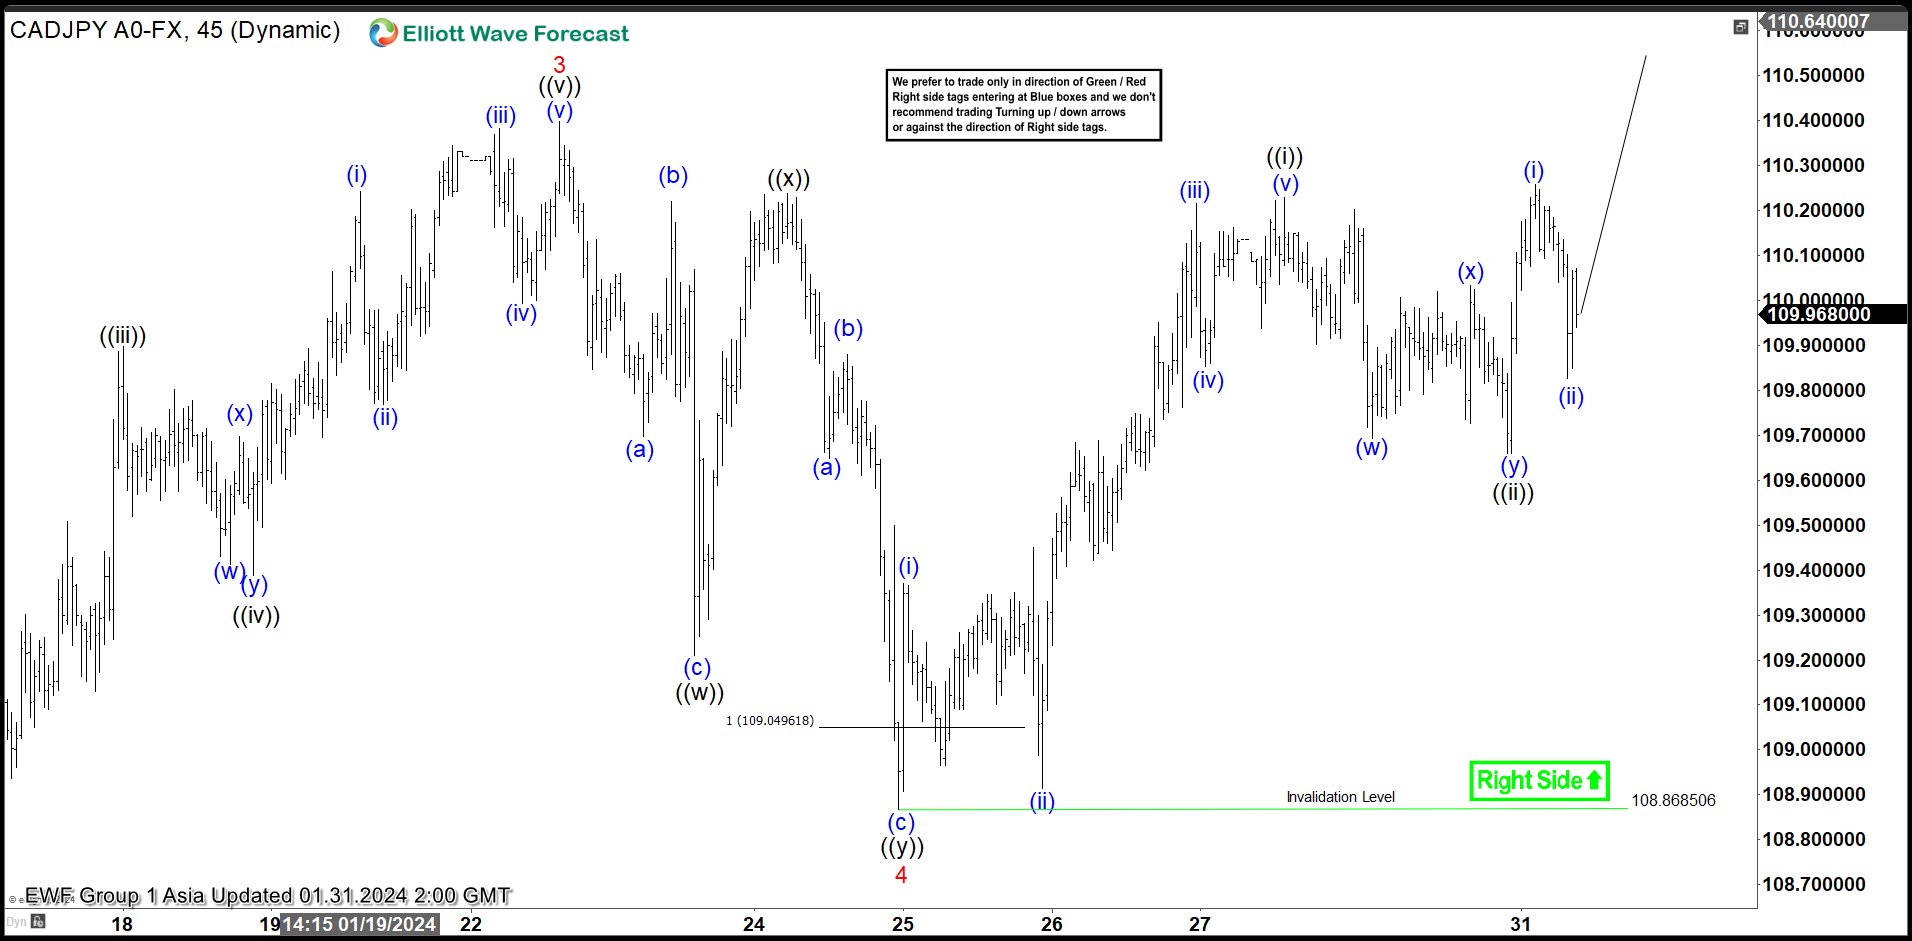
Above is the Latest 1-hour Elliott wave Chart from the 01/31/2024 Asia update. In which the pair is showing a perfect reaction higher taking place from the equal legs area. Right after ending the correction. Allowed members to create a risk-free position shortly after taking a long position. But a break above 110.29 high would still be needed to confirm the next leg higher minimum towards the 110.75- 111.33 area before the next pullback takes place.
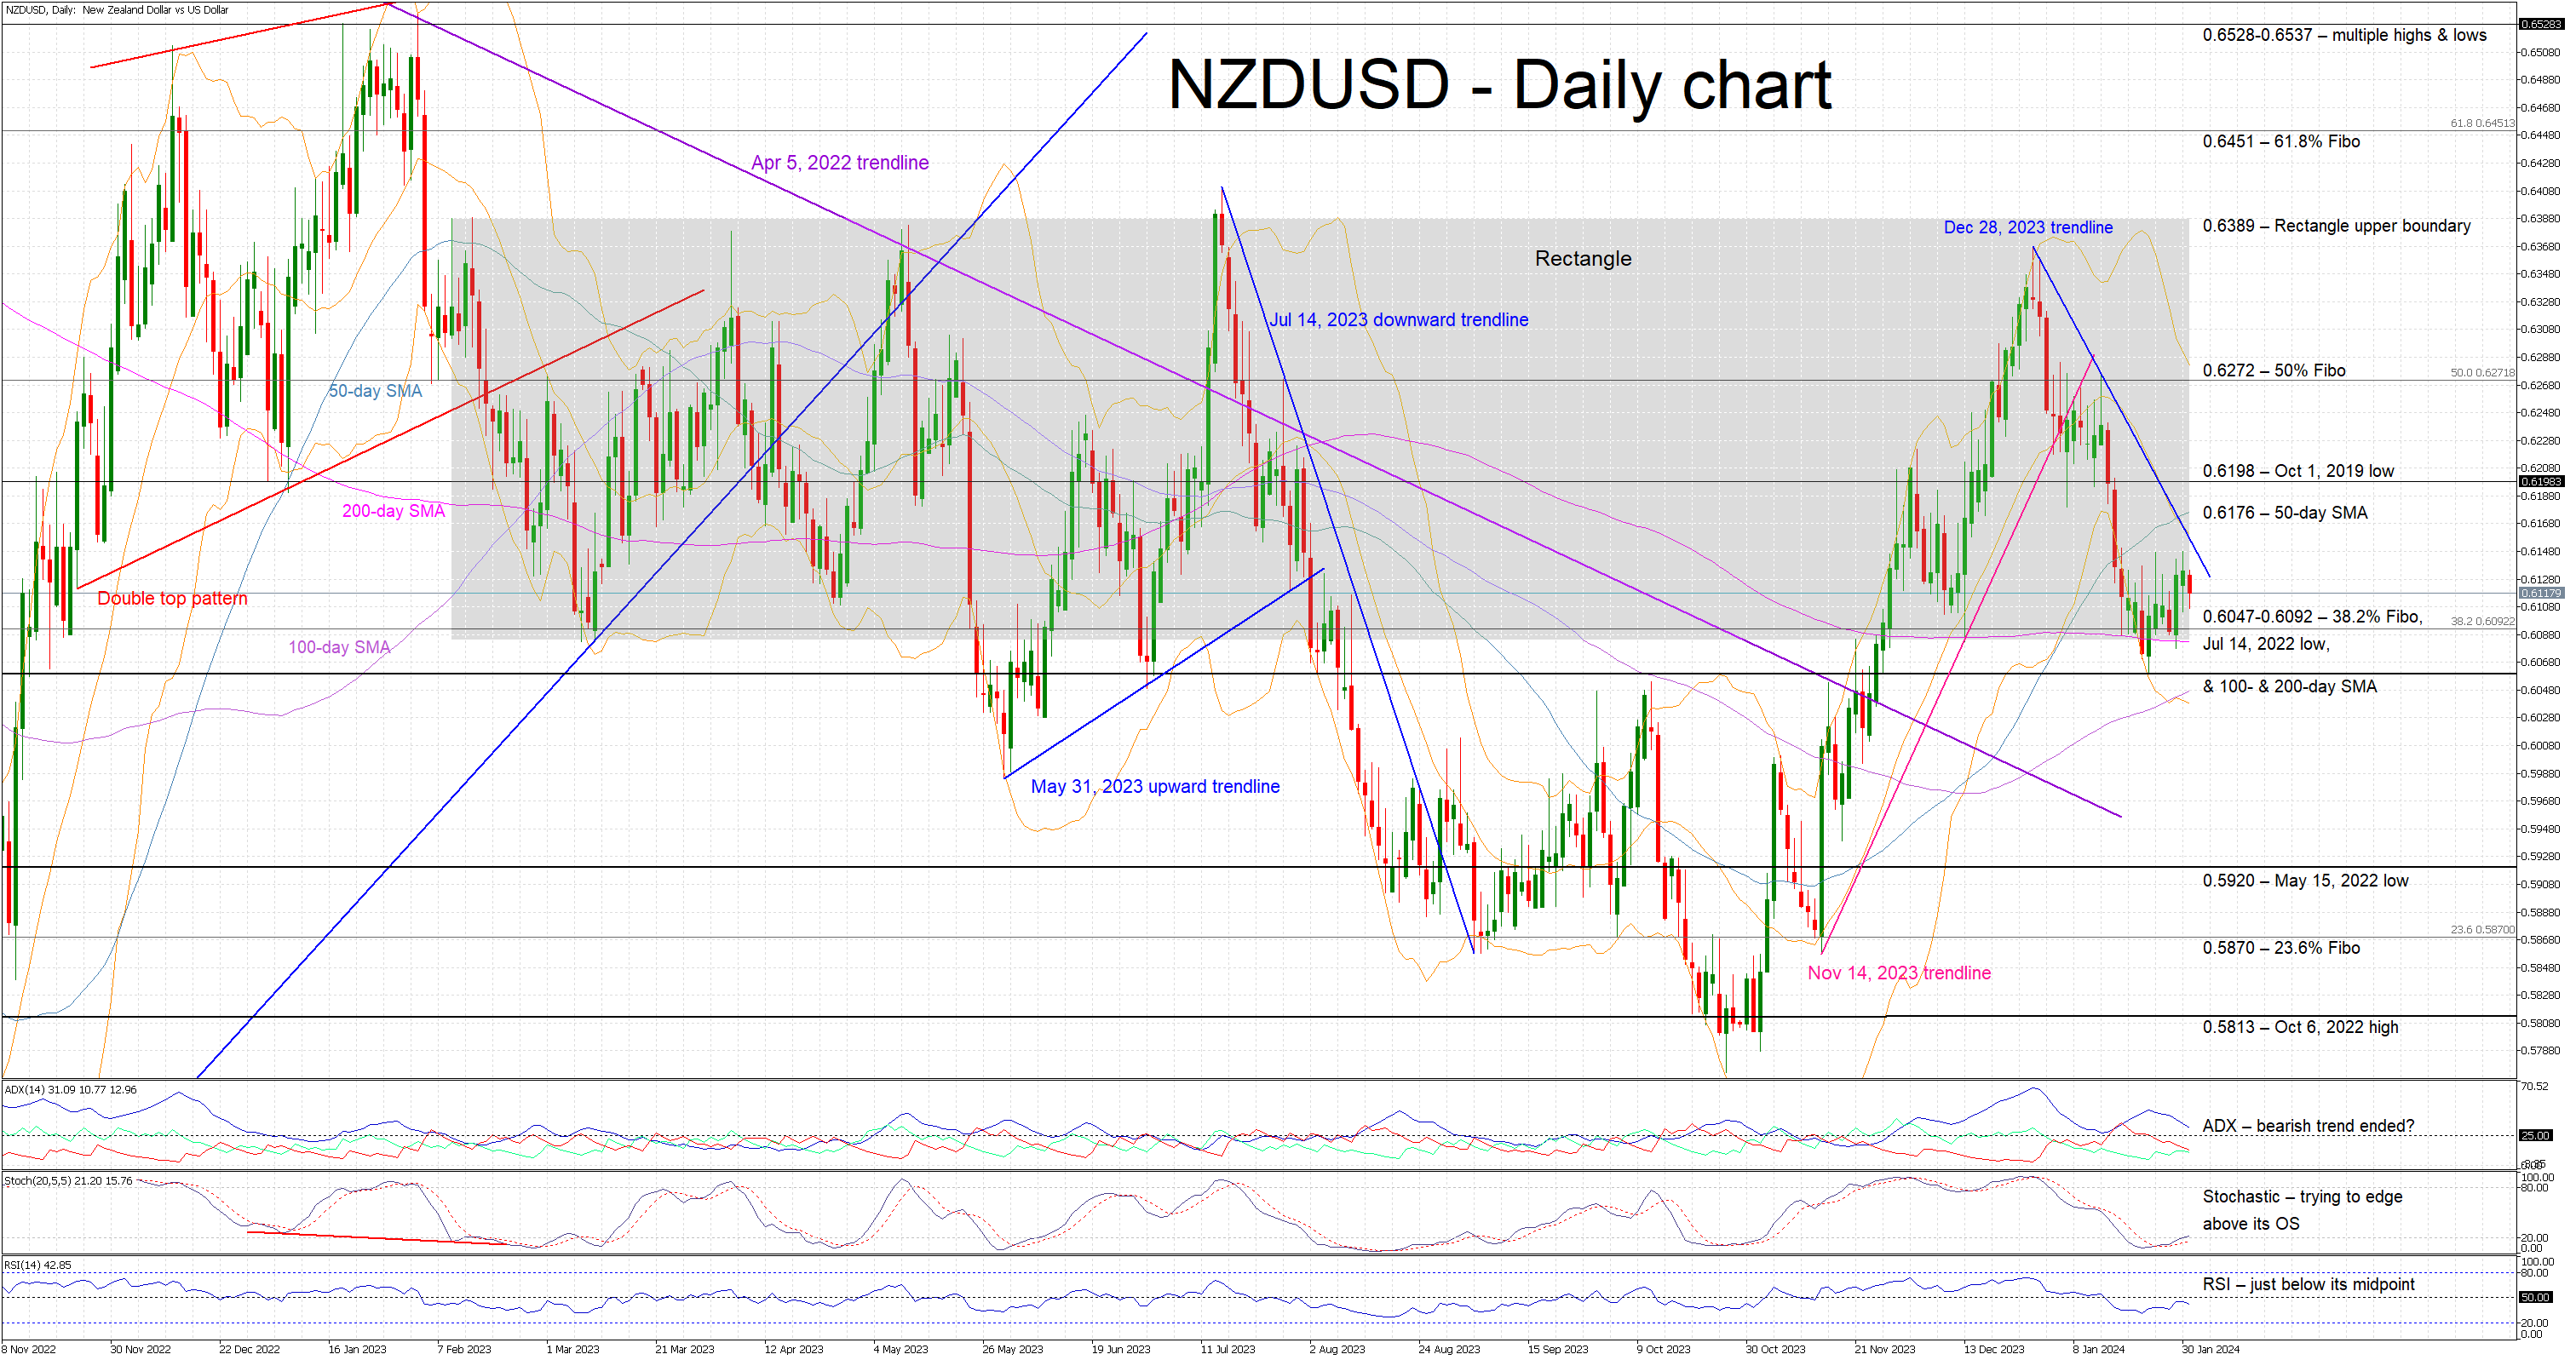
NZDUSD Lacks Clear Direction Ahead of Key Events
- NZUSD continues to hover around a crucial support area
- Market participants appears to be in waiting mode ahead of key market events
- Momentum indicators remain mixed; all eyes on the stochastic oscillator
NZDUSD is in the red today as it continues to range trade in line with the busy 0.6047-0.6092 area and the 200-day simple moving average (SMA) acts as a strong support point. The correction that started since the December 28, 2023 peak and pushed NZDUSD to a new 2-month low has probably concluded. Market participants appear to be in waiting mode as Wednesday’s Fed meeting and Friday’s US labour market statistics could play a significant role in determining the market’s short-term performance.
In the meantime, the momentum indicators reflect this indecisiveness. More specifically, the RSI is still trading a tad below its midpoint. Interestingly, the Average Directional Movement Index (ADX) is moving lower and its D- subcomponent remains stuck well below the 25-midpoint. More importantly, the stochastic oscillator has made a small move higher, above both its moving average and oversold area, but it appears to lack the strength for a more forceful jump.
If the bulls decide to retake the market reins, they could try to push NZDUSD towards the 50-day simple moving average (SMA) at 0.6176, provided they manage to overcome the resistance set by the December 28, 2023 descending trendline. The October 1, 2019 low at 0.6198 is tad higher with the next target possibly coming at the 50% Fibonacci retracement of the April 5, 2022 – October 13, 2022 downtrend at 0.6272.
On the flip side, the bears are probably keen for another correction. They could try to finally break below the 0.6047-0.6092 area, which is populated by the 38.2% Fibonacci retracement, the July 14, 2022 low and the 100- and 200-day SMAs. The path then appears to be clear until the May 15, 2022 low at 0.5920.
To sum up, NZDUSD is trading sideways as market participants are probably focusing on the key market events and monitoring the stochastic oscillator's reaction.
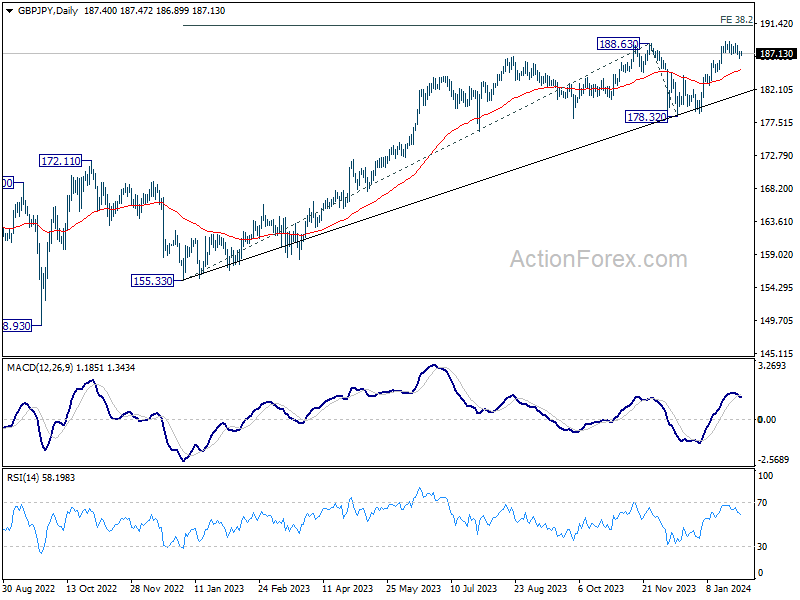
GBP/JPY Daily Outlook
Daily Pivots: (S1) 186.77; (P) 187.21; (R1) 187.91; More...
Intraday bias in GBP/JPY stays neutral at this point, and consolidation from 188.90 could extend. Further rally is expected as long as 186.14 support holds. Break of 188.90, and sustained trading above 188.63, will confirm up trend resumption. Next target is 38.2% projection of 155.33 to 188.63 from 178.32 at 191.04. However, break of 186.14 will turn bias to the downside for deeper pullback.
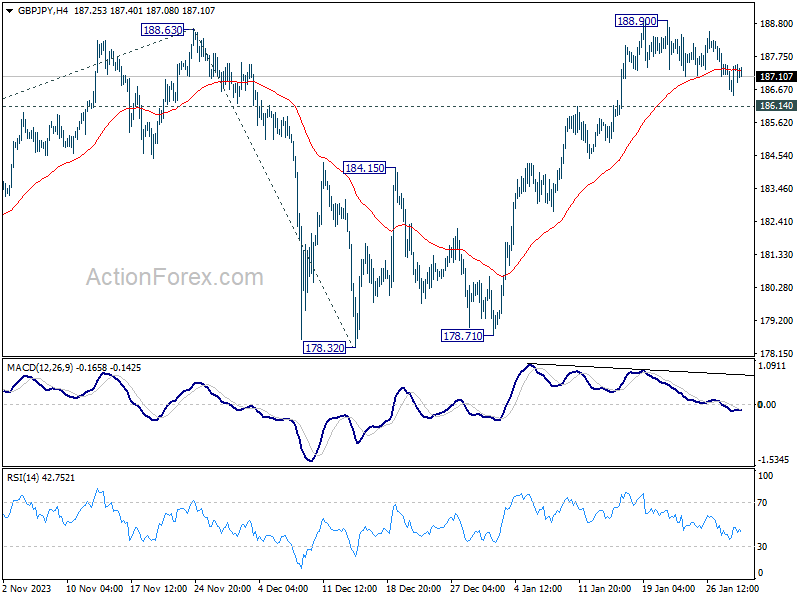
In the bigger picture, up trend from 123.94 (2020 low) in in progress. Medium term outlook will stay bullish as long as 178.32 support holds. Next target is 195.86 long term resistance (2015 high).
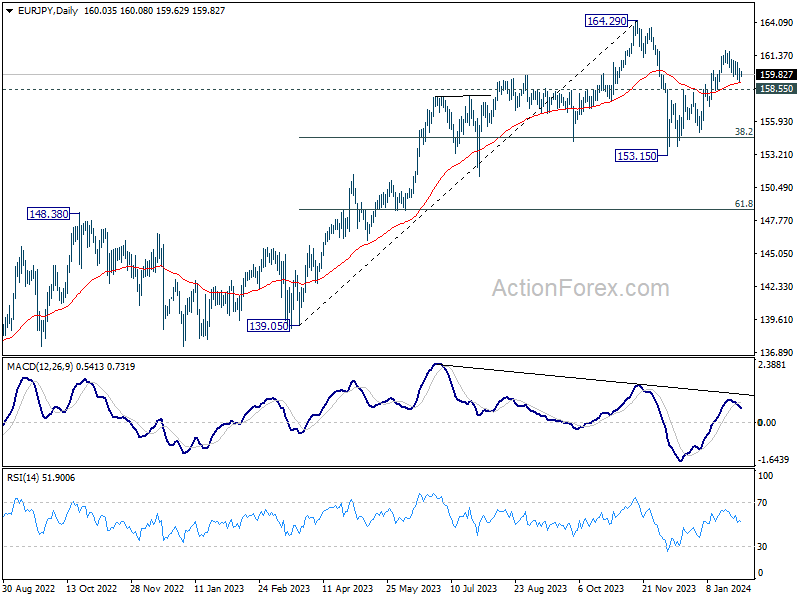
EUR/JPY Daily Outlook
Daily Pivots: (S1) 159.42; (P) 159.88; (R1) 160.54; More...
Intraday bias in EUR/JPY stays neutral at this point, and outlook is unchanged. While deeper retreat cannot be ruled out, further rally is expected as long as 158.55 resistance turned support holds. On the upside, break of 160.91 minor resistance will argue that rise from 153.15 is ready to resume through 161.84. Nevertheless, firm break of 158.55 will dampen this view and turn bias back to the downside instead.
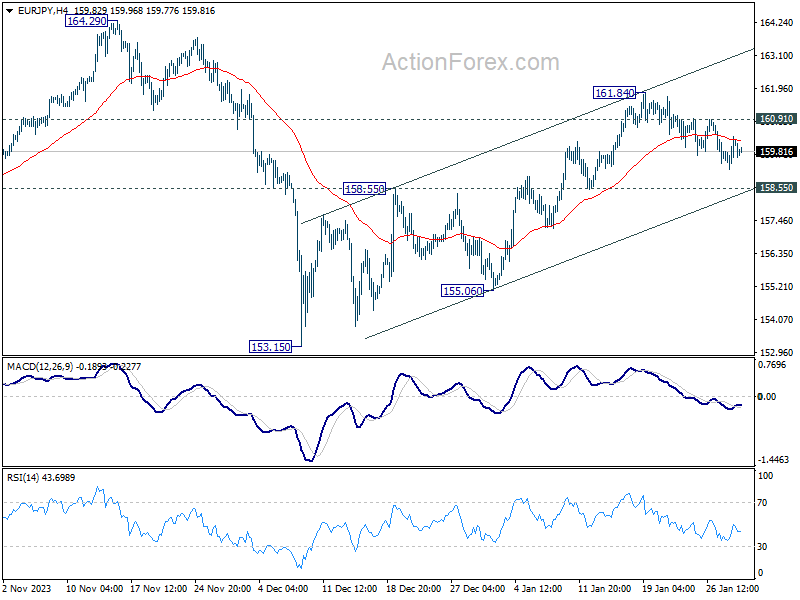
In the bigger picture, price actions from 164.29 medium term top are seen as a correction to rise from 139.05 only. As long as 148.48 resistance turned support holds (2022 high), larger up trend from 114.42 (2020 low) is expected to resume through 164.29 at a later stage.
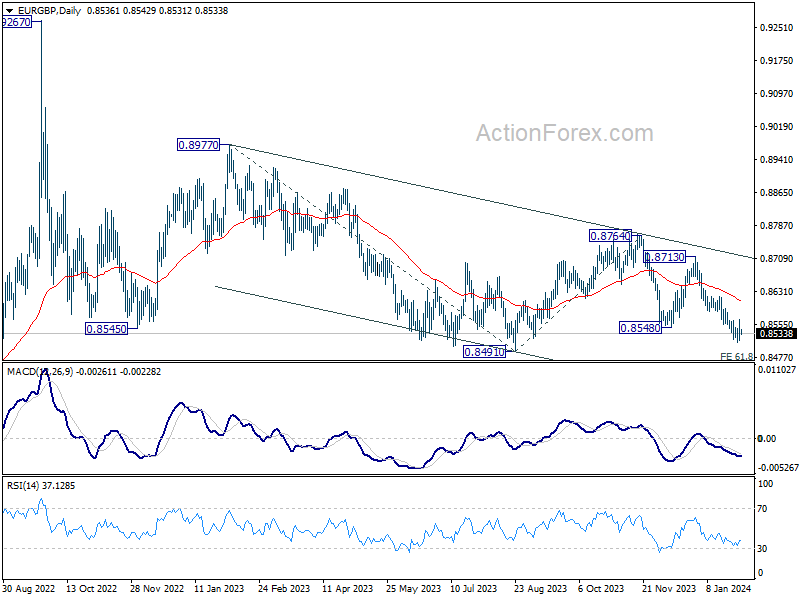
EUR/GBP Daily Outlook
Daily Pivots: (S1) 0.8515; (P) 0.8542; (R1) 0.8566; More...
EUR/GBP failed to break through 0.8563 minor resistance decisively, and intraday bias remains neutral. On the upside, firm break of 0.8563 will suggest short term bottoming, on bullish convergence condition in 4H MACD. Intraday bias will be turned to the upside for stronger rebound to 55 D EMA (now at 0.8610). On the downside, break of 0.8512 will resume the fall from 0.8764 to retest 0.8491 support instead.
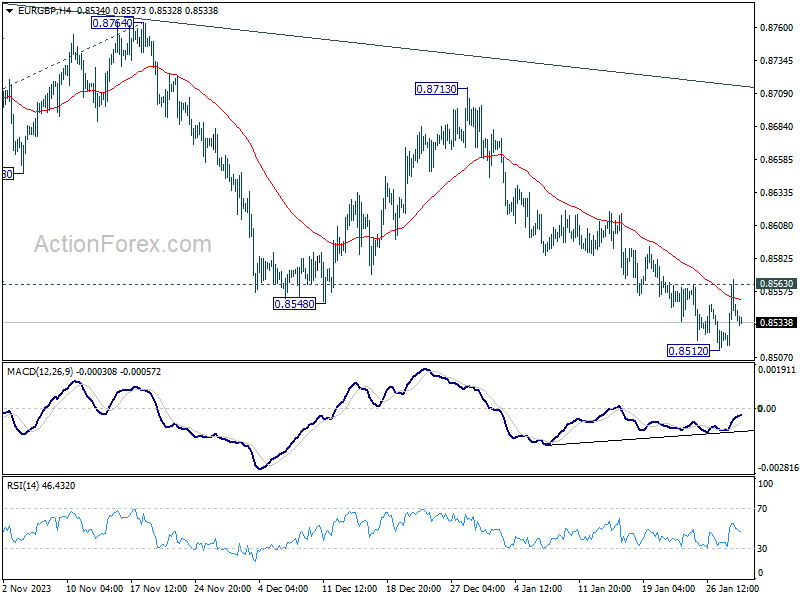
In the bigger picture, fall from 0.8764 is seen as another leg in the whole down trend from 0.9267 (2022 high). Outlook will stay bearish as long as 0.8713 resistance holds. Break of 0.8491 will target 61.8% projection of 0.8977 to 0.8491 from 0.8764 at 0.8464.
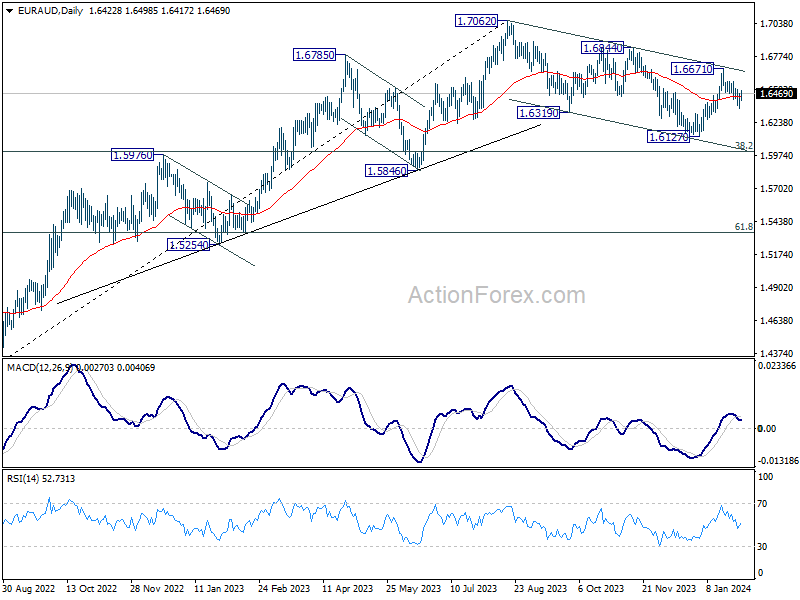
EUR/AUD Daily Outlook
Daily Pivots: (S1) 1.6359; (P) 1.6418; (R1) 1.6486; More...
Intraday bias in EUR/AUD remains neutral for the moment. On the upside, break of 1.6512 minor resistance will argue that pull back from 1.6671 has completed, and revive near term bullishness. Intraday bias will be back on the upside for 1.6671 resistance. On the downside, break of 1.6348 will resume the fall to 1.6127 support.
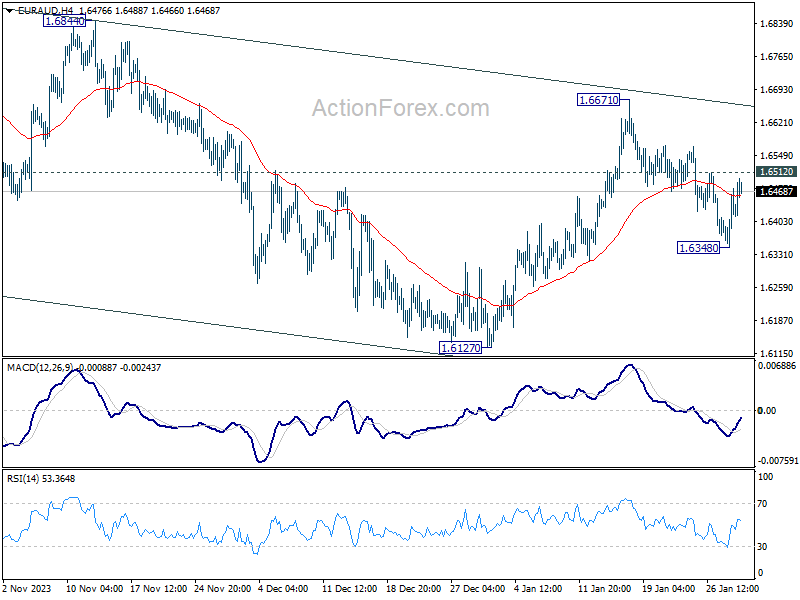
In the bigger picture, fall from 1.7062 medium term top is seen as correction to the up trend from 1.4281 (2022 low). Break of 1.6844 resistance will argue that this up trend is ready to resume through 1.7062 high. In case of another fall, strong support should be seen around 1.5846 and 38.2% retracement of 1.4281 to 1.7062 at 1.6000 to bring rebound.
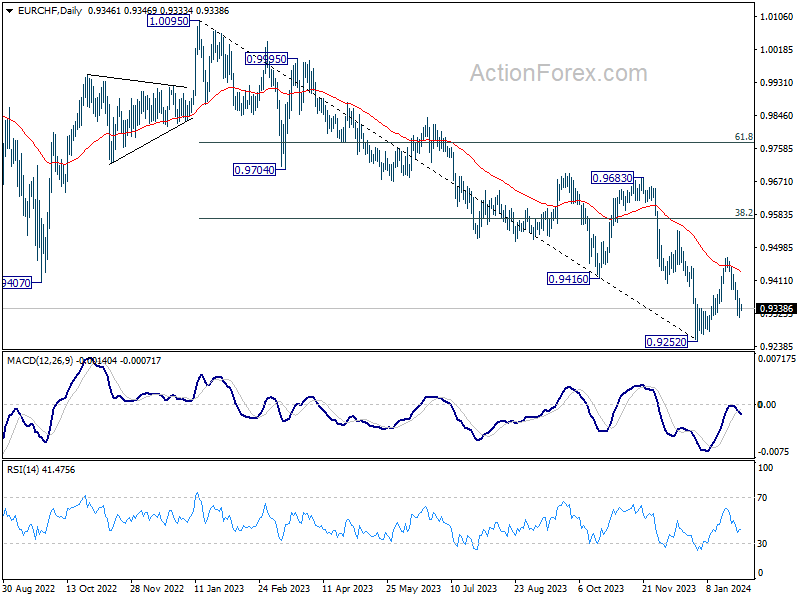
EUR/CHF Daily Outlook
Daily Pivots: (S1) 0.9319; (P) 0.9343; (R1) 0.9370; More...
Intraday bias in EUR/CHF is turned neutral first with current recovery. While fall from 0.9471 could extend lower, strong support is still expected above 0.9252 low to bring rebound. On the upside, above 0.9388 minor resistance will turn bias back to the upside. Further break of 0.9471 will resume the rebound from 0.9252 to 38.2% retracement of 1.0095 to 0.9252 at 0.9574.
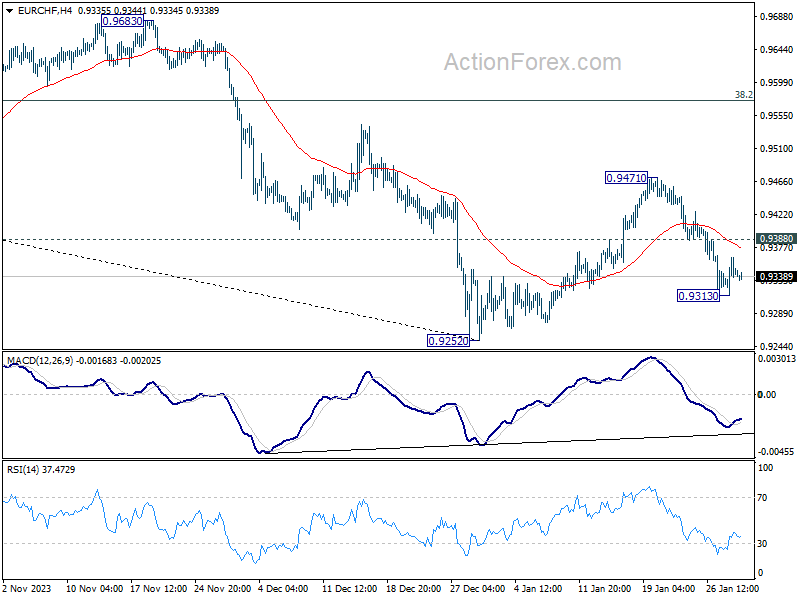
In the bigger picture, medium term outlook remains bearish as long as 0.9683 resistance holds. Current fall from 1.2004 (2018 high) is part of the multi-decade down trend. Another decline is in favor after rebound from 0.9252 completes. However, firm break of 0.9683, and sustained trading above 55 W EMA (now at 0.9638) will argue that EUR/CHF is already in a medium term rally, even as a corrective move.
A Dovish Fed Guidance May Not Reverse the Rout in China and Hong Kong Stock Markets
- China and Hong Kong benchmark stock indices have almost erased last week’s gains.
- NBS Non-Manufacturing PMI sub-components for January are indicating feeble service activities in China.
- A weaker US dollar via a dovish forward monetary policy guidance from the Fed is not enough to act as a bullish catalyst for China and Hong stock markets.
- Technical analysis advocates further potential weakness in the Hang Seng Index in the short to medium term.
Last week’s countertrend rallies triggered by the liquidity infusion from China’s central bank, PBoC’s 50 basis points (bps) cut announcement on the RRR (reserve requirement ratio) for major commercial banks have almost been wiped out at this time of the writing.
Week-to-date as of 31 January, China CSI 300 has declined by -2.8 % with similar losses in Hong Kong’s Hang Seng Indices; Hang Seng Index (-2.6%), Hang Seng TECH Index (-4.7%), and Hang Seng China Enterprises Index (-2.6%).
The resurgence of the bearish tone has been the continuation of lacklustre data from China’s key leading economic indicators. Manufacturing activities have continued to hover in a contractionary mode where the NBS Manufacturing PMI remained below the 50 level for four consecutive months with the latest January’s print just inched up slightly to 49.2 from the December 2023 six-month low of 49.0.
Lack of clear upside momentum in China’s services sector
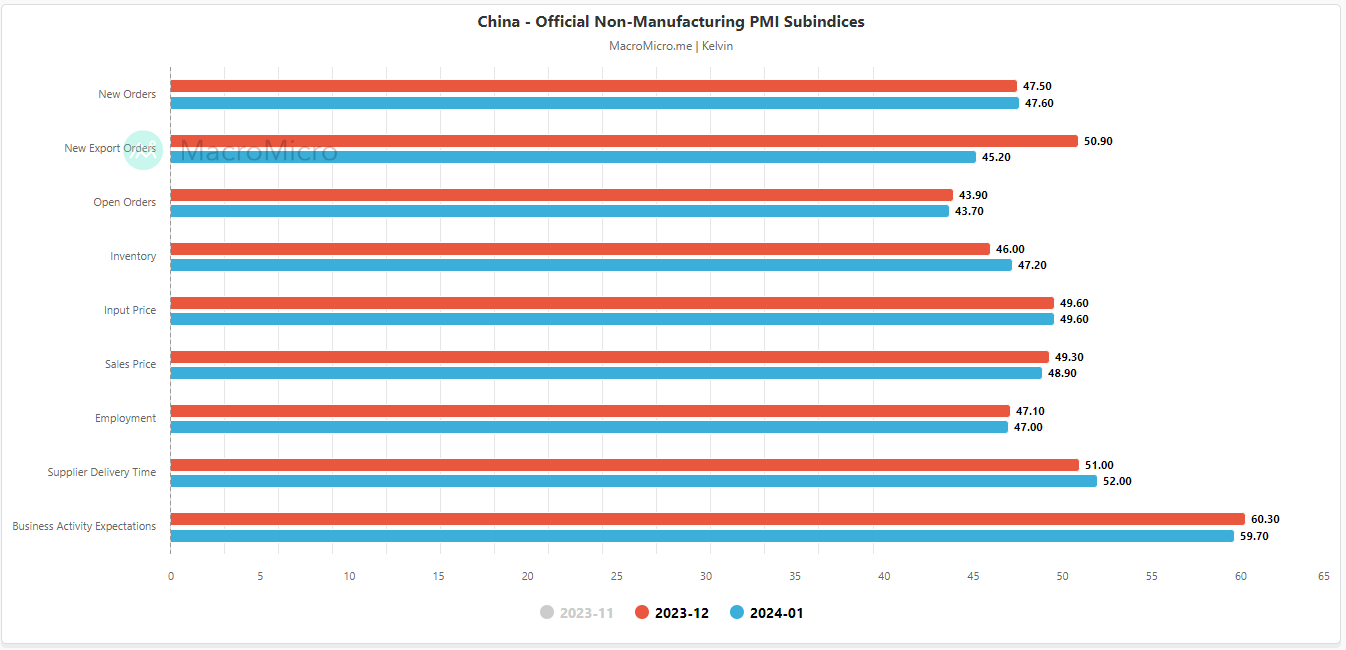
Fig 1: China NBS Non-Manufacturing PMI sub-components as of Jan 2024 (Source: MacroMicro, click to enlarge chart)
Even though the service sector has continued to expand modestly; the NBS Non-Manufacturing PMI for January came in at 50.7 from 50.4 recorded in December 2023 as well as slightly above the consensus of 50.6 but several sub-components have started to contract (see Fig 1).
New export orders have declined in January (45.20 vs 50.90 December), sales prices decreased further (48.9 vs 49.3 December), and business activity expectations (sentiment) eased to a three-month low (59.7 vs 60.3 December).
Overall, it’s a feeble services sector in China where the heightened risk of a deflationary spiral seems to be hard to reverse at least in the mindsets of stock market participants.
A weaker US dollar is likely not enough to act as a bullish catalyst
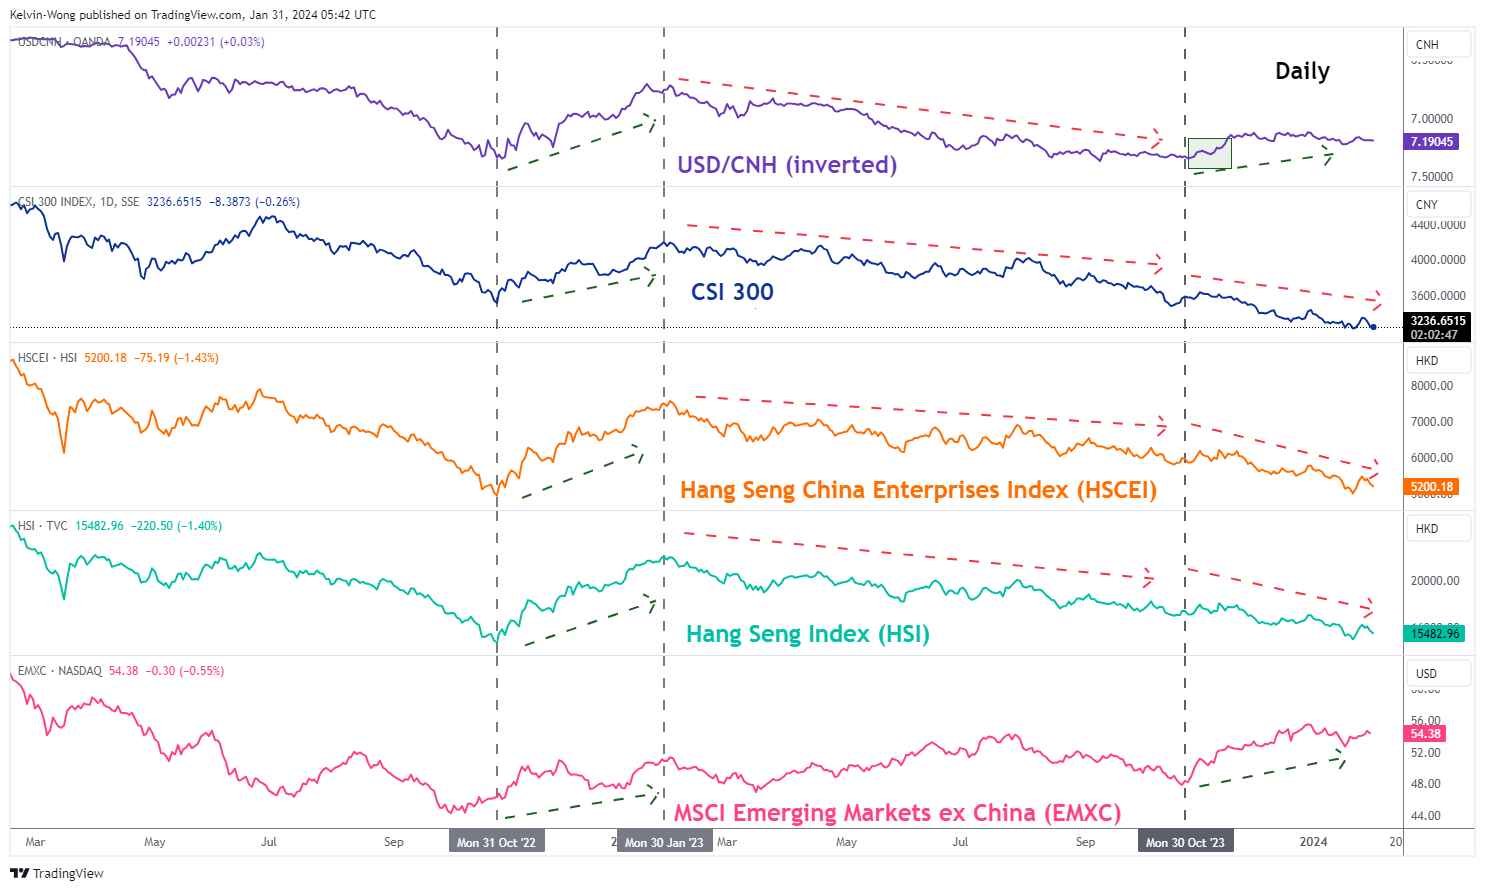
Fig 2: USD/CNH medium-term trend with CSI 300, HSI, HSCEI & EMXC as of 31 Jan 2024 (Source: TradingView, click to enlarge chart)
Given that the deflationary risk spiral is a structural economic weakness phenomenal, any potential upside cyclical factors such as lower interest rates, and a weaker US dollar may not be enough to trigger a medium-term bullish catalyst for China and the Hong Kong stock market.
Based on the recent broad-based US dollar weakness seen since late October 2023 where the US Fed’s dovish pivot intensified, the offshore yuan (CNH) has reversed from its prior nine-months of bearish trend against the US dollar and rallied by +3.1% but it has not translated to a positive reflexive feedback loop into the CSI 300, Hang Seng Index, and Hang Seng China Enterprises Index in contrast to its previous positive price actions seen during October 2022 to January 2023.
A further conclusion can be observed that other emerging markets stock markets have benefited from a weaker US dollar environment so far as the MSCI Emerging Markets excluding China exchange-traded fund (EMXC) has gained by close to 13% since the end of October 2023.
Therefore, if US Fed Chair Powell issues a dovish forward monetary policy guidance in today’s FOMC, it is likely that the US dollar may kickstart another impulsive down move sequence as US Treasury yields are likely to come under downside pressure.
However, China and Hong Kong stock markets may not be able to reap the fruits of such potential renewed US dollar weakness until the deflationary risk spiral is eradicated.
Watch the 15,900 key short-term resistance on the Hang Seng Index
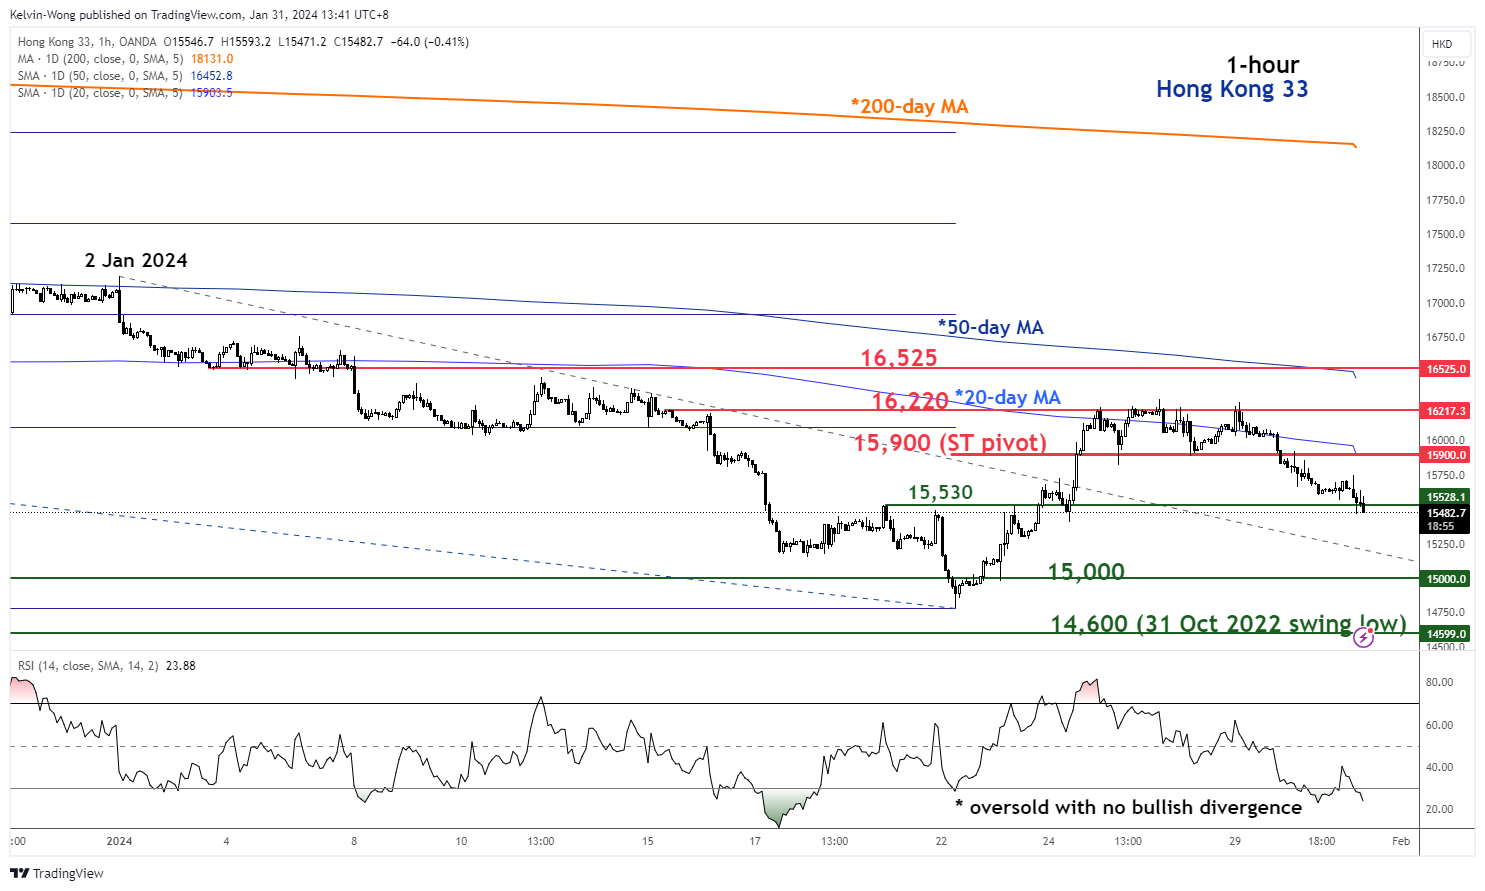
Fig 3: Hong Kong 33 short-term trend as of 31 Jan 2024 (Source: TradingView, click to enlarge chart)
In the lens of technical analysis, the short and medium-term downtrend phases of the Hong Kong 33 Index (a proxy of the Hang Seng Index futures) are still intact despite last week’s rebound as price actions have continued to oscillate below its 20-day and 50-day moving averages.
Recent price actions have failed to make any clear breakout above its 20-day moving average after a test on it in the past week coupled with no bullish divergence condition being flashed out in the hourly RSI momentum indicator when it hit its oversold zone yesterday, 30 January.
These observations have suggested that short-term downside momentum has resurfaced which may lead to lower price actions of the Index that exposes the next immediate supports at 15,000 and 14,600 (also the key 31 October 2022 swing low area).
On the other hand, a clearance above 15,900 key short-term pivotal resistance negates the bearish tone for another round of countertrend rebound sequence with the next intermediate resistances coming in at 16,220 and 16,525.