
Sample Category Title
CPI Miss Drives Aussie Down, Dollar Sees Modest Rise Pre-FOMC
Australian Dollar encountered significant headwinds in today's Asian session, weighed down by the latest Australian Q4 CPI data. The lower than expected inflation confirmed that RBA would hold interest rate unchanged in the forthcoming meeting next week. The central bank could also be finally ready to indicate completion of the tightening cycle. Market speculation is intensifying around rate reductions in the second half of the year.
Compounding Australian Dollar's weakness, ongoing slump in stock markets across Hong Kong and China weighed heavily on the currency. Despite slight improvement in China's NBS PMIs, investor confidence remains subdued. The market continues to await more robust and concrete measures from the Chinese government to bolster market confidence, particularly in the wake of prolonged underperformance.
In contrast, Dollar is gaining slight ground against its major counterparts, as market's attention is riveted on the upcoming FOMC rate decision. The consensus is firmly set on Fed holding rates steady at 5.25-5.50%. In this context, the probability of any significant surprises appears minimal.
General sentiment suggests that March may be too premature for Fed to initiate a rate cut too. The most probable outcome is that Chair Jerome Powell will reiterate the commitment to data-driven decision-making, and counter any premature market speculations about imminent rate cuts. Because of that, any unexpected indications from Powell regarding a rate cut in March could trigger significant market volatility.
As of now, the probability reflected in Fed fund futures for a rate cut in March stands at around 45%, with a more pronounced likelihood of 87% for a cut in May. However, it's crucial to note that these probabilities are highly contingent on the upcoming ISM Manufacturing and Non-Farm Payroll data, which are anticipated later this week.
As for the week, New Zealand Dollar is currently the strongest one, as supported by hawkish comments by RBNZ Chief Economist yesterday. Yen is the second strongest, with today's BoJ summary of opinions affirming that a rate hike is on the radar, though not imminent. On the other hand, Euro is staying as the worst, as the lift from yesterday's GDP was weak and brief. Markets are looking to tomorrow's Eurozone CPI for the excuses to add to speculation of an April ECB cut. Sterling is the second weakest, followed by Aussie. Dollar, Swiss Franc, and Canadian are mixed.
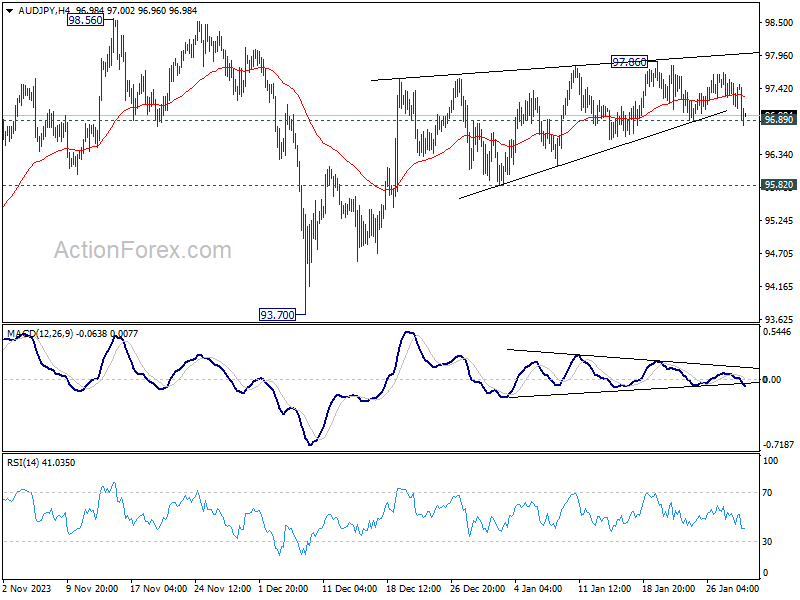
Technically, as a follow up to yesterday's post, AUD/JPY's dip and breach of 96.89 is affirming the bearish case discussed. That is, rebound from 93.70, as the second leg of the pattern from 98.56, is possibly completed at 97.86 already, on bearish divergence condition in 4H MACD. Deeper fall is in favor as long as 55 4H EMA (now at 97.30) holds, to 95.82 support. Decisive break there will confirm this case and target 93.70 support again.
In Asia, Nikkei closed up 0.61%. Hong Kong HSI is down -1.53%. China Shanghai SSE is down -1.11%. Singapore Strait Times is up 0.18%. Japan 10-year JGB yield rose 0.0220 to 0.734. Overnight, DOW rose 0.35%. S&P 500 fell -0.06%. NASDAQ fell -0.76%. 10-year yield fell -0.032 to 4.059.
BoJ summary of opinions suggests rate hike within reach
The Summary of Opinions from BoJ's meeting on January 22-23 signaled the central bank's intensified focus on initiating its first rate hike since 2007 and moving away from its long-standing negative interest rate policy. The deliberations, however, stopped short of providing a clear timeline for these policy shifts.
A notable hawkish sentiment within BoJ pointed to the "growing possibility" of significant wage revisions in the upcoming spring, at "relatively higher levels" than in the past. This perspective is underpinned by the recognition of "improving trend" in both economic activities and price. Such developments suggest that the necessary conditions for revising monetary policy, including ending the negative interest rate regime, are increasingly "being met".
Concurrently, the impact of Noto Peninsula Earthquake on is a key factor under close observation. One opinion suggested that, after a thorough assessment of the earthquake's effects over "the next one or two months", BoJ is "highly likely to reach a point where it can normalize monetary policy".
On the other side of the spectrum, a more cautious stance was also expressed. While acknowledging that the probability of achieving the BoJ's 2 percent price stability target is becoming "more realistic", it was noted that certainty in reaching this goal is not yet fully established. However, this view also supports the initiation of discussions regarding the exit from the current monetary policy stance.
Japan's industrial production rises 1.8% mom in Dec, a bounce in seesawing pattern
Japan's industrial production rose 1.8% mom in December, rebounding from prior month's -0.9% mom contraction, but missed expectation of 2.4% mom.
Manufacturers have tempered expectations for the coming months, predicting a -6.2% mom drop in production in January, followed by a modest 2.2% mom increase in February. The Ministry of Economy, Trade and Industry maintains its assessment of "seesawing" on production.
As an METI official indicated, the recent Noto Peninsula earthquake's impact on manufacturing appears minimal for January. However, production forecasts are clouded by the suspension of operations at Daihatsu due to issues with collision-safety test irregularities.
"Although we believe that the production sentiment of companies is gradually getting out of the bearish phase, for the time being, we need to pay attention to the impact of the suspension of auto manufacturers' operation," the official said.
In separate release, retail sales grew 2.1% yoy in December, well below expectation of 5.0% yoy.
Australia's CPI down to 4.1% yoy in Q4, monthly CPI down to 3.4% yoy in Dec
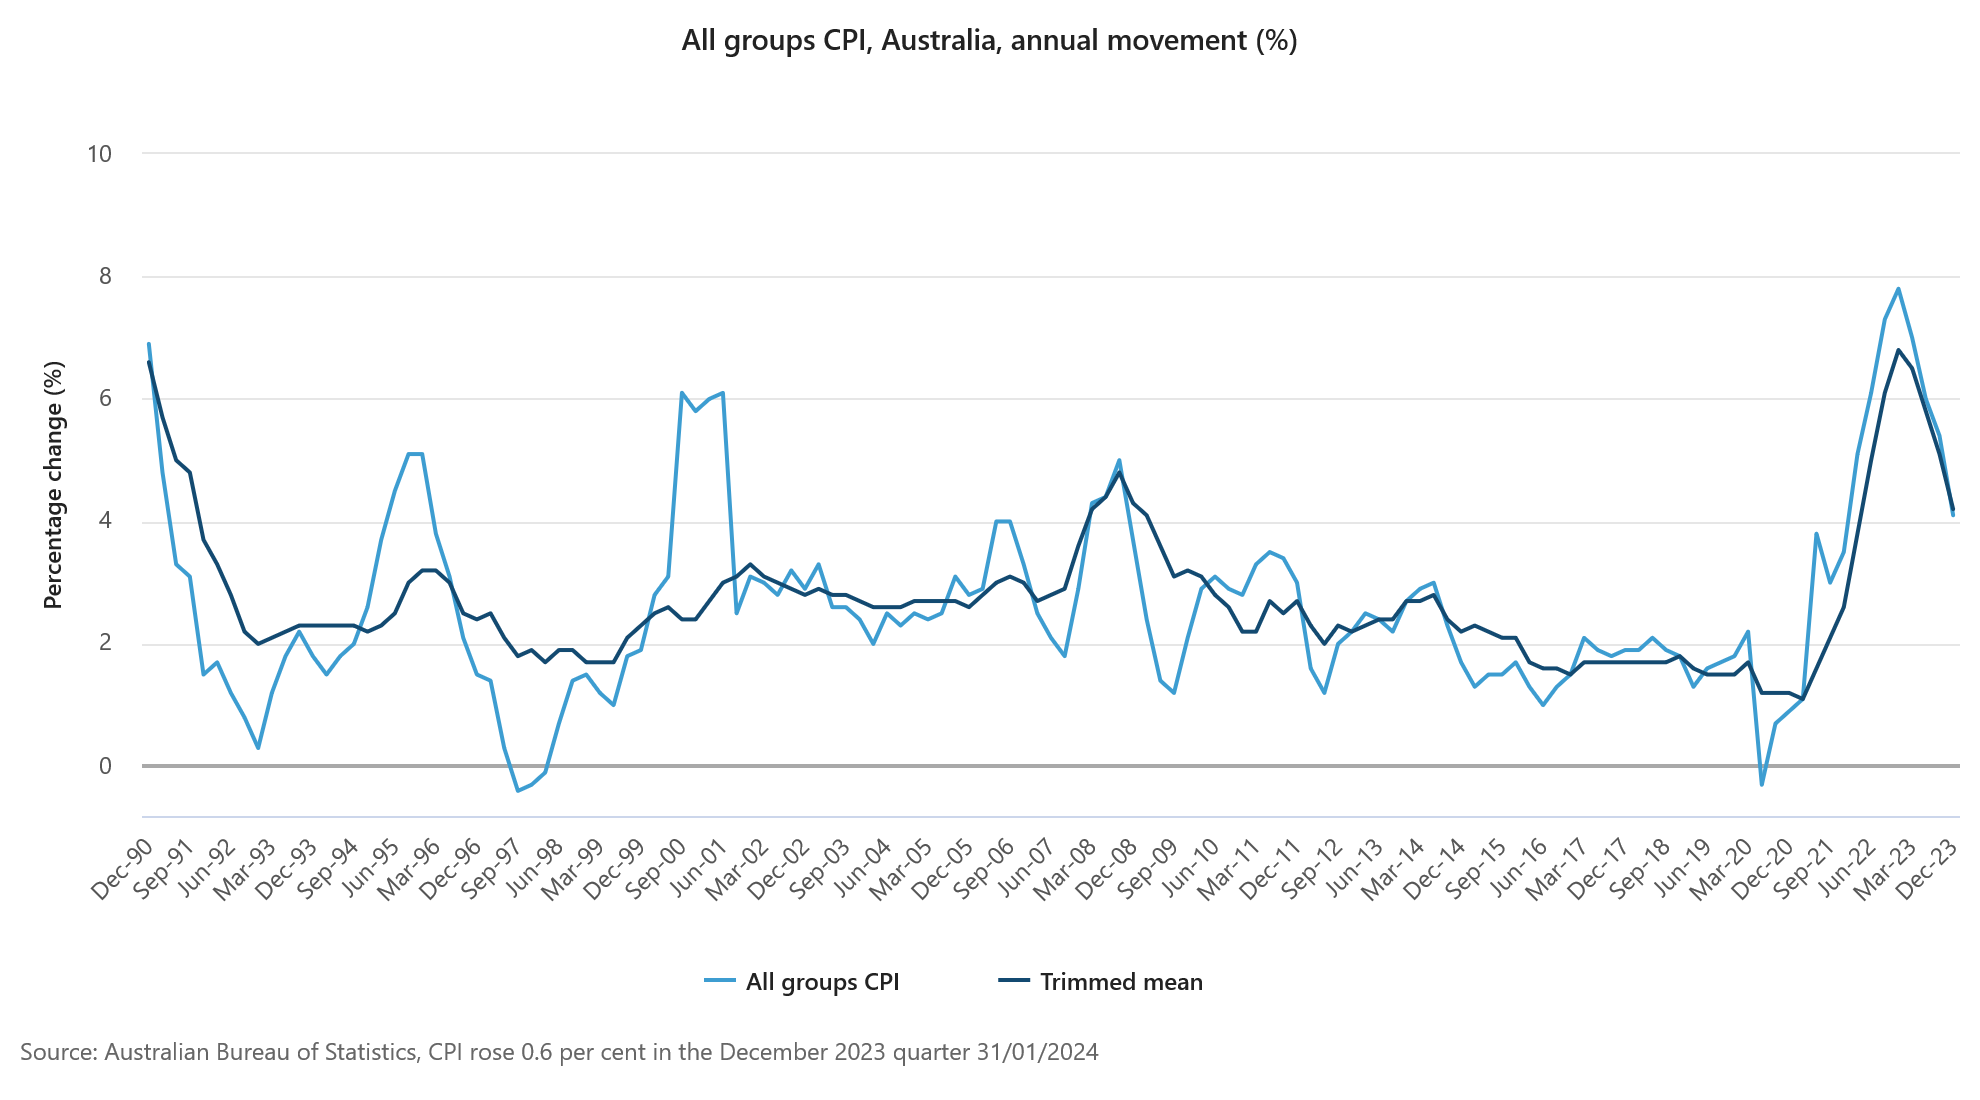
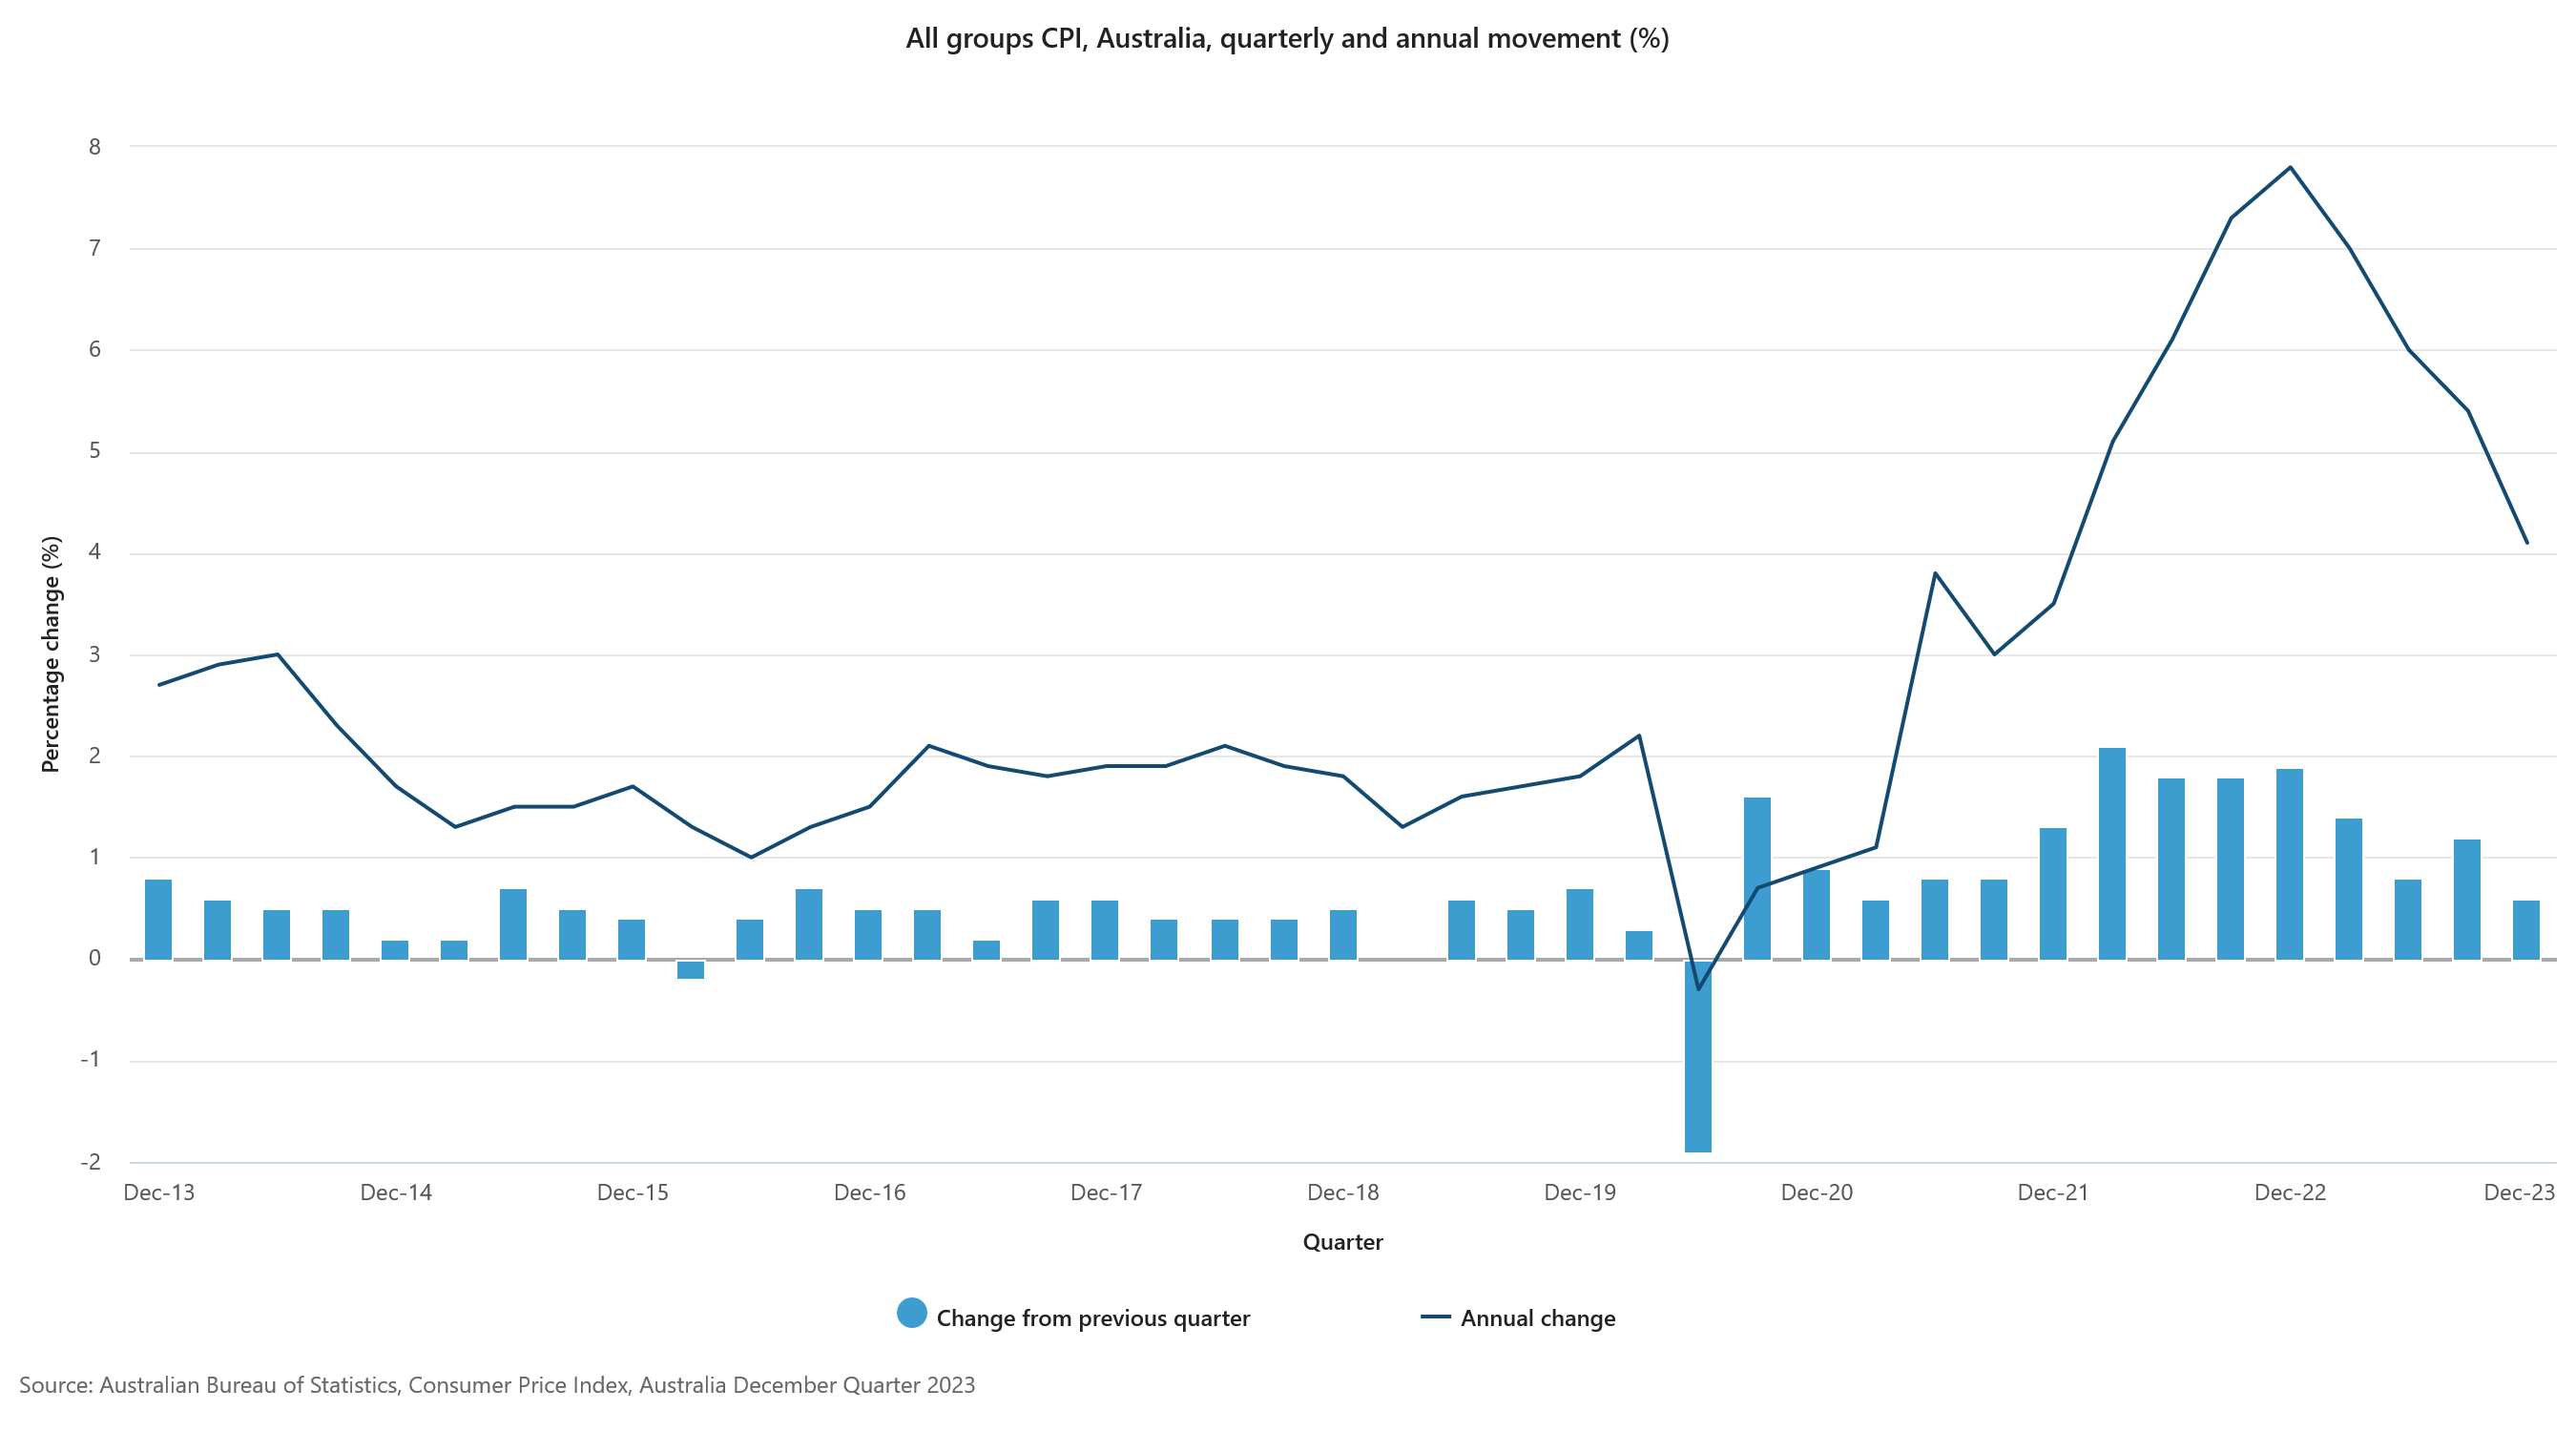
Australia's inflation data for Q4 show notable easing in price pressures. CPI rose by 0.6% qoq, a considerable slowdown from the previous quarter's 1.2% qoq and below expectation 0.8% qoq. This marks the smallest quarterly increase since Q1 2021. On an annual basis, CPI decelerated from 5.4% yoy to 4.1% yoy, coming in lower than the forecasted 4.3% yoy.
RBA's trimmed mean CPI, which is a measure of core inflation, also reflected this trend. It increased by 0.8% qoq and 4.2% yoy, down from 1.2% qoq and 5.2% yoy respectively in the previous quarter. These figures were below the expected 0.9% qoq and 4.3% yoy. Notably, this represents the fourth consecutive quarter of declining annual trimmed mean inflation, falling from a peak of 6.8% in Q4 2022.
Additionally, monthly CPI showed a sharp slowdown from 4.3% yoy to 3.4% yoy, undershooting expectation of 3.7% yoy.
NZ ANZ business confidence rises to 36.6, inflation expectations lowest since Nov 2021
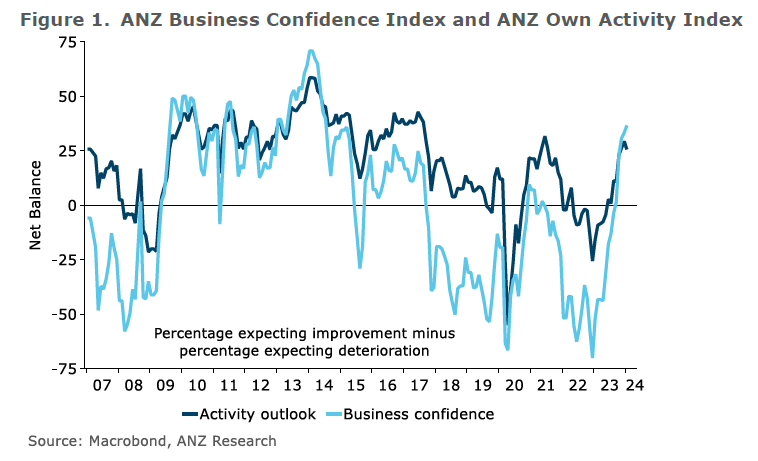
New Zealand ANZ Business Confidence rose from 33.2 to 36.6 in January. However, Own Activity Outlook fell from 29.3 to 25.6.
In a significant development, inflation expectations decreased from 4.61% to 4.28%, reaching their lowest point since November 2021. Despite this decline in inflation expectations, a high number of firms still plan to increase their prices, with the pricing intentions index only marginally decreasing from 50.2 to 49.7. Cost expectations also saw a slight reduction, moving from 76.2 to 75.6, but they remain at elevated levels.
ANZ's commentary on the situation pointed out that the New Zealand economy is at a critical point, expressing a cautiously optimistic outlook. They anticipate that RBNZ has implemented sufficient tightening measures and expect a gradual realization of their impact, leading to a possible initiation of "a steady stream of OCR cuts" by August.
China's NBS PMI manufacturing ticks up to 49.3, contraction continues
China's manufacturing sector remained in contraction for the fourth consecutive month, with NBS PMI Manufacturing index marginally rising from 49.0 to 49.3 in January, slightly below the expected 49.3.
The continued manufacturing contraction is evident in the subindexes: new orders was 49.0, marking the fourth month of contraction, while new export orders index stood at 47.2, contracting for the tenth consecutive month. A concerning detail is the employment subindex, which fell to a 13-month low of 47.6, indicating contraction for 11 straight months.
On a positive note, the manufacturing sector's production index attained a 4-month high, advancing to 51.3, and has sustained expansion for eight consecutive months.
In contrast, PMI Non-Manufacturing saw a slight improvement, rising from 50.4 to 50.7, marginally above the forecast of 50.6. Consequently, PMI Composite, which encompasses both manufacturing and services sectors, reached a four-month peak of 50.9, up from 50.3 in the previous month.
ECB's Lagarde emphasizes wage growth as key determinant for rate cut decision
ECB President Christine Lagarde emphasized that the central bank is not yet ready to initiate rate cuts, underscoring the need for comprehensive data analysis
In a CNN interview, she stated, "We are not there yet," added that the decision to loosen monetary policy hinges on "all sorts of data". She also singled out the significance of wage data as "critically important."
Despite acknowledging a clear disinflationary trend, Lagarde noted that ECB requires a deeper understanding and progression into this trend to make a well-informed decision. "We are on a disinflationary trend — no question about it," she confirmed, "But we need to be further into that process."
Lagarde's remarks also touched upon the consensus within the ECB regarding the direction of the next policy move. "I think we all agree that the next move" will be a cut, she said, aligning with the general anticipation of eventual rate reductions. However, the timing remains uncertain and subject to thorough examination of upcoming economic data.
A key factor in the timeline for interest rate cuts is the availability of wage growth data, which is not expected until after ECB's April meeting. This positions the June meeting as a more likely juncture for the consideration of rate cuts.
Looking ahead
Germany will release import price index, retail sales, unemployment rate and CPI flash in European session. Swiss will release retail sales and Crudeit Suisse economic expectations. Later in the day, Canada GDP will be a focus in US session. US will release ADP employment, employment cost index and Chicago PMI. But the main event will be FOMC rate decision and press conference.
AUD/USD Daily Report
Daily Pivots: (S1) 0.6577; (P) 0.6601; (R1) 0.6626; More...
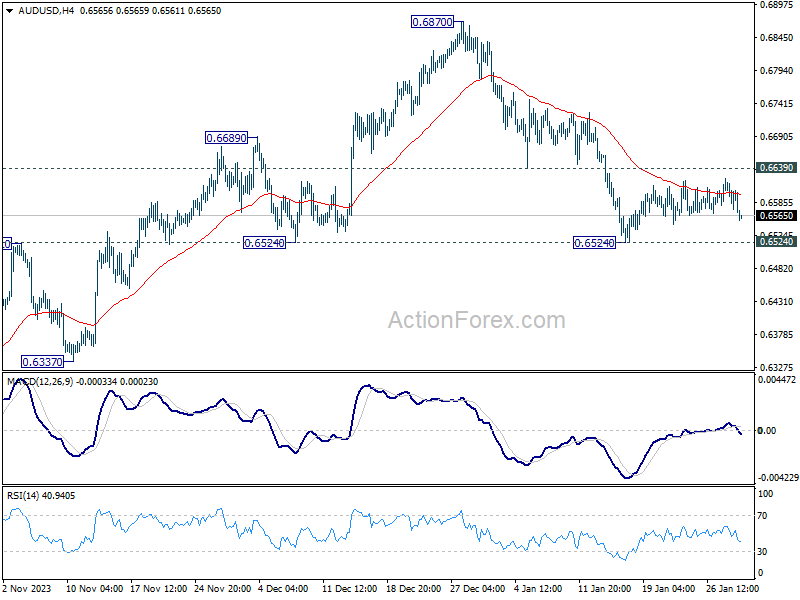
AUD/USD dips notably today but still stays in range of 0.6524/6639. Intraday bias remains neutral and further fall is still expected. On the downside, firm break of 0.6524 support will argue that whole rebound from 0.6269 has completed, and bring deeper fall to this support. On the upside, however, firm break of 0.6639 will turn bias back to the upside for stronger rebound instead.
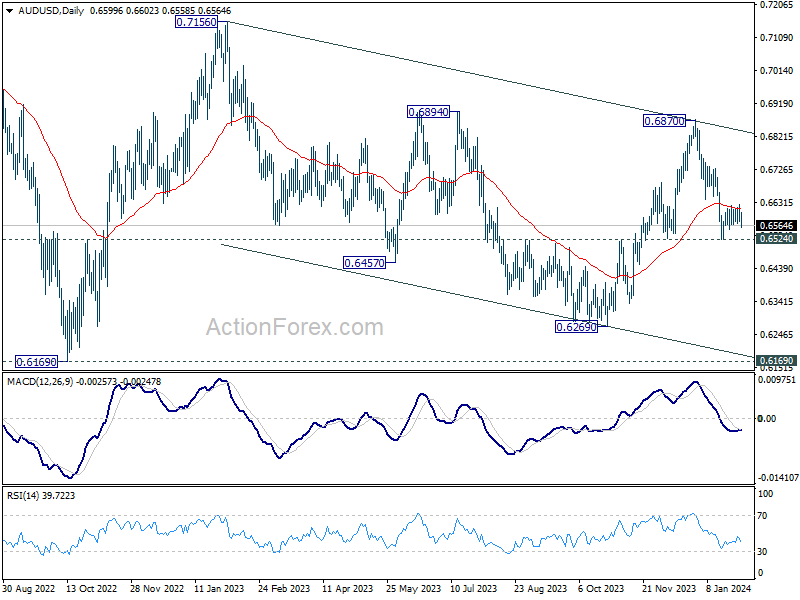
In the bigger picture, price actions from 0.6169 (2022 low) are seen as a medium term corrective pattern to the down trend from 0.8006 (2021 high). Sideway trading could continue in range of 0.6169/7156 for some more time. But as long as 0.7156 holds, an eventual downside breakout would be mildly in favor.
Economic Indicators Update
| GMT | Ccy | Events | Actual | Forecast | Previous | Revised |
|---|---|---|---|---|---|---|
| 23:50 | JPY | BoJ Summary of Opinions | ||||
| 23:50 | JPY | Industrial Production M/M Dec P | 1.80% | 2.40% | -0.90% | |
| 23:50 | JPY | Retail Trade Y/Y Dec | 2.10% | 5.00% | 5.30% | 5.40% |
| 00:00 | NZD | ANZ Business Confidence Jan | 36.6 | 33.2 | ||
| 00:30 | AUD | CPI Q/Q Q4 | 0.60% | 0.80% | 1.20% | |
| 00:30 | AUD | CPI Y/Y Q4 | 4.10% | 4.30% | 5.40% | |
| 00:30 | AUD | RBA Trimmed Mean CPI Q/Q Q4 | 0.80% | 0.90% | 1.20% | |
| 00:30 | AUD | RBA Trimmed Mean CPI Y/Y Q4 | 4.20% | 4.30% | 5.20% | |
| 00:30 | AUD | Monthly CPI Y/Y Dec | 3.40% | 3.70% | 4.30% | |
| 00:30 | AUD | Private Sector Credit M/M Dec | 0.40% | 0.40% | 0.40% | |
| 01:00 | CNY | NBS Manufacturing PMI Jan | 49.2 | 49.3 | 49 | |
| 01:00 | CNY | NBS Non-Manufacturing PMI Jan | 50.7 | 50.6 | 50.4 | |
| 05:00 | JPY | Housing Starts Y/Y Dec | -4.00% | -6.20% | -8.50% | |
| 05:00 | JPY | Consumer Confidence Jan | 38 | 37.6 | 37.2 | |
| 07:00 | EUR | Germany Import Price Index M/M Dec | -0.50% | -0.10% | ||
| 07:00 | EUR | Germany Retail Sales M/M Dec | 0.60% | -2.50% | ||
| 07:30 | CHF | Real Retail Sales Y/Y Dec | 0.90% | 0.70% | ||
| 08:55 | EUR | Germany Unemployment Change Jan | 10K | 5K | ||
| 08:55 | EUR | Germany Unemployment Rate Jan | 5.90% | 5.90% | ||
| 09:00 | CHF | Credit Suisse Economic Expectations Jan | -23.7 | |||
| 09:00 | EUR | Italy Unemployment Dec | 7.50% | 7.50% | ||
| 13:00 | EUR | Germany CPI M/M Jan P | 0.20% | 0.10% | ||
| 13:00 | EUR | Germany CPI Y/Y Jan P | 3.40% | 3.70% | ||
| 13:15 | USD | ADP Employment Change Jan | 143K | 164K | ||
| 13:30 | CAD | GDP M/M Nov | 0.10% | 0.00% | ||
| 13:30 | USD | Employment Cost Index Q4 | 1.00% | 1.10% | ||
| 14:45 | USD | Chicago PMI Jan | 48.2 | 46.9 | ||
| 15:30 | USD | Crude Oil Inventories | -0.8M | -9.2M | ||
| 19:00 | USD | Fed Interest Rate Decision | 5.50% | 5.50% | ||
| 19:30 | USD | FOMC Press Conference |
The Final Piece Fits a Puzzle on Hold
The data flow since November has pointed in this direction, and today’s CPI release seals the deal: the RBA will keep the cash rate on hold next week, and it is unlikely to raise rates further this cycle
The data flow since November has pointed in this direction, and today’s CPI release seals the deal: the RBA will keep the cash rate on hold next week, and it is unlikely to raise rates further this cycle.
At its previous forecast round in early November, the RBA was expecting both headline and trimmed mean inflation to be 4.5% over calendar 2023. The implied forecast for the quarter was around 1% in both cases. The actual result was 0.6% in the quarter and 4.1% over the year for headline CPI inflation and 0.8% and 4.2% for the bellwether trimmed mean measure.
The detail was slightly below our expectations, and noticeably below the RBA’s. Domestic inflation is now clearly coming down. Market services inflation has dropped significantly. The monthly CPI indicator for December was distorted by base effects involving holiday travel, but measures excluding this are now running in the low 4% range and clearly heading down.
These inflation outcomes need to be seen in the context of the soft flow of data since November. In particular, the September quarter national accounts were noticeably weaker than the RBA expected. This cast doubt on the Board’s assessment that domestic demand remained resilient. Subsequent data on retail spending and the labour market has only reinforced those doubts. The squeeze on household incomes from high inflation and a rising tax take, as well as higher interest rates, has continued. Consumer spending and sentiment are both soft; investment spending did not hold up as the RBA expected in the September quarter national accounts. As Westpac Economics colleague Senior Economist Andrew Hanlan noted earlier today, business investment is likely to stall this year.
Some of the upside risks the Board minutes had been calling out in recent months have not come to pass. The increase in housing prices, mentioned in the December 2023 minutes, is now losing steam, especially in Sydney and Melbourne. The concerns raised the same month that falling inflation would boost households’ purchasing power – and so spending – have been ruled out by the subsequent release of the September quarter national accounts. That national accounts release also showed that the RBA’s concerns about falling productivity had been somewhat overblown. As we had predicted ahead of the release, productivity ticked up in the September quarter and the history was revised up.
Despite this, the RBA and its Board have been sensitive to the risks that inflation would not come down as quickly as they want. In their November forecast round, they had pushed out their expectations for the date that inflation would return to target to end-2025, and they were clearly uncomfortable about this. They had also concluded that inflation was increasingly driven by domestic factors: a conclusion that, we believe, did not adequately allow for the effects of displaced demand on some prices – the “other fruit” problem. In the minutes following that meeting, the Board noted “lowering inflation from its current level would require growth in aggregate demand to remain subdued”. In our view, aggregate demand is already subdued and does not need further policy tightening to keep it there.
Another concern of the RBA Board was the possibility that inflation expectations could lift. While the usual measures of the expectations of consumers and market participants are a little higher than pre-pandemic, they are still well within the target range. In any case, the pre-pandemic period was characterized by inflation being below the target. Some increase from those levels is therefore entirely consistent with the RBA achieving its goals.
Given these concerns, the RBA Board therefore is unlikely to rule out further rate increases entirely in their post-meeting communication. But the case to raise rate from here is steadily losing traction. We expect that over coming months, further declines in inflation and soft outcomes in the real economy will give the Board enough confidence that inflation will return to target on the desired timetable. They will therefore have scope to reduce some of the current restrictiveness of policy. We continue to expect the first rate cut no earlier than September.
In articulating their decision, the Board will have the advantage that the Bank’s forecast horizon will roll forward to mid-2026 this round. It is therefore entirely possible that the staff forecasts can now be shown with inflation ending the period at 2½%, the midpoint of the 2–3% target range. Specifying when inflation would reach that midpoint was one of the recommendations of the RBA Review.
Also changing following the RBA Review recommendations are some of the arrangements around the Board meeting itself and the release of the Statement on Monetary Policy (SMP). The meeting will now take place over two days. This will give the Board more time to discuss the outlook and risks, and the staff more time to present scenarios and other analysis that could not easily be fit into the agenda in the previous shorter-format meeting. It will allow also allow the Board to review both the media release and Overview of the SMP ahead of the policy announcement. The SMP can therefore now be released on the same day as the policy announcement. Along with the Governor’s media conference the same afternoon, this will provide the RBA with more scope to explain its decision.
Technical Outlook and Review
DXY:
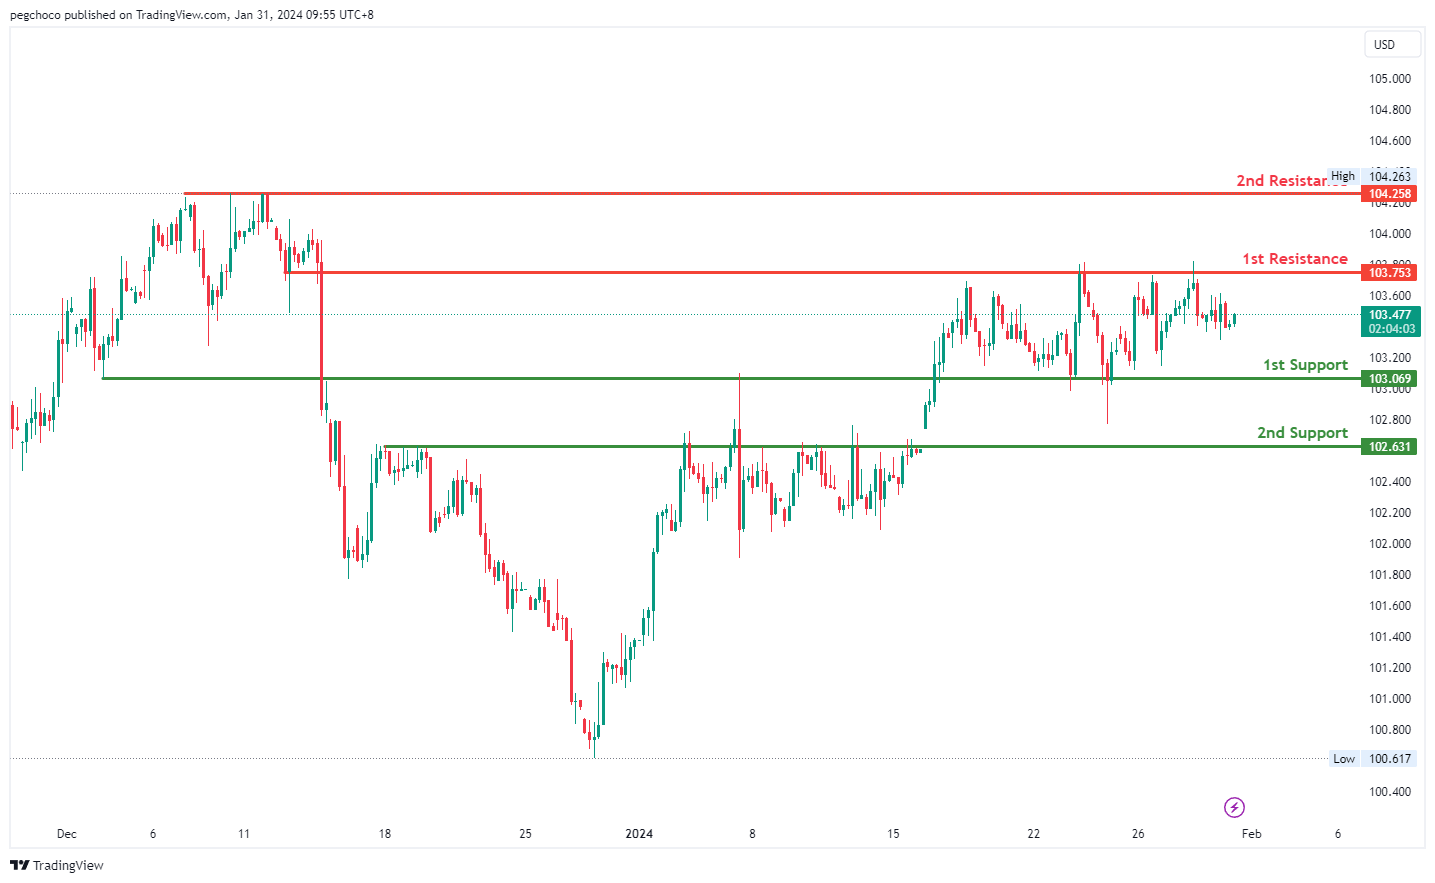
The analysis of the DXY (US Dollar Index) chart suggests a neutral overall momentum, indicating a lack of a clear trend direction at the moment. Given this neutral stance, there is a potential scenario where the price could fluctuate within a range defined by the 1st support and 1st resistance levels.
The 1st support level at 103.06 is categorized as an overlap support. Such levels often have historical significance and can attract buying interest when the price approaches them. It represents a potential support zone in the event of a price decline.
Additionally, the 2nd support level at 102.63 is identified as a pullback support. This level may also act as a support zone and is associated with the 38.20% Fibonacci Retracement, further emphasizing its potential significance.
On the resistance side, the 1st resistance level at 103.75 is described as an overlap resistance. This level represents a historical point where the price has encountered resistance in the past. Traders should watch this level closely as it may serve as a barrier to further upward movement.
The 2nd resistance level at 104.25 is marked as a multi-swing high resistance. This indicates that it is another historical level where the price has faced resistance. It can be considered a significant area of potential resistance in the event of an upward price movement.
EUR/USD:
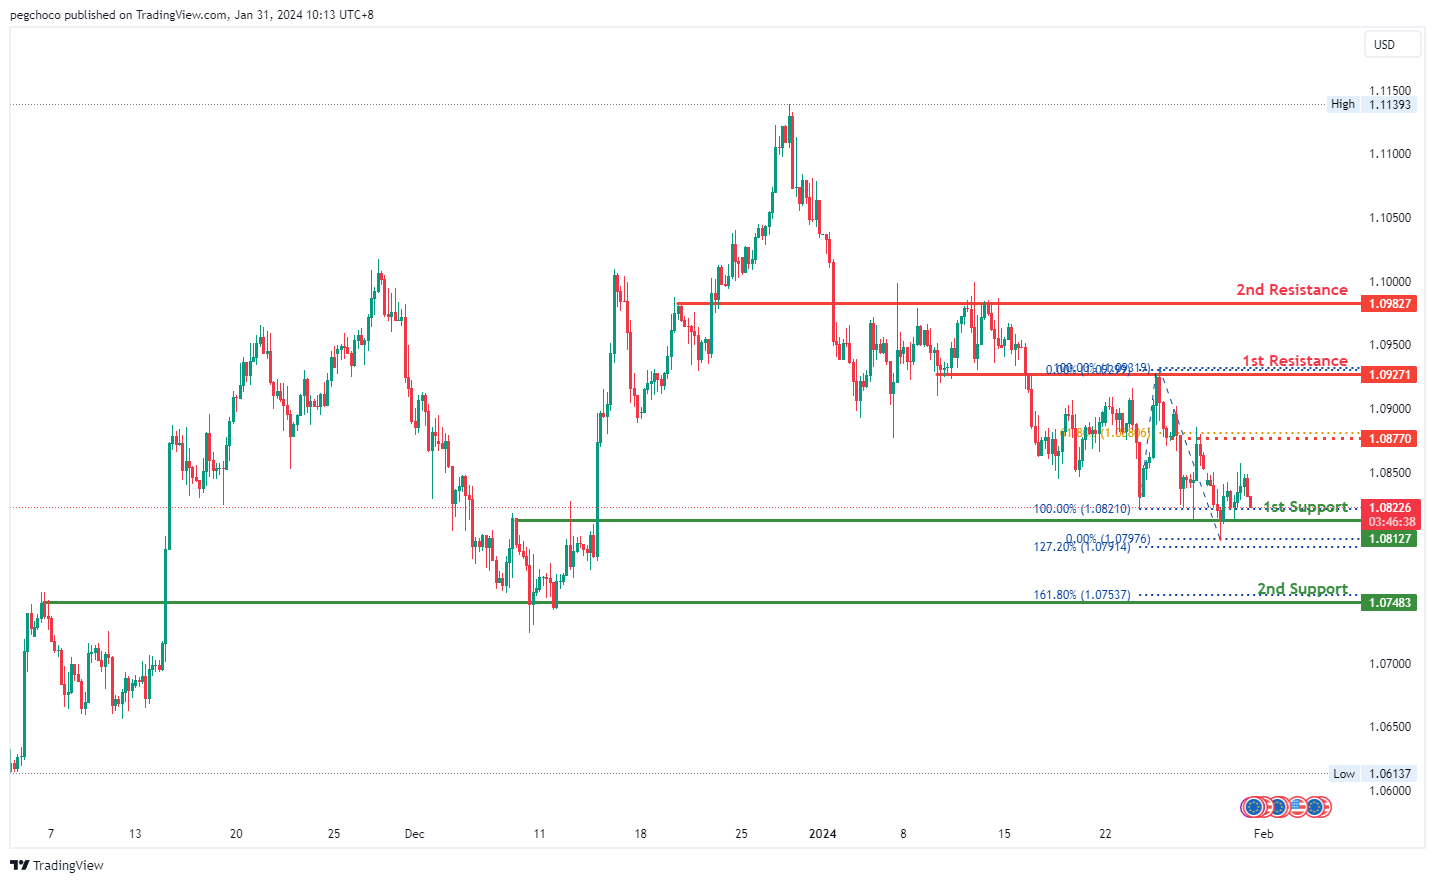
The EUR/USD chart currently exhibits a bearish overall momentum, indicating a downward trend. According to your analysis, the price could potentially continue its bearish movement towards the 1st support level.
The 1st support level at 1.0812 is identified as an overlap support. Such levels often have historical significance and may act as strong support zones where buying interest could emerge. It represents a potential area where the price might find support in case of a further decline.
Additionally, the 2nd support level at 1.0748 is categorized as an overlap support. This level is reinforced by the presence of the 161.80% Fibonacci Extension, further emphasizing its importance as a potential support zone.
On the resistance side, the 1st resistance level at 1.0927 is described as an overlap resistance. This level represents a historical point where the price has encountered resistance in the past. Traders should monitor this level closely as it may act as a barrier to further upward movement.
The 2nd resistance level at 1.0982 is also categorized as an overlap resistance. Similar to the 1st resistance, it indicates a historical level of resistance and can be considered significant in the event of an upward price movement.
EUR/JPY:
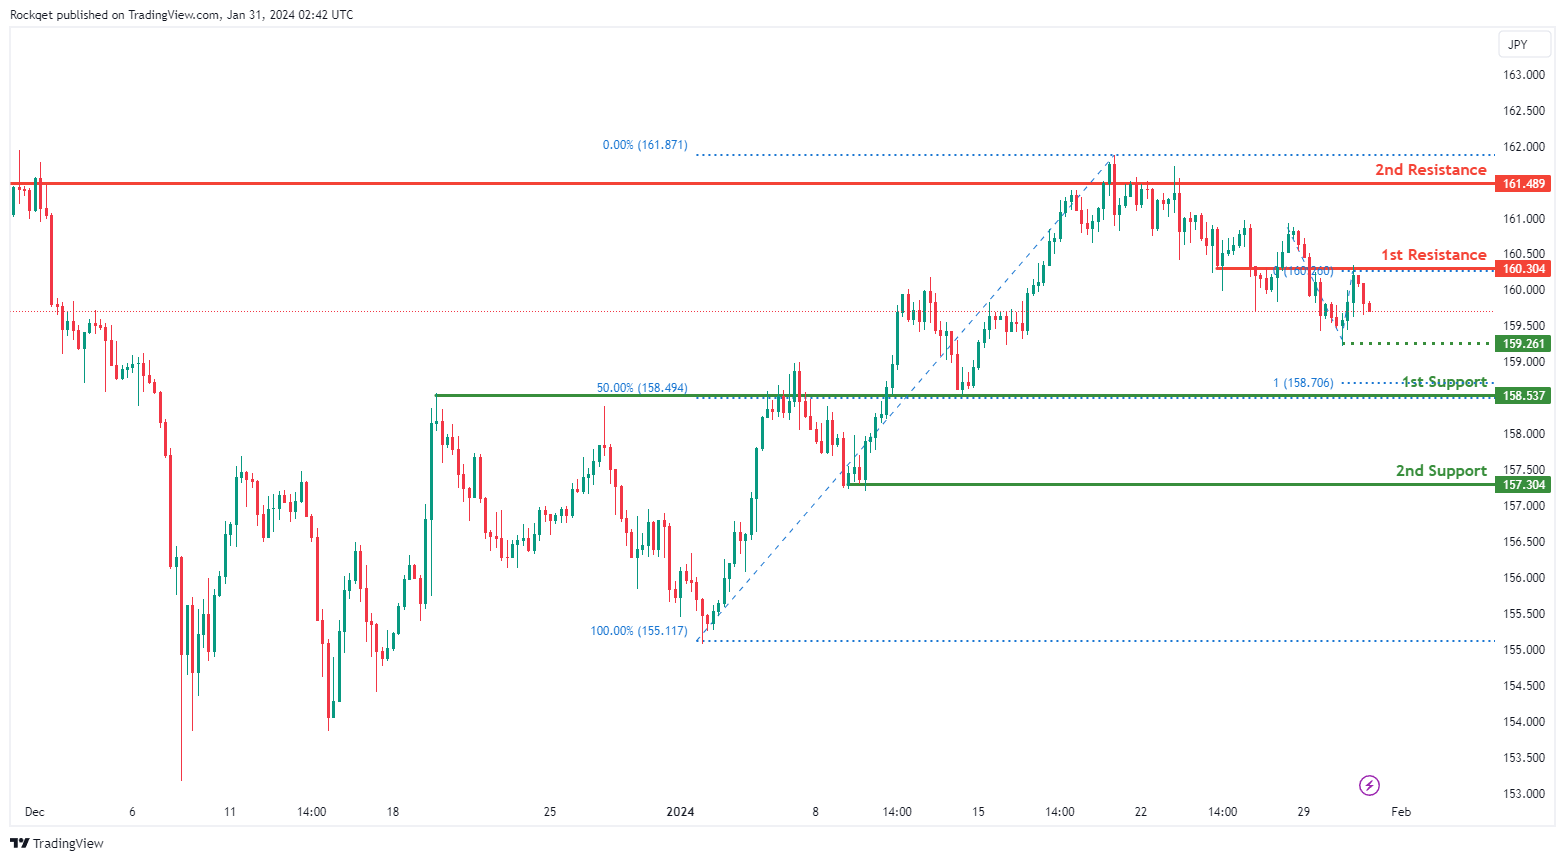
The EUR/JPY chart currently displays a bearish overall momentum, indicating a prevailing downward trend. There is a potential scenario where the price could experience a bearish reaction off the 1st resistance and subsequently drop towards the 1st support.
The 1st support at 158.537 is considered favorable for several reasons. Firstly, it is identified as an overlap support, suggesting a historical level where buying interest has previously emerged. Additionally, this support level aligns with the 50% Fibonacci Retracement and the 100% Fibonacci Projection, adding confluence to its significance.
The 2nd support at 157.304 is recognized as a swing low support, providing additional strength to the potential support zone.
Intermediate support at 159.26 is highlighted as a swing low support, further reinforcing the potential support zone.
On the resistance side, the 1st resistance at 160.304 is noteworthy for being an overlap resistance, indicating a historical level where selling interest may emerge.
Similarly, the 2nd resistance at 161.489 is identified as a multi-swing high resistance, adding significance to this potential resistance level.
EUR/GBP:
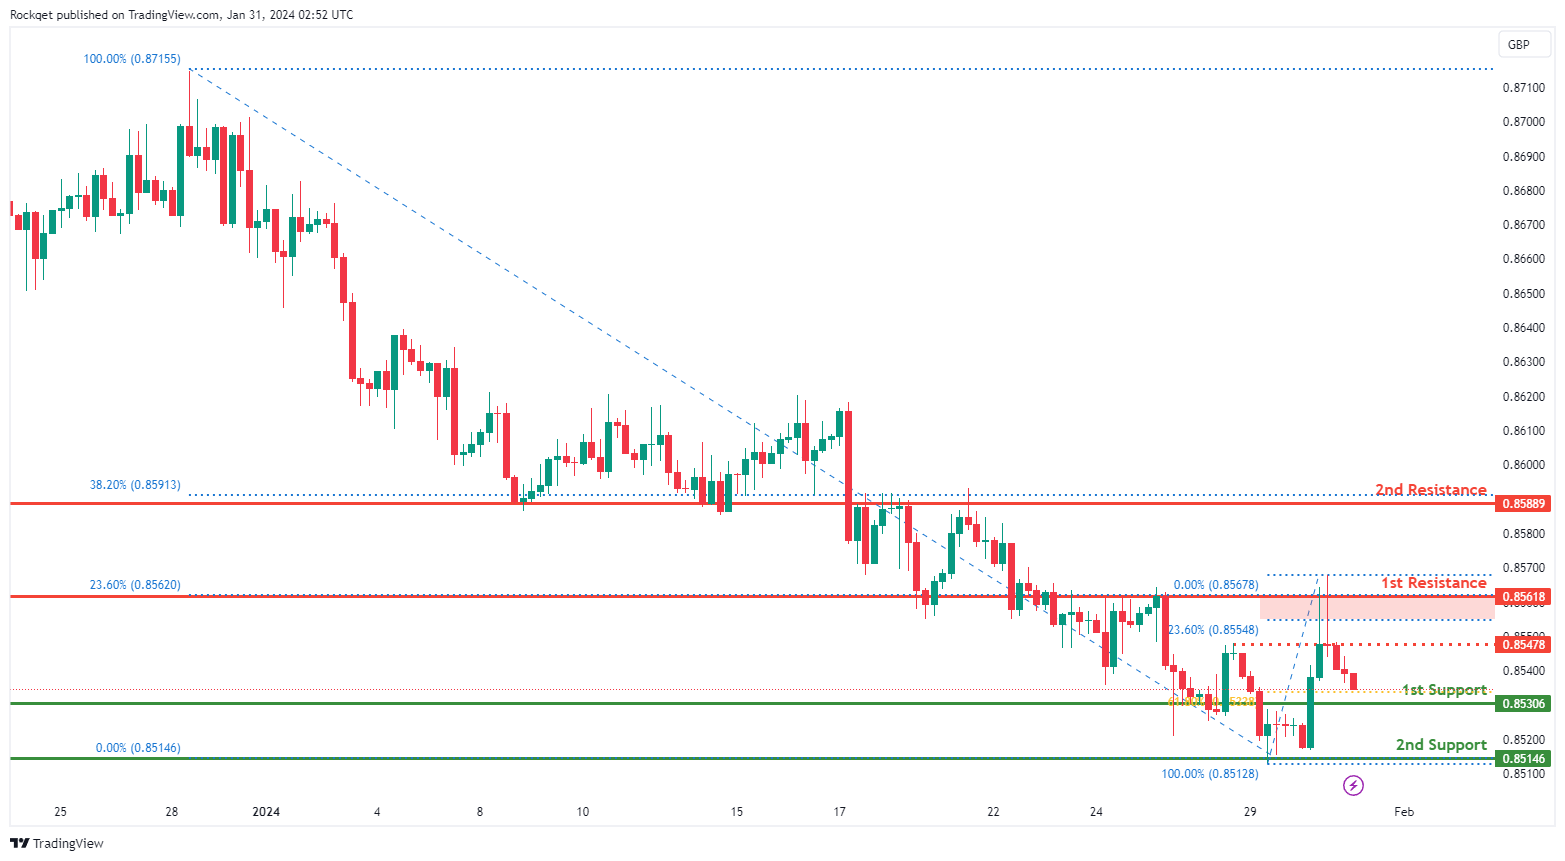
The EUR/GBP chart currently exhibits a bearish overall momentum, suggesting a prevailing downward trend. There is a potential scenario where the price could continue its bearish movement towards the 1st support.
The 1st support at 0.8531 is considered favorable for several reasons. Firstly, it is identified as an overlap support, indicating a historical level where buying interest has previously emerged. Additionally, this support level aligns with the 61.80% Fibonacci Retracement, adding confluence to its significance.
The 2nd support at 0.8515 is recognized as a swing low support, providing additional strength to the potential support zone.
On the resistance side, the 1st resistance at 0.8562 is noteworthy for being an overlap resistance and coincides with the 23.60% Fibonacci Retracement.
Similarly, the 2nd resistance at 0.8589 is identified as an overlap resistance, aligning with the 38.20% Fibonacci Retracement. An intermediate resistance at 0.8548 is highlighted as a pullback resistance, adding further context to the resistance levels.
GBP/USD:
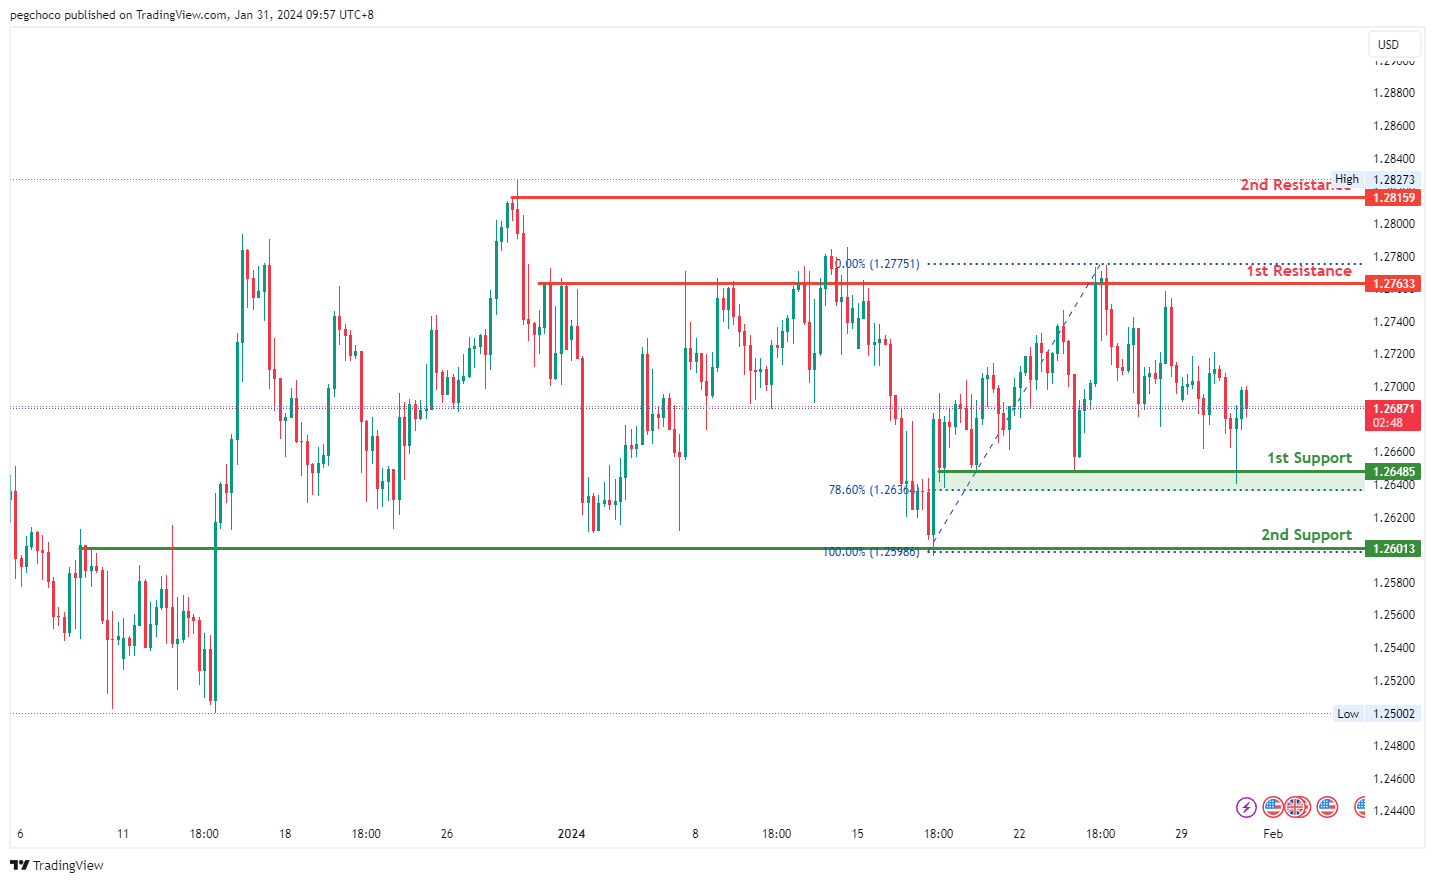
The GBP/USD chart currently exhibits a bearish overall momentum, indicating a downward trend. According to your analysis, the price could potentially continue its bearish movement towards the 1st support level.
The 1st support level at 1.2648 is identified as a multi-swing low support. This level is significant as it aligns with the 78.60% Fibonacci Retracement, suggesting historical relevance and the potential for it to act as a strong support zone where buying interest may emerge.
Additionally, the 2nd support level at 1.2601 is categorized as an overlap support. Such levels often have historical significance and can reinforce the importance of the 1st support zone.
On the resistance side, the 1st resistance level at 1.2763 is described as a multi-swing high resistance. This level represents a historical point where the price has encountered resistance in the past. Traders should monitor this level closely as it may act as a barrier to further upward movement.
The 2nd resistance level at 1.2815 is categorized as a swing high resistance, indicating another historical level of resistance. It can be considered significant in the event of an upward price movement.
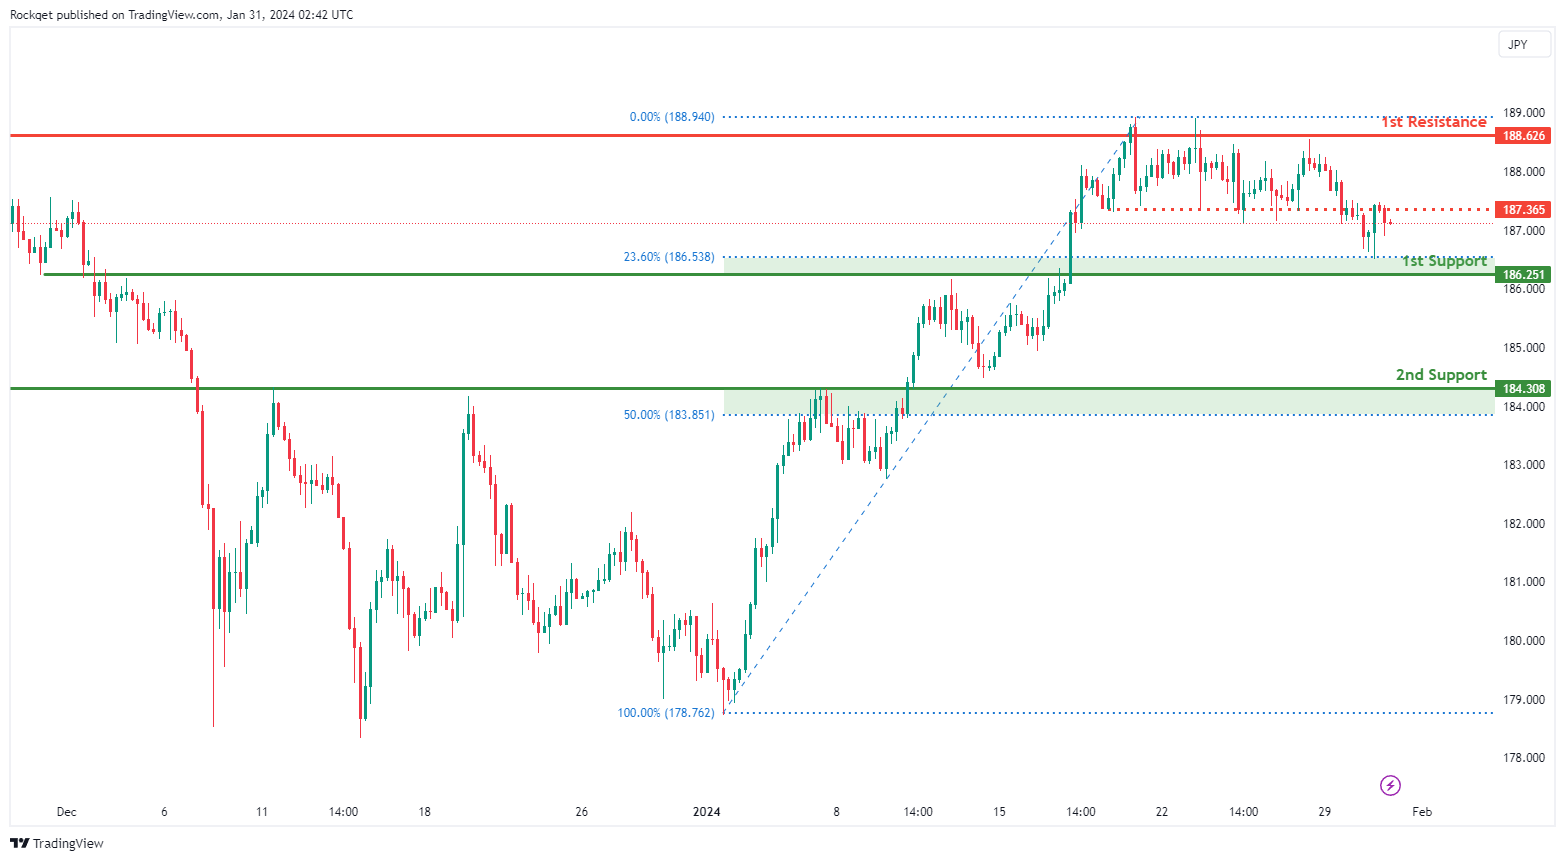
GBP/JPY:
The GBP/JPY chart currently displays a bearish overall momentum, indicating a prevailing downward trend. There is a potential scenario where the price could continue its bearish movement towards the 1st support.
The 1st support at 186.251 is considered favorable for several reasons. Firstly, it is identified as an overlap support, indicating a historical level where buying interest has previously emerged. Additionally, this support level aligns with the 23.60% Fibonacci Retracement, adding confluence to its significance.
The 2nd support at 184.308 is recognized as an overlap support and coincides with the 50% Fibonacci Retracement, providing additional strength to the potential support zone.
On the resistance side, the 1st resistance at 188.626 is noteworthy for being a multi-swing high resistance. An intermediate resistance at 187.365 is highlighted as an overlap resistance, adding further context to the resistance levels.
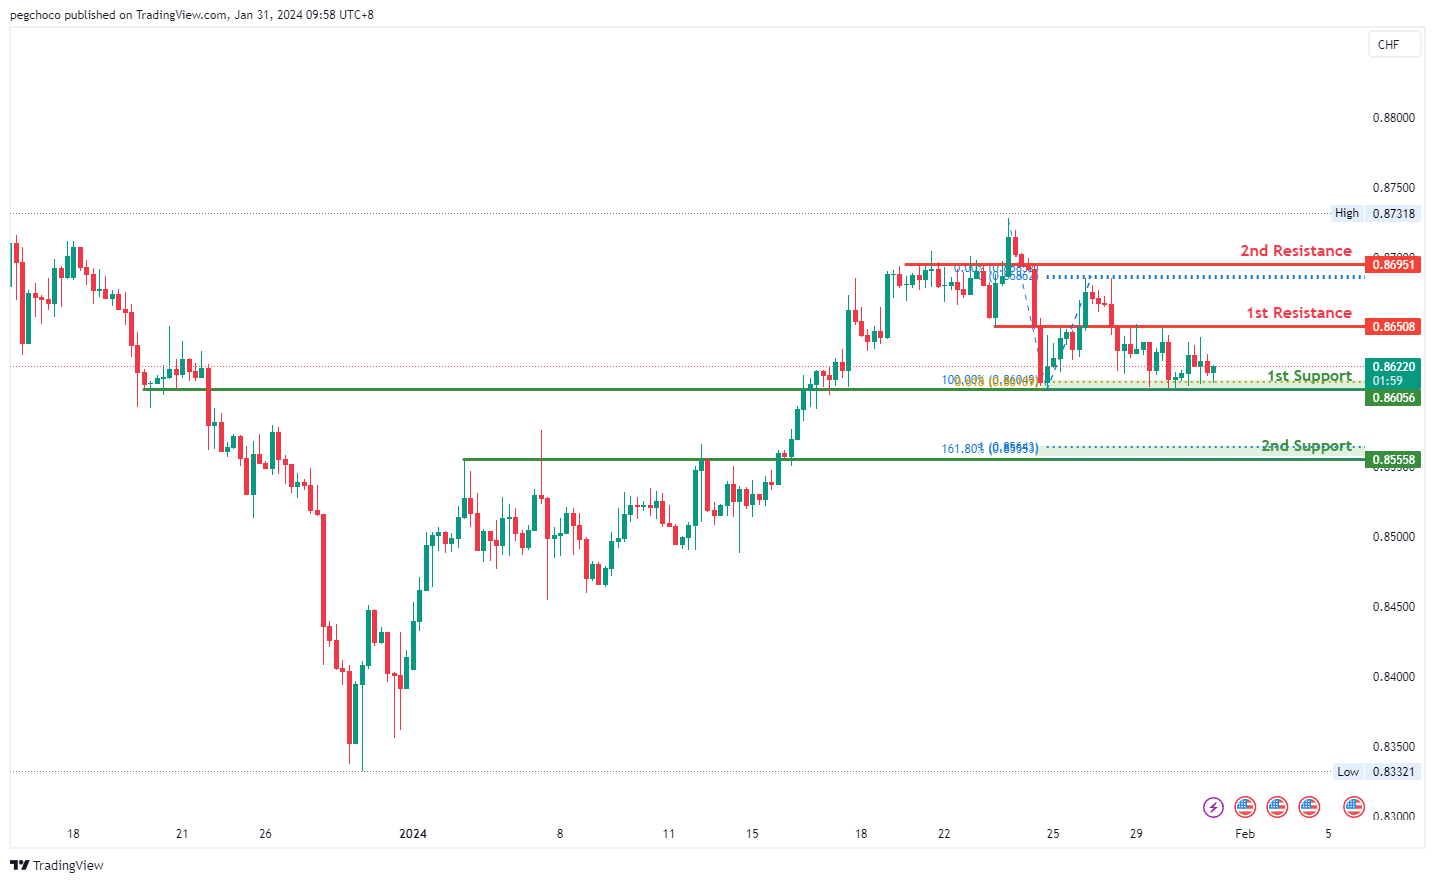
USD/CHF:
The USD/CHF chart currently exhibits a bullish overall momentum, indicating an upward trend. According to your analysis, the price could potentially experience a bullish bounce off the 1st support level and head towards the 1st resistance.
The 1st support level at 0.8605 is identified as an overlap support and is reinforced by the presence of the 61.80% Fibonacci Projection. This suggests that it has historical significance and could potentially act as a strong support level where buying interest may emerge.
The 2nd support level at 0.8555 is described as a pullback support and is associated with the 161.80% Fibonacci Extension, further emphasizing its importance as a potential support zone.
On the resistance side, the 1st resistance level at 0.8650 is categorized as an overlap resistance, indicating that it represents a historical point where the price has encountered resistance in the past.
The 2nd resistance level at 0.8695 is identified as a multi-swing high resistance, suggesting that it is another historical level where the price has faced resistance.
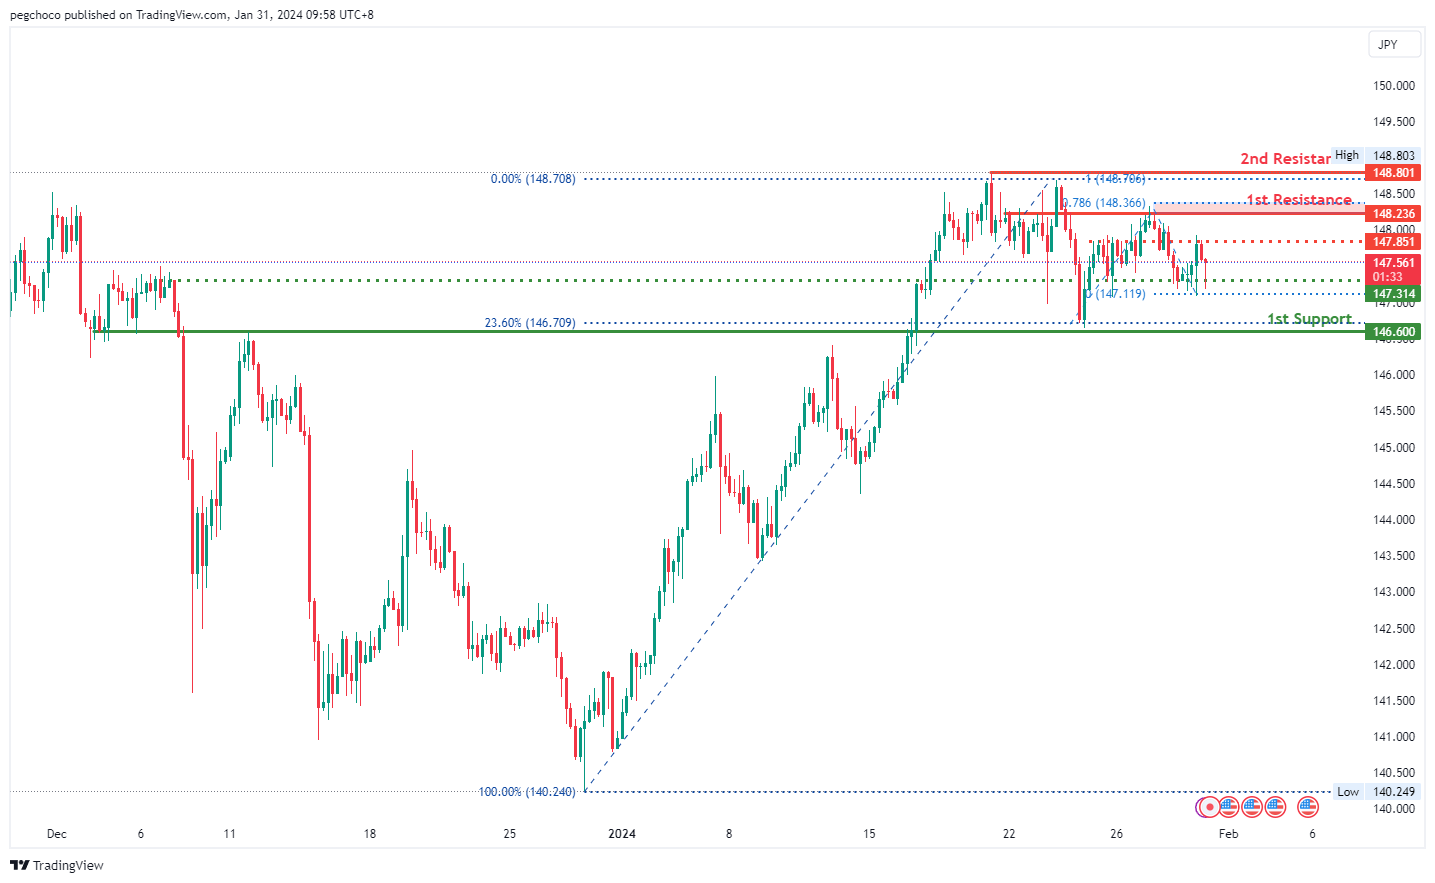
USD/JPY:
The USD/JPY chart is currently displaying a bearish overall momentum, indicating a downward trend. According to your analysis, the price could potentially continue its bearish movement towards the 1st support level.
The 1st support level at 146.60 is identified as an overlap support and is further reinforced by the presence of the 23.60% Fibonacci Retracement, suggesting historical significance and the potential for it to act as a strong support zone.
Additionally, there is an intermediate support level at 147.31, which is also categorized as an overlap support, adding further strength to the potential support in this area.
On the resistance side, the 1st resistance level at 148.23 is considered a multi-swing high resistance, and it is associated with the 78.60% Fibonacci Projection, making it a notable level to watch for potential price reversals.
The 2nd resistance level at 148.80 is identified as a swing high resistance and is associated with the 100% Fibonacci Projection, indicating its significance as a historical point of price resistance.
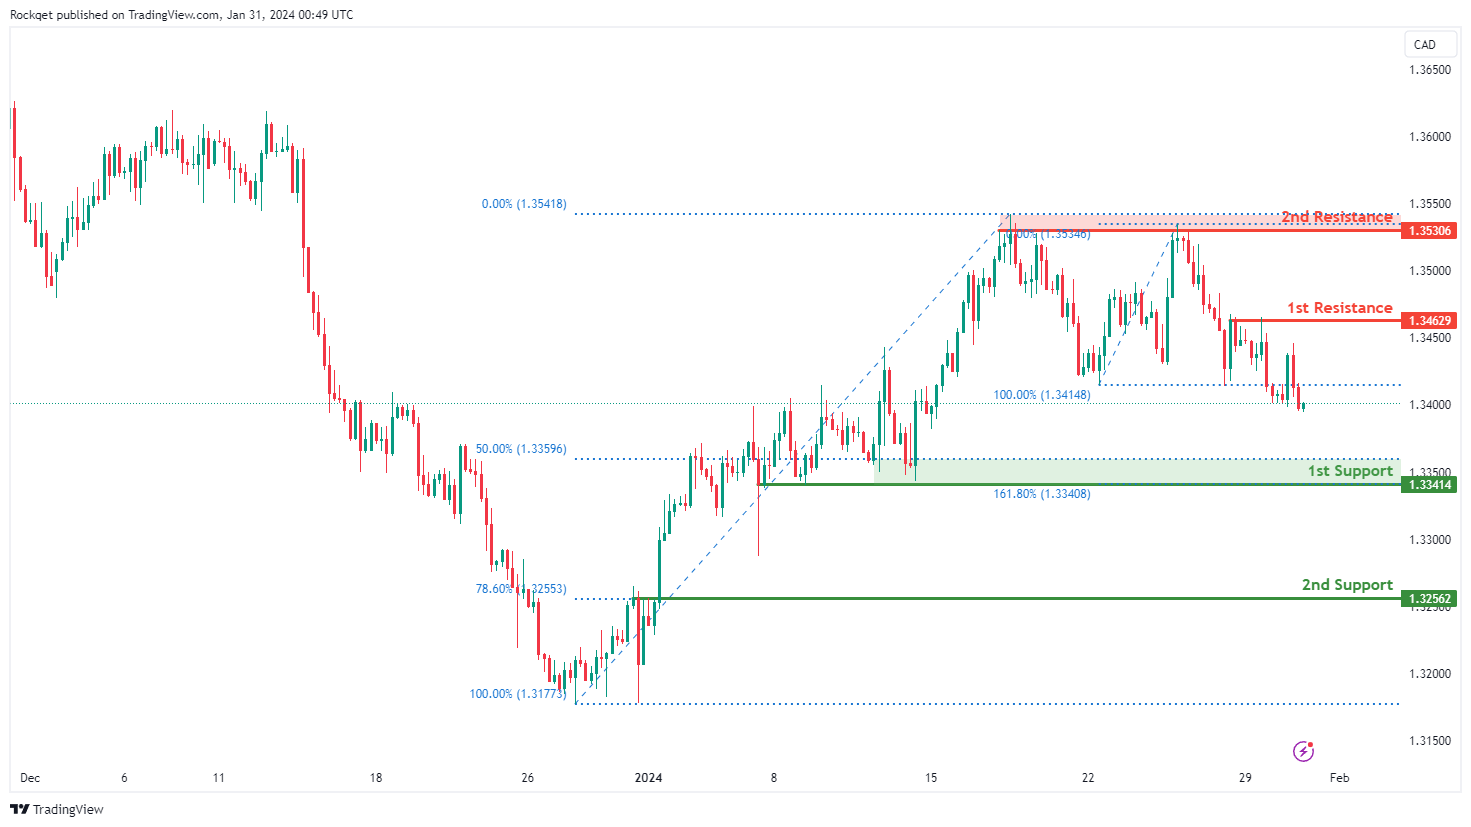
USD/CAD:
The USD/CAD chart currently exhibits an overall bearish momentum. In this context, there is a potential scenario for price to make a bearish continuation towards the 1st support level.
The 1st support level at 1.3341 is identified as a pullback support that aligns close to the 50.00% Fibonacci Retracement level. Further below, the 2nd support level at 1.3256 is also marked as a pullback support that aligns with the 78.60% Fibonacci Retracement level, further emphasizing its importance as a potential support zone.
On the resistance side, the 1st resistance level at 1.3462 is identified as a pullback resistance. Higher up, the 2nd resistance level at 1.3530 is noted as a multi-swing-high resistance, further highlighting its importance as a potential resistance point.
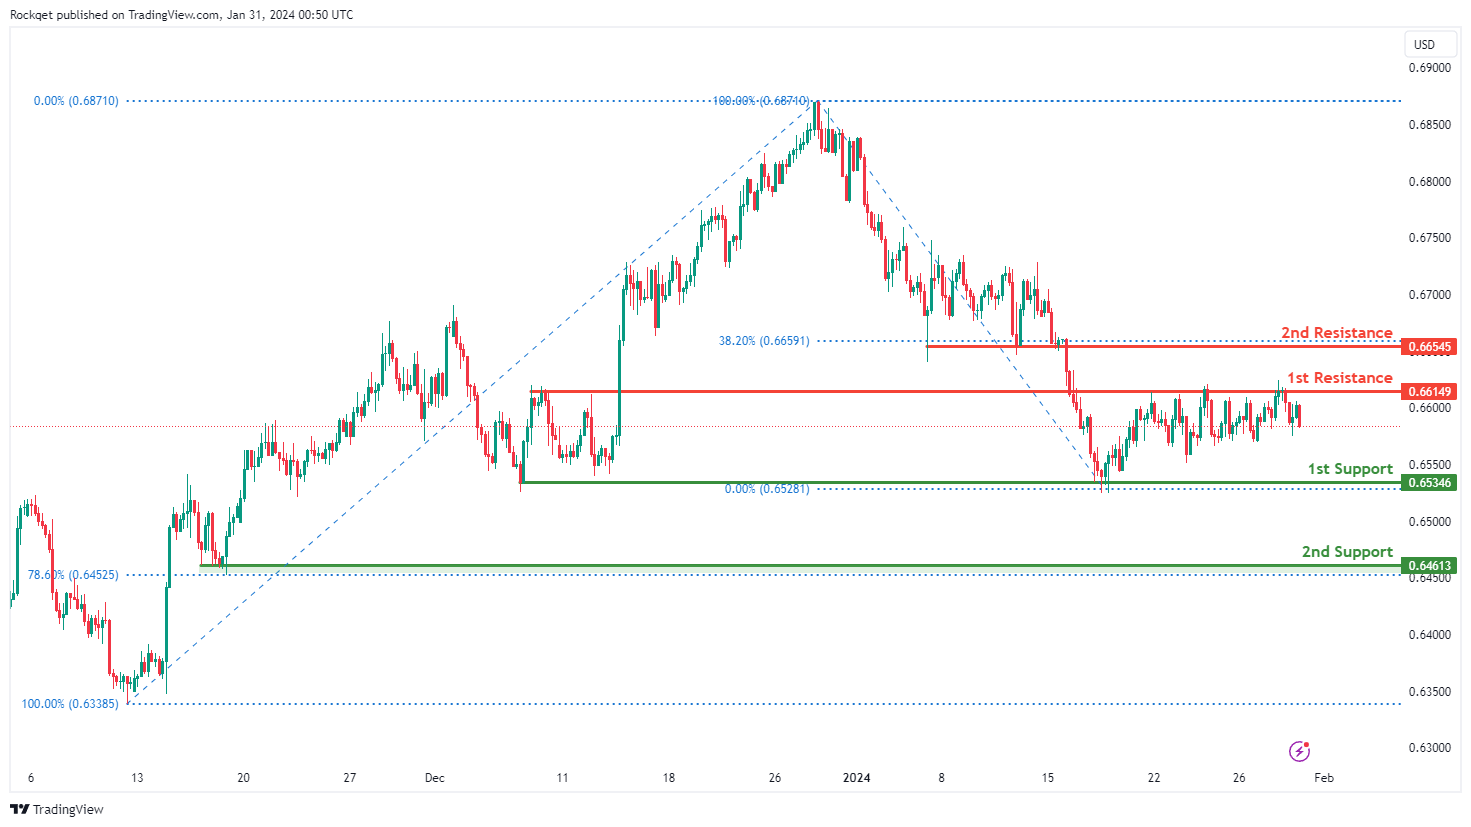
AUD/USD:
The AUD/USD chart currently exhibits a neutral bias. In this context, there is a potential scenario for price to fluctuate between the 1st resistance and 1st support.
The 1st support level at 0.6534 is identified as a pullback support. Further below, the 2nd support level at 0.6461 is also noted as a pullback support that aligns close to the 78.60% Fibonacci Retracement level, further emphasizing its importance as a potential support zone.
On the resistance side, the 1st resistance level at 0.6614 is identified as a pullback resistance. Higher up, the 2nd resistance level at 0.6654 is also marked as a pullback resistance that aligns with the 38.20% Fibonacci Retracement level, further highlighting its importance as a potential resistance point.
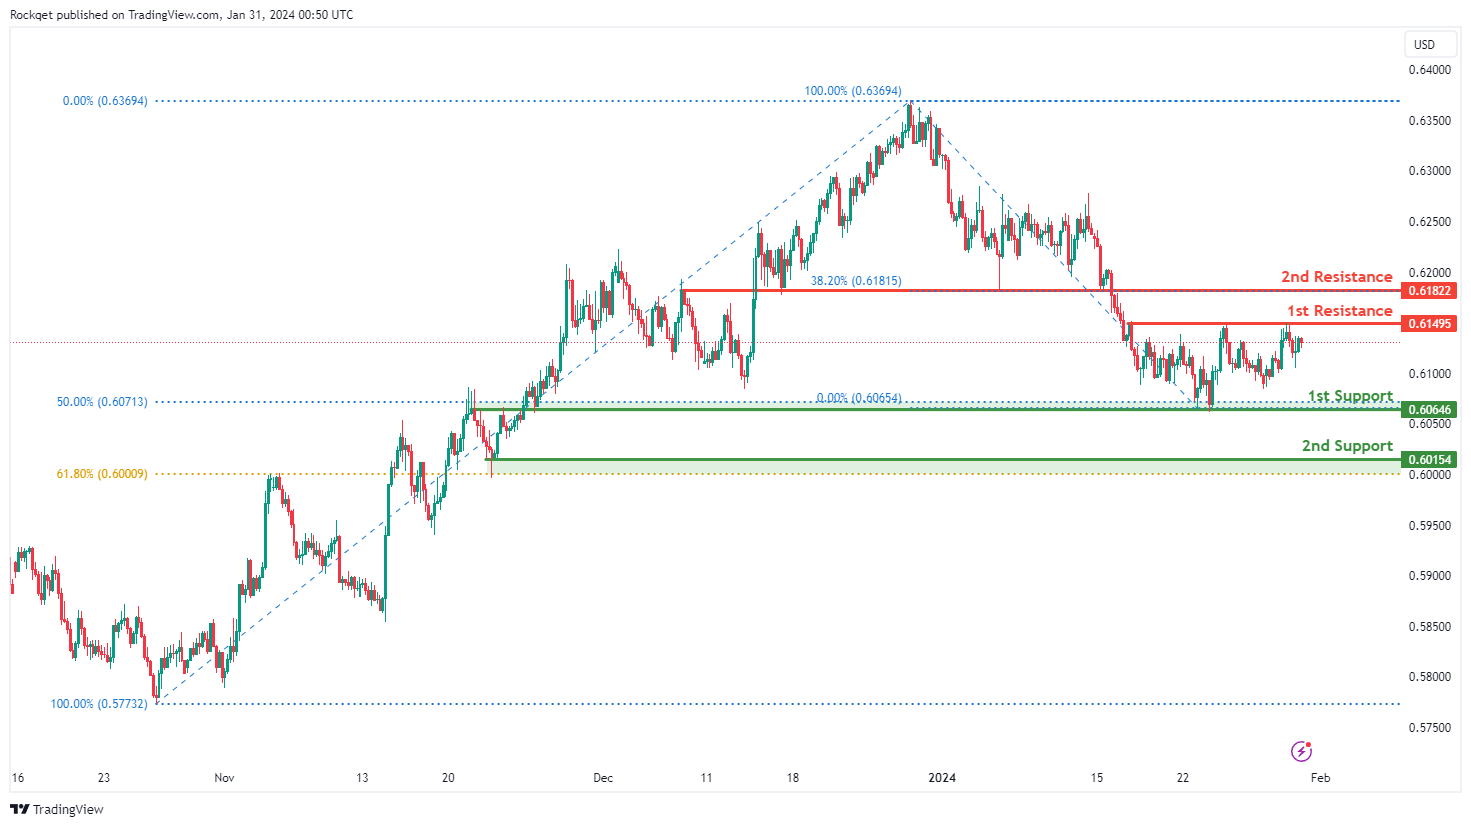
NZD/USD
The NZD/USD chart currently exhibits a neutral bias. In this context, there is a potential scenario for price to fluctuate between the 1st resistance and 1st support.
The 1st support level at 0.6064 is identified as an overlap support that aligns with the 50.00% Fibonacci Retracement level. Further below, the 2nd support level at 0.6015 is noted as a pullback support that aligns close to the 61.80% Fibonacci Retracement level, further emphasizing its importance as a potential support zone.
On the resistance side, the 1st resistance level at 0.6149 is identified as a pullback resistance. Higher up, the 2nd resistance level at 0.6182 is marked as an overlap resistance that aligns with the 38.20% Fibonacci Retracement level, further highlighting its importance as a potential resistance point.
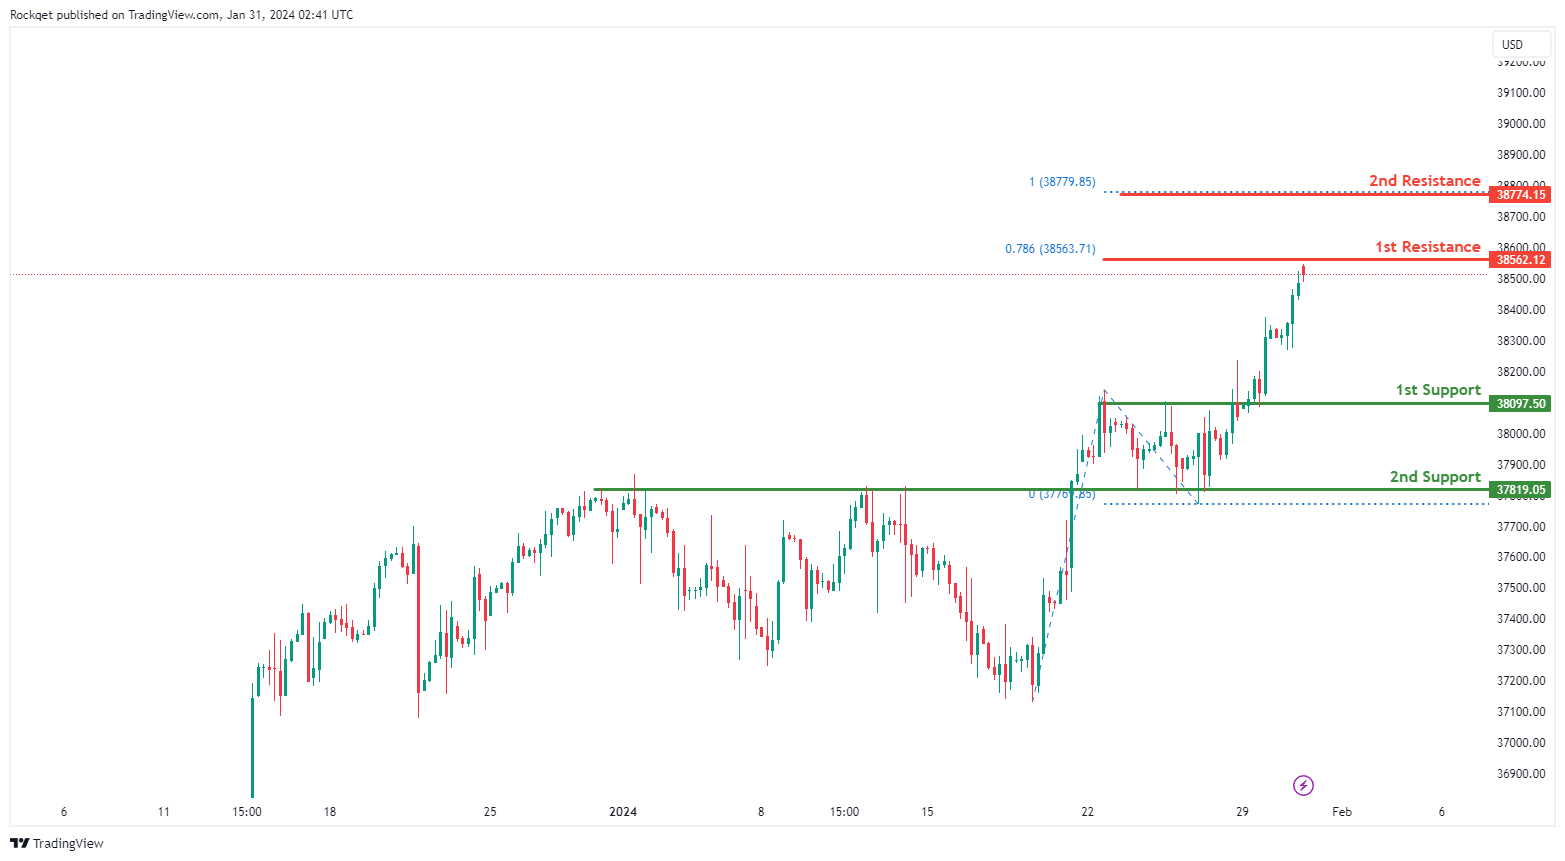
DJ30:
The DJ30 (Dow Jones Industrial Average) chart currently exhibits a bullish overall momentum, indicating a prevailing upward trend. There is a potential scenario where the price could continue its bullish movement towards the 1st resistance.
The 1st support at 38097.50 is considered favorable for being an overlap support, representing a historical level where buying interest has previously emerged.
The 2nd support at 37819.50 is also identified as an overlap support, adding additional strength to the support zone.
On the resistance side, the 1st resistance at 38562.12 is noteworthy for being a swing high resistance and aligning with the 78.60% Fibonacci Projection, adding confluence to its significance.
The 2nd resistance at 38774.15 is highlighted as the 100% Fibonacci Projection, indicating a potential price target.
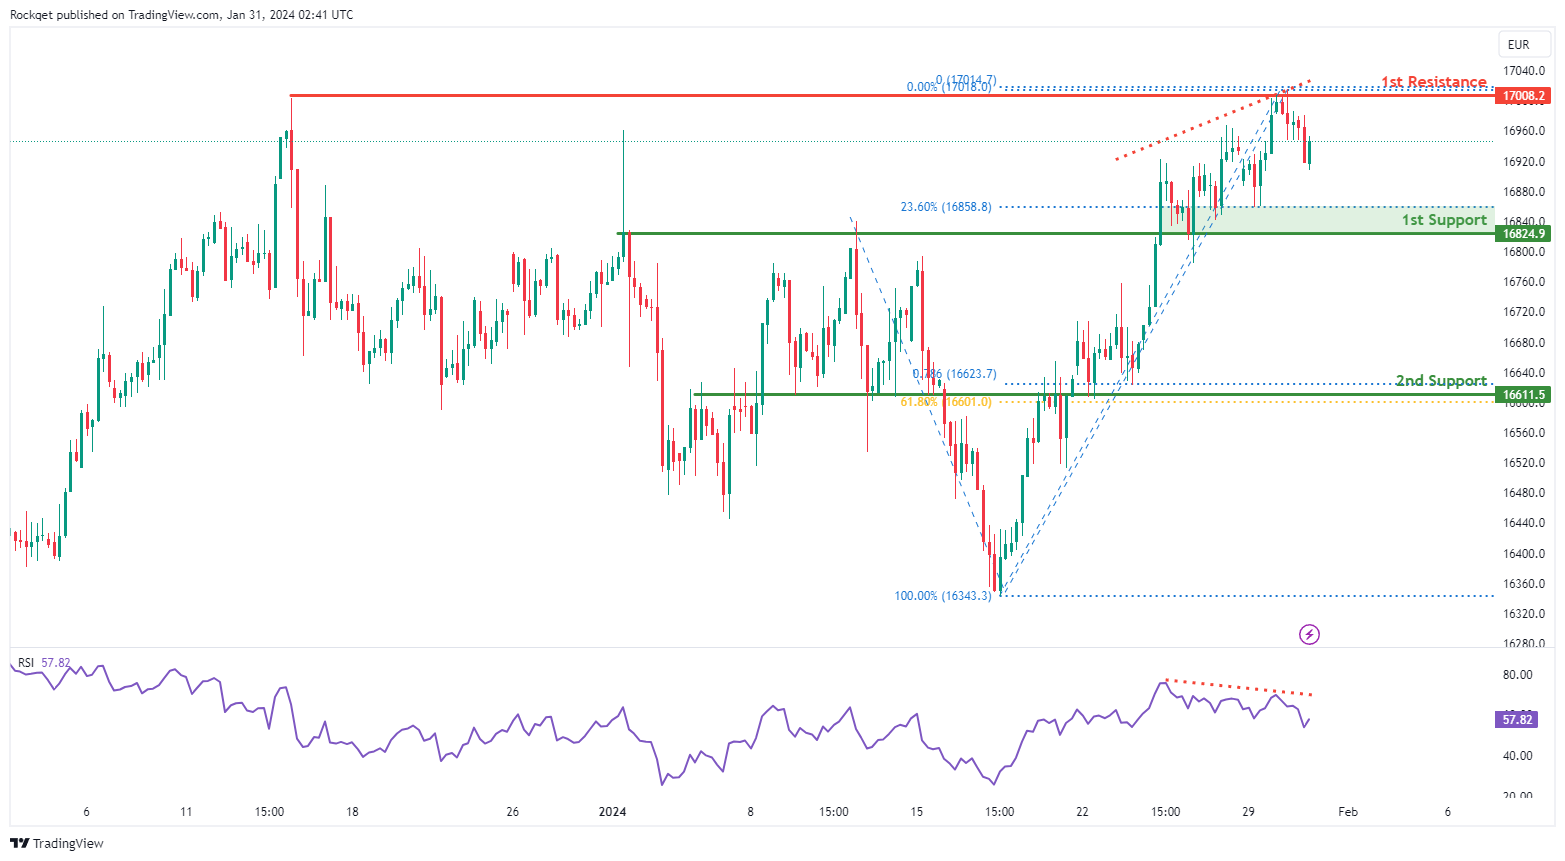
GER40:
The GER40 (DAX) chart is currently experiencing a bearish overall momentum, indicating a prevailing downward trend. Several factors contribute to this bearish momentum, suggesting potential downward movement in the price.
The 1st support at 16824.9 is considered advantageous for several reasons. Firstly, it is identified as a pullback support, indicating a historical level where buying interest has previously emerged. Additionally, this support level aligns with the 23.60% Fibonacci Retracement, adding confluence to its significance.
The 2nd support at 16611.5 is recognized as an overlap support, providing additional strength to the potential support zone. Furthermore, it coincides with the 61.80% Fibonacci Retracement and the 78.60% Fibonacci Projection, further reinforcing its importance.
On the resistance side, the 1st resistance at 17008.2 is highlighted as a multi-swing high resistance. This level may act as a barrier to the bearish momentum.
Additionally, the Relative Strength Index (RSI) is also displaying bearish divergence versus price, suggesting that a reversal might occur soon.This occurs when the RSI forms lower highs while the price forms higher highs, signaling potential weakening of the bullish momentum and the possibility of a reversal.
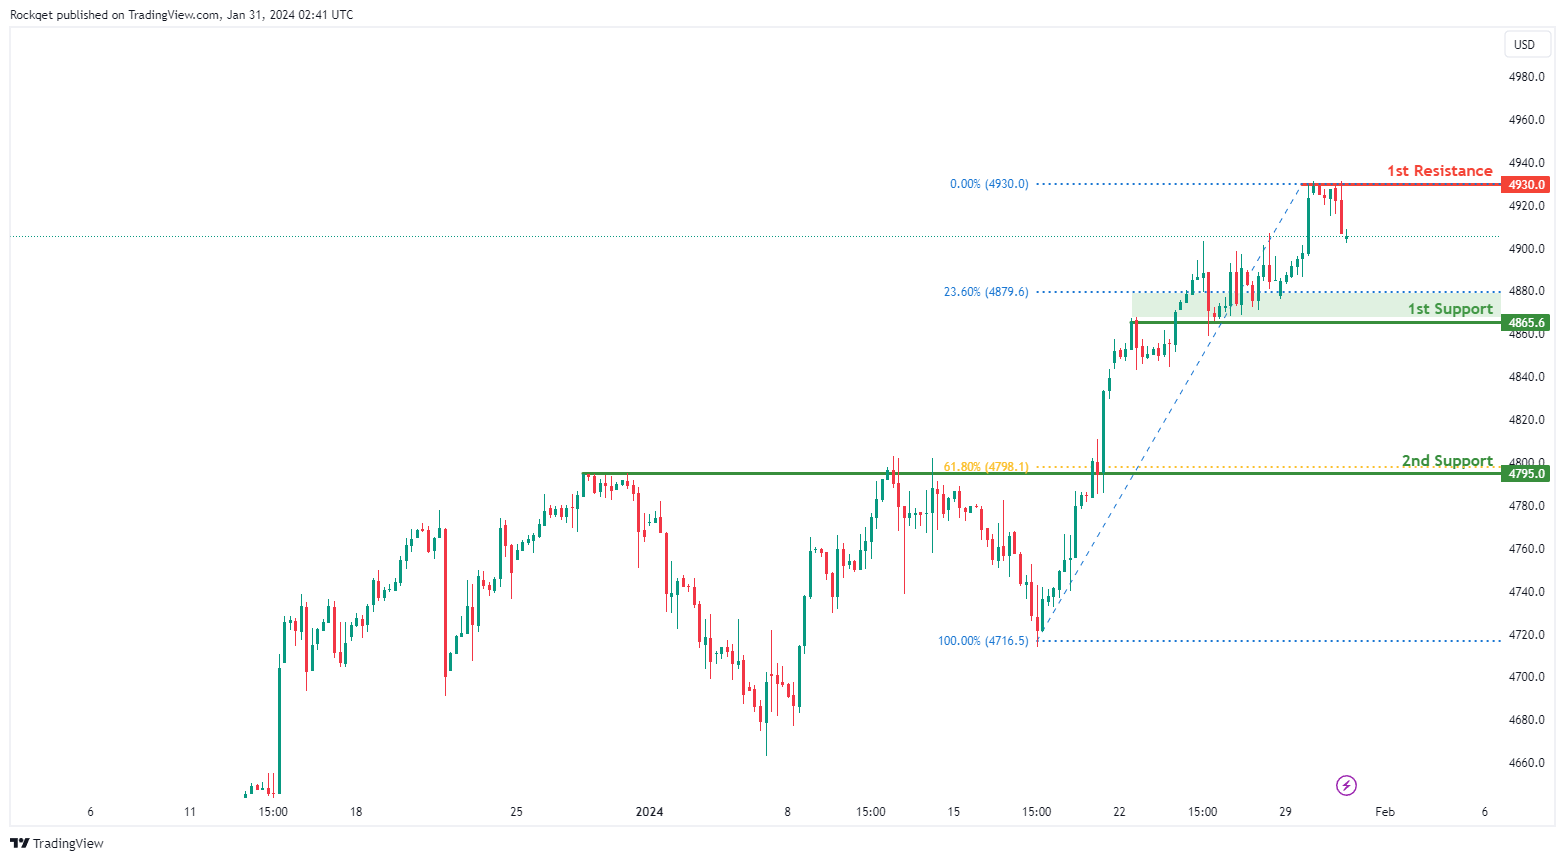
US500:
The US500 chart currently exhibits a weak bearish overall momentum with low confidence, indicating a hesitant downward trend. Several factors contribute to this weak bearish momentum, suggesting potential downward movement in the price.
The 1st support at 4865.6 is considered favorable for several reasons. Firstly, it is identified as an overlap support, indicating a historical level where buying interest has previously emerged. Additionally, this support level aligns with the 23.60% Fibonacci Retracement, adding confluence to its significance.
The 2nd support at 4795.0 is recognized as a pullback support and coincides with the 61.80% Fibonacci Retracement, providing additional strength to the potential support zone.
On the resistance side, the 1st resistance at 4939.0 is noteworthy for the presence of a swing high resistance. This level may act as a barrier to the bearish momentum.
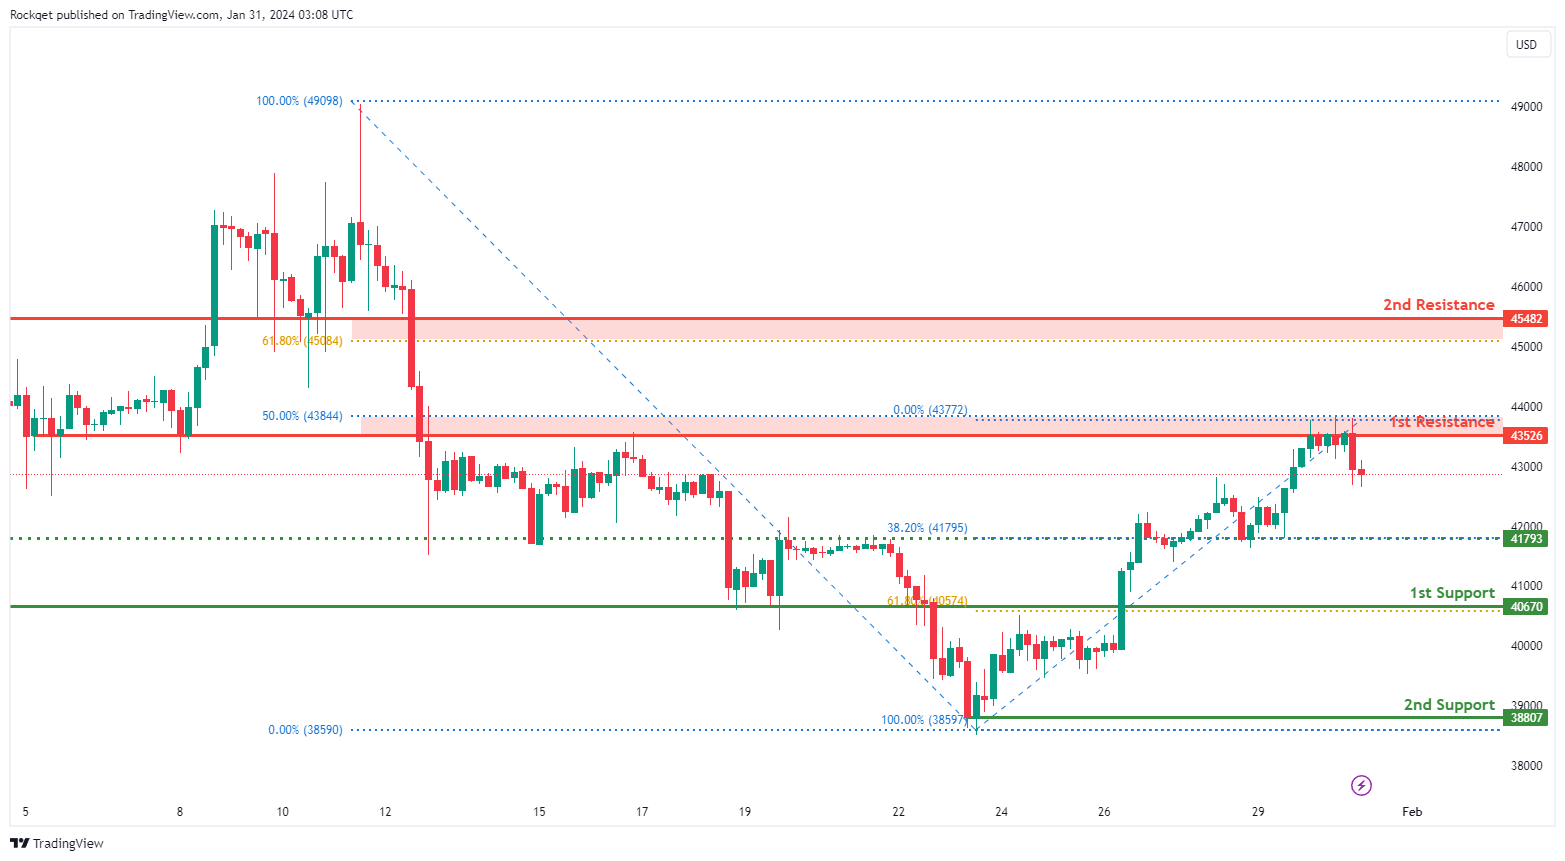
BTC/USD:
The BTC/USD chart currently displays a bearish overall momentum, indicating a prevailing downward trend. Several factors contribute to this bearish momentum, suggesting potential downward movement in the price.
The 1st support at 40670 is considered favorable for several reasons. Firstly, it is identified as an overlap support, indicating a historical level where buying interest has previously emerged. Additionally, this support level aligns with the 61.80% Fibonacci Retracement, adding confluence to its significance.
The 2nd support at 38807 is recognized as a swing low support, providing additional strength to the potential support zone.
The intermediate support at 41793 is identified as an overlap support and coincides with the 38.20% Fibonacci Retracement, further reinforcing its importance.
On the resistance side, the 1st resistance at 43526 is noteworthy for the presence of an overlap resistance and the 50% Fibonacci Retracement, adding significance to this potential resistance level.
Furthermore, the 2nd resistance at 45482 is acknowledged as an overlap resistance and aligns with the 61.80% Fibonacci Retracement, contributing to the overall resistance zone.
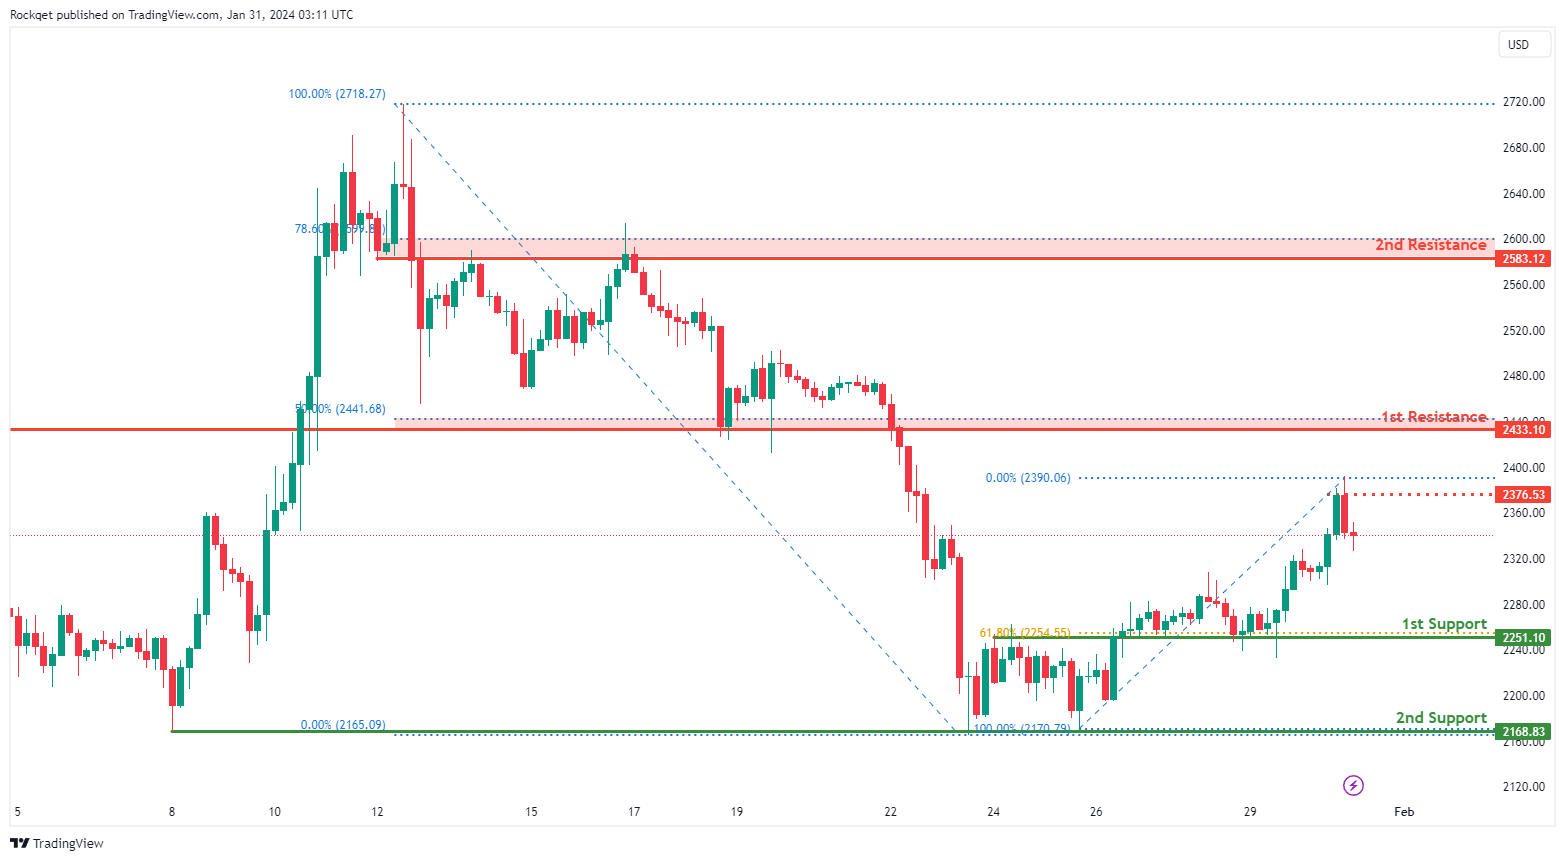
ETH/USD:
The ETH/USD chart currently displays a weak bearish overall momentum with low confidence, suggesting a hesitant downward trend. Several factors contribute to this weak bearish momentum, indicating the potential for downward movement in the price.
The 1st support at 2251.10 is considered favorable for several reasons. Firstly, it is identified as an overlap support, indicating a historical level where buying interest has previously emerged. Additionally, this support level aligns with the 61.80% Fibonacci Retracement, adding confluence to its significance.
The 2nd support at 2168.83 is recognized as a multi-swing low support, providing additional strength to the potential support zone.
On the resistance side, the 1st resistance at 2433.10 is noteworthy for the presence of an overlap resistance and the 50% Fibonacci Retracement, adding significance to this potential resistance level.
Furthermore, the 2nd resistance at 2583.12 is acknowledged as an overlap resistance and aligns with the 78.60% Fibonacci Retracement, contributing to the overall resistance zone.
The intermediate resistance at 2376.53 is identified as a swing high resistance, further reinforcing its importance.
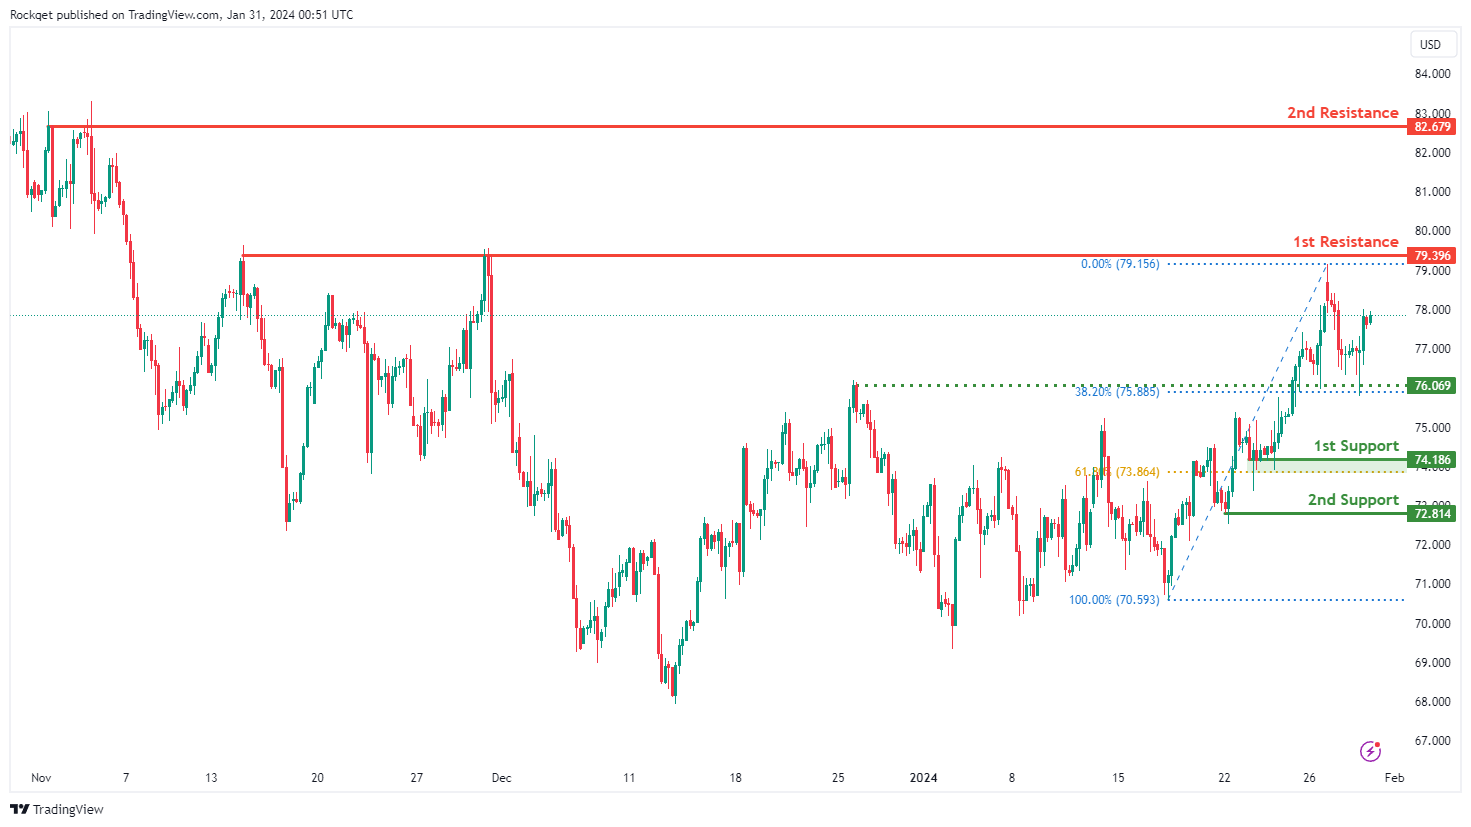
WTI/USD:
The WTI (West Texas Intermediate) chart currently exhibits an overall bullish momentum. In this context, there is a potential scenario for price to make a bullish rise towards the 1st resistance.
The 1st resistance level at 79.39 is identified as a multi-swing-high resistance. Higher up, the 2nd resistance level at 82.67 is noted as a pullback resistance, further highlighting its importance as a potential resistance point.
On the support side, the intermediate support level at 76.06 is identified as an overlap support that aligns close to the 38.20% Fibonacci Retracement level while the 1st support level at 74.18 is noted as a pullback support that aligns close to the 61.80% Fibonacci Retracement level. Further below, the 2nd support level at 72.81 is also marked as a pullback support, reinforcing its significance as a key support level.
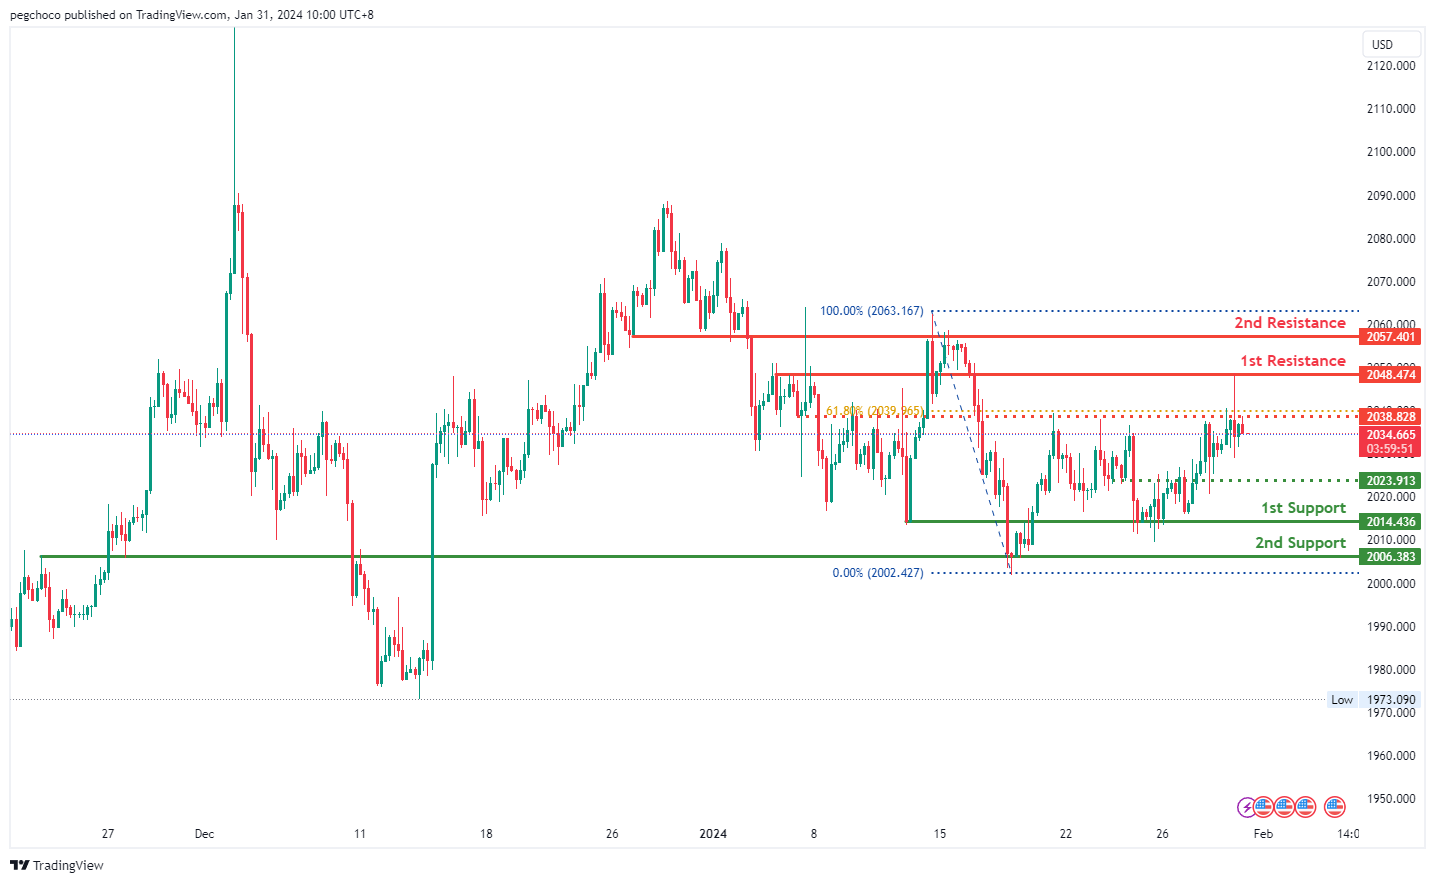
XAU/USD (GOLD):
The XAU/USD chart is currently displaying a bearish overall momentum, indicating a downward trend. According to your analysis, the price could potentially continue its bearish movement towards the 1st support level.
The 1st support level at 2014.43 is identified as an overlap support, suggesting historical significance and the potential for it to act as a strong support zone.
Additionally, there is a 2nd support level at 2006.38, which is also categorized as an overlap support, reinforcing the potential support in this area.
On the resistance side, the 1st resistance level at 2048.47 is considered an overlap resistance, indicating a historical point of price resistance.
The 2nd resistance level at 2057.40 is also identified as an overlap resistance, further suggesting a potential barrier for the price.
Moreover, there is an intermediate resistance level at 2038.82, categorized as an overlap resistance, which could potentially provide additional resistance to any bullish attempts.
China’s NBS PMI manufacturing ticks up to 49.3, contraction continues
China's manufacturing sector remained in contraction for the fourth consecutive month, with NBS PMI Manufacturing index marginally rising from 49.0 to 49.3 in January, slightly below the expected 49.3.
The continued manufacturing contraction is evident in the subindexes: new orders was 49.0, marking the fourth month of contraction, while new export orders index stood at 47.2, contracting for the tenth consecutive month. A concerning detail is the employment subindex, which fell to a 13-month low of 47.6, indicating contraction for 11 straight months.
On a positive note, the manufacturing sector's production index attained a 4-month high, advancing to 51.3, and has sustained expansion for eight consecutive months.
In contrast, PMI Non-Manufacturing saw a slight improvement, rising from 50.4 to 50.7, marginally above the forecast of 50.6. Consequently, PMI Composite, which encompasses both manufacturing and services sectors, reached a four-month peak of 50.9, up from 50.3 in the previous month.
Australia’s CPI down to 4.1% yoy in Q4, monthly CPI down to 3.4% yoy in Dec
Australia's inflation data for Q4 show notable easing in price pressures. CPI rose by 0.6% qoq, a considerable slowdown from the previous quarter's 1.2% qoq and below expectation 0.8% qoq. This marks the smallest quarterly increase since Q1 2021. On an annual basis, CPI decelerated from 5.4% yoy to 4.1% yoy, coming in lower than the forecasted 4.3% yoy.
RBA's trimmed mean CPI, which is a measure of core inflation, also reflected this trend. It increased by 0.8% qoq and 4.2% yoy, down from 1.2% qoq and 5.2% yoy respectively in the previous quarter. These figures were below the expected 0.9% qoq and 4.3% yoy. Notably, this represents the fourth consecutive quarter of declining annual trimmed mean inflation, falling from a peak of 6.8% in Q4 2022.
Additionally, monthly CPI showed a sharp slowdown from 4.3% yoy to 3.4% yoy, undershooting expectation of 3.7% yoy.
NZ ANZ business confidence rises to 36.6, inflation expectations lowest since Nov 2021
New Zealand ANZ Business Confidence rose from 33.2 to 36.6 in January. However, Own Activity Outlook fell from 29.3 to 25.6.
In a significant development, inflation expectations decreased from 4.61% to 4.28%, reaching their lowest point since November 2021. Despite this decline in inflation expectations, a high number of firms still plan to increase their prices, with the pricing intentions index only marginally decreasing from 50.2 to 49.7. Cost expectations also saw a slight reduction, moving from 76.2 to 75.6, but they remain at elevated levels.
ANZ's commentary on the situation pointed out that the New Zealand economy is at a critical point, expressing a cautiously optimistic outlook. They anticipate that RBNZ has implemented sufficient tightening measures and expect a gradual realization of their impact, leading to a possible initiation of "a steady stream of OCR cuts" by August.
Japan’s industrial production rises 1.8% mom in Dec, a bounce in seesawing pattern
Japan's industrial production rose 1.8% mom in December, rebounding from prior month's -0.9% mom contraction, but missed expectation of 2.4% mom.
Manufacturers have tempered expectations for the coming months, predicting a -6.2% mom drop in production in January, followed by a modest 2.2% mom increase in February. The Ministry of Economy, Trade and Industry maintains its assessment of "seesawing" on production.
As an METI official indicated, the recent Noto Peninsula earthquake's impact on manufacturing appears minimal for January. However, production forecasts are clouded by the suspension of operations at Daihatsu due to issues with collision-safety test irregularities.
"Although we believe that the production sentiment of companies is gradually getting out of the bearish phase, for the time being, we need to pay attention to the impact of the suspension of auto manufacturers' operation," the official said.
In separate release, retail sales grew 2.1% yoy in December, well below expectation of 5.0% yoy.
GBP/USD Eyes Fresh Increase, Fed Rate Decision Next
Key Highlights
- GBP/USD is holding the 1.2620 and 1.2600 support levels.
- A key declining channel is forming with resistance near 1.2700 on the 4-hour chart.
- EUR/USD extended losses toward 1.0800 and remains at risk of more downsides.
- The Fed interest rate decision is scheduled today (forecast 5.5%, versus 5.5% previous).
GBP/USD Technical Analysis
The British Pound started a fresh decline after it faced sellers near 1.2775 against the US Dollar. GBP/USD is now holding the 1.2600 support and might start a fresh increase.
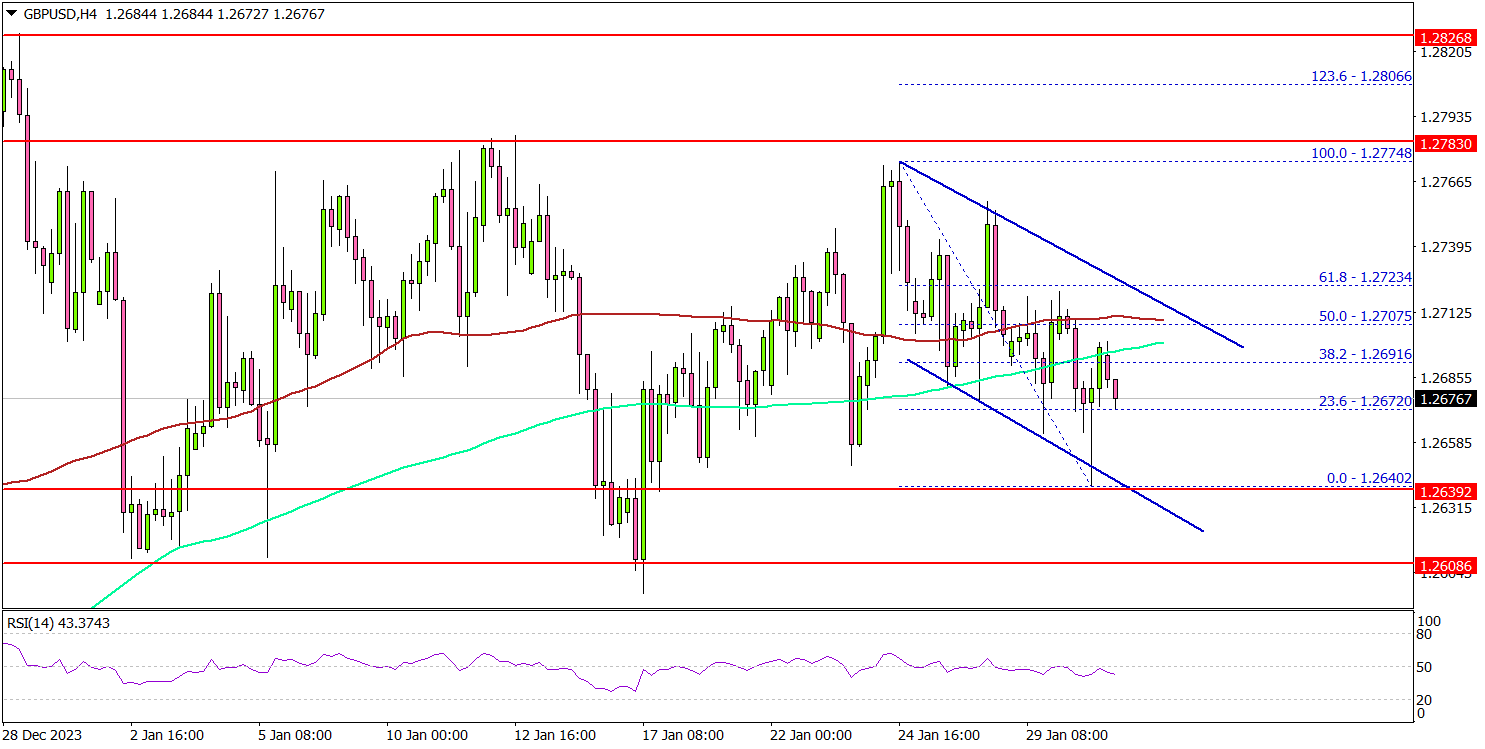
Looking at the 4-hour chart, the pair is showing a few positive signs from the 1.2640 support. The bulls are now attempting a fresh increase above the 1.2665 level. On the upside, the bulls are facing hurdles near the 1.2700 level.
There is also a key declining channel forming with resistance near 1.2700 on the same chart. It is close to the 100 simple moving average (red, 4 hours) and the 200 simple moving average (green, 4 hours).
The next key resistance is near the 1.2740 level. A close above the 1.2740 zone could open the doors for more upsides. The next stop for the bulls might be 1.2780. Any more gains might send EUR/USD toward the 1.2850 level.
If there is another decline, the pair might find bids near the 1.2640 level. The main support sits near the 1.2600 level. If there is a downside break below the 1.2600 level, the pair could even dive below 1.2565. The next major support is 1.2520. Any more losses might call for a drop toward the 1.2440 support.
Looking at EUR/USD, the pair is showing bearish and there is still a risk of more downsides below the 1.0800 support zone.
Economic Releases
- US ADP Employment Change for Jan 2023 - Forecast 145K, versus 164K previous.
- Fed Interest Rate Decision - Forecast 5.5%, versus 5.5% previous.
BoJ summary of opinions suggests rate hike within reach
The Summary of Opinions from BoJ's meeting on January 22-23 signaled the central bank's intensified focus on initiating its first rate hike since 2007 and moving away from its long-standing negative interest rate policy. The deliberations, however, stopped short of providing a clear timeline for these policy shifts.
A notable hawkish sentiment within BoJ pointed to the "growing possibility" of significant wage revisions in the upcoming spring, at "relatively higher levels" than in the past. This perspective is underpinned by the recognition of "improving trend" in both economic activities and price. Such developments suggest that the necessary conditions for revising monetary policy, including ending the negative interest rate regime, are increasingly "being met".
Concurrently, the impact of Noto Peninsula Earthquake on is a key factor under close observation. One opinion suggested that, after a thorough assessment of the earthquake's effects over "the next one or two months", BoJ is "highly likely to reach a point where it can normalize monetary policy".
On the other side of the spectrum, a more cautious stance was also expressed. While acknowledging that the probability of achieving the BoJ's 2 percent price stability target is becoming "more realistic", it was noted that certainty in reaching this goal is not yet fully established. However, this view also supports the initiation of discussions regarding the exit from the current monetary policy stance.
ECB’s Lagarde emphasizes wage growth as key determinant for rate cut decision
ECB President Christine Lagarde emphasized that the central bank is not yet ready to initiate rate cuts, underscoring the need for comprehensive data analysis
In a CNN interview overnight, she stated, "We are not there yet," added that the decision to loosen monetary policy hinges on "all sorts of data". She also singled out the significance of wage data as "critically important."
Despite acknowledging a clear disinflationary trend, Lagarde noted that ECB requires a deeper understanding and progression into this trend to make a well-informed decision. "We are on a disinflationary trend — no question about it," she confirmed, "But we need to be further into that process."
Lagarde's remarks also touched upon the consensus within the ECB regarding the direction of the next policy move. "I think we all agree that the next move" will be a cut, she said, aligning with the general anticipation of eventual rate reductions. However, the timing remains uncertain and subject to thorough examination of upcoming economic data.
A key factor in the timeline for interest rate cuts is the availability of wage growth data, which is not expected until after ECB's April meeting. This positions the June meeting as a more likely juncture for the consideration of rate cuts.