Sample Category Title
ECB’s Lagarde emphasizes wage growth as key determinant for rate cut decision
ECB President Christine Lagarde emphasized that the central bank is not yet ready to initiate rate cuts, underscoring the need for comprehensive data analysis
In a CNN interview overnight, she stated, "We are not there yet," added that the decision to loosen monetary policy hinges on "all sorts of data". She also singled out the significance of wage data as "critically important."
Despite acknowledging a clear disinflationary trend, Lagarde noted that ECB requires a deeper understanding and progression into this trend to make a well-informed decision. "We are on a disinflationary trend — no question about it," she confirmed, "But we need to be further into that process."
Lagarde's remarks also touched upon the consensus within the ECB regarding the direction of the next policy move. "I think we all agree that the next move" will be a cut, she said, aligning with the general anticipation of eventual rate reductions. However, the timing remains uncertain and subject to thorough examination of upcoming economic data.
A key factor in the timeline for interest rate cuts is the availability of wage growth data, which is not expected until after ECB's April meeting. This positions the June meeting as a more likely juncture for the consideration of rate cuts.
What To Trade In February
Major currency pairs like USD/JPY and USD/CHF face potential shifts in trends as central banks reevaluate interest rates. The Euro and British Pound are poised for nuanced movements based on economic conditions and rate decisions. Meanwhile, the Australian and New Zealand Dollars grapple with changing interest rate differentials and economic uncertainties. For now though, let’s look at a few trading opportunities for the month of February.
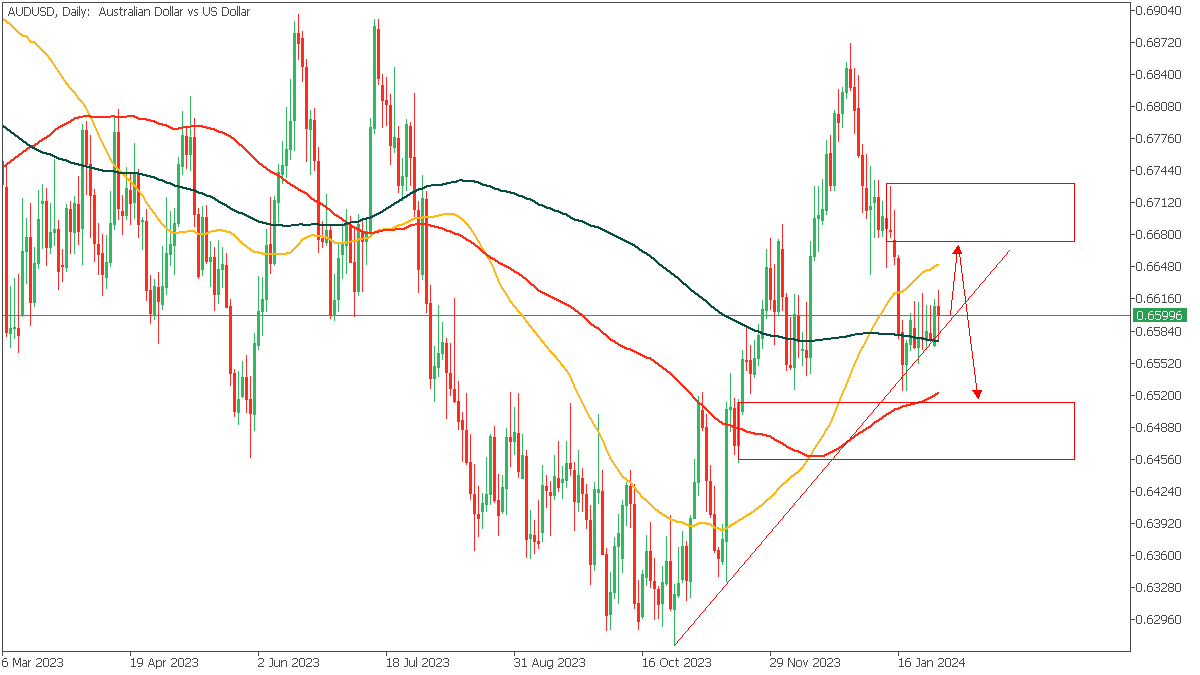
AUDUSD - D1 Timeframe
AUDUSD seems to be under a lot of bullish pressure from the trendline support and the 100-day moving average, both of which seem to be preventing prices from going any lower than they already are. This means we could get to see price scale up slightly to shake off some of the pressure, before sliding much lower to break the trendline and reach the 200-day moving average target below.
Analyst’s Expectations:
- Direction: Bearish
- Target: 0.65159
- Invalidation: 0.67356
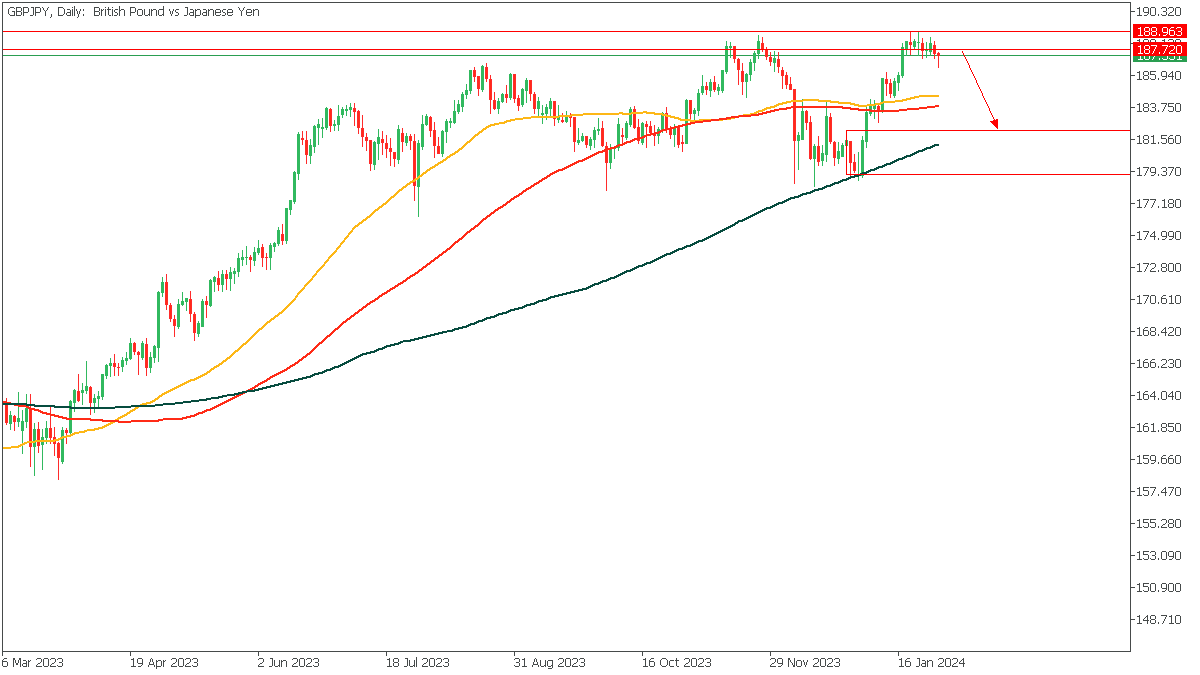
GBPJPY - D1 Timeframe
GBPJPY has been sulking around the weekly supply zone, with a very sluggish price action that indicates slowing momentum from the buyers. This simply means that with the advent of new selling pressure, we can expect to see GBPJPY slide much lower towards the 200-day moving average as a target.
Analyst’s Expectations:
- Direction: Bearish
- Target: 184.047
- Invalidation: 188.700
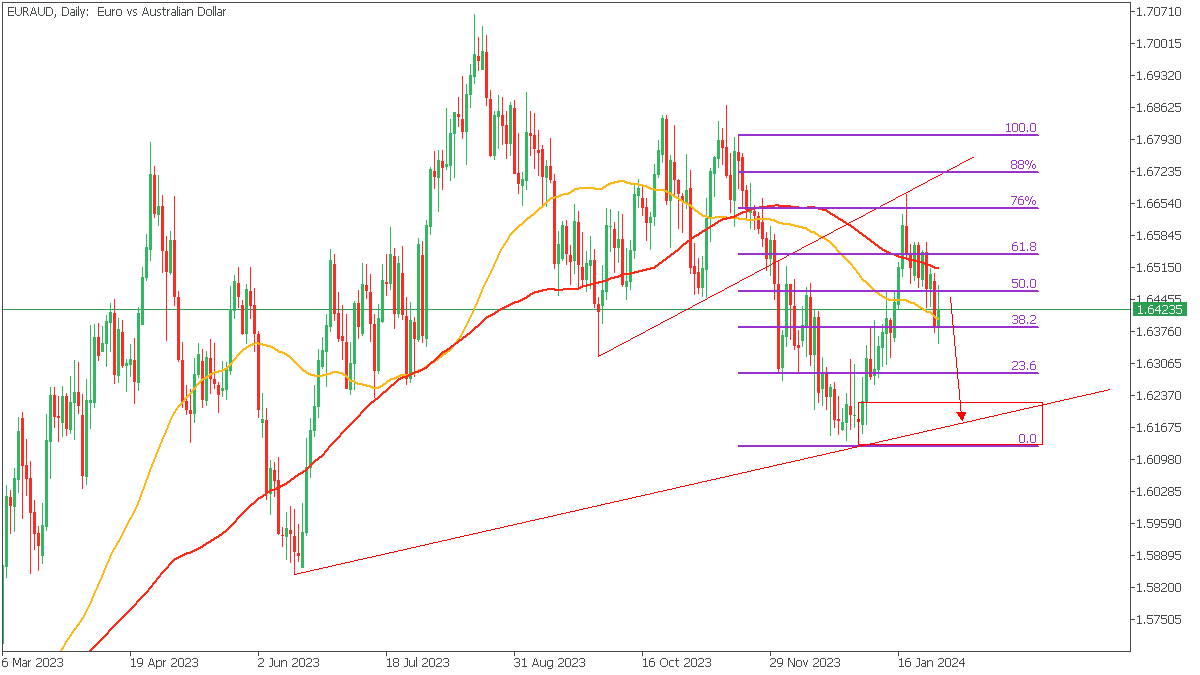
EURAUD - D1 Timeframe
EURAUD as seen on the chart recently got rejected from the intersection of the trendline resistance, and the 76% Fibonacci retracement level. The bearish array of the 100 and 50-day moving averages is another confluence in favour of the bearish sentiment. In this case, though, my target is not a moving average, rather, it is the demand zone that is seen overlapping the trendline support in the attached chart image.
Analyst’s Expectations:
- Direction: Bearish
- Target: 1.62309
- Invalidation: 1.65113
CONCLUSION
The trading of CFDs comes at a risk. Thus, to succeed, you have to manage risks properly. To avoid costly mistakes while you look to trade these opportunities, be sure to do your due diligence and manage your risk appropriately.
EURJPY: With Bullish Reversal and Target at Breakout of 161.00
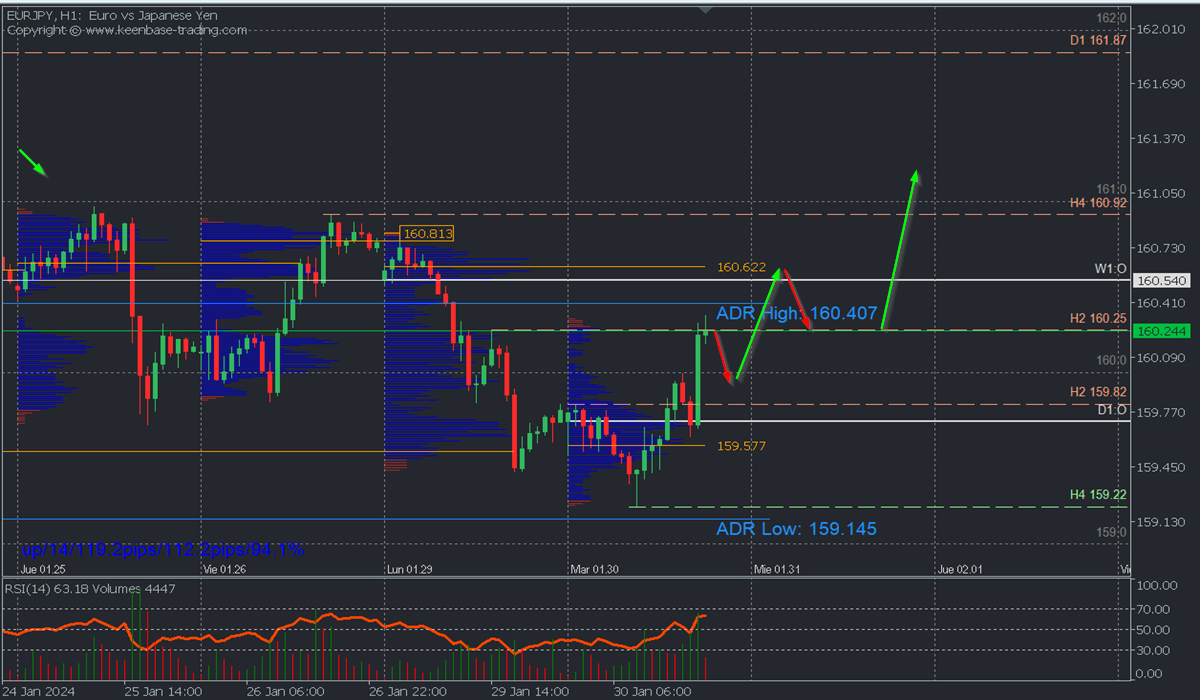
Bullish Scenario: Buying above 160.00 (expecting a pullback to this zone) with TP1: 160.62 (uncovered POC*), TP2: 160.81, and TP3: 161.00 on an intraday basis. It is recommended to set a stop loss (S.L.) below 159.82 or at least 1% of the account capital**.
Bearish Scenario: Selling below 160.25 with TP1: 160.00, TP2: 159.82, and upon its breakout TP3: 159.63. It is recommended to place a stop loss above 160.42, at least 1% of the account capital**. A trailing stop can be used.
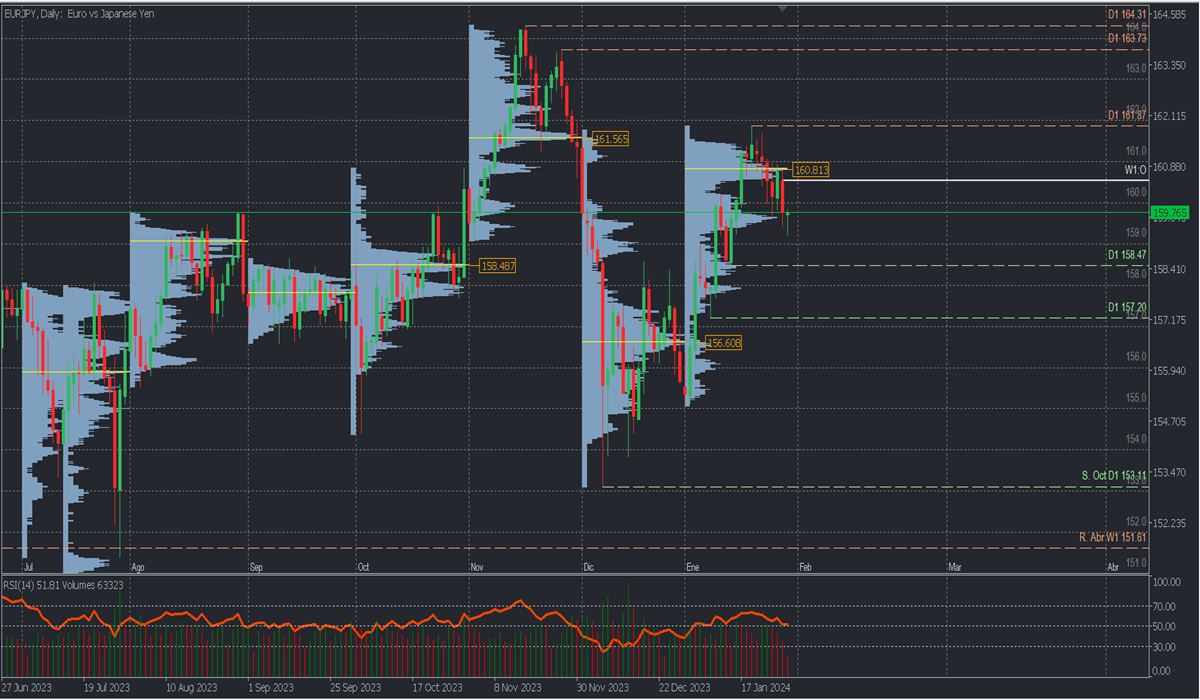
Analysis from a daily chart. Volume Profile and Structure.
EURJPY is one of the pairs that best reflects market risk sentiment, and we have seen the recovery throughout January, rising from the December buying zone between 155.00 and 156.60 to the November selling zone around 161.56.
Now, we observe that January is leaving an uncovered POC* at 160.81, which triggered the current downward movement to the next high-volume node at approximately 159.70. Thus, it can be expected that the next bullish retracement will return to the monthly POC, with two possible outcomes:
- The most likely scenario is a bullish breakout above 161, considering it would be the second time, following the rebound on Friday, January 26, indicating the possibility of prices renewing purchases, aiming to break January's resistance at 161.87 and continue bullish towards 163.00. This scenario seems more likely as the RSI stays positive, and bounces from 50, indicating a possible rebound, and the vertical volume has decreased during the last descent.
- The second scenario will be activated after a new price rebound from January's POC at 160.81 with a more extended correction to challenge the last significant support at 158.47, whose confirmed breakout will reverse the month's bullish trend. The bullish trend will remain active as long as this support is not broken.
Scenario from an H1 chart:
Prices show a bullish reversal pattern for the day, leaving support at 159.22 and a confirmed breakout with a second bullish movement from resistance at 159.82. Intraday buying targets of this reversal have been reached. Still, further bullish continuation can be expected in the coming days after the retracement towards 160.00 and 159.82, with a new surge towards the next selling zone at the uncovered POC* 160.62. Its breakout on a second touch brings us closer to January's macro POC at the macro selling zone of January, with the possibility of being broken and extending the advance above 161.00, confirming the bullish scenario proposed in the daily chart.
This bullish perspective will remain valid as long as the retracement does not break the buying zone that originated the intraday bullish reversal around 159.57, very close to the last significant support at 159.63. In that case, selling will be resumed.
*Uncovered POC: POC = Point of Control: It is the level or zone where the highest volume concentration occurred. If there was a downward movement from it previously, it is considered a selling zone and forms a resistance zone. Conversely, if there was a bullish impulse previously, it is considered a buying zone, usually located at lows, forming support zones.
**Consider this risk management suggestion
**It is very important that risk management is based on capital and traded volume. Therefore, a maximum risk of 1% of the capital is recommended. It is suggested to use risk management indicators like the Easy Order.
XAUUSD: Review of Recent Price Action
Gold prices, stable above $2,000 per ounce, commenced the week on an uptrend driven by a rallying US dollar and anticipation surrounding the upcoming Federal Reserve meeting. Analysts highlight that the market is keen on the Fed's signals for the coming months rather than immediate announcements. Gold touched $2,037 per ounce, holding near this level into Tuesday's session. Until the US jobs report, gold prices are likely to be influenced by the US dollar's performance and Treasury market movements. The US Dollar Index (DXY) reached 103.63, up 2.3% for the year. The strong dollar traditionally exerts downward pressure on dollar-denominated commodities.
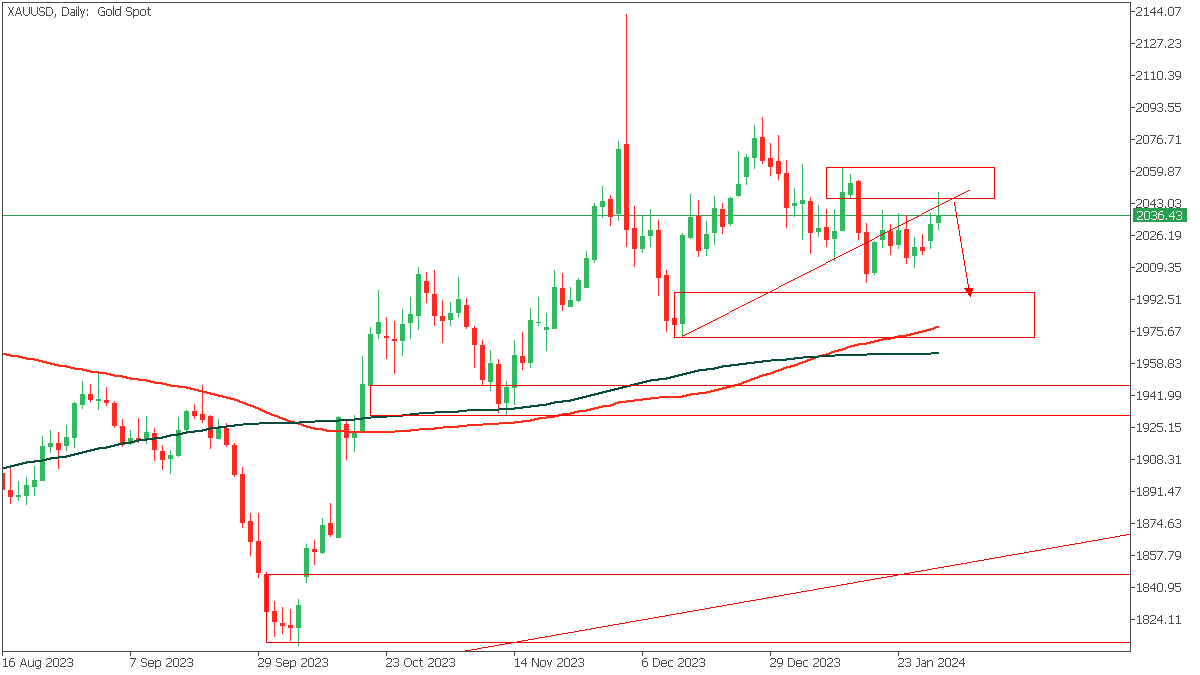
XAUUSD - D1 Timeframe
The last time we looked at XAUUSD, I mentioned that we were to wait for a break and retest of the trendline before picking a side; that seems to be happening right now. As seen on the chart, price broke below the trendline, then reached back up to retest the supply zone. Following such a move, price usually tends to continue in the direction of the breakout, so let’s see if the lower timeframe agrees with this sentiment.
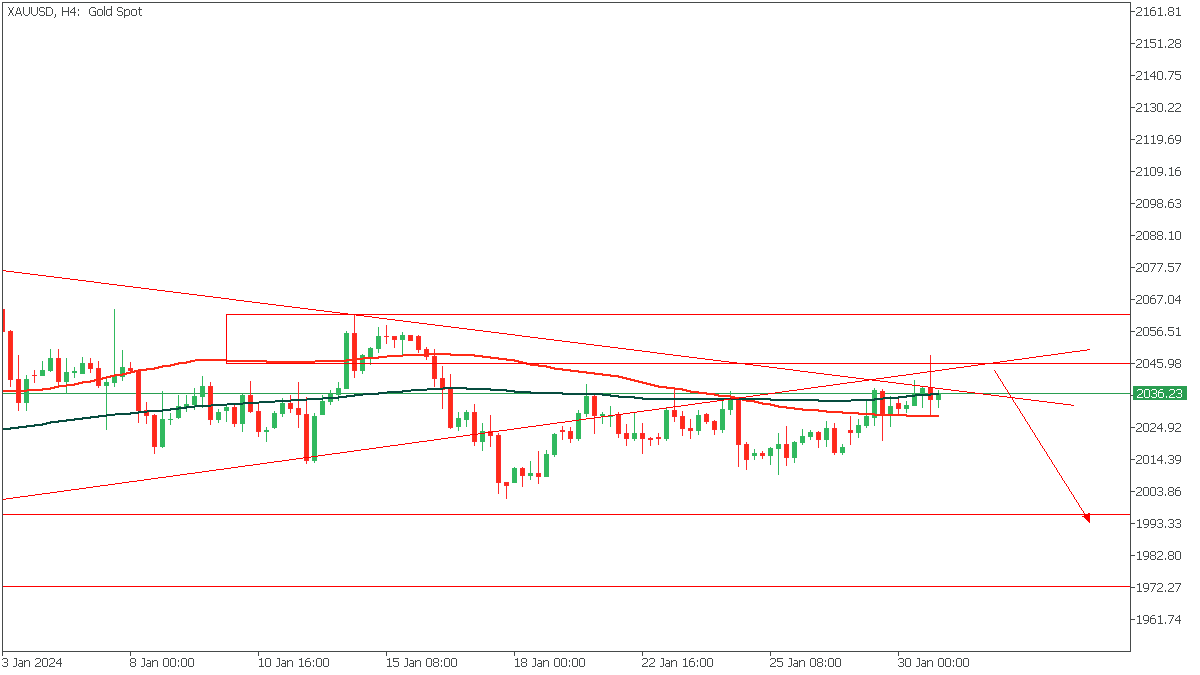
XAUUSD - H4 Timeframe
On the 4-hour timeframe of XAUUSD, price seems to have been rejected from the intersection of the two trendlines, as well as the supply zone. This means we have a total of 4 confluences if we include the bearish array of the moving averages. In line with the technical factors, my sentiment is bearish, until price presents a conflicting argument.
Analyst’s Expectations:
- Direction: Bearish
- Target: $1997.55
- Invalidation: $2045
CONCLUSION
The trading of CFDs comes at a risk. Thus, to succeed, you have to manage risks properly. To avoid costly mistakes while you look to trade these opportunities, be sure to do your due diligence and manage your risk appropriately.
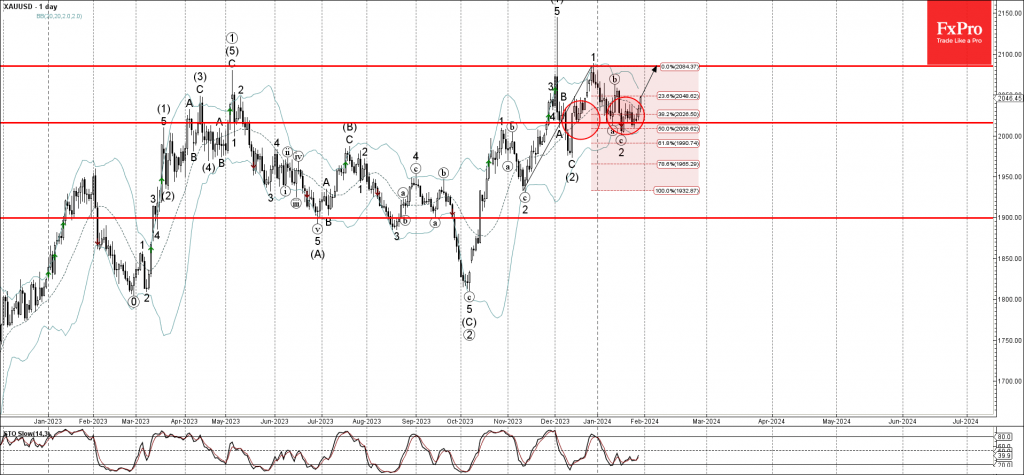
Gold Wave Analysis
- Gold reversed from resistance level 2016.00
- Likely to rise to resistance level 2085.00
Gold recently reversed up from the key resistance level 2016.00, which stopped the previous corrections (a) and 2.
The resistance level 2016.00 was strengthened by the lower daily Bollinger Band and by the 50% Fibonacci correction of the upward impulse from November.
Given the clear daily uptrend, Gold can be expected to rise further to the next resistance level 2085.00 (top of the previous impulse wave 1 from the end of December).
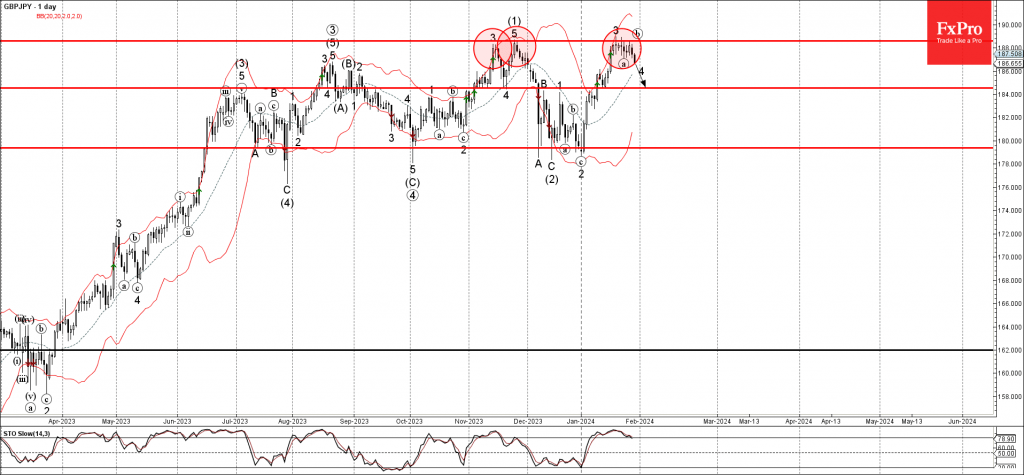
GBPJPY Wave Analysis
- GBPJPY reversed from resistance level 79.15
- Likely to fall to support level 184.50
GBPJPY currency pair recently reversed down from the key resistance level 188.55 which has been reversing the price from November, as can be seen below.
The downward reversal from the resistance level 188.55 started the active short term impulse wave c.
Given the strength of the resistance level 188.55 and the strong sterling sales seen across the FX markets today, GBPJPY currency pair can be expected to fall further to the next support level 184.50.
EUR/USD Technical Analysis Forecast Ahead of FOMC
This week is loaded with critical economic releases, keeping markets on edge. We have FOMC rate decisions, Nonfarm Payrolls, and inflation numbers, to name a few. This comes as investors remain divided on the FED’s rate cut path for 2024. Many analysts and investors see that the robust consumer spending and declining inflation are enough reasons for the FED to begin their rate cut cycle as early as March 2024. On the other hand, others are concerned about the risks, arguing that inflation may start rising again, derailing the robust consumer spending, thus suggesting that the first 25 bps rate cut may be better delayed till June or July 2024. The risks that may lead to inflation remaining high may arise for multiple reasons, including but not limited to shipping disruptions leading to higher costs and/or shortage of raw materials.
US inflation indicators continued their decline, bringing inflation closer to the FED’s target of 2%. According to the latest analyst surveys from Bloomberg Financials, the declining trend is expected to remain; the forecasted CPI (YoY%) for 2024 is 2.7% and 2.3% in 2025, down from its latest reading of 3.4% for 2023.
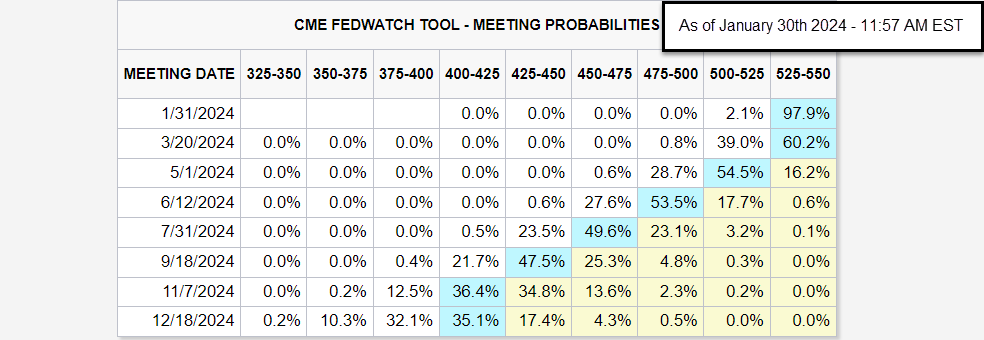
Source: CME Group
According to the most recent review of the CME FedWatch tool, 97.9% of market participants anticipate interest rates to remain at their current level of 525-550 for the meeting on January 31st, 2024, the expectation for a 25-basis points rate cut for the March 20th meeting is down from last week’s 50.0% to 39.0% today. As for the May 1st, 2024, Fed’s meeting, the percentage of two 25-basis points rate cuts dropped from 40.1% last week to 28.7%. The probability of two 25-basis points cuts for June 12th, 2024, FED’s meeting currently stands at 53.5%.
Daily Chart
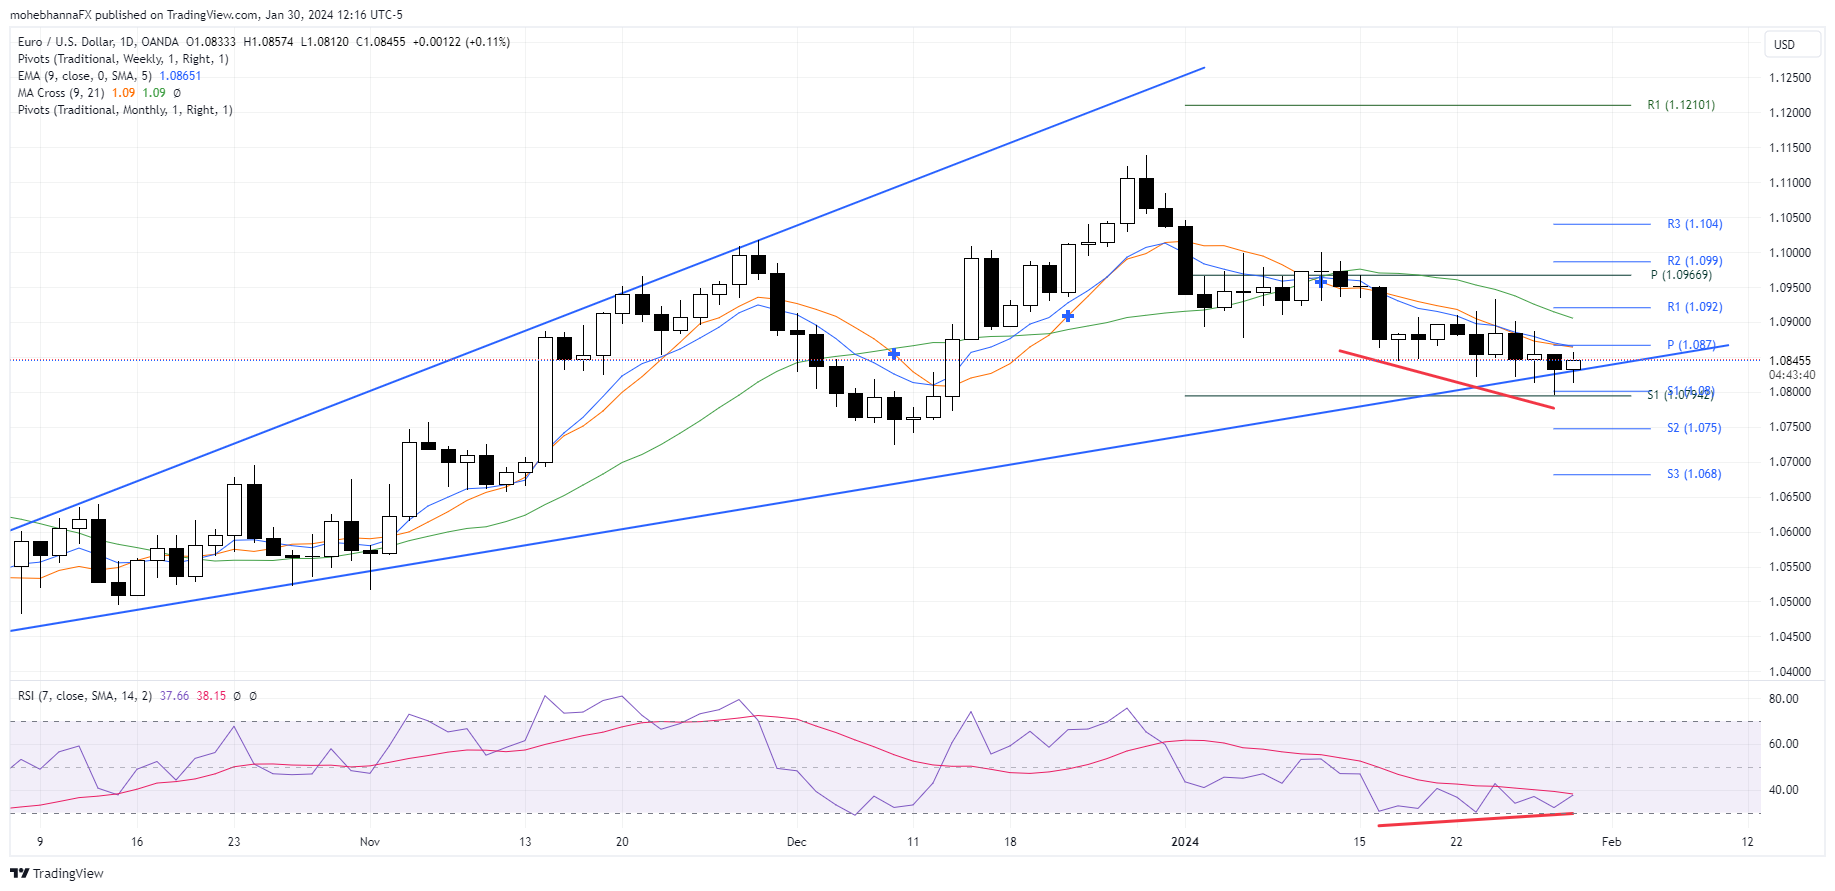
Source: TradingView
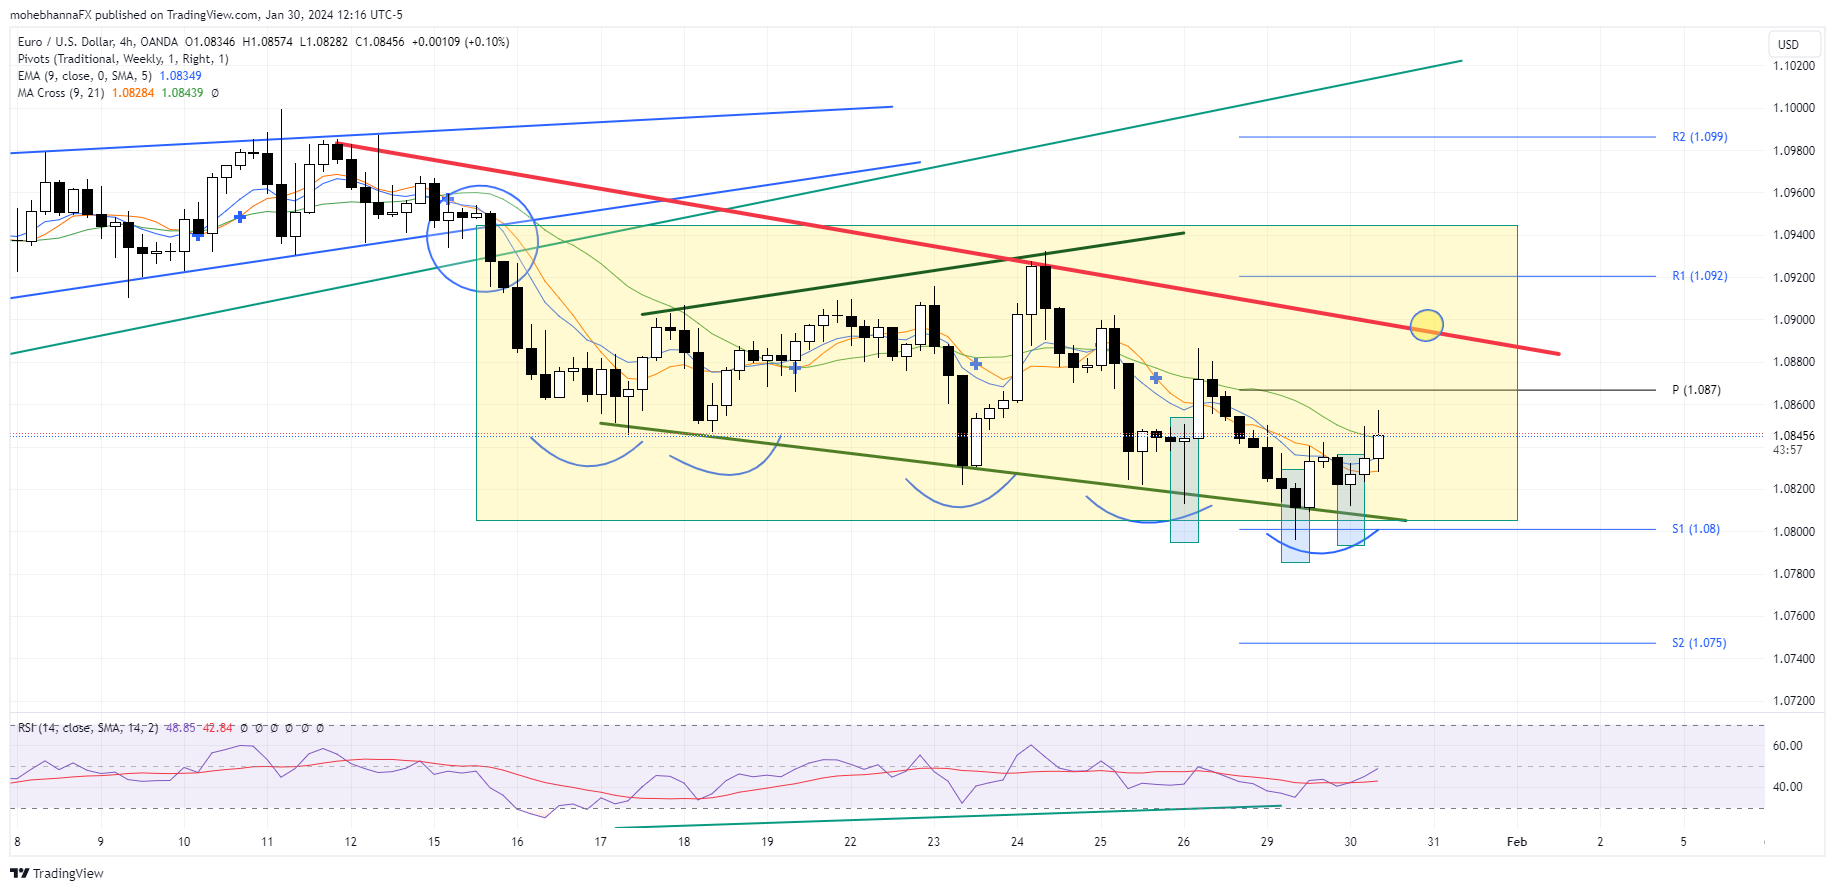
- Price is trading within an ascending widening pattern; price action previously found support along the lower pattern border.
- It is back to trade along the extension of the exact borderline, where it found support on January 23rd, 2024. It is important to remember that the widening formation is part of a more considerable flag formation on the monthly/weekly chart.
- Candlestick patterns around the support level reflect indecision as markets await the FOMC.
- A confluence of support lies below the price action, represented by the lower pattern borderline, monthly and weekly S1 standard calculation.
- The price action broke and closed below EMA9, MA9, and MA21.
- The fast EMA9 and the SMA9 currently represent a confluence of resistance above the price action; the two averages also intersect with the weekly pivot point.
- The chart (red lines) highlights a positive divergence between price action and RSI. Price action made lower lows later in the downtrend, while RSI plotted higher lows and remained near its oversold levels.
4-Hour Chart
Source: TradingView
- Price action broke out and closed (Circle) below the lower borders of a preexisting narrowing formation with no pullbacks, followed by an attempt to form a widening formation. (Dark green lines)
- Price action trades within a slightly widening range (Highlighted), forming lower lows as it moves within the pattern.
- A positive divergence between price action and RSI is identified on the chart as prices continue to form lower lows while RSI is plotting higher lows. (Green lines) This is the same positive divergence previously mentioned on the Daily chart.
- Multiple bottom formations are within the widening pattern, and the baseline (Red line) lies just above the weekly pivot point of 1.0870.
- The price broke and closed above its EMA9 and MA9. However, it has yet to close above its MA21, which may act as resistance in case of any upside price move.
- Multiple 4-hour candles found support above the weekly S1 calculation of 1.0800, including multiple hammer formations.
- If the multiple bottom formation works out, it may open the way for price action to trade back above the pattern baseline, which, if it happens, may also lead the price to the pullback level of the narrowing formation (Blue Circles).
- A confluence of resistance lies at the pullback level represented by the narrowing formation lower border (Blue line), an uptrend line that began in November 2023 (Light Green line), and R2 standard calculation.
- RSI remains neutral and below its moving average.
Nonfarm Payrolls to Decide Dollar’s Fortunes
- US employment data will hit the markets on Friday at 13:30 GMT
- Another solid jobs report expected, supported by early indicators
- If so, dollar could receive a boost as investors unwind rate cut bets
Dollar shines in early 2024
It's been a phenomenal start to 2024 for the US dollar, which has already risen more than 2% against a basket of major currencies as a streak of encouraging economic data reinstilled confidence in the US economy, forcing traders to dial back bets of immediate Fed rate cuts.
Economic growth has been faster than expected, empowered by strong consumption trends and heavy government spending. With the labor market also in good shape, it is becoming clearer that there's no urgency to slash interest rates. Inflation has been cooling off, but is still far too high for the Fed to declare victory.
In this light, market participants have started to scale back bets around how quickly and how deeply the Fed will cut rates this year. The prospect of a rate cut in March is now priced as a 50-50 coin toss, which puts even more emphasis on incoming data to decide whether the Fed will pull the trigger or not.
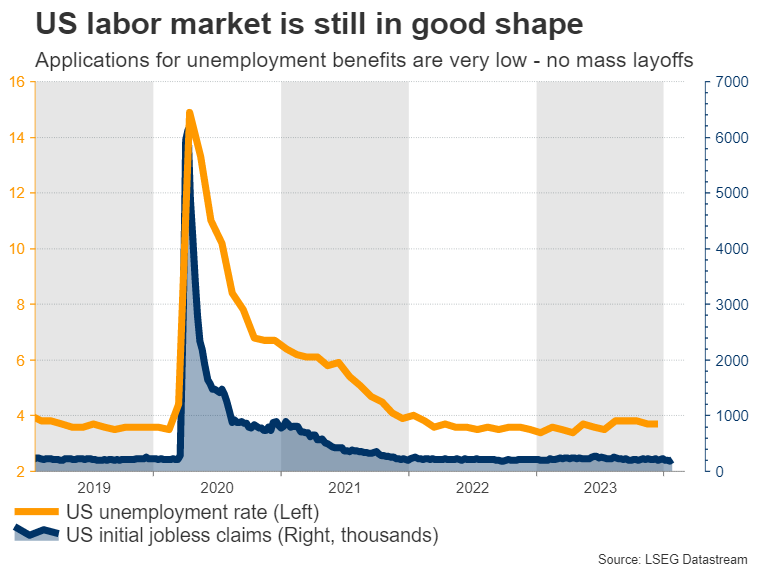
Labor market still tight
Turning to the upcoming data releases, the ball will get rolling on Wednesday with the private ADP employment report for January alongside the employment cost index for Q4, which measures wage growth.
On the same day, Fed officials will deliver their interest rate decision. A full preview of this event can be found here. Expectations of any policy changes are low, so investors will focus mostly on the commentary by Chairman Powell about whether rate cuts are on the horizon. The ISM manufacturing survey for January will follow on Thursday.
Then on Friday, the spotlight will fall on the latest employment report. Nonfarm payrolls are projected to have risen by 180k in January, slightly less than the 216k recorded in the previous month but still a solid number overall. The unemployment rate is forecast to have ticked up to 3.8%, while wage growth as measured by average hourly earnings is seen holding steady at 4.1% in yearly terms.
As for any surprises, early indicators point to another decent jobs report. Applications for unemployment benefits fell sharply in January, so there were no signs of mass layoffs in the US economy. Similarly, the number of advance layoffs filed under the WARN Act, which forces big businesses to notify workers about mass firings in the next two months, remained very low.
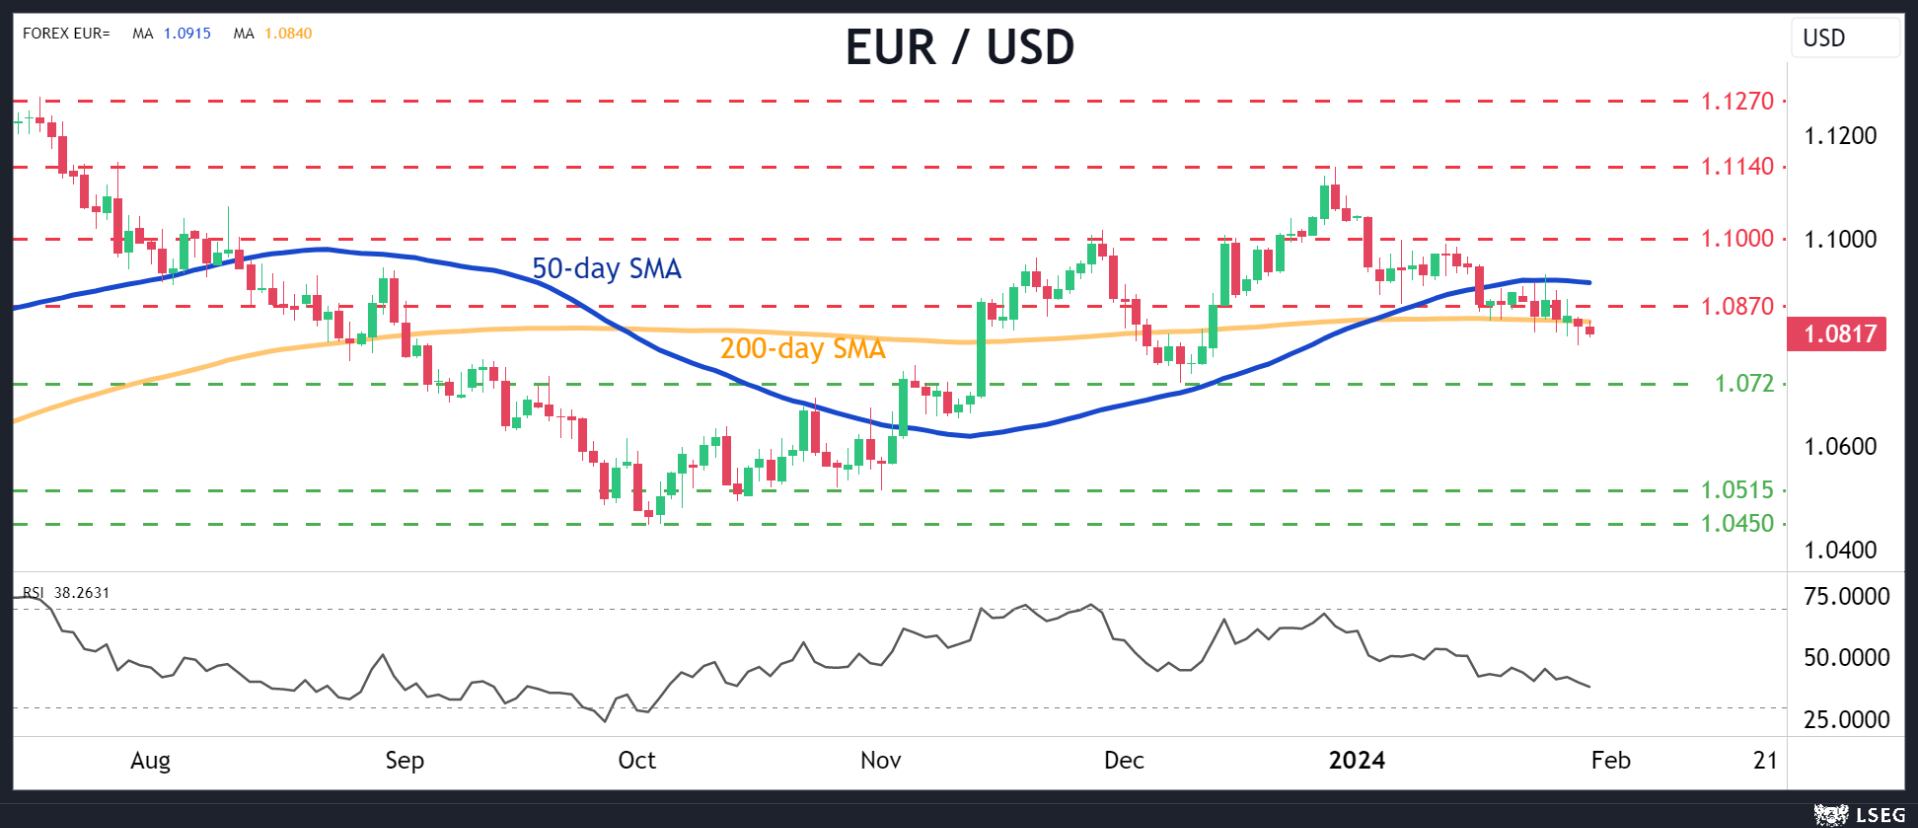
In the markets, an employment report that tops estimates could lead to a further unwinding of Fed rate-cut bets, which would likely benefit the dollar. Looking at the euro/dollar chart, such an outcome might push the pair lower, perhaps towards the 1.0720 support region.
On the other hand, a dataset that misses expectations could fuel the opposite reaction and propel euro/dollar higher, with the first barrier on the upside likely to be the congested 1.0870 zone.
Dollar remains attractive overall
In the bigger picture, the outlook for the dollar still appears positive. In terms of growth, the US economy is much stronger than other major regions like the Eurozone, which barely avoided falling into a technical recession last year.
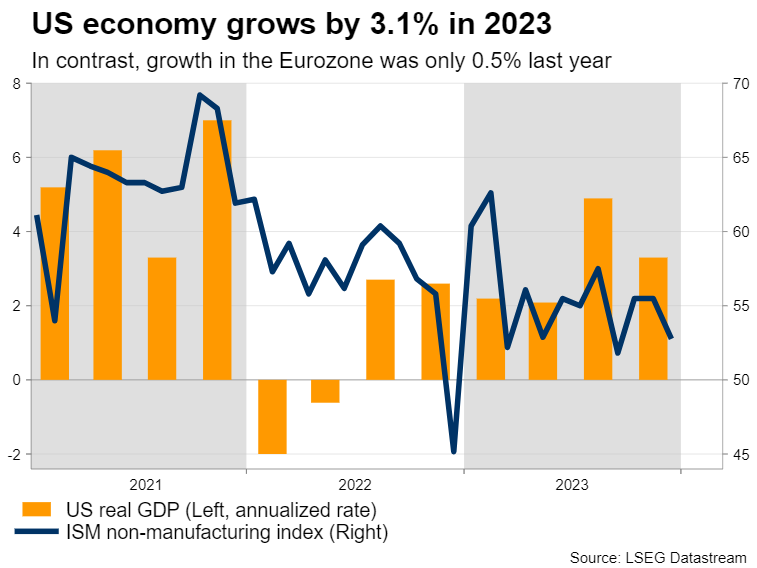
Markets are currently pricing an equal amount of rate cuts in the US and Eurozone this year. However, with growth differentials clearly in favor of the US, there's a strong possibility the Fed will cut rates at a slower pace than the European Central Bank, boosting the dollar through the interest rate channel.
One element that has prevented the dollar from appreciating significantly in this environment has been the explosive rally in stock markets, which has dampened demand for safe haven assets. That said, this dynamic cuts both ways. If the equity market loses steam or suffers a correction, it might become easier for the dollar to advance, as risk appetite deteriorates.
Chinese PMIs in the Spotlight; Australian Inflation Key for Next Week’s RBA
- Quarterly Australian inflation on Wednesday; could surprise on the upside
- Chinese PMI surveys also on Wednesday; Chinese stock indices remains under pressure
- Aussie’s outperformance against the US dollar depends on stronger data releases
Market focusing on the Fed and US labour data
Amidst a week monopolized by Wednesday’s Fed meeting and Friday’s US labour market statistics, which could play a crucial role in the market’s short-term performance, the calendar also includes important data releases from both Australia and China. Especially the latter remains the big elephant in the room regarding its 2024 economic growth.
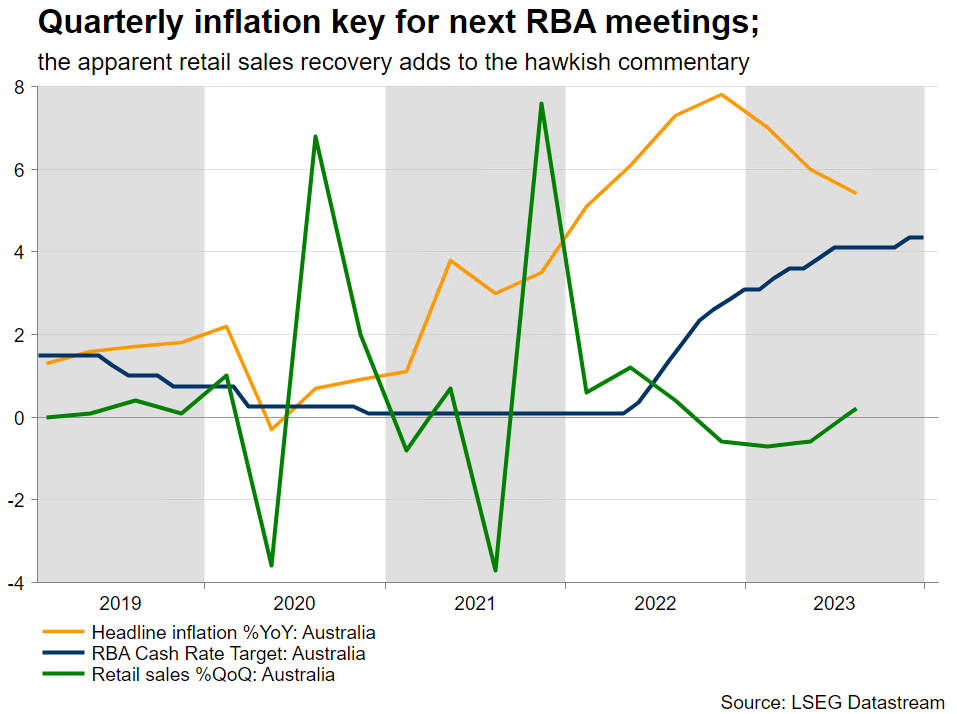
Aussie inflation in the spotlight
Starting with Down Under and the very important inflation report for the fourth quarter of 2023 will be released on Wednesday at 00.30 GMT. The Reserve Bank of Australia was the last one to hike by 25bps in November 2023 and has since maintained its hawkish stance. The December gathering kept the door open to further rate hikes, with the hawkish bias confirmed by the eye-opening minutes. More specifically, the comment that the “Board noted RBA staff forecast had inflation returning to top of band by end 2025 rather than midpoint” has thrown a spanner in the works for RBA doves. Nevertheless, the market is currently fully pricing in a 25bps rate cut by September 2024.
Like other central banks, the RBA remains data-driven. On Wednesday, the headline inflation is expected to show a 0.8% quarter-on-quarter change with the annual figure dropping to 4.3%, the lowest print since fourth quarter of 2021; the RBA’s favourite trimmed mean CPI is also forecast to record a similar slowdown.
Slim chance of an inflation upside surprise
With the October and November monthly CPI prints printing at 4.9% and 4.3% respectively, the December inflation figure has to slow down to 3.8% in order to confirm the market’s forecasts for the quarterly figure. However, considering that December inflation surprised on the upside across the major economies, there is a non-negligible chance of an upside surprise on Wednesday. Such an outcome would limit the RBA's options at next week's meeting.
China economic issues remain unaddressed
Turning to China, the January PMI surveys could enlighten the market on the economic undercurrents. Despite the numerous support programmes announced during 2023, the market remains unconvinced about their effectiveness. Other key economies like Australia and Germany are pinning their 2024 growth hopes on China overcoming its difficulties.
With the Chinese stock market remaining under severe selling pressure, the PBoC was forced to announce a 50bps Reserve requirement ratio (RRR) effective, from February 5, and has essentially also been enforcing a short sale ban. The Chinese authorities are trying to reverse the current market pessimism and are hoping that positive news from the economy will start to hit the airwaves soon. In addition, this RRR change offers significant support to domestic banks and opens the door for further announcements, possibly an MLF rate cut – the interest rate that banks borrow funds from the PBoC for up to one year - during the first quarter of 2024.
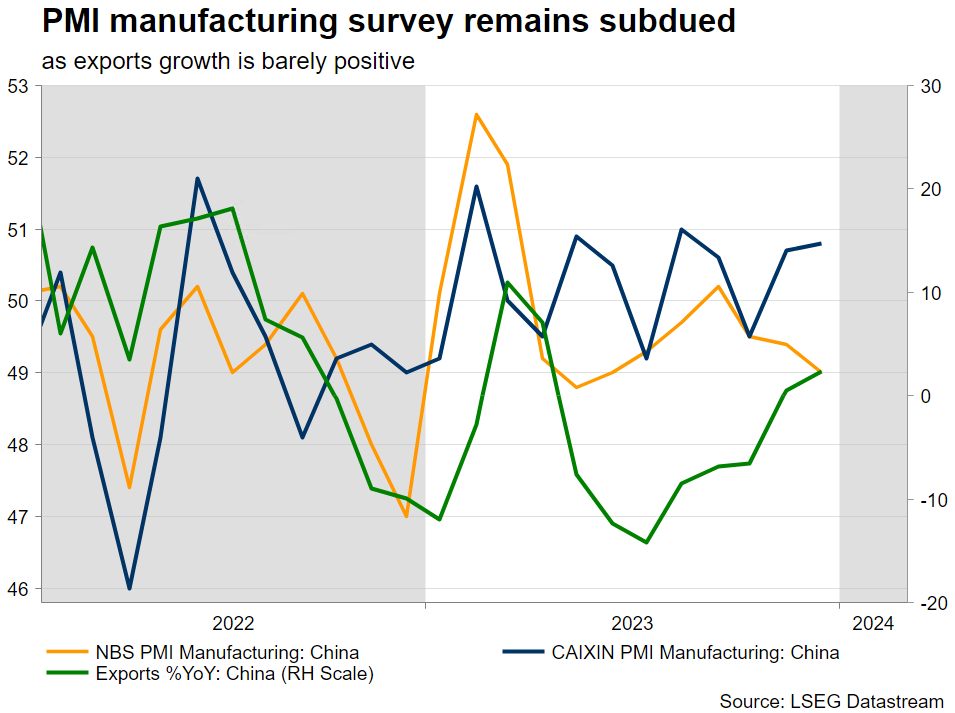
PMI surveys on the menu
Only time will tell if these measures prove successful as the market wants to see improving economic growth data to feel more confident. In this context the national PMI surveys are seen edging slightly higher with the manufacturing component remaining below 50 for the fourth consecutive month. On the other hand, the Caixin PMI manufacturing survey is expected to drop to 50.6. It is worth noting that the NBS survey has a larger poll and focuses mostly on state-owned firms while the private Caixin survey covers mostly private and export-oriented firms.
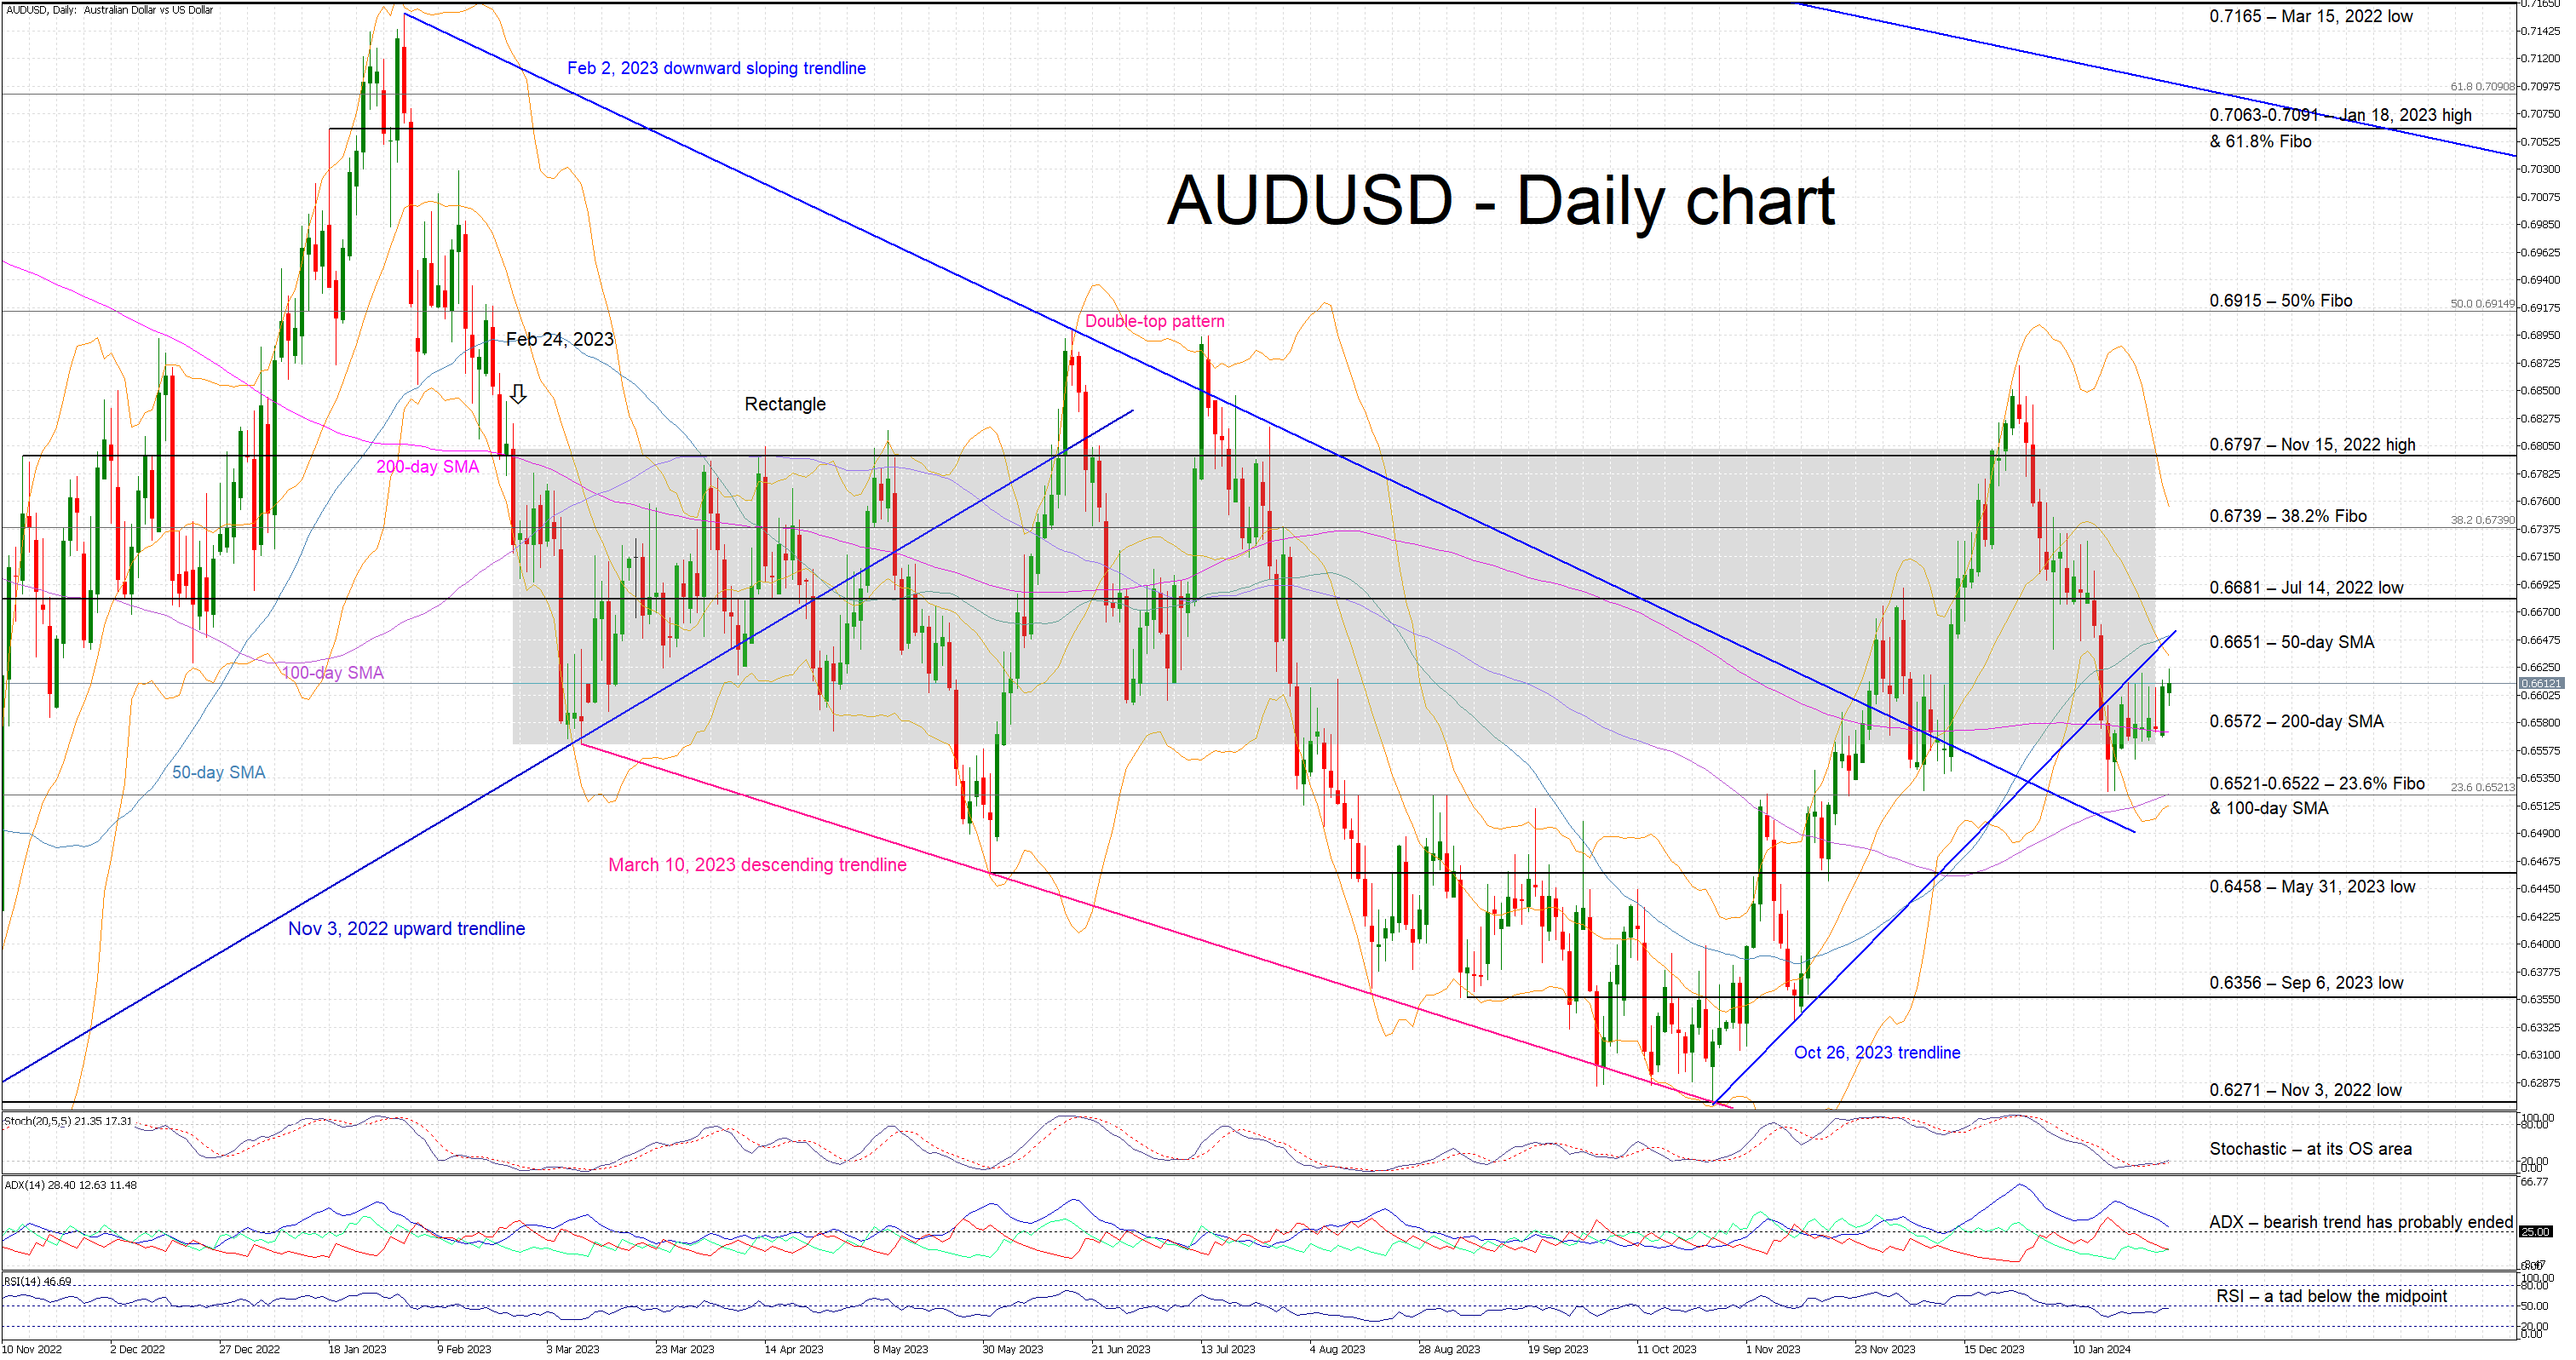
Aussie would enjoy stronger data
This week’s events could finally allow the aussie-US dollar pair to escape its recent range trading. It remains at the lower boundary of the rectangle that defined the price action during most of 2023 and it is hovering above its 200-day simple moving average. A strong set of data releases in both Australia and China could push aussie-dollar towards the 0.6651 level. On the flip side, a negative set of data, especially in China, could open the door for a protracted correction below the busy 0.6521-0.6522 area.