Sample Category Title
AUD/USD Daily Report
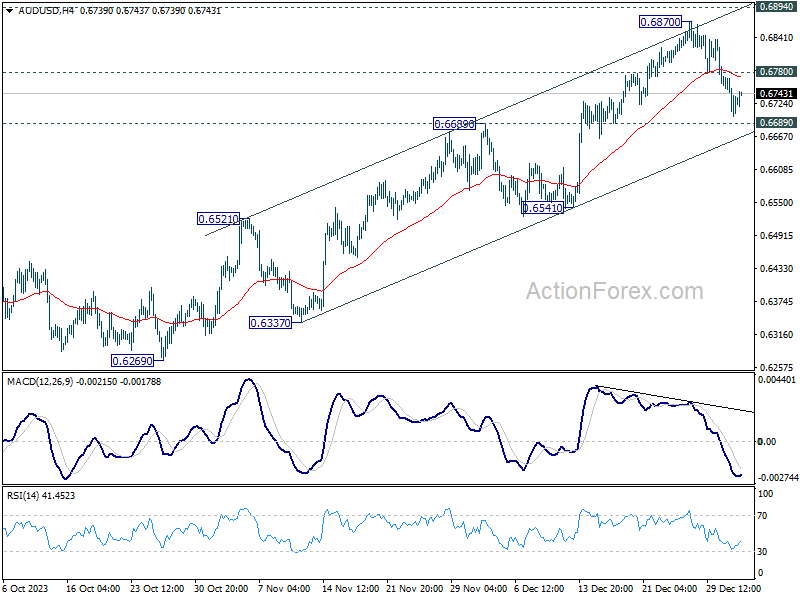
Daily Pivots: (S1) 0.6698; (P) 0.6735; (R1) 0.6767; More...
Intraday bias in AUD/USD remains mildly on the downside at this point. Pull back from 0.6870 short term top is in progress for 0.6689 resistance turned support, and possibly below. But strong support would be seen from channel support (now at 0.6663) to bring rebound. On the upside, above 0.6780 minor resistance will turn bias back to the upside for retesting 0.6870 instead.
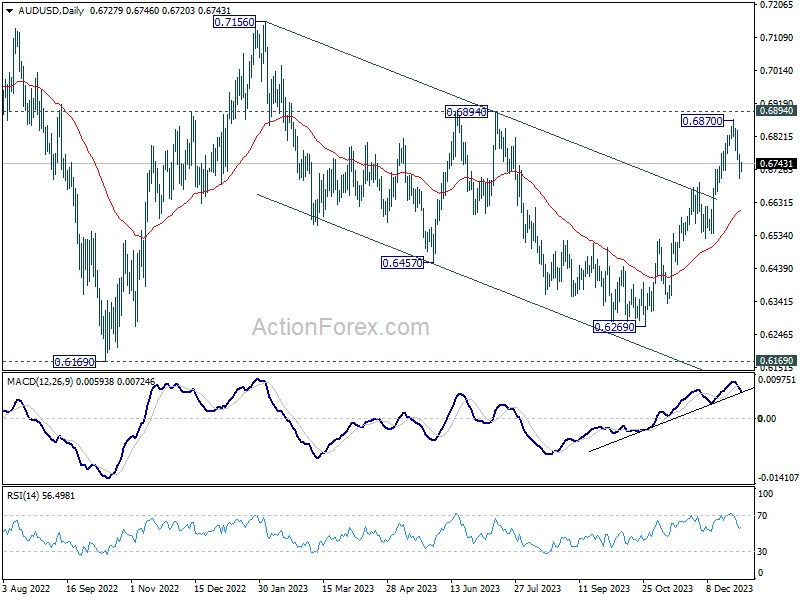
In the bigger picture, there is no confirmation that down trend from 0.8006 (2021 high) has completed. Price actions from 0.6169 (2022 low) could be just a medium term corrective pattern. Rise from 0.6269 is seen as the third leg of the pattern. For now, range trading should be seen between 0.6169 and 0.7156 (2023 high), until further developments.
Investors Tread Carefully Following FOMC Minutes, Awaiting Key US Job Reports
Major US stock indexes closed lower overnight, after FOMC minutes revealed Fed might be hesitance to lower interest rates soon. Notably, the likelihood of a March interest rate cut, as inferred from Fed funds futures, dipped below the 70% market following the release of the minutes. Dollar, however, is encountering challenges in gaining further momentum in its near term rebound. This struggle is partly attributed to 10-year Treasury yield's rejection by 4% level. Investors are now turning their attention to today's ADP employment data, though significant market moves are more likely to be reserved for tomorrow's non-farm payroll report.
In the broader currency market, Japanese Yen is currently the weakest performer for the week. BoJ Governor Kazuo Ueda reiterated today the importance of a "virtuous cycle" between wages and prices in his speech. However, the recent devastating earthquake in Japan has led some economists to pull back their expectations of a January rate hike, as BoJ may need additional time to assess the earthquake's economic impact.
Euro and Australian Dollar are also among the weaker performers. Euro's immediate focus is on the German CPI data due today and, more significantly, Eurozone CPI flash data expected tomorrow. Meanwhile, Australian Dollar has not found substantial support despite positive data from China's services sector. Conversely, Pound is showing resilience, partly supported by buying against Euro. Canadian Dollar also maintains a firm position, while Swiss Franc displays mixed performance.
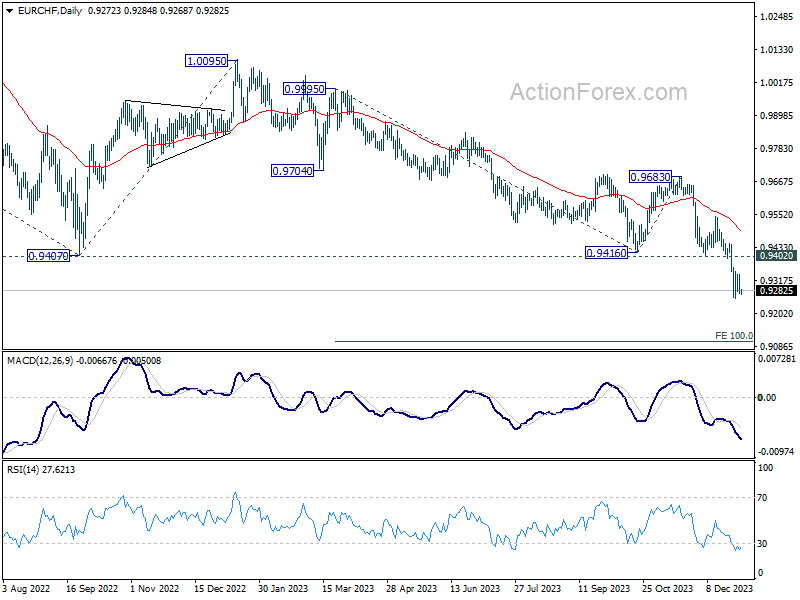
Technically, EUR/CHF would be a focus for the rest of the week with Eurozone CPI flash featured. Price actions from 0.9252 are seen as a consolidation pattern only. While another recovery cannot be ruled out, outlook will stay bearish as long as 0.9402 support turned resistance holds. Break of 0.9252 will resume larger down trend to 100% projection of 0.9995 to 0.9416 from 0.9683 at 0.9104 next.
In Asia, at the time of writing, Nikkei is down -0.57%. Hong Kong HSI is down -0.62%. China Shanghai SSE is down -0.87%. Singapore Strait Times is down -1.18%. Japan 10-year JGB yield is down -0.0060 at 0.620. Overnight, DOW fell -0.76%. S&P 500 fell -0.80%. NASDAQ fell -1.18%. 10-year yield fell -0.039 to 3.907.
FOMC minutes see dual-mandate dilemma ahead
Minutes from FOMC's December meeting indicate that some participants are concerned about the risks of stalling progress in bringing down inflation to target. Simultaneously, there is apprehension about downside risks to the economy resulting from "overly restrictive monetary policy". Hence, a few suggested that Fed could "face a trade off between its dual-mandate goals in the period ahead".
Significantly, the minutes indicate a consensus among participants that, considering the improved inflation outlooks, a lower target range for federal funds rate would likely be appropriate by the end of 2024. However, they also recognized "an unusually elevated degree of uncertainty" in their economic outlooks, leaving room for the possibility that economic developments might necessitate further rate increases or maintaining the current target range longer than currently anticipated.
The emphasis in the discussions was on the need for a "careful, data-dependent approach" to policy decisions. The minutes also highlighted that "it would be appropriate for policy to remain at a restrictive stance for some time," underlining the commitment to ensure that inflation is sustainably moving towards the Committee's objective.
Participants also discussed risk-management considerations for future policy decisions. They acknowledged that while upside risks to inflation have decreased, inflation is "still well above the Committee's longer-run goal." Moreover, the minutes reflected a concern about the duration for which a restrictive monetary policy would be necessary, pointing to "downside risks to the economy" associated with such a stance. A few participants raised the possibility of a trade-off between the Fed's dual-mandate goals.
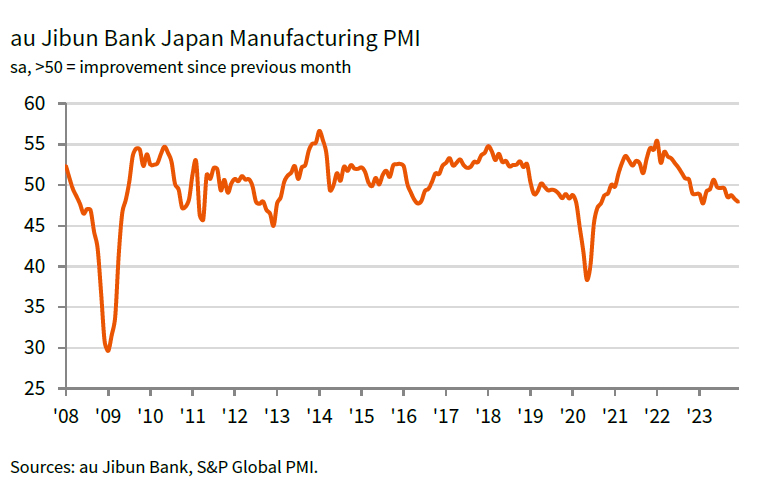
Japan's PMI manufacturing finalized at 47.9, deeper contraction and higher input inflation
Japan's PMI Manufacturing was finalized at 47.9 in December, down from November's 48.3, marking the most significant sector contraction since February 2023. S&P Global reports that this downturn was characterized by notable declines in both production and new orders, alongside rise in input price inflation. Despite these challenges, there was an unexpected increase in business confidence, reaching a five-month high.
Paul Smith from S&P Global Market Intelligence noted, "Market uncertainty led to reduced orders and output, especially from key export clients in China, Europe, and North America." He also mentioned specific struggles in the electronics sector and a general lack of investment.
However, Smith acknowledged increased cost pressures, with input price inflation at a three-month high due to more expensive raw materials, particularly imports.
Looking ahead, Smith conveyed optimism among Japanese manufacturers, expecting an end to client destocking and predicting that new product launches will boost production in 2024.
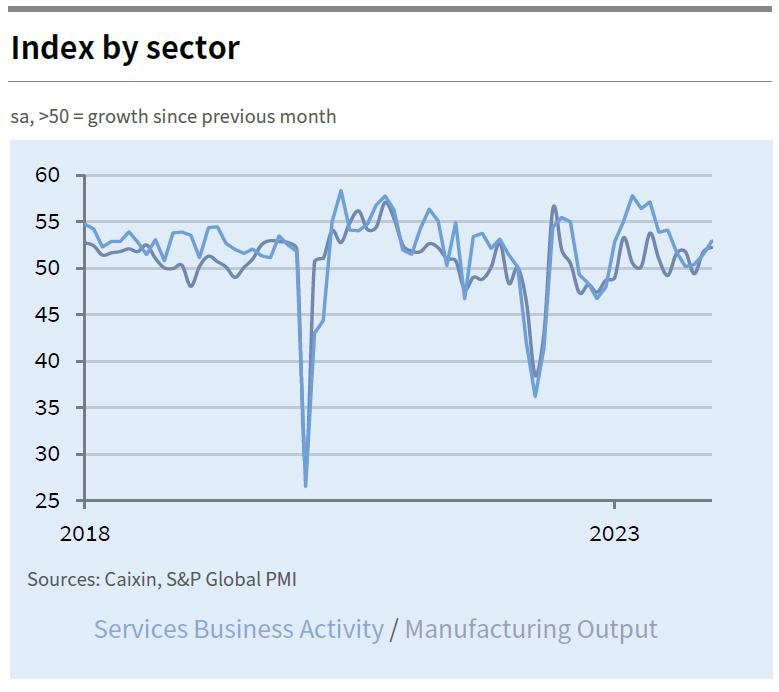
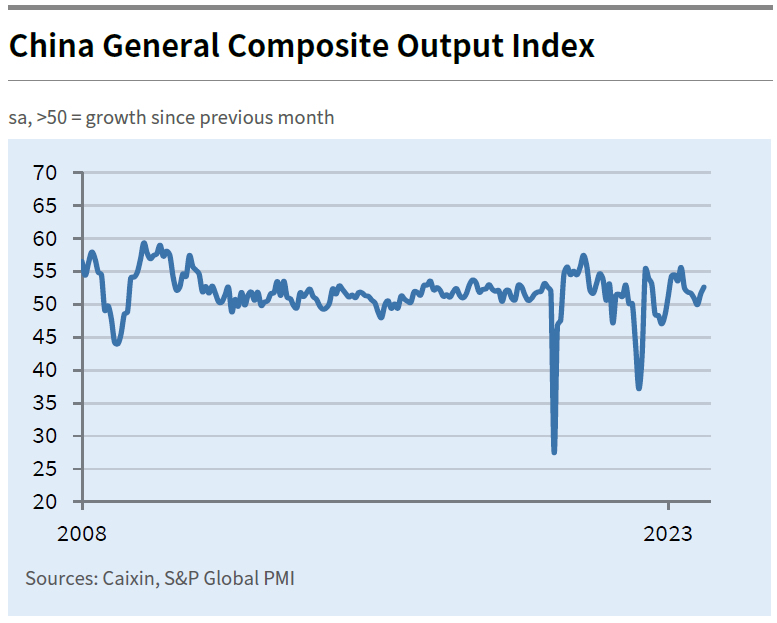
China's Caixin PMI services rises to 52.9, businesses express confidence
China's Caixin PMI Services marked a significant rise to 52.9 in December from 51.5, achieving its highest level since July. Concurrently, PMI Composite, which combines both manufacturing and services, also saw an improvement, climbing from 51.6 to 52.6.
Wang Zhe, Senior Economist at Caixin Insight Group, noted that businesses are "expressing confidence" in an improved economic outlook for the coming year. This optimism is reflected in the business expectations gauge, which, despite being "about 3 points below" the 2023 average for the first 11 months, still aligns with the "historical mean" from 2012 to 2022.
Looking ahead
Germany CPI flash, Eurozone PMI services final and UK PMI services final will be released in European session. Later in the day, main focus will be on US ADP employment and jobless claims.
AUD/USD Daily Report
Daily Pivots: (S1) 0.6698; (P) 0.6735; (R1) 0.6767; More...
Intraday bias in AUD/USD remains mildly on the downside at this point. Pull back from 0.6870 short term top is in progress for 0.6689 resistance turned support, and possibly below. But strong support would be seen from channel support (now at 0.6663) to bring rebound. On the upside, above 0.6780 minor resistance will turn bias back to the upside for retesting 0.6870 instead.
In the bigger picture, there is no confirmation that down trend from 0.8006 (2021 high) has completed. Price actions from 0.6169 (2022 low) could be just a medium term corrective pattern. Rise from 0.6269 is seen as the third leg of the pattern. For now, range trading should be seen between 0.6169 and 0.7156 (2023 high), until further developments.
Economic Indicators Update
| GMT | Ccy | Events | Actual | Forecast | Previous | Revised |
|---|---|---|---|---|---|---|
| 00:30 | JPY | Manufacturing PMI Dec F | 47.9 | 47.7 | 47.7 | |
| 01:45 | CNY | Caixin Services PMI Dec | 52.9 | 51.6 | 51.5 | |
| 08:45 | EUR | Italy Services PMI Dec | 49.8 | 49.5 | ||
| 08:50 | EUR | France Services PMI Dec F | 44.3 | 44.3 | ||
| 08:55 | EUR | Germany Services PMI Dec F | 48.4 | 48.4 | ||
| 09:00 | EUR | Eurozone Services PMI Dec F | 48.1 | 48.1 | ||
| 09:30 | GBP | Services PMI Dec F | 52.7 | 52.7 | ||
| 09:30 | GBP | Mortgage Approvals Nov | 48K | 47K | ||
| 09:30 | GBP | M4 Money Supply M/M Nov | 0.20% | 0.30% | ||
| 12:30 | USD | Challenger Job Cuts Y/Y Dec | -40.80% | |||
| 13:00 | EUR | Germany CPI M/M Dec P | 0.20% | -0.40% | ||
| 13:00 | EUR | Germany CPI Y/Y Dec P | 3.80% | 3.20% | ||
| 13:15 | USD | ADP Employment Change Dec | 130K | 103K | ||
| 13:30 | USD | Initial Jobless Claims (Dec 29) | 210K | 218K | ||
| 14:45 | USD | Services PMI Dec F | 51.3 | 51.3 | ||
| 15:30 | USD | Natural Gas Storage | -33B | -87B | ||
| 16:00 | USD | Crude Oil Inventories | -3.2M | -7.1M |
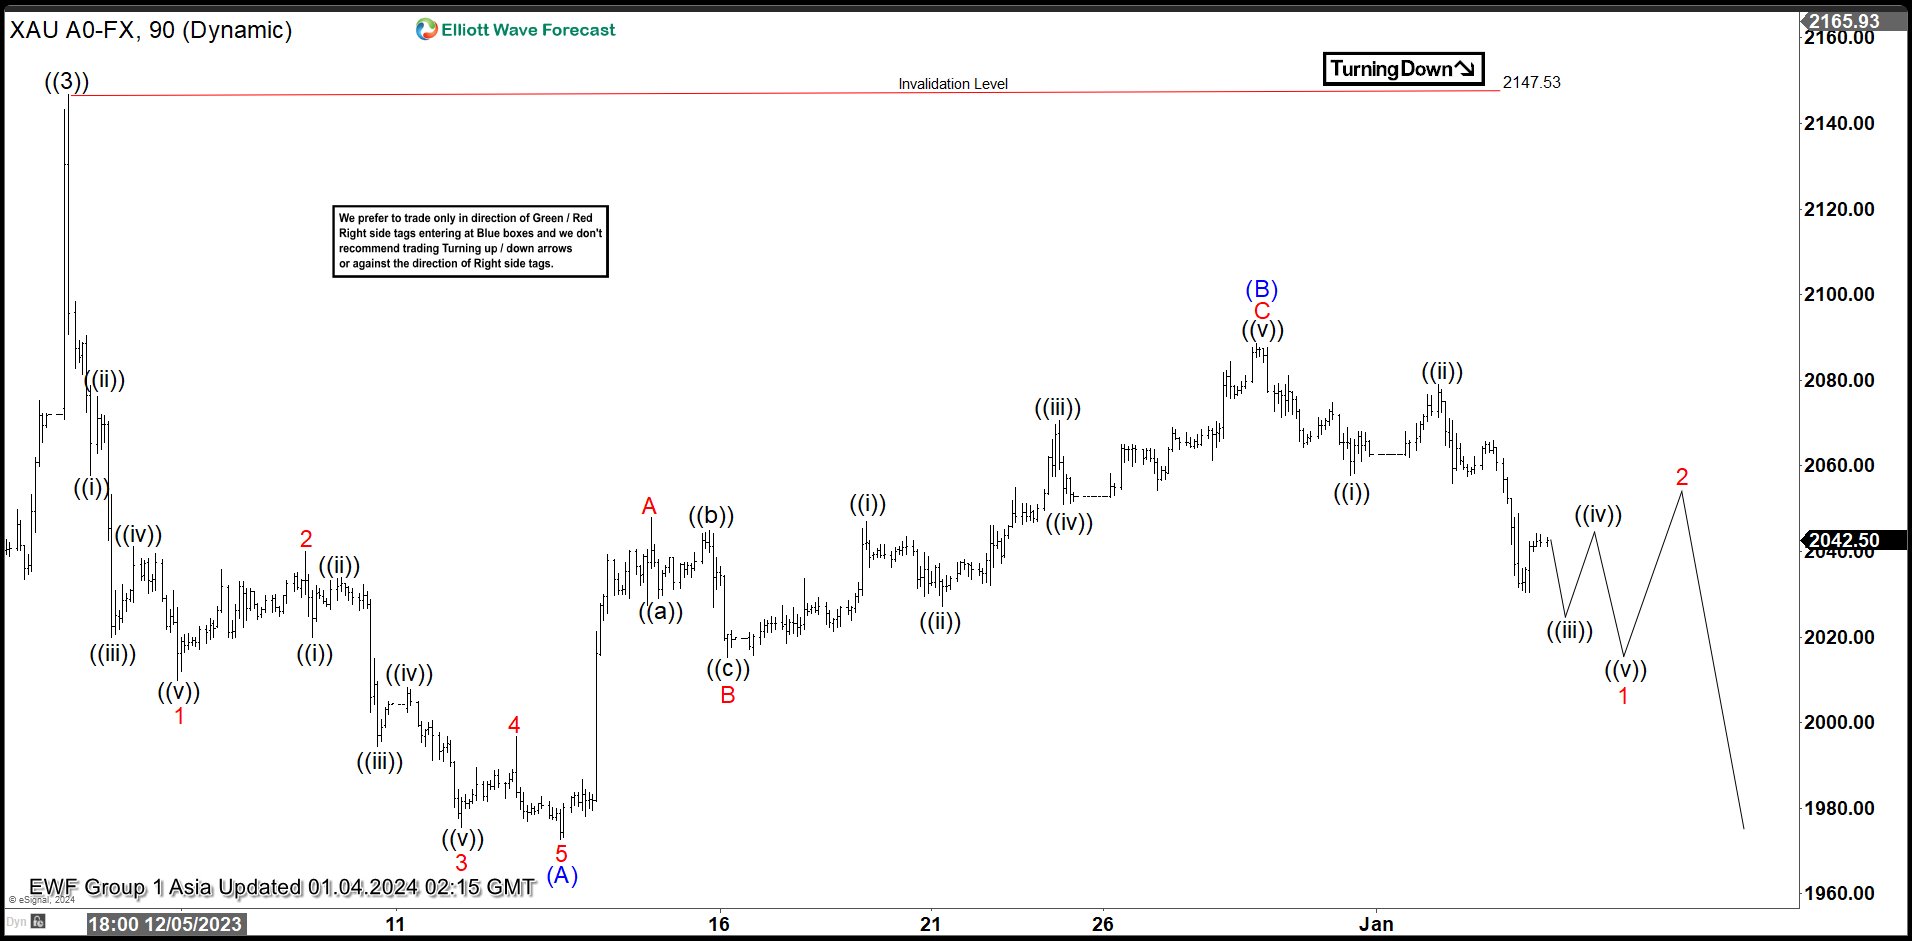
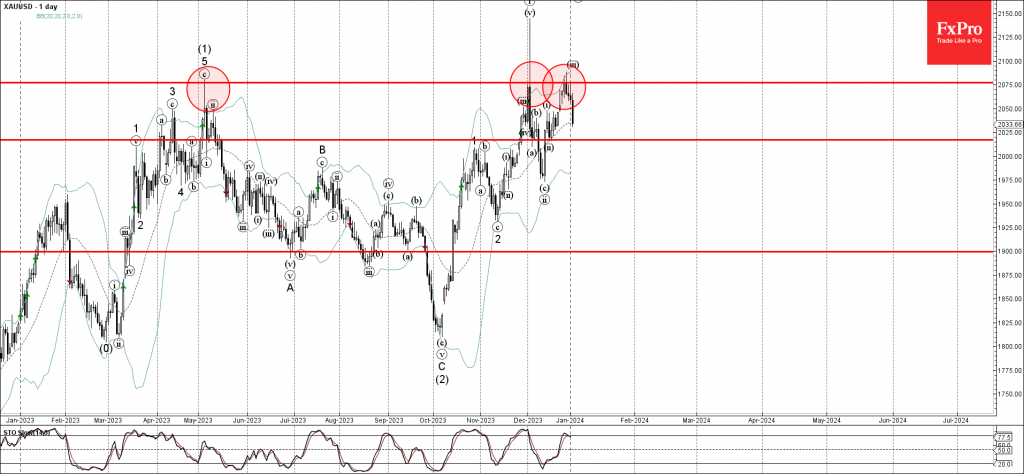
Gold (XAUUSD) Might See Larger Degree Correction
GOLD (XAUUSD) shows a bullish sequence from September 2022 low favoring further upside. The rally higher from 09.28.2022 is unfolding as Elliott Wave leading diagonal. Up from 09.28.2022 low, wave ((1)) ended at 2081.82 and pullback in wave ((2)) ended at 1810.58 low. Wave ((3)) finished at 2147.53 high as the 1 hour chart below shows. Pullback as wave ((4)) is currently in progress with internal subdivision of (A), (B) and (C).
Down from ((3)), wave (A) built an impulse structure. Wave 1 ended 2009.78 low and bounce in three swings completed wave 2 at 2039.93. Wave 3 ended at 1975.50, wave 4 ended at 1996.73, and final wave 5 lower ended at 1972.60. This completed wave (A) in higher degree. Wave (B) pullback developed an internal subdivision as a zig zag. Up from wave (A), wave A ended at 2047.91, wave B ended at 2015.30, and wave C ended at 2088.48. This completed wave (B) and gold turned lower. Expect the metal to continue to the downside in wave (C) to break 1972.60 low to confirm the view of the wave ((4)) correction. As far as pivot at 2147 high stays intact, expect rally to fail for further downside.
Gold (XAUUSD) 90 Minutes Elliott Wave Chart
Gold (XAUUSD) Elliott Wave Video
https://www.youtube.com/watch?v=SW04e2kjna0
Technical Outlook and Review
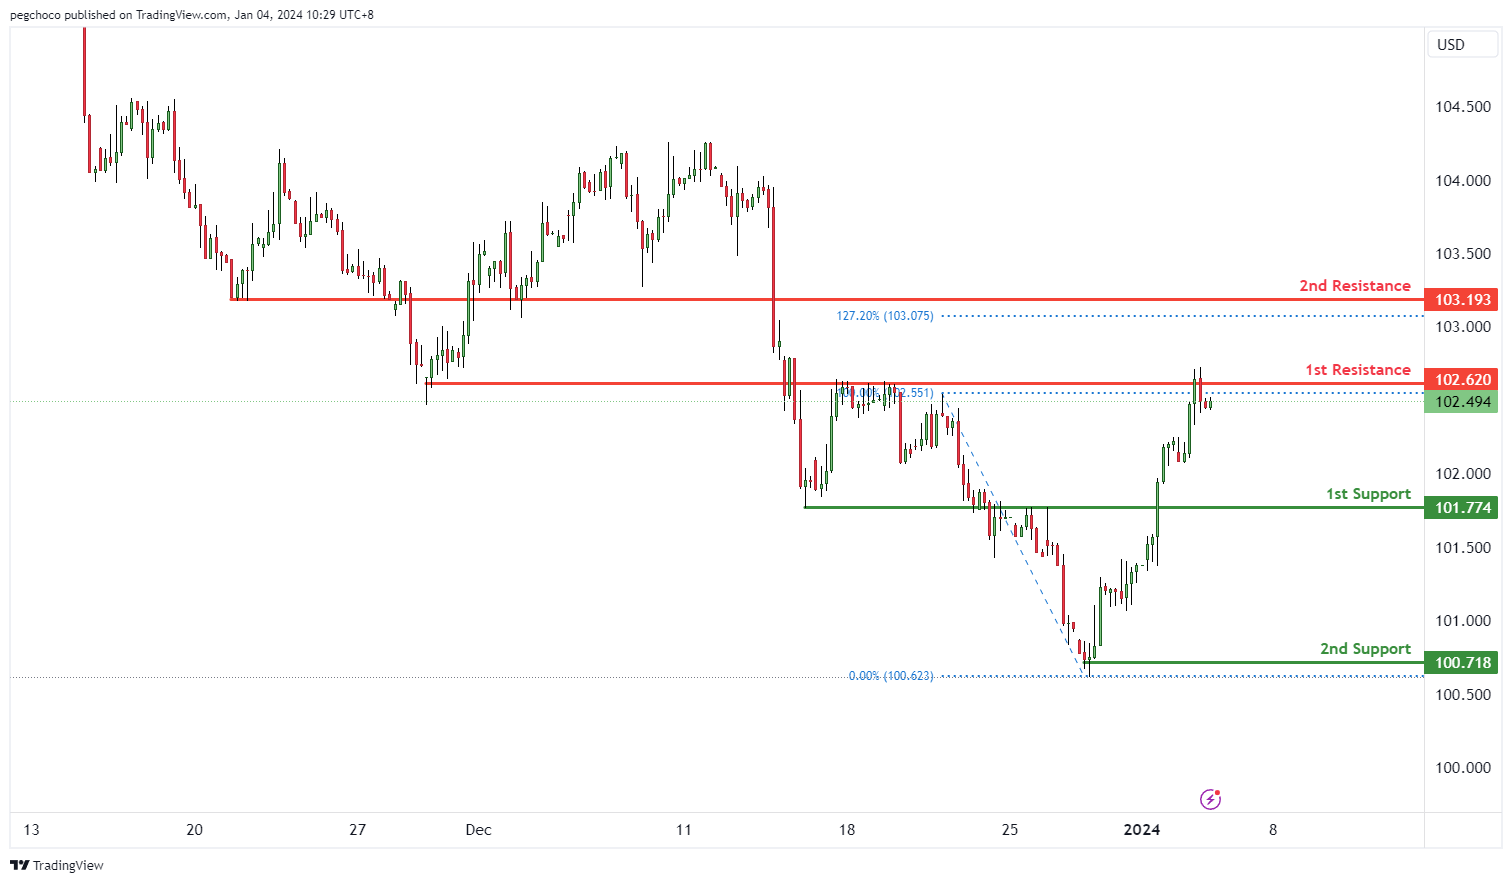
DXY:
The DXY (US Dollar Index) chart currently has a bullish overall momentum, suggesting that the US Dollar is exhibiting strength. In the short term, there’s potential for a bullish bounce off the 1st support level, with an aim to move towards the 1st resistance.
The 1st support at 101.77 is categorized as a pullback support. This level is significant as it suggests a potential area where buying interest may emerge, providing temporary support for the DXY.
The 2nd support at 100.71 is identified as a swing low support, further reinforcing its significance as a potential support zone.
On the resistance side, the 1st resistance at 102.62 is categorized as an overlap resistance. This level may act as a substantial barrier where selling interest could intensify, potentially slowing down or reversing the bullish momentum.
The 2nd resistance at 103.16 is noted as a pullback resistance and is associated with the 127.20% Fibonacci Extension. This level adds to the confluence of resistance, making it a potentially strong point of resistance for the DXY in the short term.
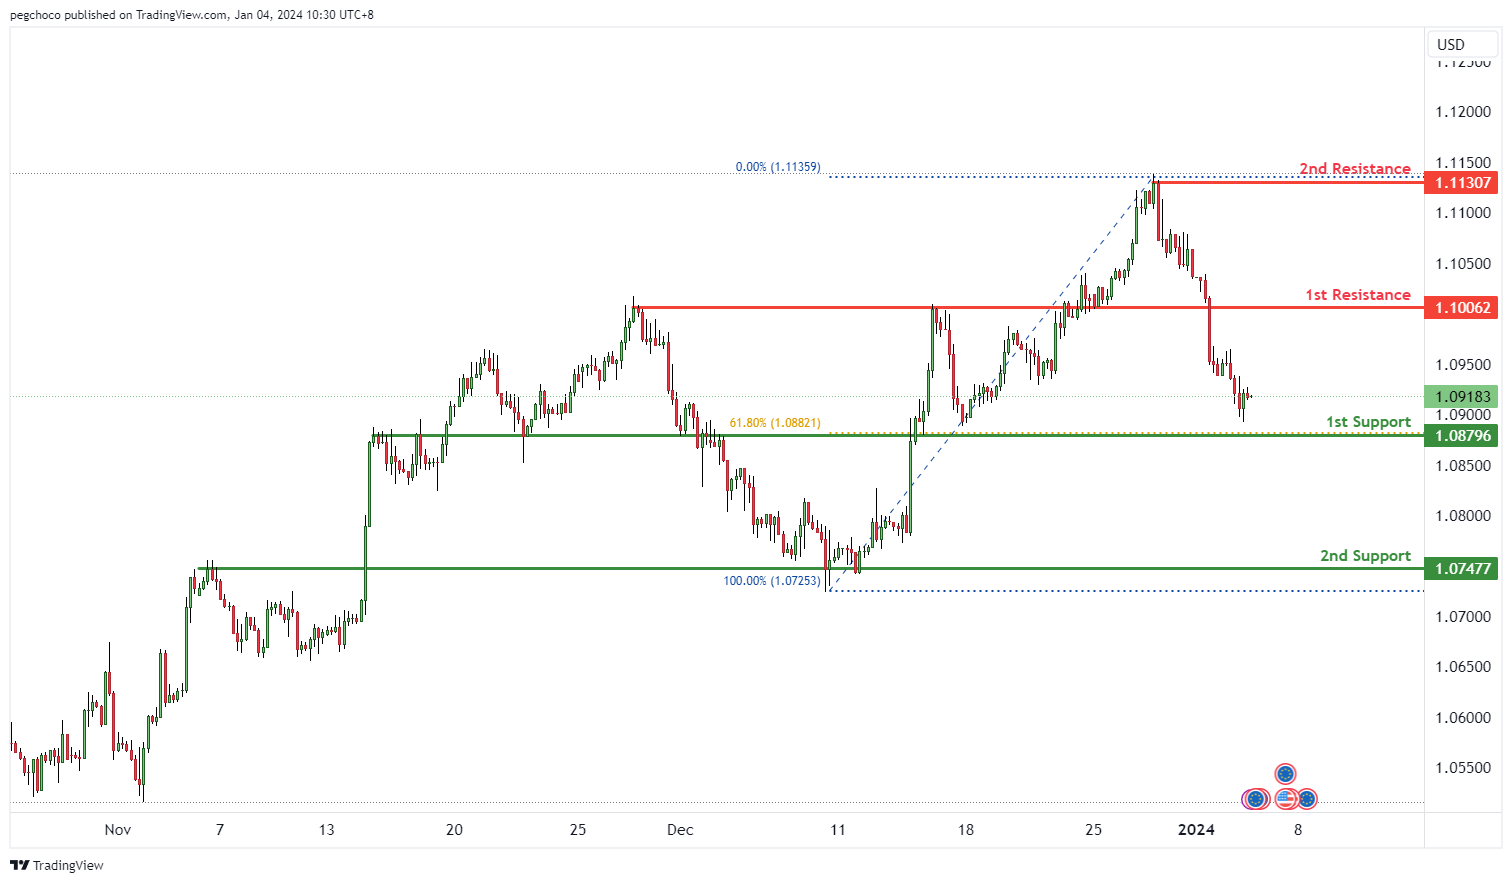
EUR/USD:
The EUR/USD chart currently has a bearish overall momentum, suggesting that the Euro is weaker compared to the US Dollar. In the short term, there’s potential for a rise towards the 1st resistance level before a reversal and a drop towards the 1st support.
The 1st support at 1.0879 is categorized as a pullback support and is associated with the 61.80% Fibonacci Retracement. This level is significant as it suggests a potential area where buying interest may emerge, providing temporary support for the EUR/USD.
The 2nd support at 1.0747 is identified as an overlap support, further reinforcing its significance as a potential support zone.
On the resistance side, the 1st resistance at 1.1006 is categorized as a pullback resistance. This level may act as a substantial barrier where selling interest could intensify, potentially triggering a bearish reversal in the short term.
The 2nd resistance at 1.1130 is noted as a swing high resistance. Swing highs often mark points of reversal or resistance in the price movement.
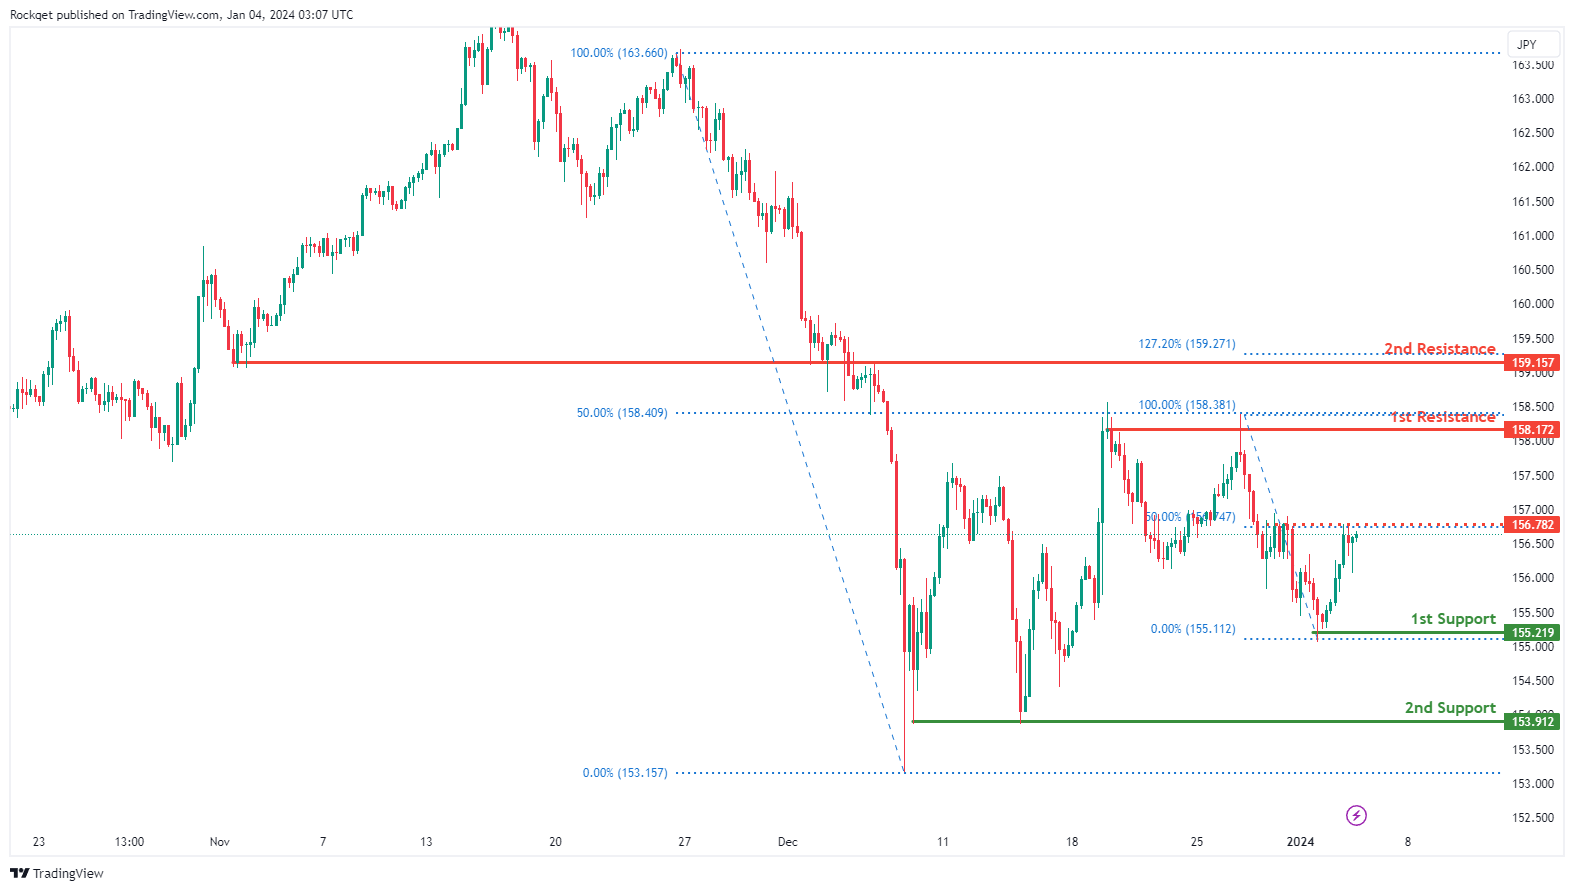
EUR/JPY:
The EUR/JPY chart currently displays a bullish overall momentum, indicating an upward trend. There is a potential scenario for a bullish continuation towards the 1st resistance.
The 1st support at 155.22 is considered advantageous as it represents a pullback support, indicating a historical level where buying interest has emerged.
The 2nd support at 153.91 is recognized as a multi-swing low support, adding further significance to this level as a potential area for buyers to step in.
On the resistance side, the 1st resistance at 158.17 is identified as a swing high resistance, suggesting a level where selling interest may materialize. The 50% Fibonacci Retracement adds confluence to the strength of this resistance level.
The 2nd resistance at 159.16 is marked as an overlap resistance, and the 127.20% Fibonacci Extension enhances the significance of this potential barrier.
An intermediate resistance level at 156.78 is noteworthy as a pullback resistance, with the added confluence of the 50% Fibonacci Retracement.
EUR/GBP:
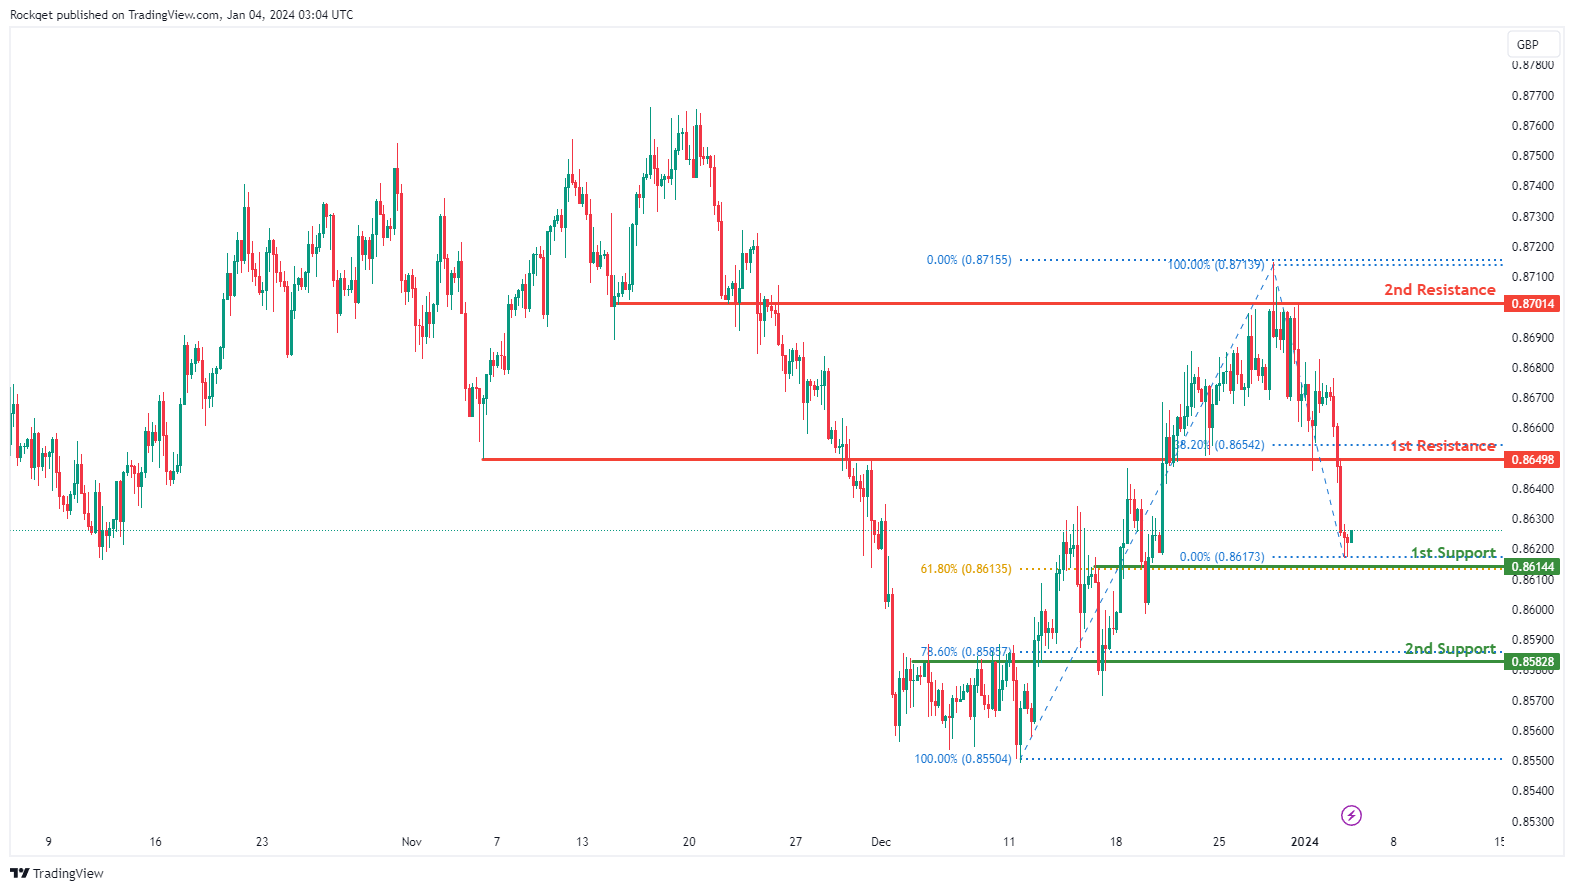
The EUR/GBP chart currently exhibits a weak bullish momentum with low confidence, suggesting a cautious market sentiment. Despite the overall weakness, there is a potential scenario for a bullish continuation towards the 1st resistance.
The 1st support at 0.8614 is considered favorable as it represents an overlap support and coincides with the 61.80% Fibonacci Retracement. This level holds historical significance and may act as a supportive zone where buyers could potentially emerge.
The 2nd support at 0.8583 is also identified as an overlap support and aligns with the 78.60% Fibonacci Retracement, providing additional confluence to its potential as a support level.
On the resistance side, the 1st resistance at 0.8650 is marked as an overlap resistance, indicating a level where selling interest may materialize.
The 2nd resistance at 0.8701 is also noted as an overlap resistance, adding another layer of potential resistance.
GBP/USD:
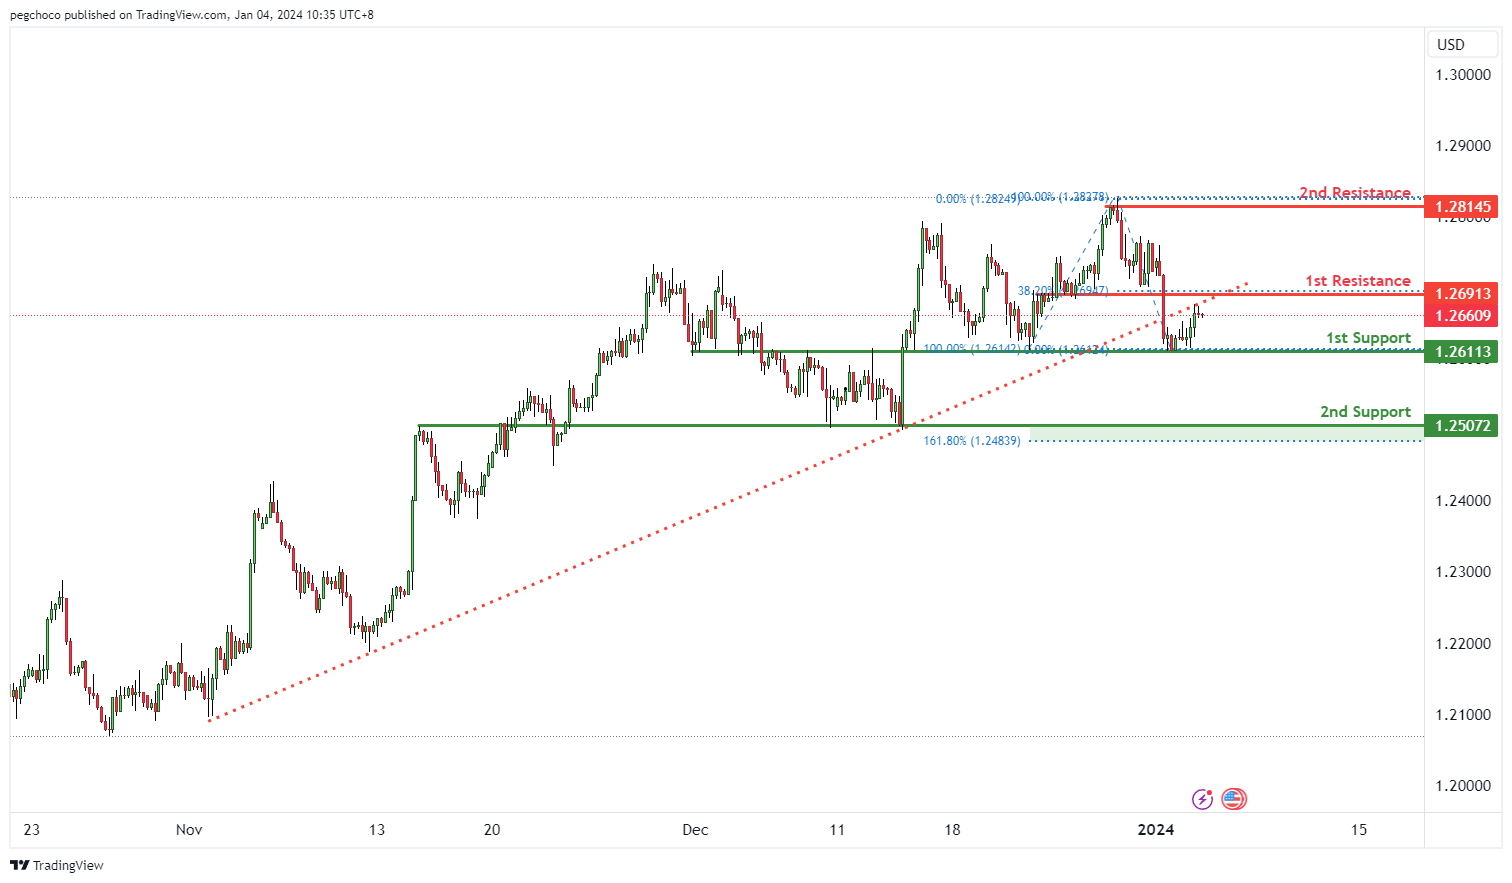
The GBP/USD chart currently has a bearish overall momentum, driven by the fact that price broke below an ascending support line, triggering a potential bearish move. This suggests that the British Pound is weaker compared to the US Dollar.
In the short term, there’s potential for a rise towards the 1st resistance level before a reversal and a drop towards the 1st support.
The 1st support at 1.2611 is categorized as an overlap support and is a significant level that may provide temporary support for the GBP/USD.
The 2nd support at 1.2507 is identified as an overlap support and is associated with the 161.80% Fibonacci Extension, further reinforcing its significance as a potential support zone.
On the resistance side, the 1st resistance at 1.2691 is categorized as a pullback resistance and is associated with the 38.20% Fibonacci Retracement. This level may act as a substantial barrier where selling interest could intensify, potentially triggering a bearish reversal in the short term.
The 2nd resistance at 1.2814 is noted as a swing high resistance. Swing highs often mark points of reversal or resistance in the price movement.
GBP/JPY:
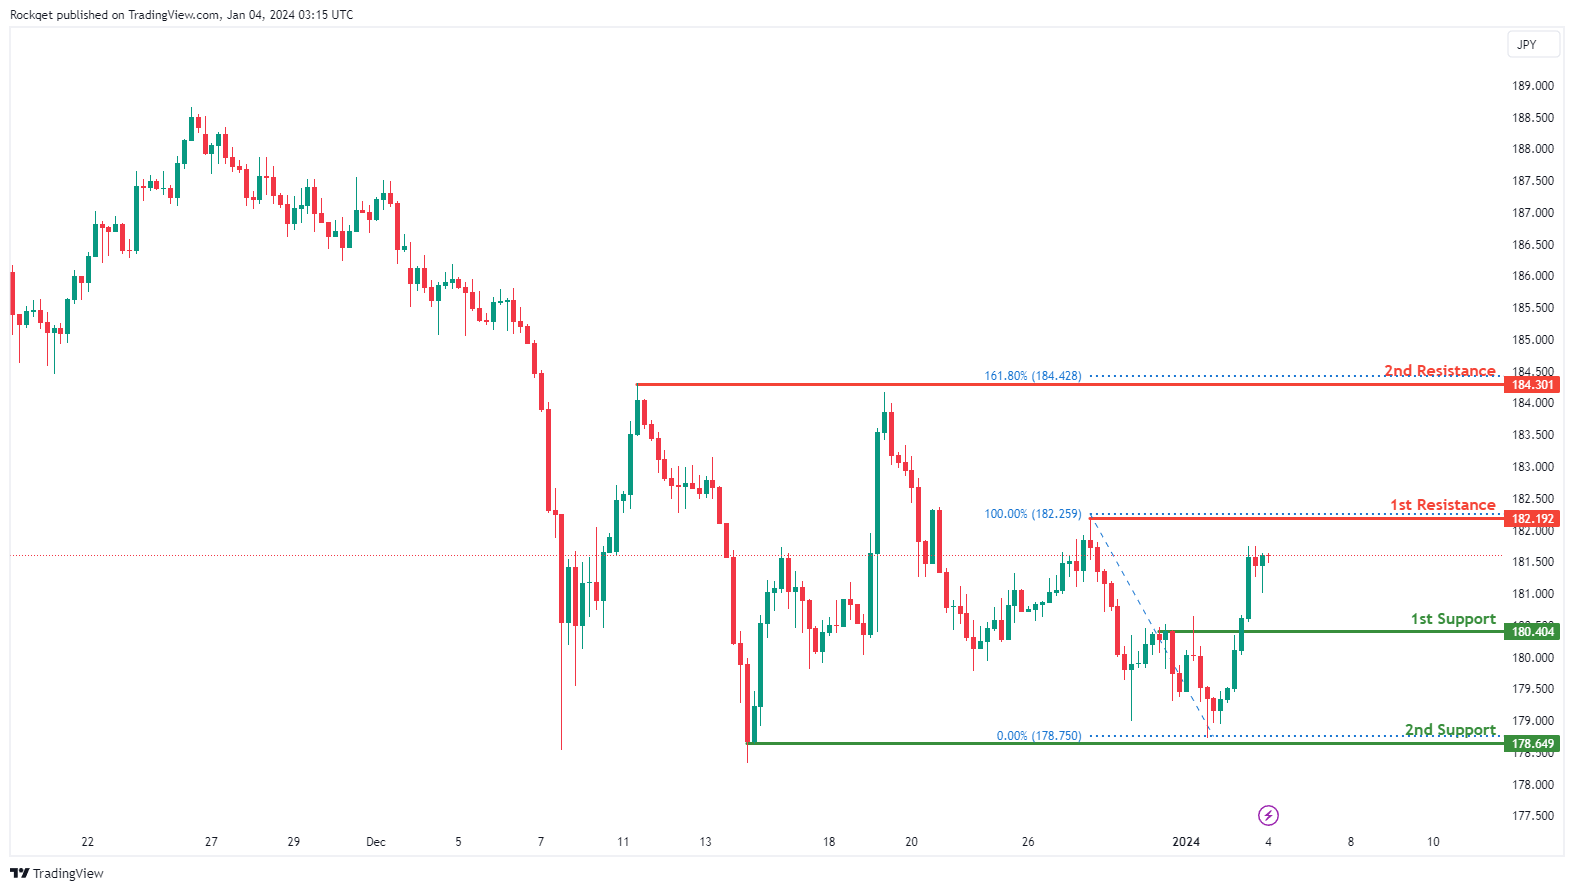
The GBP/JPY chart currently demonstrates a neutral overall momentum, indicating a lack of a clear directional trend. In this scenario, there is a potential for price to fluctuate between the 1st resistance and 1st support levels.
The 1st support at 180.40 is identified as a pullback support, suggesting that this level has previously attracted buying interest during retracements.
The 2nd support at 178.65 is recognized as a multi-swing low support, adding significance to its potential as a support level.
On the resistance side, the 1st resistance at 182.19 is marked as a swing high resistance, representing a level where selling interest may emerge.
The 2nd resistance at 184.30 is noteworthy for being a multi-swing high resistance and aligning with the 161.80% Fibonacci Extension, potentially reinforcing its role as a resistance level.
USD/CHF:
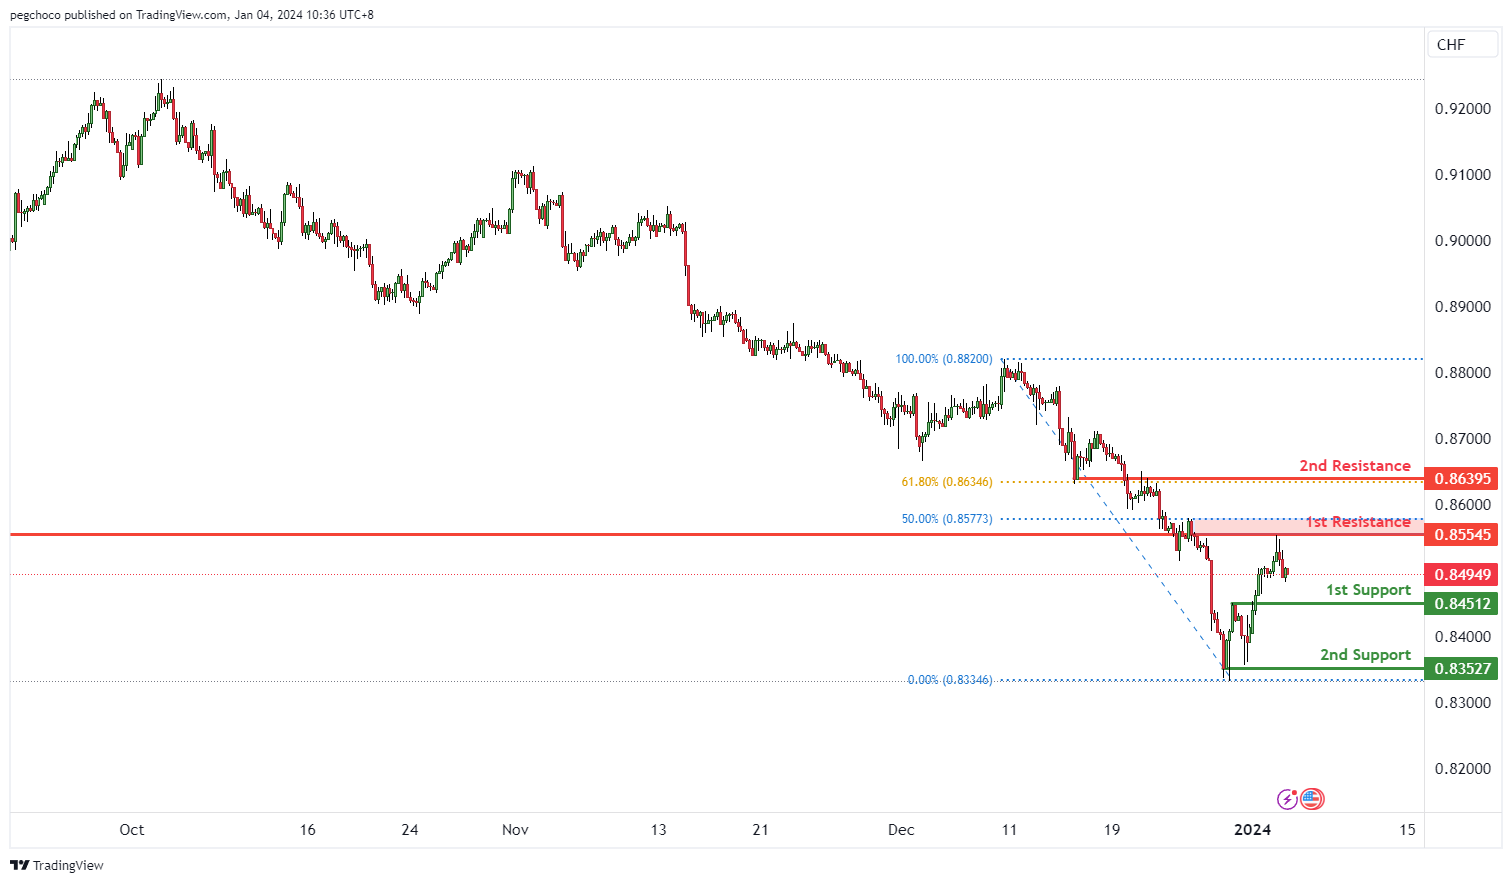
The USD/CHF chart currently has a bearish overall momentum, indicating that the US Dollar is weaker compared to the Swiss Franc.
Price could potentially continue its bearish movement towards the 1st support level.
The 1st support at 0.8451 is categorized as a pullback support. This level may serve as a significant area where buying interest could emerge temporarily, providing support for the USD/CHF pair.
The 2nd support at 0.8352 is identified as a multi-swing low support. This reinforces its significance as a potential support zone.
On the resistance side, the 1st resistance at 0.8554 is categorized as an overlap resistance and is associated with the 50% Fibonacci Retracement level. This level may act as a substantial barrier where selling interest could intensify.
The 2nd resistance at 0.8639 is also noted as an overlap resistance and is linked to the 61.80% Fibonacci Retracement level. Resistance levels like this often play a role in reversing or stalling the upward movement of the price.
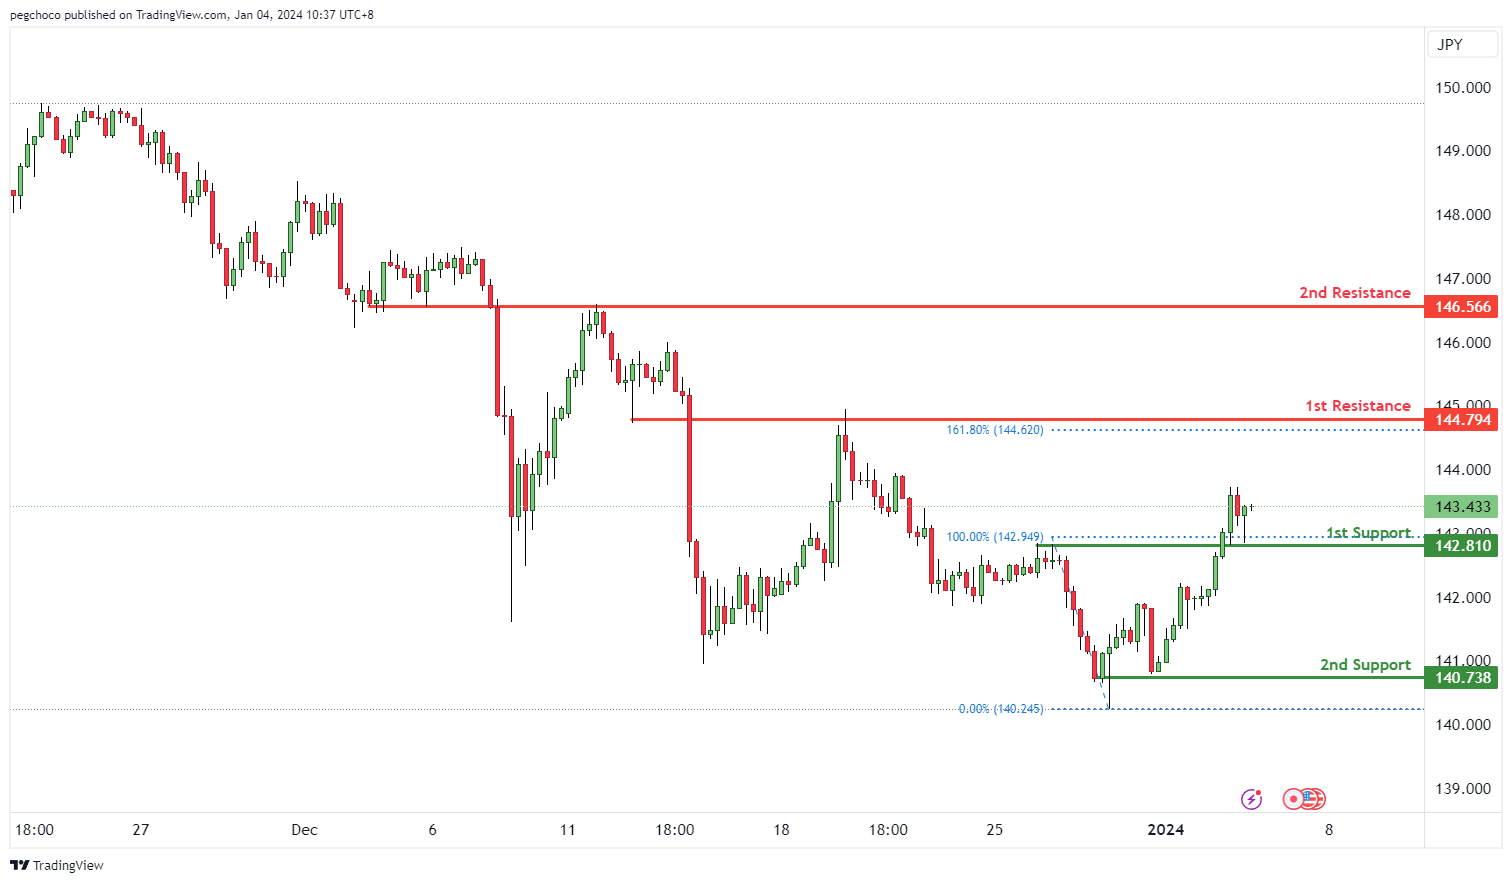
USD/JPY:
The USD/JPY chart currently has a bullish overall momentum, suggesting that the US Dollar is showing strength compared to the Japanese Yen.
Price could potentially continue its bullish movement towards the 1st resistance level.
The 1st support at 142.81 is categorized as an overlap support. This level may act as a significant area where buying interest could emerge, providing support for USD/JPY.
The 2nd support at 140.73 is identified as a swing low support, further reinforcing its significance as a potential support zone.
On the resistance side, the 1st resistance at 144.79 is categorized as an overlap resistance and is associated with the 161.80% Fibonacci Extension level. This level may serve as a substantial barrier where selling interest could intensify.
The 2nd resistance at 146.56 is also noted as an overlap resistance. Such resistance levels often play a role in reversing or slowing down the upward movement of the price.
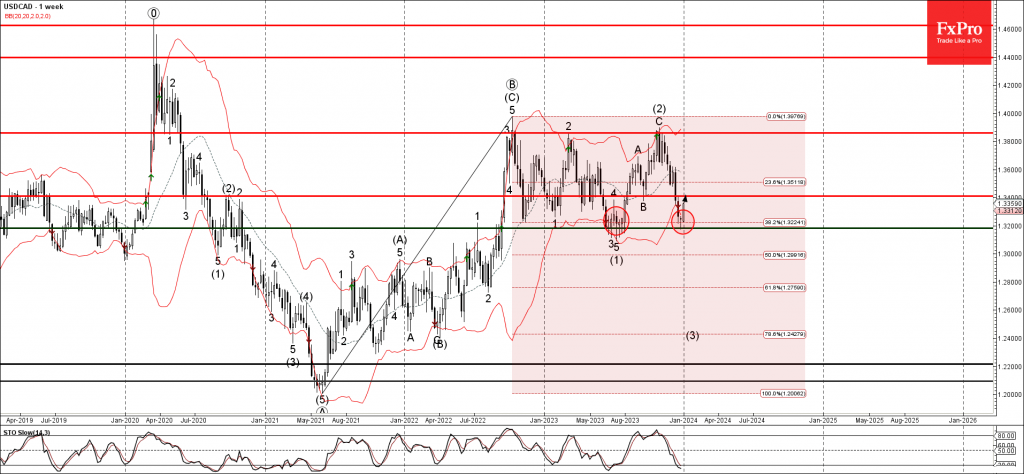
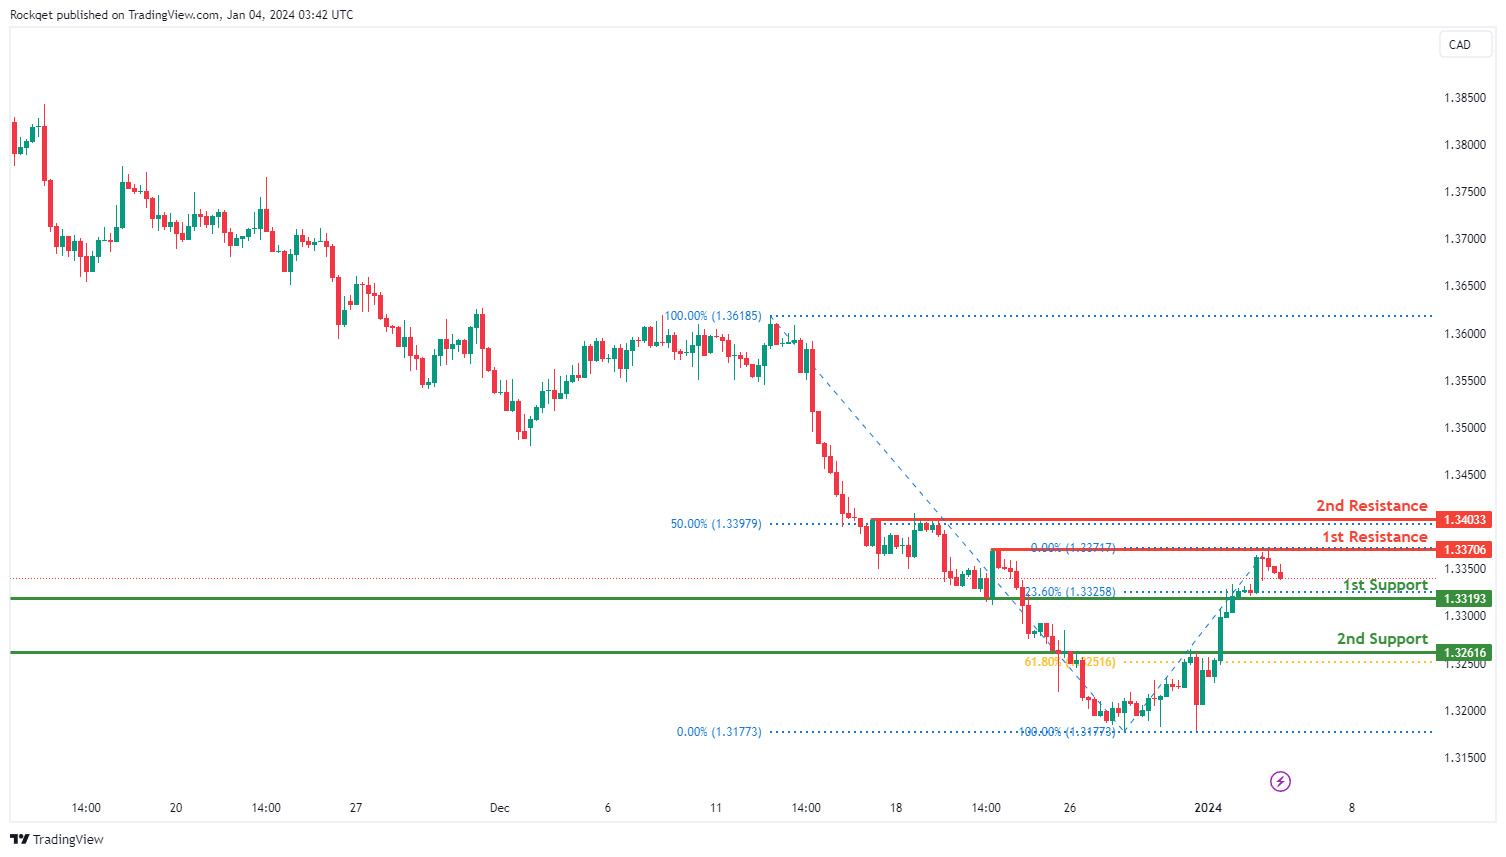
USD/CAD:
The USD/CAD chart currently exhibits an overall bullish momentum. However, there is a potential scenario for price to fall towards the 1st support before making a bullish bounce towards the 1st resistance.
The 1st support level at 1.3319 is identified as a pullback support that aligns with the 23.60% Fibonacci retracement level. Further below, the 2nd support level at 1.3261 is noted as an overlap support that aligns with the 61.80% Fibonacci retracement level, further reinforcing its importance as a key support level.
To the upside, the 1st resistance level at 1.3370 is identified as a pullback resistance. Higher up, the 2nd resistance level at 1.3403 is also marked as a pullback resistance that aligns with the 50.00% Fibonacci retracement level, suggesting a potential barrier for further upside movement.
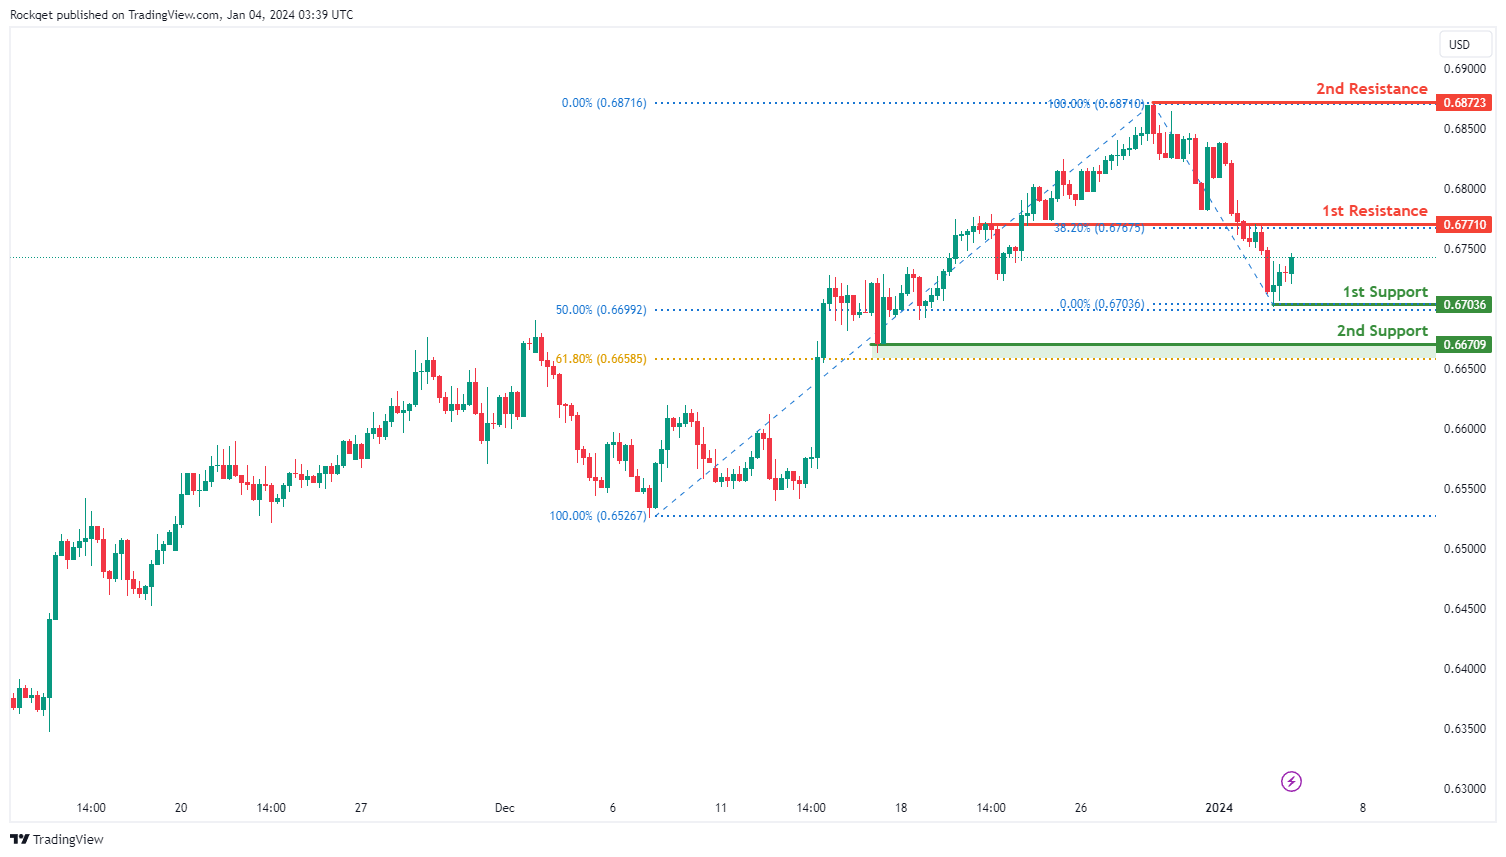
AUD/USD:
The AUD/USD chart currently exhibits an overall bearish momentum. In this context, there is a potential scenario for price to make a bearish reversal off the 1st resistance and fall towards the 1st support.
The 1st resistance level at 0.6771 is identified as an overlap resistance that aligns with the 38.20% Fibonacci retracement level. Higher up, the 2nd resistance level at 0.6872 is noted as a swing-high resistance, indicating its potential significance as a barrier for further upward movement.
To the downside, the 1st support level at 0.6703 is identified as a pullback support that aligns close to the 50.00% Fibonacci retracement level. Further below, the 2nd support level at 0.6670 is marked as a pullback support that aligns close to the 61.80% Fibonacci retracement level, further reinforcing its importance as a key support level.
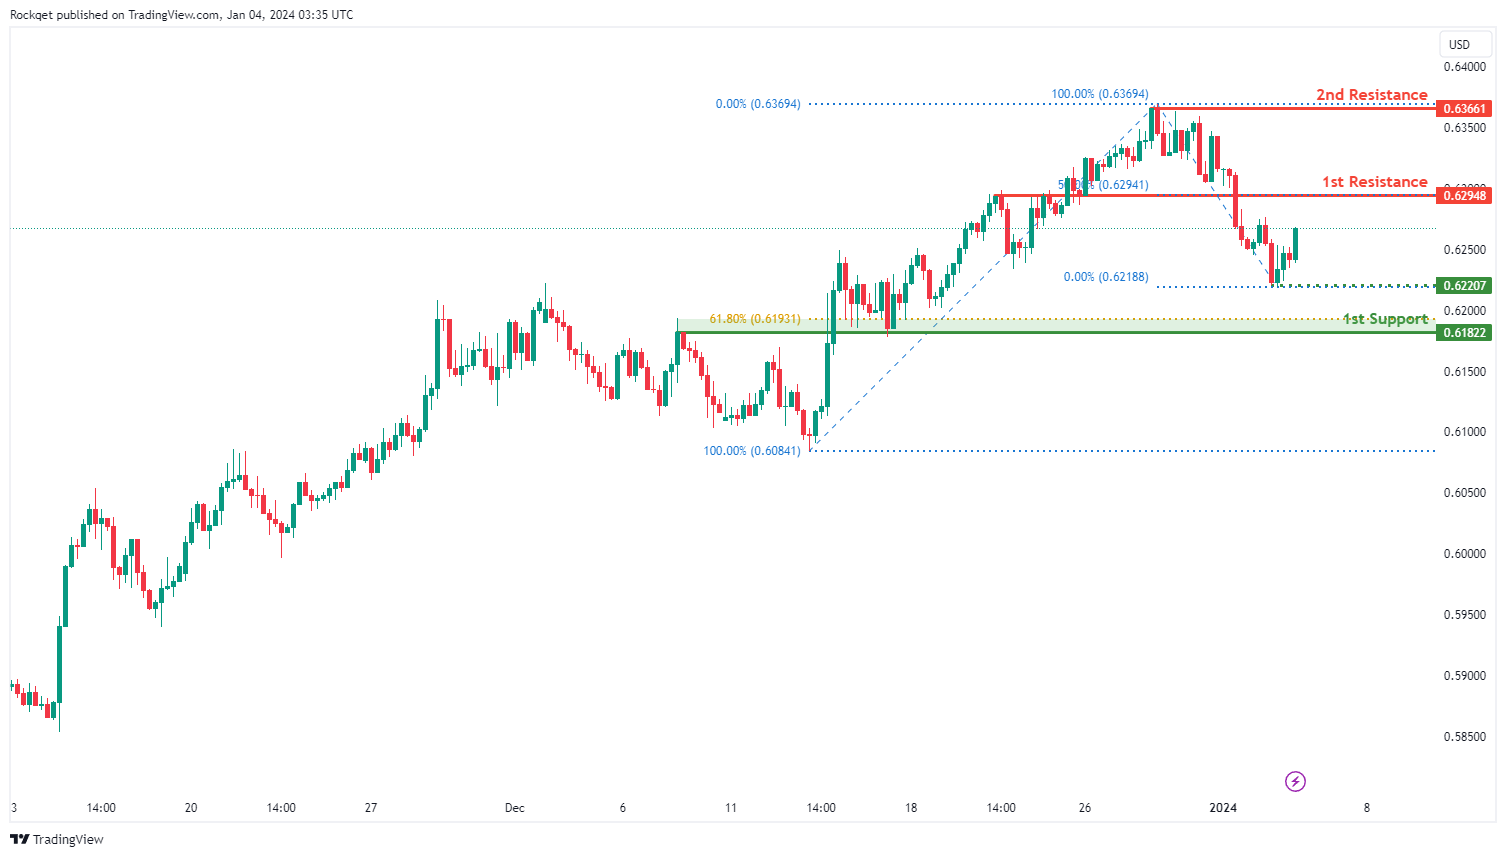
NZD/USD
The NZD/USD chart currently exhibits an overall bearish momentum. In this context, there is a potential scenario for price to make a bearish reversal off the 1st resistance and fall towards the 1st support.
The 1st resistance level at 0.6294 is identified as an overlap resistance that aligns with the 50.00% Fibonacci retracement level. Higher up, the 2nd resistance level at 0.6366 is marked as a swing-high resistance, indicating its potential significance as a barrier for further upward movement.
To the downside, the intermediate support level at 0.6220 is identified as a pullback support. Further below, the 1st support level at 0.6182 is noted as an overlap support that aligns close to the 61.80% Fibonacci retracement level, further reinforcing its importance as a key support level.
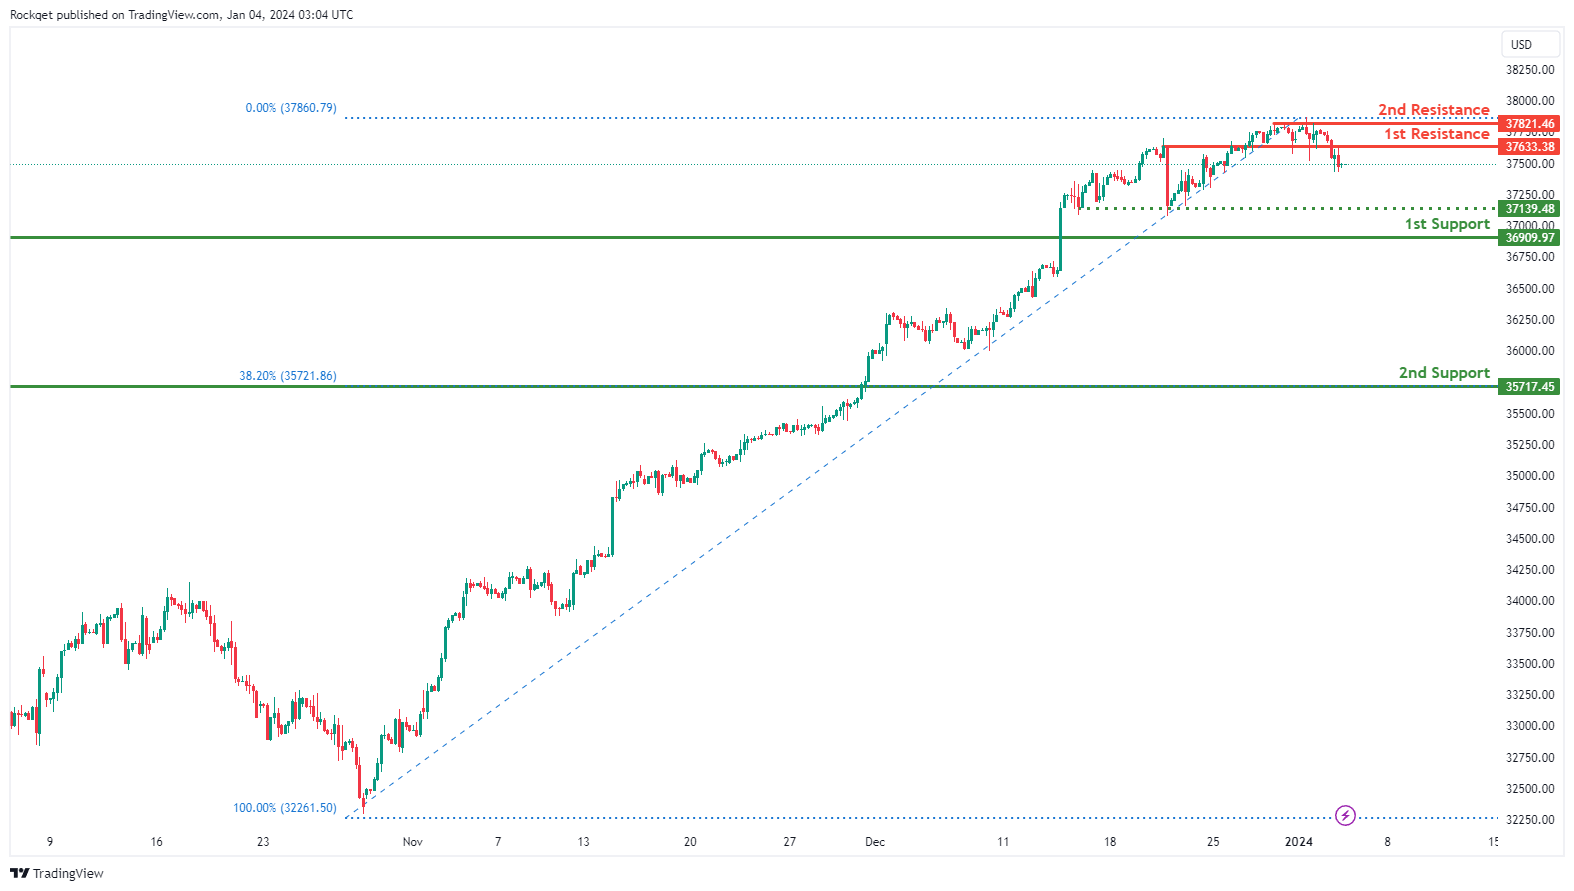
DJ30:
The DJ30 chart currently exhibits a weak bearish overall momentum, indicating a lack of a strong downward trend with low confidence. In this market condition, there is a potential scenario for a bearish continuation towards the 1st support.
The 1st support at 36909.97 is considered favorable as it is identified as a pullback support, suggesting historical significance as a level where buying interest has previously emerged during pullbacks.
The intermediate support at 37139.48 is noted as a multi-swing low support, providing an additional layer of potential buying interest.
The 2nd support at 35717.45 is recognized as a pullback support and coincides with the 38.20% Fibonacci Retracement, adding confluence to its potential as a support level.
On the resistance side, the 1st resistance at 37633.38 is identified as an overlap resistance, indicating a level where selling interest may emerge.
The 2nd resistance at 37821.46 is marked as a swing high resistance, representing a significant level where selling pressure could intensify.
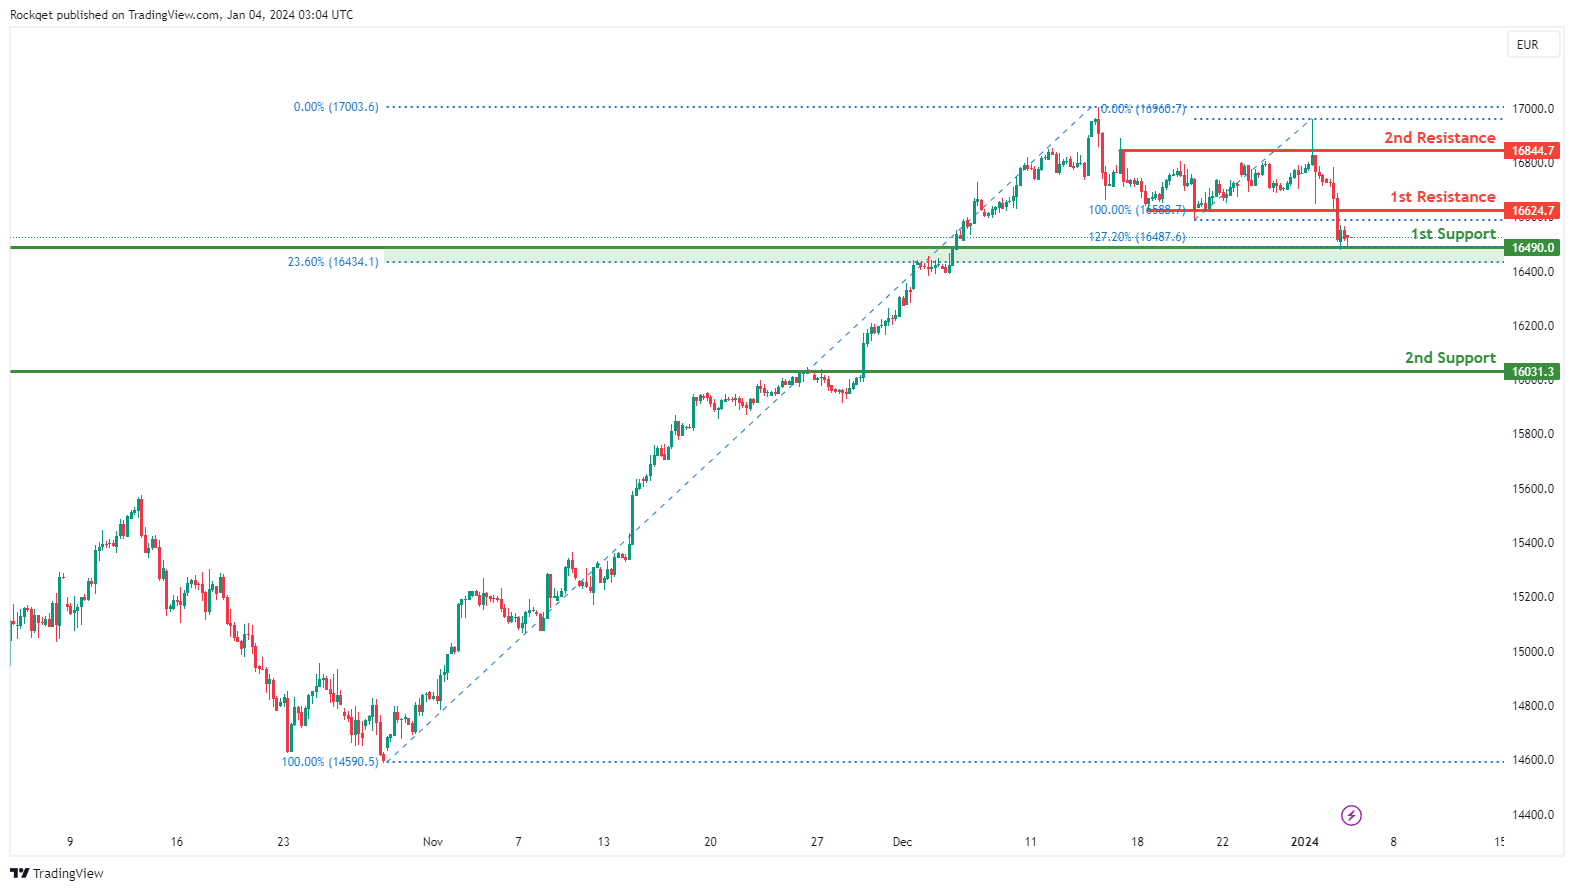
GER40:
The GER40 chart currently displays a bearish overall momentum, indicating a prevailing downward trend. Several factors contribute to this bearish momentum. There is a potential scenario for a bearish reaction off the 1st resistance, with a subsequent drop towards the 1st support.
The 1st support at 16490.00 is considered significant due to its identification as an overlap support and alignment with the 23.60% Fibonacci Retracement, providing a confluence of support factors.
The 2nd support at 16031.30 is recognized as a pullback support, further strengthening its potential as a level where buying interest may emerge.
On the resistance side, the 1st resistance at 16624.70 is identified as a pullback resistance, suggesting historical significance as a level where selling interest may materialize.
The 2nd resistance at 16844.70 is marked as a swing high resistance, indicating a significant level where selling pressure could intensify.
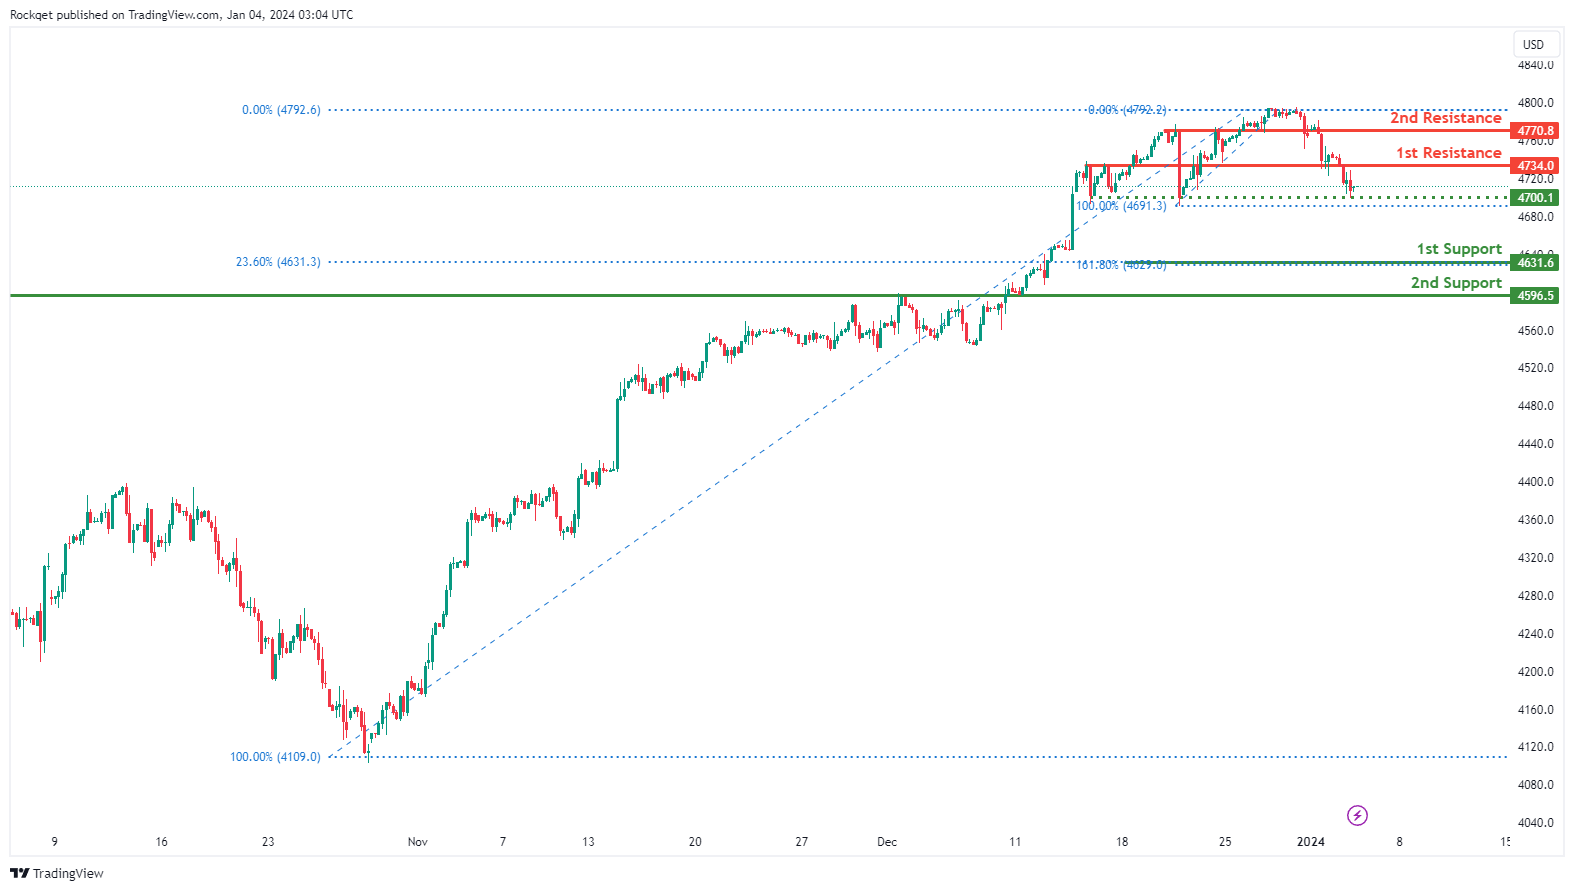
US500:
The US500 chart is currently exhibiting a weak bullish momentum with low confidence. Several factors contribute to this uncertain momentum. There is a potential scenario for a bearish reaction off the 1st resistance, with a subsequent drop towards the 1st support.
The 1st support at 4631.6 holds significance due to its alignment with the 23.60% Fibonacci Retracement and the 161.80% Fibonacci Extension, providing a confluence of support factors.
The 2nd support at 4595.5 is identified as an overlap support, further strengthening its potential as a level where buying interest may emerge.
An intermediate support at 4700.1 is recognized as a pullback support, adding an additional layer of potential buying interest at this level.
On the resistance side, the 1st resistance at 4743.0 is marked as an overlap resistance, suggesting historical significance as a level where selling interest may materialize.
The 2nd resistance at 4770.8 is also identified as an overlap resistance, contributing to the potential barrier for further upward movement.
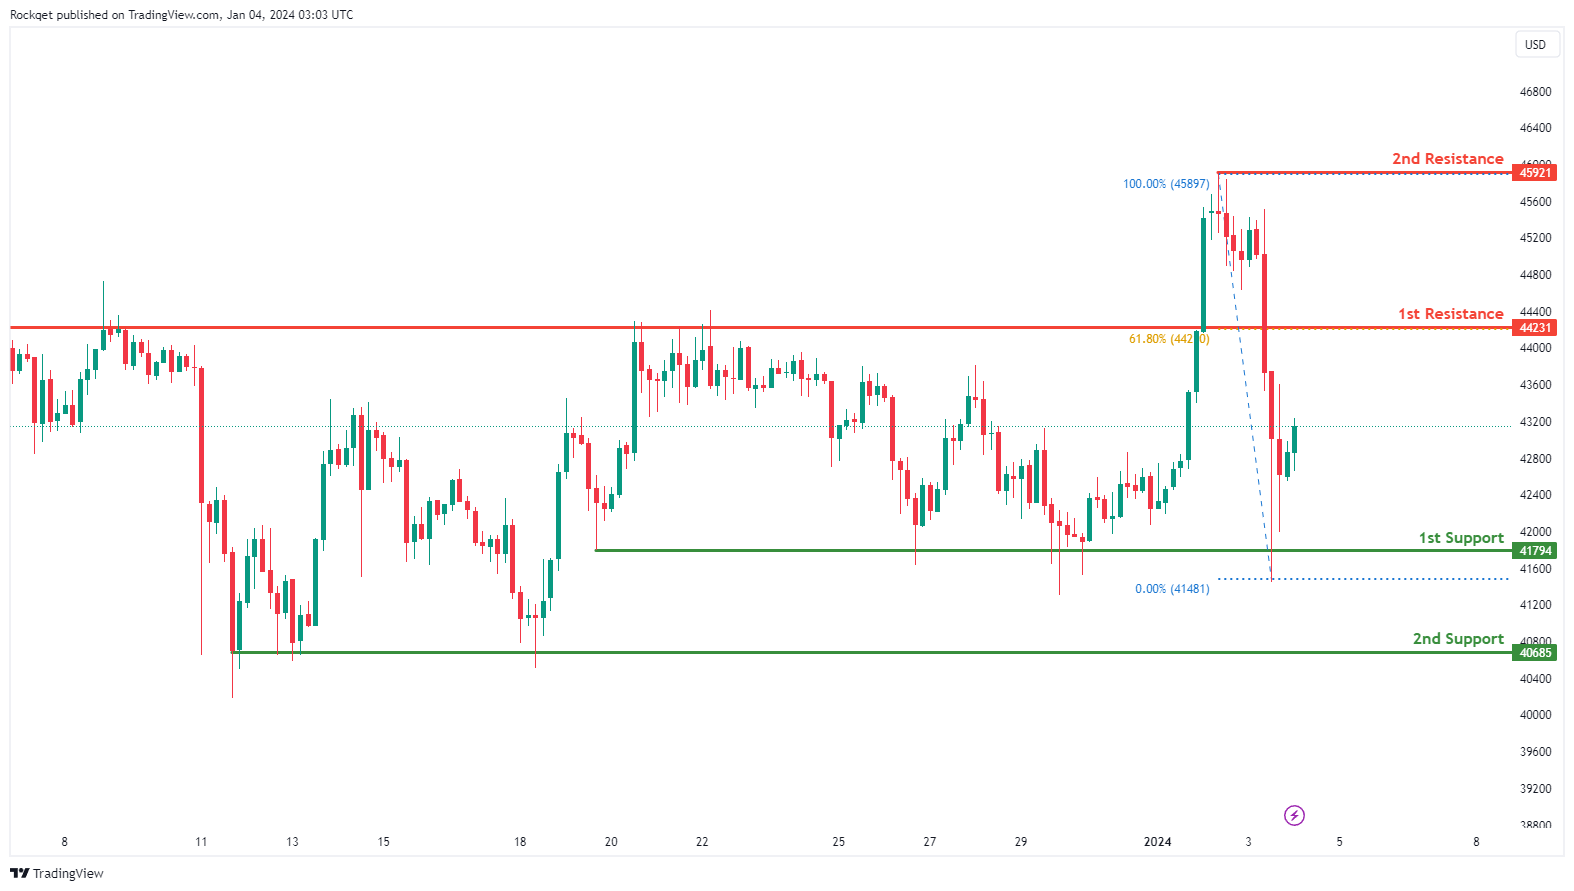
BTC/USD:
The BTC/USD chart currently displays a bullish overall momentum, indicating a potential continuation of the upward trend. There is a likelihood of a bullish movement towards the 1st resistance.
The 1st support at 41794 is considered favorable as it aligns with a multi-swing low support level, suggesting historical significance where buying interest has previously emerged.
The 2nd support at 40685 is also identified as a multi-swing low support, providing an additional layer of potential buying interest.
On the resistance side, the 1st resistance at 44231 is marked as a swing high resistance and coincides with the 61.80% Fibonacci Retracement. This level may act as a barrier where selling interest could materialize.
The 2nd resistance at 45921 is identified as a swing high resistance, further adding to the potential resistance zone for the price.
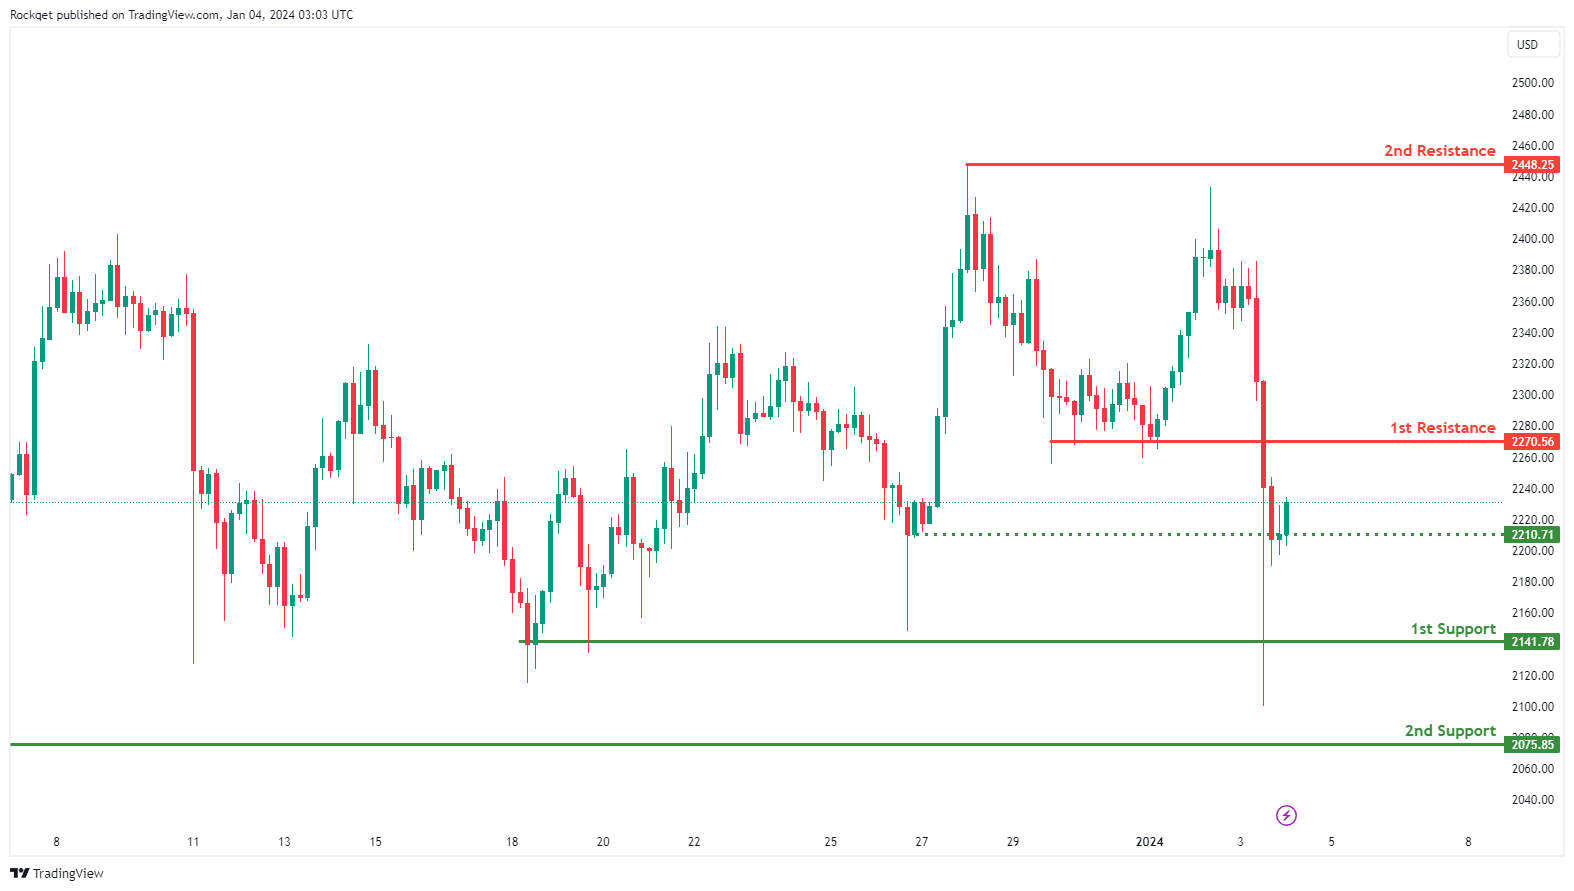
ETH/USD:
The ETH/USD chart currently exhibits a bullish overall momentum, suggesting a potential continuation of the upward trend. There is a possibility of a bullish movement towards the 1st resistance.
The 1st support at 2141.78 is considered advantageous as it corresponds to a multi-swing low support level, indicating historical significance where buying interest has previously been observed.
The 2nd support at 2075.85 is identified as a pullback support, adding an additional layer of potential buying interest.
On the resistance side, the 1st resistance at 2270.56 is marked as a pullback resistance, suggesting a level where selling interest may materialize.
The 2nd resistance at 2448.25 is recognized as a swing high resistance, further contributing to the potential resistance zone for the price.
An intermediate support level at 2210.71 is identified as a pullback support, providing an additional reference point for potential buying interest.
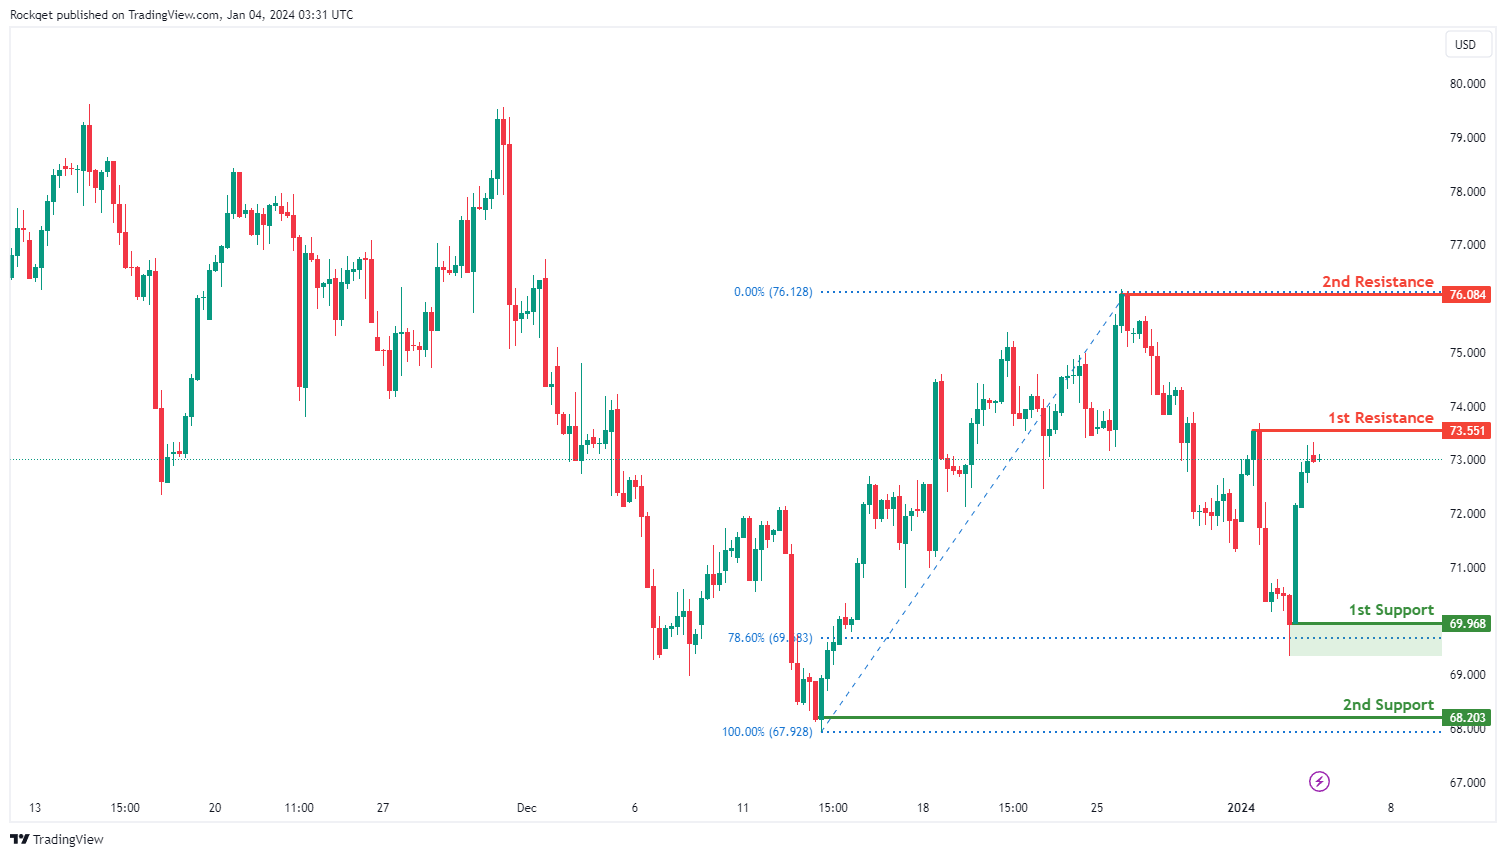
WTI/USD:
The WTI chart currently exhibits an overall bullish momentum, indicating a new uptrend. In this context, there is a potential scenario for price to rise towards the 1st resistance.
The 1st resistance level at 73.55 is identified as a pullback resistance. Higher up, the 2nd resistance level at 76.08 is noted as a swing-high resistance, further indicating its potential significance as a barrier for further upward movement.
To the downside, the 1st support level at 69.96 is identified as a swing-low support that aligns close to the 78.60% Fibonacci retracement level. Further below, the 2nd support level at 68.20 is also marked as a swing-low support, reinforcing its importance as a key support level.
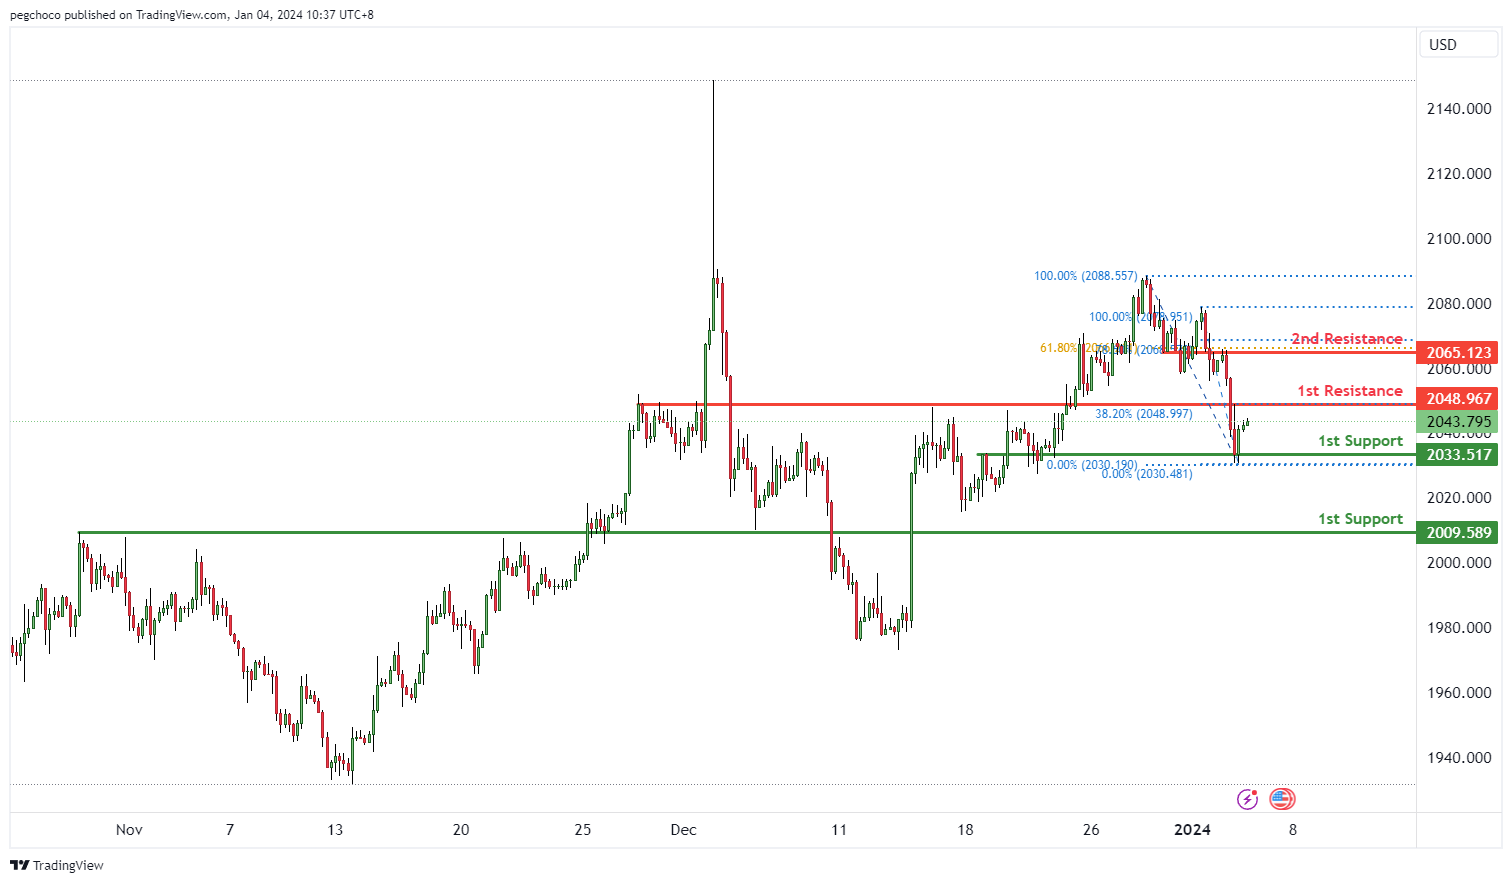
XAU/USD (GOLD):
The XAU/USD chart currently has a bearish overall momentum, indicating that gold (XAU) is weaker compared to the US Dollar (USD). In the short term, there’s potential for a bearish continuation towards the 1st support level.
The 1st support at 2049.16 is categorized as a pullback support and is reinforced by the presence of the 38.20% Fibonacci Retracement level. This level may act as a significant area where buying interest could emerge, providing temporary support for XAU/USD.
The 2nd support at 2009.58 is identified as an overlap support, further emphasizing its significance as a potential support zone. The 61.80% Fibonacci Retracement adds to the confluence of support at this level.
On the resistance side, the 1st resistance at 2088.73 is categorized as a multi-swing high resistance. This level may act as a substantial barrier where selling interest could intensify, potentially impeding any bullish advances in the short term.
China’s Caixin PMI services rises to 52.9, businesses express confidence
China's Caixin PMI Services marked a significant rise to 52.9 in December from 51.5, achieving its highest level since July. Concurrently, PMI Composite, which combines both manufacturing and services, also saw an improvement, climbing from 51.6 to 52.6.
Wang Zhe, Senior Economist at Caixin Insight Group, noted that businesses are "expressing confidence" in an improved economic outlook for the coming year. This optimism is reflected in the business expectations gauge, which, despite being "about 3 points below" the 2023 average for the first 11 months, still aligns with the "historical mean" from 2012 to 2022.
Japan’s PMI manufacturing finalized at 47.9, deeper contraction and higher input inflation
Japan's PMI Manufacturing was finalized at 47.9 in December, down from November's 48.3, marking the most significant sector contraction since February 2023. S&P Global reports that this downturn was characterized by notable declines in both production and new orders, alongside rise in input price inflation. Despite these challenges, there was an unexpected increase in business confidence, reaching a five-month high.
Paul Smith from S&P Global Market Intelligence noted, "Market uncertainty led to reduced orders and output, especially from key export clients in China, Europe, and North America." He also mentioned specific struggles in the electronics sector and a general lack of investment.
However, Smith acknowledged increased cost pressures, with input price inflation at a three-month high due to more expensive raw materials, particularly imports.
Looking ahead, Smith conveyed optimism among Japanese manufacturers, expecting an end to client destocking and predicting that new product launches will boost production in 2024.
FOMC minutes see dual-mandate dilemma ahead
Minutes from FOMC's December meeting indicate that some participants are concerned about the risks of stalling progress in bringing down inflation to target. Simultaneously, there is apprehension about downside risks to the economy resulting from "overly restrictive monetary policy". Hence, a few suggested that Fed could "face a trade off between its dual-mandate goals in the period ahead".
Significantly, the minutes indicate a consensus among participants that, considering the improved inflation outlooks, a lower target range for federal funds rate would likely be appropriate by the end of 2024. However, they also recognized "an unusually elevated degree of uncertainty" in their economic outlooks, leaving room for the possibility that economic developments might necessitate further rate increases or maintaining the current target range longer than currently anticipated.
The emphasis in the discussions was on the need for a "careful, data-dependent approach" to policy decisions. The minutes also highlighted that "it would be appropriate for policy to remain at a restrictive stance for some time," underlining the commitment to ensure that inflation is sustainably moving towards the Committee's objective.
Participants also discussed risk-management considerations for future policy decisions. They acknowledged that while upside risks to inflation have decreased, inflation is "still well above the Committee's longer-run goal." Moreover, the minutes reflected a concern about the duration for which a restrictive monetary policy would be necessary, pointing to "downside risks to the economy" associated with such a stance. A few participants raised the possibility of a trade-off between the Fed's dual-mandate goals.
(FED) Minutes of the Federal Open Market Committee
December 12–13, 2023
A joint meeting of the Federal Open Market Committee and the Board of Governors of the Federal Reserve System was held in the offices of the Board of Governors on Tuesday, December 12, 2023, at 10:30 a.m. and continued on Wednesday, December 13, 2023, at 9:00 a.m.1
Attendance
Jerome H. Powell, Chair
John C. Williams, Vice Chair
Michael S. Barr
Michelle W. Bowman
Lisa D. Cook
Austan D. Goolsbee
Patrick Harker
Philip N. Jefferson
Neel Kashkari
Adriana D. Kugler
Lorie K. Logan
Christopher J. Waller
Thomas I. Barkin, Raphael W. Bostic, Mary C. Daly, and Loretta J. Mester, Alternate Members of the Committee
Susan M. Collins and Jeffrey R. Schmid, Presidents of the Federal Reserve Banks of Boston and Kansas City, respectively
Kathleen O'Neill Paese, Interim President of the Federal Reserve Bank of St. Louis
Joshua Gallin, Secretary
Matthew M. Luecke, Deputy Secretary
Brian J. Bonis, Assistant Secretary
Michelle A. Smith, Assistant Secretary
Mark E. Van Der Weide, General Counsel
Richard Ostrander, Deputy General Counsel
Trevor A. Reeve, Economist
Stacey Tevlin, Economist
Beth Anne Wilson, Economist
Shaghil Ahmed, Roc Armenter, James A. Clouse, Eric M. Engen, Anna Paulson, Andrea Raffo, Chiara Scotti, and William Wascher, Associate Economists
Roberto Perli, Manager, System Open Market Account
Julie Ann Remache, Deputy Manager, System Open Market Account
Jose Acosta, Senior System Administrator II, Division of Information Technology, Board
David Altig, Executive Vice President, Federal Reserve Bank of Atlanta
Alyssa Arute,2 Manager, Division of Reserve Bank Operations and Payment Systems, Board
Kimberly N. Bayard, Section Chief, Division of Research and Statistics, Board
Penelope A. Beattie,3 Section Chief, Office of the Secretary, Board
Paola Boel, Vice President, Federal Reserve Bank of Cleveland
David Bowman, Senior Associate Director, Division of Monetary Affairs, Board
Celso Brunetti, Assistant Director, Division of Research and Statistics, Board
Jennifer J. Burns, Deputy Director, Division of Supervision and Regulation, Board
Juan C. Climent, Special Adviser to the Board, Division of Board Members, Board
Edmund S. Crawley, Senior Economist, Division of Monetary Affairs, Board
Stephanie E. Curcuru, Deputy Director, Division of International Finance, Board
Ryan Decker, Special Adviser to the Board, Division of Board Members, Board
Riccardo DiCecio, Economic Policy Advisor, Federal Reserve Bank of St. Louis
Cynthia L. Doniger, Principal Economist, Division of Monetary Affairs, Board
Rochelle M. Edge, Deputy Director, Division of Monetary Affairs, Board
Jon Faust, Senior Special Adviser to the Chair, Division of Board Members, Board
Glenn Follette, Associate Director, Division of Research and Statistics, Board
Joseph W. Gruber, Executive Vice President, Federal Reserve Bank of Kansas City
Valerie S. Hinojosa, Section Chief, Division of Monetary Affairs, Board
Jasper J. Hoek, Deputy Associate Director, Division of International Finance, Board
Jane E. Ihrig, Special Adviser to the Board, Division of Board Members, Board
Elizabeth Klee, Senior Associate Director, Division of Financial Stability, Board
David E. Lebow, Senior Associate Director, Division of Research and Statistics, Board
Andreas Lehnert, Director, Division of Financial Stability, Board
Eric LeSueur,2 Policy and Market Analysis Advisor, Federal Reserve Bank of New York
Kurt F. Lewis, Special Adviser to the Chair, Division of Board Members, Board
Laura Lipscomb, Special Adviser to the Board, Division of Board Members, Board
David López-Salido, Senior Associate Director, Division of Monetary Affairs, Board
Thomas Lubik, Senior Advisor, Federal Reserve Bank of Richmond
Byron Lutz, Deputy Associate Director, Division of Research and Statistics, Board
Mark Meder, First Vice President, Federal Reserve Bank of Cleveland
Ann E. Misback, Secretary, Office of the Secretary, Board
Michelle M. Neal, Head of Markets, Federal Reserve Bank of New York
Edward Nelson, Senior Adviser, Division of Monetary Affairs, Board
Lubomir Petrasek,4 Section Chief, Division of Monetary Affairs, Board
Achilles Sangster II, Senior Information Manager, Division of Monetary Affairs, Board
Adam H. Shapiro, Vice President, Federal Reserve Bank of San Francisco
Shane M. Sherlund, Associate Director, Division of Research and Statistics, Board
Nitish Ranjan Sinha, Special Adviser to the Board, Division of Board Members, Board
Balint Szoke, Senior Economist, Division of Monetary Affairs, Board
Giorgio Topa, Economic Research Advisor, Federal Reserve Bank of New York
Clara Vega, Special Adviser to the Board, Division of Board Members, Board
Annette Vissing-Jørgensen, Senior Adviser, Division of Monetary Affairs, Board
Jeffrey D. Walker,2 Associate Director, Division of Reserve Bank Operations and Payment Systems, Board
Paul R. Wood, Special Adviser to the Board, Division of Board Members, Board
Egon Zakrajsek, Executive Vice President, Federal Reserve Bank of Boston
Rebecca Zarutskie, Special Adviser to the Board, Division of Board Members, Board
Developments in Financial Markets and Open Market Operations
The manager turned first to a review of developments in financial markets over the intermeeting period. Financial conditions eased, driven by a decline in interest rates, an increase in equity prices, and a depreciation in the dollar. The rise in equity prices was supported by the decline in Treasury yields and by earnings growth that exceeded consensus expectations. Implied volatility for equities diminished notably. The easing in financial conditions reversed some of the tightening that occurred over the summer and much of the fall.
Yields on nominal Treasury securities declined sharply over the intermeeting period—more so at longer maturities—after having increased notably during the previous intermeeting period, as investors appeared to interpret incoming data as reducing risks of prolonged inflation pressures. In addition, market participants interpreted communications from FOMC participants as solidifying the view that the Committee's policy rate may be at its peak. Early in the period, the market also reacted to communications from the Treasury Department indicating that issuance of Treasury securities was likely to be more skewed toward shorter-dated maturities than previously expected. Models, on average, suggested that about two-thirds of the decline in longer-term yields on Treasury securities over the period was attributable to a reduction in term premiums and about one-third to a decline in expectations for the policy rate. Pricing of inflation derivatives over the intermeeting period suggested that investors had become more optimistic about the near-term outlook for inflation.
The manager turned next to expectations for monetary policy. Respondents to the Open Market Desk's Survey of Primary Dealers and Survey of Market Participants largely converged around the view that the peak level of the federal funds rate for this tightening cycle had been reached. The modal path from the Desk surveys suggested that the first reduction in the policy rate would occur in June, unchanged from the October surveys. The average path for the policy rate implied by market pricing shifted down considerably over the period.
Regarding developments in money markets and Desk operations, usage of the overnight reverse repurchase agreement (ON RRP) facility continued to fall over the period; take-up at the facility had dropped about $1.3 trillion since early June. The decline was again driven primarily by lower participation by money market mutual funds, as such funds found it more attractive to invest in Treasury bills and, increasingly, the private market for repurchase agreement (repo) transactions.
Overnight repo rates continued to experience some modest upward pressure over the period. As reflected by a rise in the Secured Overnight Financing Rate, there was some tightening of conditions in repo markets in late November and early December in response to typical lending dynamics around month-end, the settlement of a large amount of Treasury issuance, and increased demand for Treasury financing. The market absorbed this episode well.
The manager expected that private-market repo rates would likely remain above the rate offered at the ON RRP facility, which should continue to induce a reduction in usage of the facility. Respondents to the Desk surveys again reduced their expectations for the trajectory for ON RRP balances and correspondingly raised their expectations for the trajectory of reserve balances. Aggregate reserves across the banking system remained abundant, and no signs of pressures were evident. As part of their ongoing market surveillance, the staff will continue to monitor a wide range of indicators of money market conditions, including the composition of borrowers in money markets, borrowing demand for various sources of liquidity, the distribution of reserve balances across the financial system, the pricing of money market investments relative to the Federal Reserve's administered rates, and the sensitivity of money market rates to changes in aggregate reserves.
By unanimous vote, the Committee ratified the Desk's domestic transactions over the intermeeting period. There were no intervention operations in foreign currencies for the System's account during the intermeeting period.
Staff Review of the Economic Situation
The data available at the time of the December 12–13 meeting suggested that growth in U.S. real gross domestic product (GDP) was slowing from its strong third-quarter pace. Labor market conditions continued to be tight, with moderating but still-strong job gains and a low unemployment rate. Consumer price inflation had eased over the past year but remained elevated.
Labor demand and supply continued to move gradually into better alignment. Total nonfarm payroll employment expanded at a slower pace, on balance, over October and November than its average monthly rate in the third quarter. The unemployment rate was little changed, on net, and stood at 3.7 percent in November, the same as its third-quarter average. The labor force participation rate was essentially flat over the past two months, remaining above its level early in the year, while the employment-to-population ratio rose slightly on balance. The unemployment rates for African Americans and for Hispanics were little changed, and both rates were higher than those for Asians and for Whites. The job openings rate continued to trend down, and the quits rate was flat; both rates were below their levels earlier this year. The lessening of labor market imbalances was apparent in recent wage data, as the 12‑month change in average hourly earnings for all employees was well below its year-earlier level and the Wage Growth Tracker constructed by the Federal Reserve Bank of Atlanta was trending down and lower than a year ago.
Consumer price inflation remained elevated but continued to show notable signs of easing. The price index for total personal consumption expenditures (PCE) increased 3.0 percent over the 12 months ending in October, while core PCE inflation—which excludes changes in energy prices and many consumer food prices—was 3.5 percent over the same period; both total and core PCE inflation were well below their year-earlier levels. The six-month change measures of total and core PCE inflation in October were each 2.5 percent, down from their levels six months earlier. The trimmed mean measure of 12-month PCE inflation constructed by the Federal Reserve Bank of Dallas was 3.6 percent in October, also down from its level a year ago. In November, the 12-month change in the consumer price index (CPI) was 3.1 percent, core CPI rose 4.0 percent over the same period, and both measures were well below their year-earlier levels. Recent survey measures of medium- to longer-term inflation expectations were in the range seen in the decade before the pandemic. In contrast, survey measures of consumers' short-run inflation expectations remained above their pre-pandemic levels.
Available indicators suggested that real GDP growth was slowing from its strong third-quarter pace, which had been led by a sizable increase in consumer spending. In October, PCE growth slowed from its average monthly rate in the third quarter. As for business investment, nominal shipments of nondefense capital goods excluding aircraft were essentially flat in October, although nonresidential construction spending by businesses edged up. Residential housing starts moved mostly sideways, and home sales continued to fall. Manufacturing production declined in October, and factory output was weak, even after excluding the decrease in motor vehicle assemblies caused by the autoworkers' strike. The nominal trade deficit widened in October, as exports declined and imports rose slightly.
Foreign economic growth slowed in the third quarter, and available indicators pointed to subdued growth in the fourth quarter. The significant tightening of monetary policy by foreign central banks over the past two years and the repercussions of last year's energy shock in Europe continued to weigh on foreign economic activity. Chinese economic indicators, such as retail sales and industrial production, pointed to economic growth remaining modest. By contrast, economic activity in Asia excluding China stepped up, supported in part by a recovery in industrial production, especially in the high-tech sector.
While inflation was still elevated in most major economies, incoming data indicated that it had moved down markedly. These decreases reflected notable step-downs in both energy and core inflation amid slowing aggregate demand and declines in oil prices. Most major foreign central banks kept their policy rates unchanged over the intermeeting period and emphasized the need to maintain a sufficiently restrictive stance of policy to ensure that inflation fell back to their targets.
Staff Review of the Financial Situation
Over the intermeeting period, some softer-than-expected data releases appeared to lessen the perception among investors that policy may need to tighten further in order to bring inflation down to 2 percent over time. Market participants also viewed monetary policy communications, on balance, as pointing to somewhat less restrictive policy than expected. As a result, nominal Treasury yields declined significantly and the expected market-implied path for the federal funds rate beyond the next few months shifted downward. Meanwhile, broad equity price indexes were boosted by many of the same factors that lowered Treasury yields, and spreads on investment- and speculative-grade corporate bonds narrowed. Financing conditions remained moderately restrictive, as borrowing costs remained elevated despite declining over the intermeeting period.
The market-implied path for the federal funds rate beyond the next few months moved down notably over the intermeeting period. A straight read of federal funds futures rates suggested that market participants expected the federal funds rate to be 25 basis points below its current level by the May 2024 FOMC meeting, two meetings earlier than at the time of the October–November FOMC meeting. The policy rate path implied by overnight index swap quotes moved down 45 basis points to 4.2 percent by the end of 2024. Similarly, nominal Treasury yields declined significantly. The decline in nominal yields mostly reflected a decrease in real yields, while measures of inflation compensation were moderately lower, on net, amid softer-than-expected data releases. Measures of uncertainty about the path of interest rates decreased notably, consistent with the tempering of concerns about inflation, but remained elevated by historical standards.
Broad stock price indexes increased markedly over the intermeeting period, and spreads on investment-grade bonds narrowed moderately, while those on speculative-grade corporate bonds declined more notably. The one-month option-implied volatility on the S&P 500 decreased moderately and reached its lowest level since January 2020.
Spillovers from falling U.S. yields, below-expectations readings on global inflation, and oil price drops led to large declines in foreign yields. These declines were accompanied by an improvement in market sentiment, with foreign equity prices increasing, foreign credit spreads narrowing, and outflows from funds investing in emerging market economies slowing notably. The improvement in sentiment and declines in U.S. yields contributed to a broad depreciation of the foreign exchange value of the dollar.
Conditions in U.S. short-term funding markets remained largely stable over the intermeeting period. Usage of the ON RRP facility continued to decline over the period. The decline in usage primarily reflected money market mutual funds reallocating their assets to Treasury bills and private-market repo, which offered slightly more attractive market rates relative to the ON RRP rate amid continued increases in net Treasury bill issuance and Federal Reserve balance sheet reduction. Banks' total deposit levels were roughly unchanged over the intermeeting period, as outflows of core deposits were about offset by inflows of large time deposits.
In domestic credit markets, borrowing costs for most businesses, households, and municipalities declined over the intermeeting period, reflecting both lower longer-maturity Treasury yields and narrower credit spreads, although borrowing costs remained significantly elevated. Rates on loans to households, including those for 30-year conforming residential mortgages and new auto loans, declined over the intermeeting period, while interest rates on commercial and industrial (C&I) loans and small business loans were little changed. Yields on corporate bonds fell more than Treasury yields, particularly for speculative-grade bonds.
Bank credit conditions appeared to tighten somewhat over the intermeeting period, but credit to businesses and households generally remained accessible. C&I loan balances contracted through November, on balance, while expansion of commercial real estate (CRE) loans stepped down appreciably across most categories from an already moderating pace in the third quarter.
Credit remained available for most consumers, although consumer credit flows softened in recent months. Growth of credit card balances moderated significantly through November from the brisk pace seen in the summer. For residential real estate borrowers, credit availability was little changed. Credit conditions for small businesses appeared to have tightened further in recent months. Data from the Federal Reserve's Small Business Lending Survey showed that originations had been roughly flat since mid-2022 before ticking down in the third quarter. Credit continued to be generally accessible through capital markets, although issuance was slow in many markets, including those for corporate bonds, leveraged loans, and agency and non-agency commercial mortgage-based securities (CMBS).
Credit quality remained broadly solid but deteriorated further for some sectors in recent months. Delinquency rates on nonfarm nonresidential CRE bank loans rose further in the third quarter, and delinquency rates for construction and land development as well as multifamily loans ticked up. After increases over the first three quarters of the year, delinquency rates for loans in CMBS pools edged lower in October, but the large volume of loans scheduled to mature over the next few quarters suggested that delinquencies would likely surge again. The delinquency rate for small business loans continued to tick up in September and was above levels observed just before the pandemic. Credit card delinquency rates also increased further, while delinquency rates on auto loans were little changed in the third quarter. The trailing default rates for investment- and speculative-grade corporate bonds were little changed on net, and the trailing default rate for leveraged loans increased a bit.
Staff Economic Outlook
The economic forecast prepared by the staff for the December meeting was broadly similar to the projection for the previous meeting. The staff continued to expect that GDP growth would slow markedly in the fourth quarter from its outsized third-quarter rate but that economic growth for 2023 as a whole would still be solid. The lagged effects of earlier monetary policy actions, through their contributions to continued tight financial and credit conditions, were expected to show through more fully in restraining economic activity in the coming years. Real GDP was projected to increase more slowly than the staff's estimate of potential over the next two years before rising in line with potential in 2026. The unemployment rate was expected to be roughly flat through 2026 as the effects of below-potential output growth were offset by the effects of further improvements in labor market functioning.
The staff revised down their inflation forecast, reflecting lower-than-expected incoming data—including the November CPI and producer price index—and their judgment that inflation would be less persistent than in the previous projection. Measured on a four-quarter change basis, total PCE price inflation was expected to be somewhat below 3 percent this year, with core PCE price inflation somewhat above 3 percent. Inflation was projected to move lower in coming years as demand and supply in product and labor markets moved into better alignment; by 2026, total and core PCE price inflation were expected to be close to 2 percent.
The staff continued to view uncertainty around the baseline projection as elevated, although they observed that the volatility of incoming data and staff forecast errors generally had become less pronounced over the past year. Risks around the inflation forecast were seen as skewed to the upside, given that inflation was still elevated and the possibility that inflation might prove to be more persistent than expected or that adverse shocks to supply conditions might occur. The risks around the forecast for economic activity were viewed to be tilted to the downside. In particular, the additional monetary policy tightening that could be put in place if upside inflation risks were to materialize, with the potential for a greater tightening of financial conditions, represented a downside risk to the projection for economic activity.
Participants' Views on Current Conditions and the Economic Outlook
In conjunction with this FOMC meeting, participants submitted their projections of the most likely outcomes for real GDP growth, the unemployment rate, and inflation for each year from 2023 through 2026 and over the longer run. The projections were based on their individual assessments of appropriate monetary policy, including the path of the federal funds rate. The longer-run projections represented each participant's assessment of the rate to which each variable would be expected to converge, over time, under appropriate monetary policy and in the absence of further shocks to the economy. A Summary of Economic Projections (SEP) was released to the public following the conclusion of the meeting.
In their discussion of current economic conditions, participants observed that after stronger than expected growth of real GDP in the third quarter, recent indicators suggested that growth in economic activity had slowed. While still strong, job gains had moderated since earlier this year, and the unemployment rate had remained low. Participants observed that inflation had eased over the past year but remained elevated and above the Committee's longer-run goal of 2 percent.
Regarding the economic outlook, participants generally judged that, in 2024, real GDP growth would cool and that rebalancing of the labor market would continue, with the unemployment rate rising somewhat from its current level. Based on better-than-expected data on inflation, participants revised down their inflation projections for 2023 and, to a lesser extent, in subsequent years. Participants judged that the current stance of monetary policy was restrictive and appeared to be restraining economic activity and inflation. In light of the policy restraint in place, along with more favorable data on inflation, participants generally viewed risks to inflation and employment as moving toward greater balance. However, participants remained highly attentive to inflation risks.
In their discussion of inflation, all participants observed that clear progress had been made in 2023 toward the Committee's 2 percent inflation objective. They remained concerned that elevated inflation continued to harm households, especially those with limited means to absorb higher prices. Participants observed that inflation remained above the Committee's objective and that they would need to see more evidence that inflation pressures were abating to become confident in a sustained return of inflation to 2 percent.
In reviewing progress to date in reducing inflation, participants noted the improvement in both headline and core inflation and discussed the developments in components of these aggregate measures. They observed that progress had been uneven across components, with energy and core goods prices falling or changing little recently, but core services prices still increasing at an elevated pace. Several participants observed that the ongoing rebalancing of labor supply and demand would help reduce core services inflation. Several participants assessed that housing services inflation would fall further over time as the earlier deceleration in rents on new leases continued to pass through to broader rent measures. Participants also discussed the role played by various supply and demand factors in the progress on reducing inflation thus far. They assessed that the contribution of improved supply had come from supply chain normalization, boosts to labor supply due to a higher labor force participation rate and immigration, better productivity growth, or increased domestic oil production. They also noted that restrictive monetary policy had helped restrain growth of demand, particularly in interest-sensitive sectors such as business fixed investment, housing, and autos and other durable goods. Several participants assessed that healing in supply chains and labor supply was largely complete, and therefore that continued progress in reducing inflation may need to come mainly from further softening in product and labor demand, with restrictive monetary policy continuing to play a central role. A few others saw potential for further improvements in supply. Several participants noted that longer-term inflation expectations remained well anchored and that near-term inflation expectations of households had declined recently.
In their comments about the household sector, participants observed that consumer spending had been strong, supported by the healthy balance sheets of many households, a strong labor market, and robust income growth. Retail sales growth had stepped down noticeably in October, though a few participants remarked that contacts reported strong sales in November, notably related to holiday spending. Participants mentioned several factors that may contribute to softer consumer spending, including slower growth of labor income and diminishing pandemic-related excess savings. Relatedly, many participants noted increased usage of credit by households, including from credit cards, buy-now-pay-later borrowing, and payday loans, as well as increased delinquency rates for many types of consumer loans.
Reports from participants' business-sector contacts were mixed, with some contacts remaining relatively optimistic and others expecting slower growth for 2024. Several participants observed that higher interest rates were leading firms to reassess future projects and were contributing to softer business investment and hiring. A couple of participants commented on small businesses, noting that such businesses were experiencing tighter credit conditions and increasing delinquencies. A few participants noted that contacts in manufacturing reported slowing growth, while a couple of participants expected that low prices for some commodities and drought conditions would reduce agricultural incomes this year. Regarding concerns about CRE, several participants noted that a significant share of properties would need to be refinanced in 2024 against a backdrop of higher interest rates, continued weakness in the office sector, and balance sheet pressures faced by some lenders.
Participants assessed that while the labor market remained tight, it continued to come into better balance. Many noted that nominal wage growth had continued to slow broadly and that business contacts expected a further reduction in wage growth. A few participants observed that payroll growth had slowed substantially since the beginning of the year. Some participants remarked that their contacts reported larger applicant pools for vacancies, and some participants highlighted that the ratio of vacancies to unemployed workers had declined to a value only modestly above its level just before the pandemic. Participants viewed improvements in labor supply and the easing of labor demand as both having contributed to the labor market coming into better balance. Supply had improved because of higher labor force participation and immigration, with continued solid productivity growth also supporting the productive capacity of the economy. As evidence for the softening of the growth of labor demand during 2023, many participants noted the decline in job openings, and a few remarked on the lower quits rate. Several participants noted the risk that, if labor demand were to weaken substantially further, the labor market could transition quickly from a gradual easing to a more abrupt downshift in conditions.
Participants generally perceived a high degree of uncertainty surrounding the economic outlook. As an upside risk to both inflation and economic activity, participants noted that the momentum of economic activity may be stronger than currently assessed, possibly on account of the continued balance sheet strength of many households. Furthermore, participants observed that, after a sharp tightening since the summer, financial conditions had eased over the intermeeting period. Many participants remarked that an easing in financial conditions beyond what is appropriate could make it more difficult for the Committee to reach its inflation goal. Participants also noted other sources of upside risks to inflation, including possible effects on global energy and food prices of geopolitical developments, a potential rebound in core goods prices following the period of supply chain improvements, or the effects of nearshoring and onshoring activities on labor demand and inflation. Downside risks to economic activity noted by participants included the possibility that effects of past policy tightening may be larger than expected, the risk of a marked weakening of household balance sheets, possible negative spillovers from lower growth in some foreign economies, geopolitical risks, and lingering risks of further tightening in bank credit. Relatedly, several participants noted that the weakness in gross domestic income growth relative to GDP growth over the past few quarters may suggest that economic momentum during that period was not as strong as indicated by the GDP readings.
In their consideration of appropriate monetary policy actions at this meeting, participants noted that recent indicators suggested that growth of economic activity had slowed from its strong pace in the third quarter. Job gains had moderated since earlier in the year but remained strong, the unemployment rate had remained low, and there were continuing signs that supply and demand in the labor market were coming into better balance. Inflation had eased over the past year but remained elevated. Participants also noted that tighter financial and credit conditions facing households and businesses would likely weigh on economic activity, hiring, and inflation, although the extent of these effects remained uncertain. Participants continued to be resolute in their commitment to bring inflation down to the Committee's 2 percent objective.
In light of current economic conditions and their implications for the outlook for economic activity and inflation, as well as the balance of risks, all participants judged it appropriate to maintain the target range for the federal funds rate at 5-1/4 to 5-1/2 percent at this meeting. All participants also agreed that it was appropriate to continue the process of reducing the Federal Reserve's securities holdings, as described in the previously announced Plans for Reducing the Size of the Federal Reserve's Balance Sheet.
Participants assessed that maintaining the current policy stance was supported by intermeeting data indicating that inflation had continued to move toward the Committee's 2 percent objective and that the labor market had continued to move into better balance. They judged that maintaining the target range for the federal funds rate at this meeting would promote further progress toward the Committee's goals and allow participants more time to gather additional information to evaluate this progress.
In discussing the policy outlook, participants viewed the policy rate as likely at or near its peak for this tightening cycle, though they noted that the actual policy path will depend on how the economy evolves. Participants pointed to the decline in inflation seen during 2023, noting the recent shift down in six-month inflation readings in particular, and to growing signs of demand and supply coming into better balance in product and labor markets as informing that view. Several participants remarked that the Committee's past policy actions were having their intended effect of helping to slow the growth of aggregate demand and cool labor market conditions. They judged that, in combination with improvements in the supply situation, these developments were helping to bring inflation back to 2 percent over time. Most participants noted that, as indicated in their submissions to the SEP, they expected the Committee's restrictive policy stance to continue to soften household and business spending, helping to promote further reductions in inflation over the next few years.
In their submitted projections, almost all participants indicated that, reflecting the improvements in their inflation outlooks, their baseline projections implied that a lower target range for the federal funds rate would be appropriate by the end of 2024. Participants also noted, however, that their outlooks were associated with an unusually elevated degree of uncertainty and that it was possible that the economy could evolve in a manner that would make further increases in the target range appropriate. Several also observed that circumstances might warrant keeping the target range at its current value for longer than they currently anticipated. Participants generally stressed the importance of maintaining a careful and data-dependent approach to making monetary policy decisions and reaffirmed that it would be appropriate for policy to remain at a restrictive stance for some time until inflation was clearly moving down sustainably toward the Committee's objective.
Participants discussed several risk-management considerations that could bear on future policy decisions. Participants saw upside risks to inflation as having diminished but noted that inflation was still well above the Committee's longer-run goal and that a risk remained that progress toward price stability would stall. A number of participants highlighted the uncertainty associated with how long a restrictive monetary policy stance would need to be maintained, and pointed to thedownside risks to the economy that would be associated with an overly restrictive stance. A few suggested that the Committee potentially could face a tradeoff between its dual-mandate goals in the period ahead.
Participants observed that the continuing process of reducing the size of the Federal Reserve's balance sheet was an important part of the Committee's overall approach to achieving its macroeconomic objectives and that balance sheet runoff had so far proceeded smoothly. Several participants noted that, amid the ongoing balance sheet normalization, there had been a further decline over the intermeeting period in use of the ON RRP facility and that this reduced usage largely reflected portfolio shifts by money market mutual funds toward higher-yielding investments, including Treasury bills and private-market repo. Several participants remarked that the Committee's balance sheet plans indicated that it would slow and then stop the decline in the size of the balance sheet when reserve balances are somewhat above the level judged consistent with ample reserves. These participants suggested that it would be appropriate for the Committee to begin to discuss the technical factors that would guide a decision to slow the pace of runoff well before such a decision was reached in order to provide appropriate advance notice to the public.
Committee Policy Actions
In their discussions of monetary policy for this meeting, members agreed that recent indicators suggested that growth of economic activity had slowed from its strong pace in the third quarter. Job gains had moderated since earlier in the year but remained strong, and the unemployment rate had remained low. Inflation had eased over the past year but remained elevated.
Members concurred that the U.S. banking system was sound and resilient. They also agreed that tighter financial and credit conditions for households and businesses were likely to weigh on economic activity, hiring, and inflation but that the extent of these effects was uncertain. Members agreed that they remained highly attentive to inflation risks.
In support of the Committee's objective to achieve maximum employment and inflation at the rate of 2 percent over the longer run, members agreed to maintain the target range for the federal funds rate at 5-1/4 to 5-1/2 percent. They also agreed that they would continue to assess additional information and its implications for monetary policy. In determining the extent of any additional policy firming that may be appropriate to return inflation to 2 percent over time, members concurred that they would take into account the cumulative tightening of monetary policy, the lags with which monetary policy affects economic activity and inflation, and economic and financial developments. In addition, members agreed to continue to reduce the Federal Reserve's holdings of Treasury securities and agency debt and agency mortgage-backed securities, as described in its previously announced plans. All members affirmed their strong commitment to returning inflation to their 2 percent objective.
Members agreed that, in assessing the appropriate stance of monetary policy, they would continue to monitor the implications of incoming information for the economic outlook. They would be prepared to adjust the stance of monetary policy as appropriate if risks emerge that could impede the attainment of the Committee's goals. Members also agreed that their assessments would take into account a wide range of information, including readings on labor market conditions, inflation pressures and inflation expectations, and financial and international developments.
Members agreed that their postmeeting statement should acknowledge the slowing of economic activity from its strong pace in the third quarter as well as the fact that inflation had eased over the past year but remained elevated. Members also agreed to modify the sentence in their postmeeting statement discussing the considerations relevant for future policy actions to indicate that the Committee would determine "the extent of any additional policy firming that may be appropriate to return inflation to 2 percent over time." Members generally viewed the addition of the word "any" to this sentence as appropriately relaying their judgment that the target range for the federal funds rate was likely now at or near its peak for this policy tightening cycle while leaving open the possibility of further increases in the target range if these were warranted by the totality of the incoming data, the evolving outlook, and the balance of risks.
At the conclusion of the discussion, the Committee voted to direct the Federal Reserve Bank of New York, until instructed otherwise, to execute transactions in the System Open Market Account in accordance with the following domestic policy directive, for release at 2:00 p.m.:
"Effective December 14, 2023, the Federal Open Market Committee directs the Desk to:
- Undertake open market operations as necessary to maintain the federal funds rate in a target range of 5-1/4 to 5-1/2 percent.
- Conduct standing overnight repurchase agreement operations with a minimum bid rate of 5.5 percent and with an aggregate operation limit of $500 billion.
- Conduct standing overnight reverse repurchase agreement operations at an offering rate of 5.3 percent and with a per-counterparty limit of $160 billion per day.
- Roll over at auction the amount of principal payments from the Federal Reserve's holdings of Treasury securities maturing in each calendar month that exceeds a cap of $60 billion per month. Redeem Treasury coupon securities up to this monthly cap and Treasury bills to the extent that coupon principal payments are less than the monthly cap.
- Reinvest into agency mortgage-backed securities (MBS) the amount of principal payments from the Federal Reserve's holdings of agency debt and agency MBS received in each calendar month that exceeds a cap of $35 billion per month.
- Allow modest deviations from stated amounts for reinvestments, if needed for operational reasons.
- Engage in dollar roll and coupon swap transactions as necessary to facilitate settlement of the Federal Reserve's agency MBS transactions."
The vote also encompassed approval of the statement below for release at 2:00 p.m.:
"Recent indicators suggest that growth of economic activity has slowed from its strong pace in the third quarter. Job gains have moderated since earlier in the year but remain strong, and the unemployment rate has remained low. Inflation has eased over the past year but remains elevated.
The U.S. banking system is sound and resilient. Tighter financial and credit conditions for households and businesses are likely to weigh on economic activity, hiring, and inflation. The extent of these effects remains uncertain. The Committee remains highly attentive to inflation risks.
The Committee seeks to achieve maximum employment and inflation at the rate of 2 percent over the longer run. In support of these goals, the Committee decided to maintain the target range for the federal funds rate at 5-1/4 to 5-1/2 percent. The Committee will continue to assess additional information and its implications for monetary policy. In determining the extent of any additional policy firming that may be appropriate to return inflation to 2 percent over time, the Committee will take into account the cumulative tightening of monetary policy, the lags with which monetary policy affects economic activity and inflation, and economic and financial developments. In addition, the Committee will continue reducing its holdings of Treasury securities and agency debt and agency mortgage-backed securities, as described in its previously announced plans. The Committee is strongly committed to returning inflation to its 2 percent objective.
In assessing the appropriate stance of monetary policy, the Committee will continue to monitor the implications of incoming information for the economic outlook. The Committee would be prepared to adjust the stance of monetary policy as appropriate if risks emerge that could impede the attainment of the Committee's goals. The Committee's assessments will take into account a wide range of information, including readings on labor market conditions, inflation pressures and inflation expectations, and financial and international developments."
Voting for this action: Jerome H. Powell, John C. Williams, Michael S. Barr, Michelle W. Bowman, Lisa D. Cook, Austan D. Goolsbee, Patrick Harker, Philip N. Jefferson, Neel Kashkari, Adriana D. Kugler, Lorie K. Logan, and Christopher J. Waller.
Voting against this action: None.
Consistent with the Committee's decision to leave the target range for the federal funds rate unchanged, the Board of Governors of the Federal Reserve System voted unanimously to maintain the interest rate paid on reserve balances at 5.4 percent, effective December 14, 2023. The Board of Governors of the Federal Reserve System voted unanimously to approve the establishment of the primary credit rate at the existing level of 5.5 percent, effective December 14, 2023.
It was agreed that the next meeting of the Committee would be held on Tuesday–Wednesday, January 30–31, 2024. The meeting adjourned at 10:15 a.m. on December 13, 2023.
Notation Vote
By notation vote completed on November 20, 2023, the Committee unanimously approved the minutes of the Committee meeting held on October 31–November 1, 2023.
_______________________
Joshua Gallin
Secretary
1. The Federal Open Market Committee is referenced as the "FOMC" and the "Committee" in these minutes; the Board of Governors of the Federal Reserve System is referenced as the "Board" in these minutes. Return to text
2. Attended through the discussion of developments in financial markets and open market operations. Return to text
3. Attended through the discussion of the economic and financial situation. Return to text
4. Attended Tuesday's session only. Return to text
Gold Wave Analysis
- Gold reversed from resistance level 2075.00
- Likely to fall to support level 2016.00
Gold recently reversed down from the strong multi-month resistance level 2075.00 (which also stopped the earlier uptrend in March of 2023, as can be seen below).
The downward reversal from the resistance level 2075.00 stopped the earlier minor impulse wave iii.
Given the strength of the resistance level 2075.00 and the strongly bullish USD sentiment, Gold can be expected to fall further to the next support level 2016.00 (low of the previous correction ii).
USDCAD Wave Analysis
- USDCAD reversed from key support level 1.3200
- Likely to rise to resistance level 1.3400
USDCAD currency pair recently reversed up from the key support level 1.3200 (which reversed the price multiples times in the middle of 2023, as can be seen below).
The support level 1.3200 was further strengthened by the lower daily Bollinger Band and by the 38.2% Fibonacci correction of the upward impulse from 2021.
Given the strongly bullish dollar sentiment seen today, USDCAD can be expected to rise further to the next resistance level 1.3400 (former low of wave B from last year).