Sample Category Title
EURNZD Selling The Rallies At The Blue Box Area
Hello fellow traders. In this technical article we’re going to take a quick look at the Elliott Wave charts of EURNZD published in members area of the website. As our members know, the pair is showing incomplete bearish sequences in the cycle from the August 21st peak that are calling for more downside. The pair is targeting 1.7329 area ideally. Our team recommended members to avoid buying , while keep favoring the short side in the pair. Recently we got correction that reached our selling zone. The pair found sellers and made reaction from the blue box as expected. In the further text we are going to explain the Elliott Wave Forecast and trading strategy.
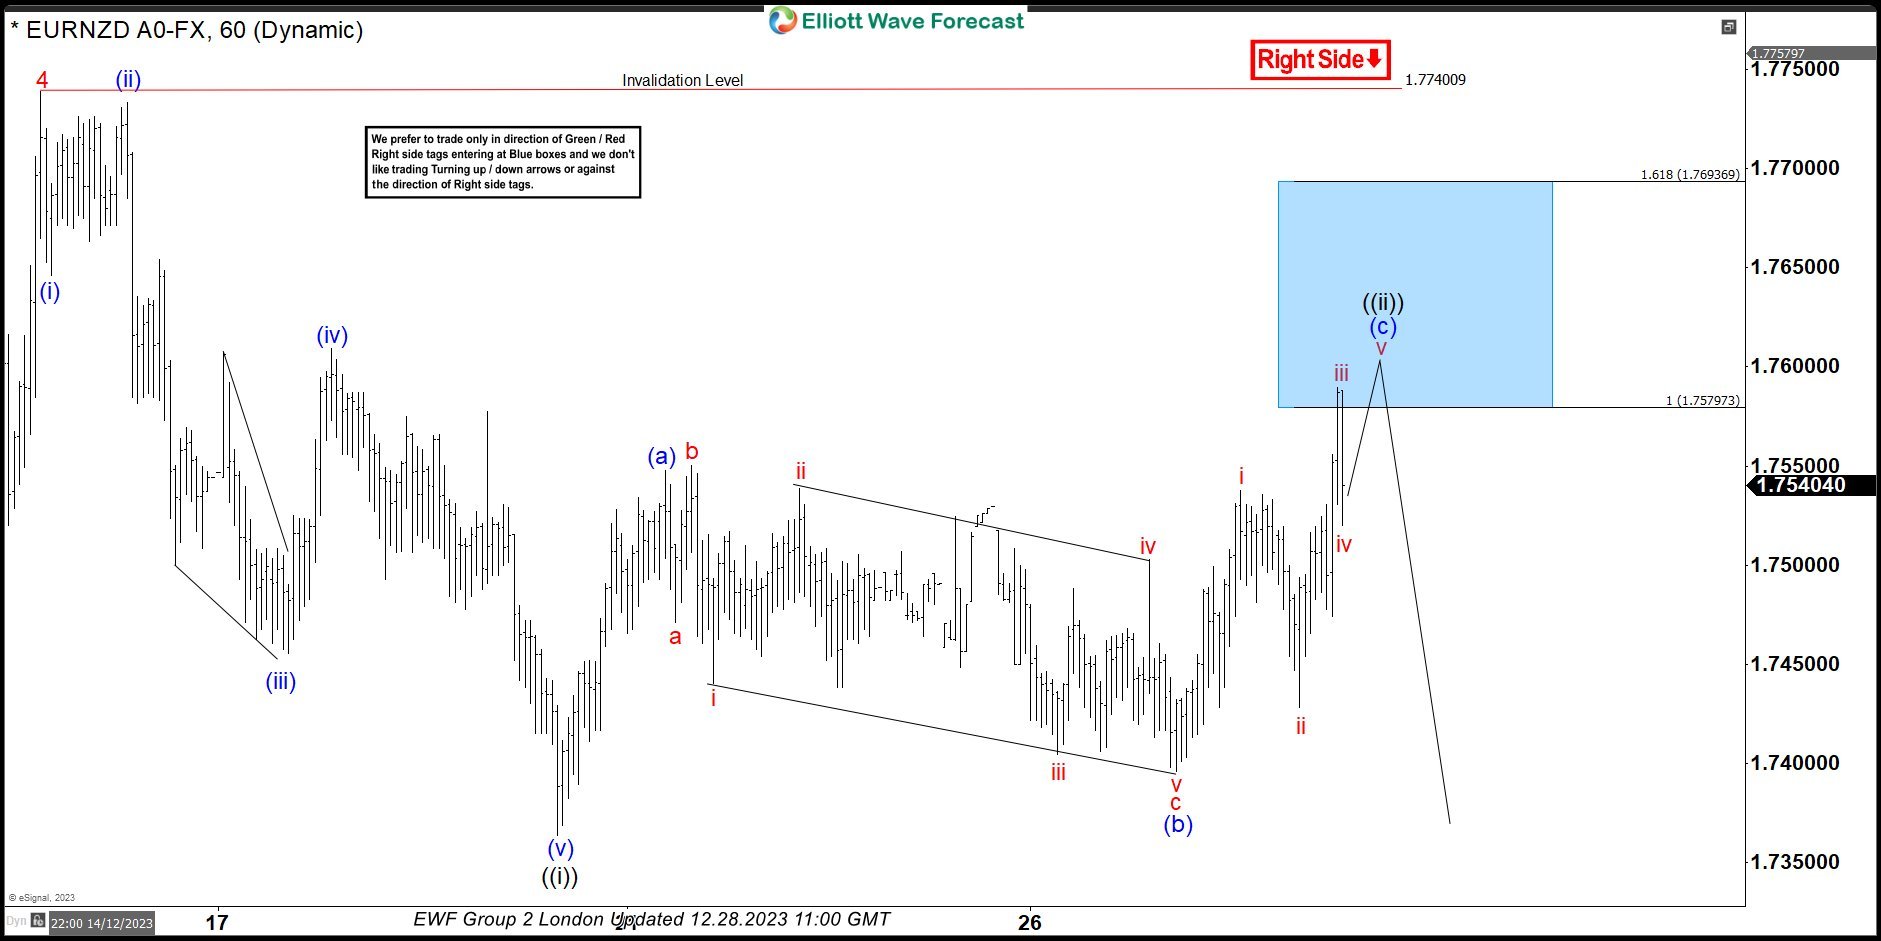
EURNZD Elliott Wave 1 Hour Chart 12.28.2023
The pair is giving us wave ((ii)) recovery which is correcting the cycle from the 1.774 peak. The price has reached extreme zone at 1.7579-1.7693 ( Blue Box – sellers zone). We don’t recommend buying the pair and prefer the short side from the blue box- equal legs zone. As the main trend is bearish, we expect to see at least 3 waves pull back from our selling zone. Once decline reaches 50 Fibs against the (b) blue low , we will make short position risk free ( put SL at BE) and take partial profits. Invalidation for the short trades is break of 1.618 fib ext : 1.7693
Quick reminder:
Our charts are easy to trade and understand:
Red bearish stamp+ blue box = Selling Setup
Green bullish stamp+ blue box = Buying Setup
Charts with Black stamps are not tradable. 🚫
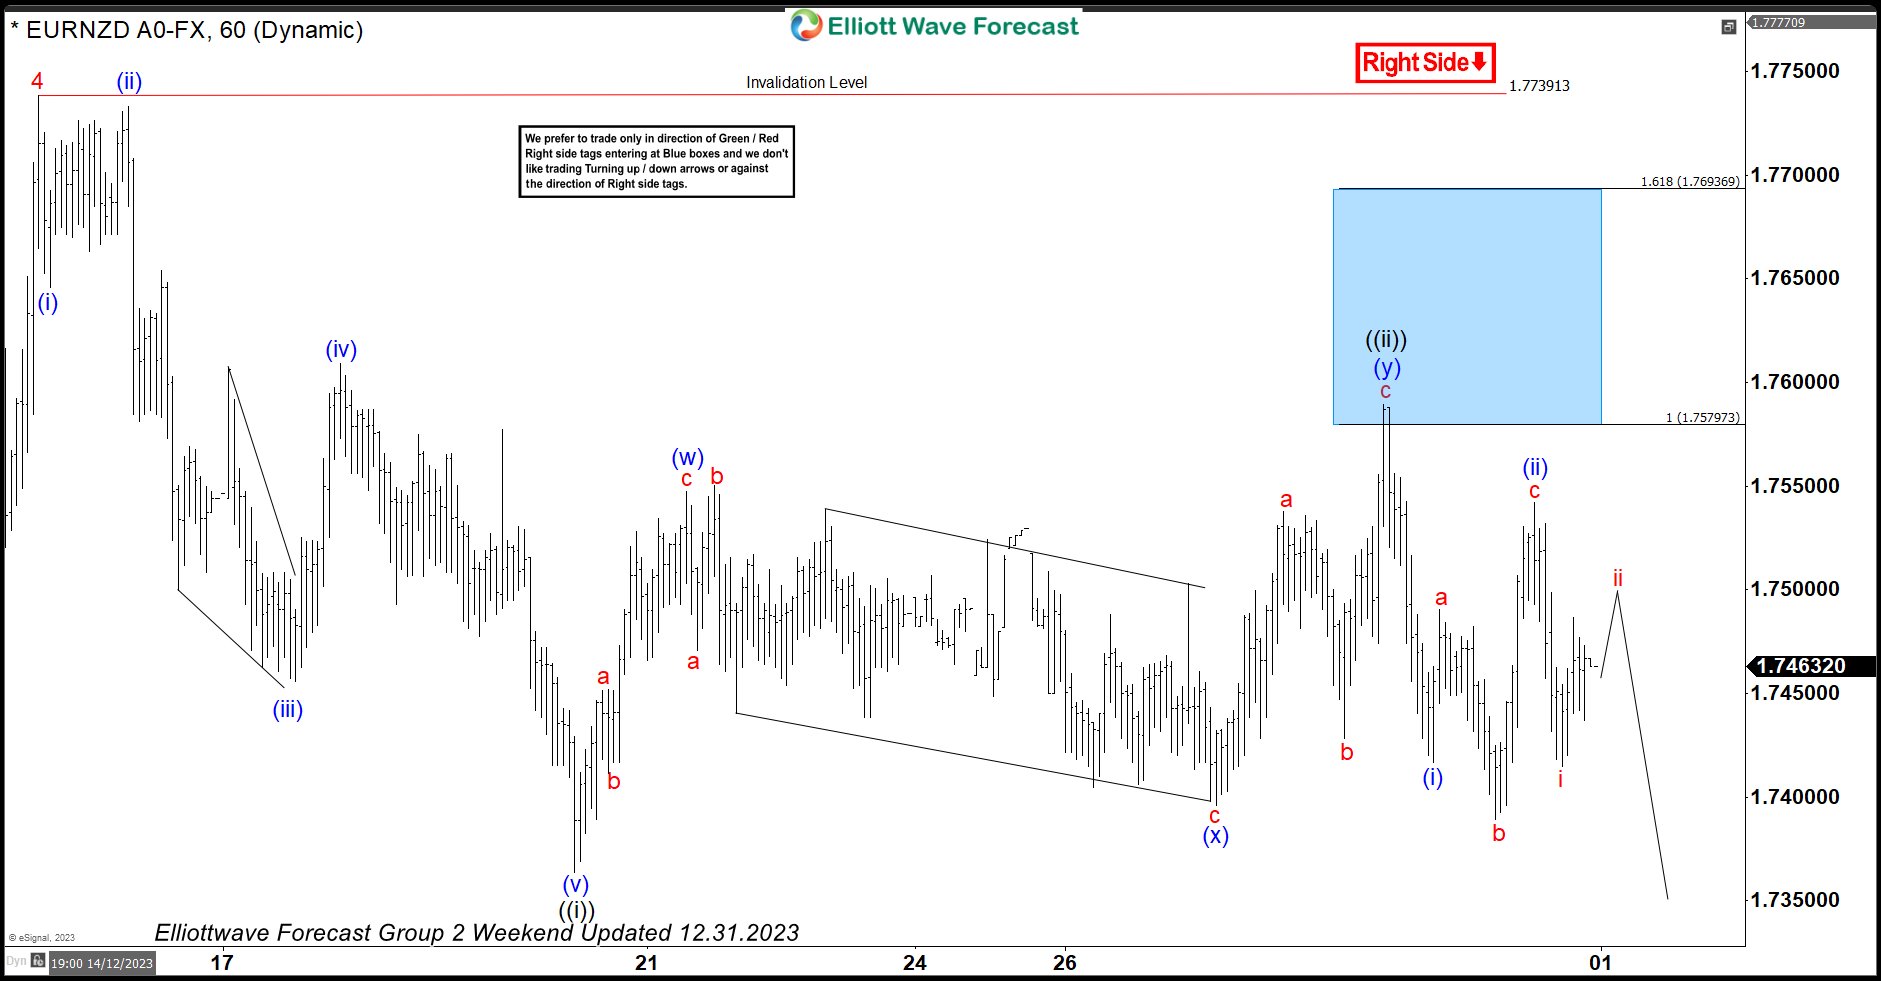
EURNZD Elliott Wave 1 Hour Chart 12.31.2023
The pair found sellers right at the Blue Box area : 1.7579-1.7693. Recovery completed at the 175.88 high and we are getting good reaction from the selling zone. Decline reached and exceeded 50 fibs against the connector’s low. So members who took the short trade are enjoying profits now in a risk free positions. While below 175.88 high, next leg down can be in progress toward new lows.
Could Euro Area CPIs Unsettle ECB Rate Cut Expectations?
- New year starts with the December inflation report testing ECB’s hawkishness
- Market looks for a sizeable pickup in CPI, creating doubt about the rate cuts priced in
- German CPI figure released on Thursday; the euro area aggregate on Friday 10:00 GMT
The new year starts on a rather high note
With market participants recovering from the well-earned festive break, 2024 starts on a rather high note. In the US, the labour market statistics could be a rough awakening for the sleepy market while in the euro area the preliminary inflation report for December could set the scene for an eventful month.
Taking a step back and at the last ECB meeting President Lagarde poured cold water over the aggressively dovish rate expectations. Armed with the latest staff projections pointing to core inflation remaining north of 2% in 2025, at 2.3% to be exact, Lagarde was quite clear that rate cuts were not discussed as the Governing Council needs more time to understand underlying wage developments.
Despite this hawkish appearance, the market is still pricing in 155bps rate cuts for 2024 with the first 25 bps rate move expected at the April 11 meeting. As a comparison, the market has pencilled in 151bps of easing this year by the Fed with the first rate cut seen at the May meeting, despite the obviously much stronger US economy.
With the Fed’s Powell opening the door for rate cuts in 2024, the rhetoric divergence allowed euro bulls to stage a good upmove and record a new 5-month high amidst a very low liquidity period. However, for this move to morph into a new medium-term trend, euro bulls need consistently stronger economic data releases going forward.
 Inflation report in the foreground again
Both the ECB and the market are clearly very interested in growth prospects, especially as the relevant data prints following the December ECB gathering were mixed. On Thursday, we will get the final print for the December Services PMI surveys, but the focus will also be on the preliminary inflation report for December.
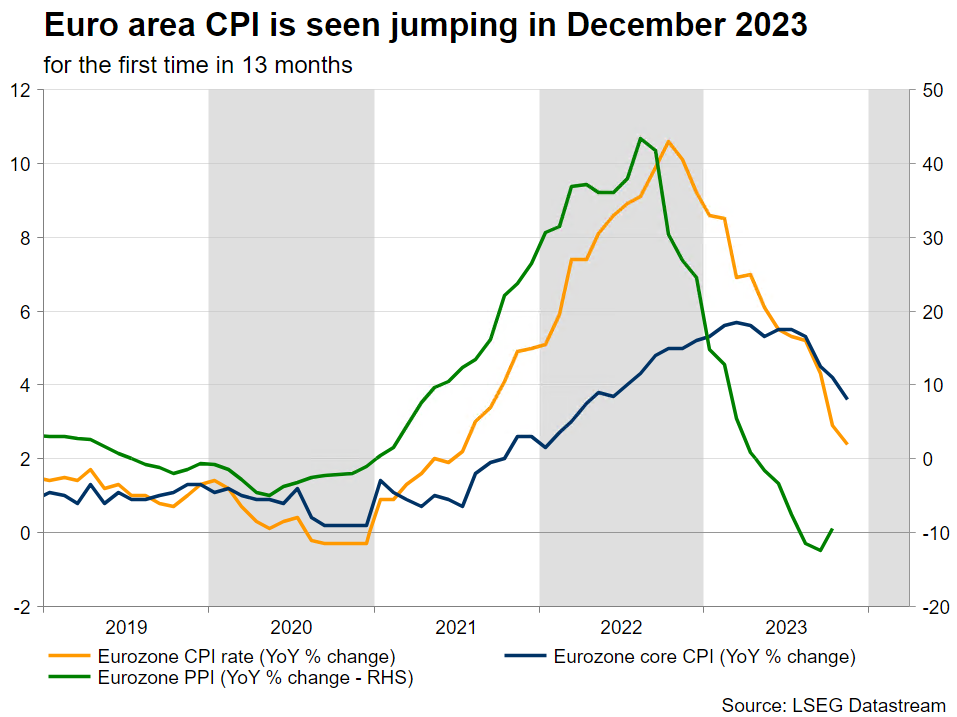
The German CPI details will be released on Thursday with the market expecting a strong 3.8% year-on-year print. This could be the first sizeable jump in headline inflation following the impressive slowdown from the record high 8.8% yearly change recorded in November 2022, just 13 months ago. Such an outcome could also confirm the repeated rhetoric from ECB officials that inflation could rebound in the first half of 2024.
The euro area inflation report is expected on Friday 10.00 GMT with headline CPI also seen jumping to a 3% year-on-year increase, from 2.4% in November. More importantly, the core indicator is expected to edge slightly lower to 3.5%, but with a low degree of confidence as market forecasts vary from 3.2% to 4%.
These inflation levels are still too high and inconsistent with a central bank on the brink of cutting rates. President Lagarde was quite clear that both core and domestic inflation prints have not been dropping as aggressively and as persistently as the headline figure due to wages, thus further complicating the ECB outlook for 2024.
Euro to benefit from a strong inflation report
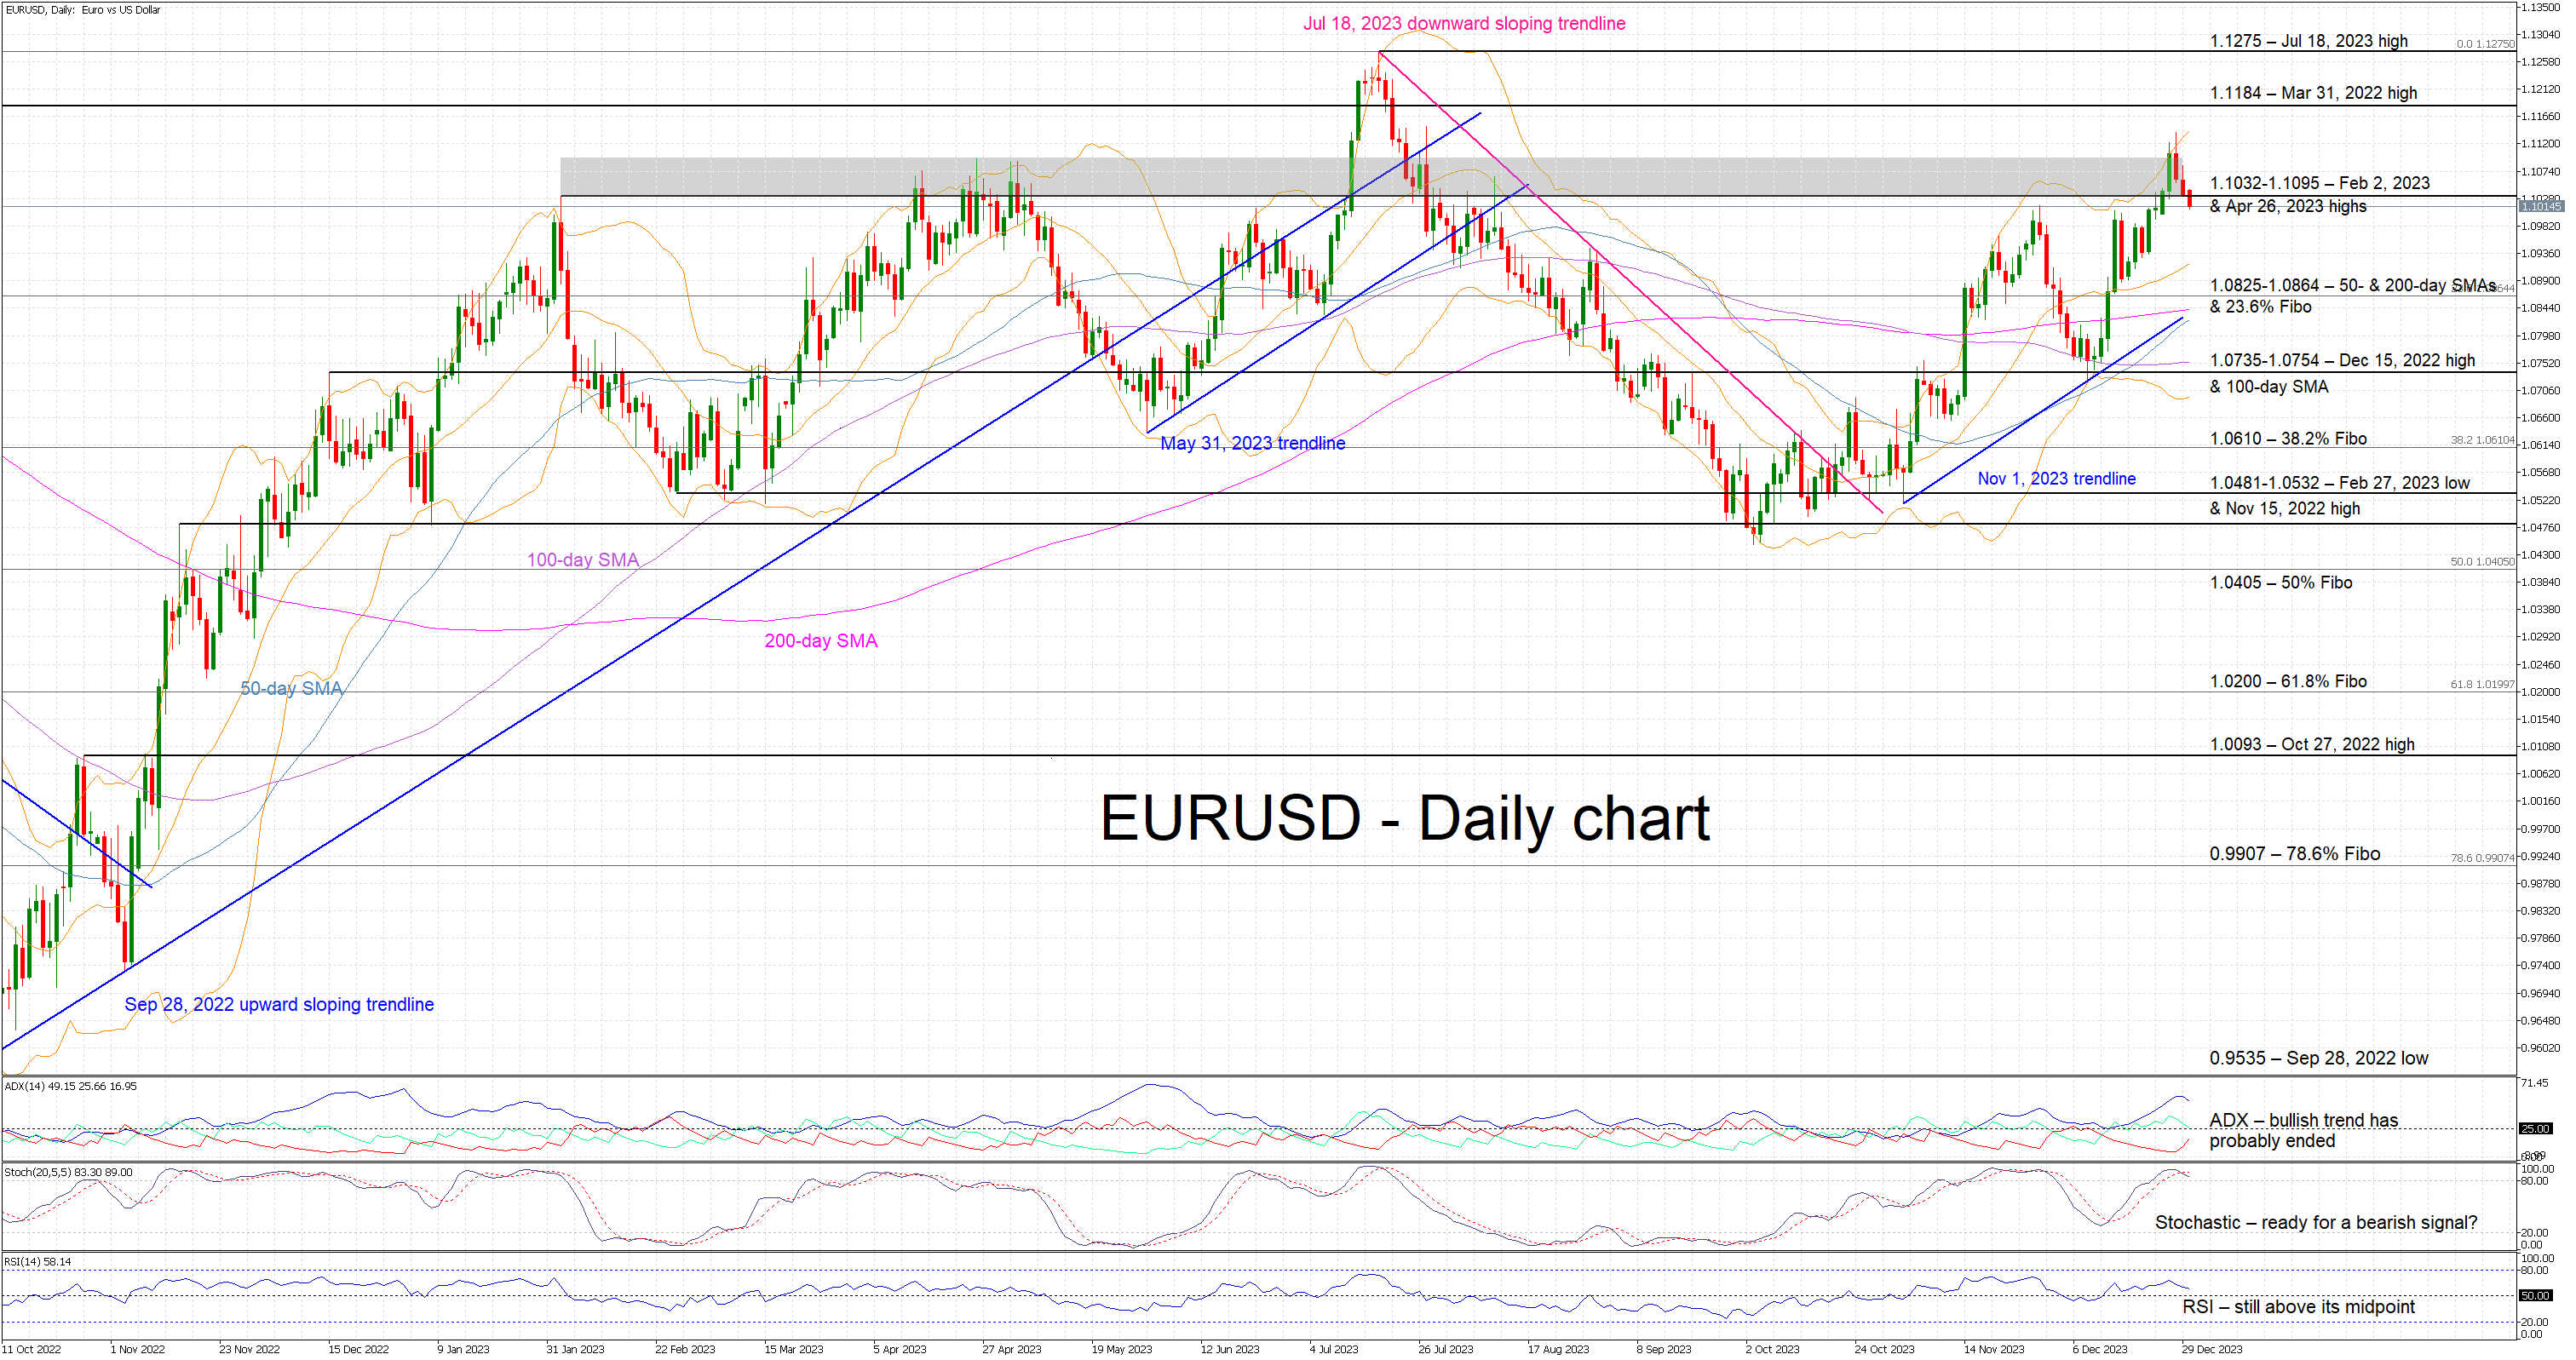
As already mentioned, the euro has been staging a decent rally against the US dollar since the October lows. It is currently trading at a key area, which has been making the bulls’ lives difficult since February 2023. An upside surprise at this week's inflation figure, especially at the core indicator, could add credence to President Lagarde’s rhetoric at the last ECB gathering. As such, we could see euro-dollar climbing even further, towards the 1.1184 level.
On the flip side, a weak set of data releases would support the ballooning dovish market expectations and potentially undermine the current euro-dollar rally. Euro bears could stage a decisive move below the busy 1.0825-1.0864 area in their attempt to retake market control.
USDCHF Wave Analysis
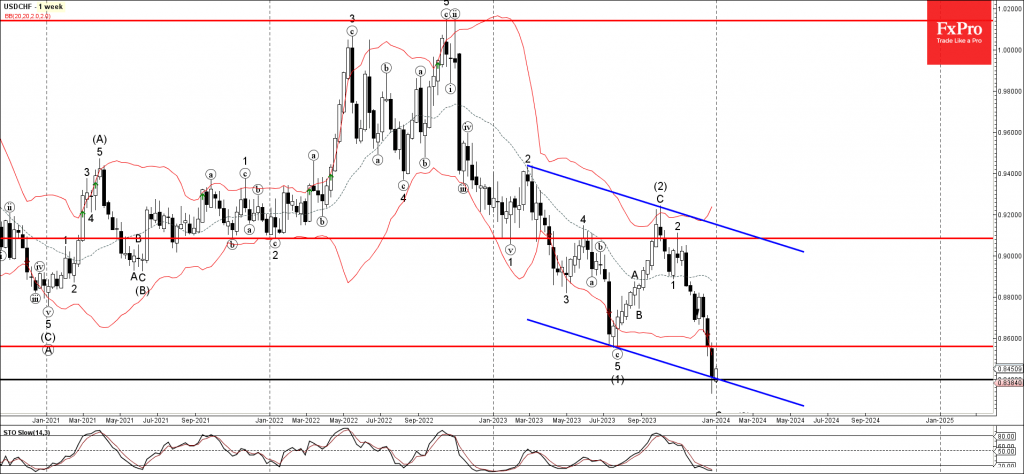
- USDCHF reversed from key support level 0.8400
- Likely to rise to resistance level 0.8600
USDCHF currency pair recently reversed up from the key support level 0.84000 (intersecting with the lower weekly Bollinger Band).
The support level 0.84000 was further strengthened by the lower support trendline of the weekly down channel from the start of 2023.
Given the still oversold weekly stochastic, USDCHF can be expected to rise further to the next resistance level 0.8600 (former support from the middle of last year).
GBPJPY Wave Analysis
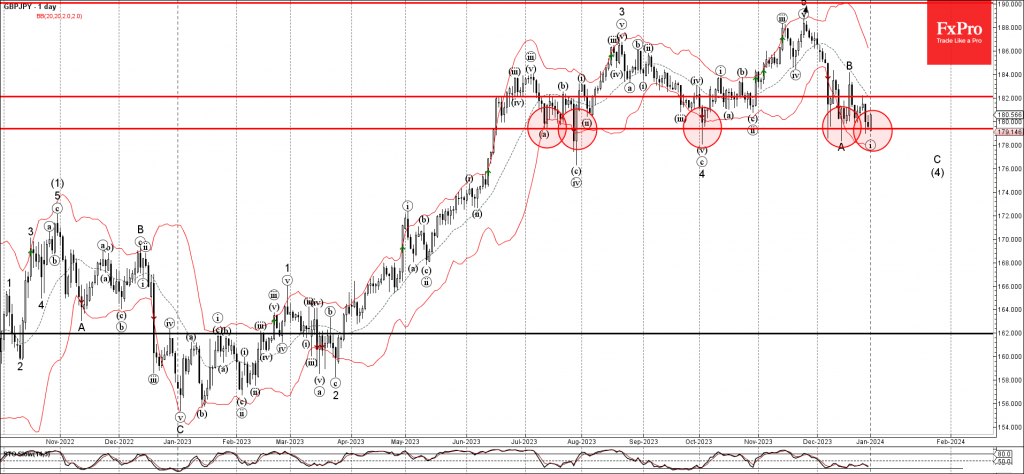
- GBPJPY reversed from support level 179.40
- Likely to rise to resistance level 182.00
GBPJPY currency pair recently reversed up from the multi-month support level 179.40 (which has steadily reversed the pair from the start of July).
The support level 179.40 was further strengthened by the lower daily Bollinger Band.
Given the strength of the support level 179.40, predominant daily uptrend and strongly bullish sterling sentiment seen today, GBPJPY can be expected to rise further to the next resistance level 182.00 (former minor resistance from the end of last month).
EUR/USD: Extended Pullback Pressuring Pivotal Supports
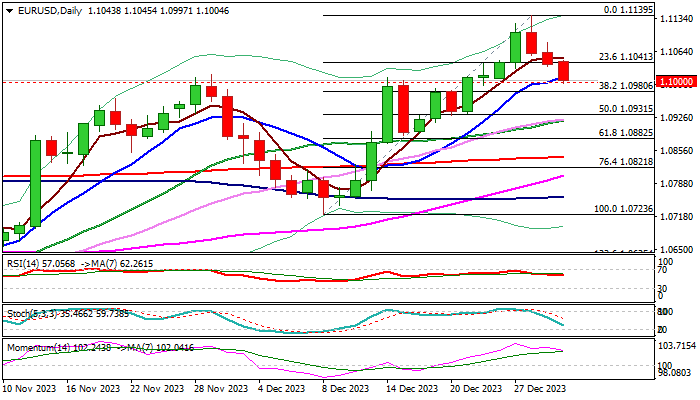
EURUSD keeps negative tone in the first trading day of 2024 and extends pullback from a multi-month high (1.1139) into third consecutive day.
Break through initial support at 1.1041 (Fibo 23.6% of 1.0723/1.1139 upleg) extended through rising 10DMA (1.1011) and cracked psychological 1.10 support, which marks the upper boundary of pivotal 1.1000/1.0980 support zone (psychological/Fibo 38.2%).
Deeper pullback could be expected on violation of these levels, as completion of bearish harami pattern on daily chart signaled reversal after a larger uptrend stalled on approach to 200WMA (1.1151) and left weekly inverted hammer candle, adding to negative near-term signals.
Still, the pullback could be seen as a healthy correction of larger uptrend, with solid support at 1.0931 (50% retracement of 1.0723/1.1139 / daily Kijun-sen) expected to contain extended dips and offer better levels to re-join bullish market.
Short-term action is also underpinned by rising thick weekly Ichimoku cloud, with cloud top marking another key support at 1.0910.
Caution on sustained break of 1.0931/10 pivots, which would neutralize larger bulls and open way for stronger correction of 1.0495/1.1139 Oct-Dec uptrend.
Res: 1.1041; 1.1084; 1.1122; 1.1139.
Sup: 1.0980; 1.0931; 1.0910; 1.0882.
USD/JPY Technical: Potential Countertrend USD Corrective Rebound on the Horizon
- The medium-term downtrend phase of USD/JPY in place since the 15 November 2023 high has reached a potential inflection level at 140.25.
- A potential countertrend corrective rebound scenario may unfold next.
- Watch the first immediate resistance zone at 142.85/143.40.
The price actions of USD/JPY have plummeted lower as highlighted in our prior report despite the lack of monetary policy guidance for an imminent removal of Japan’s short-term negative interest rate in Q1 2024 during the Bank of Japan (BoJ) Governor Ueda’s press conference for BoJ’s recent monetary policy meeting held on 19 December 2023.
All in all, the USD/JPY has shed a total of 1,166 pips (-7.7%) from a 33-year high of 151.91 printed on 13 November 2023 to an intraday low of 140.25 on 28 December 2023 in the ongoing medium-term downtrend phase in place since 13 November 2023 high.
Medium-term downside momentum has flashed out of exhaustion condition
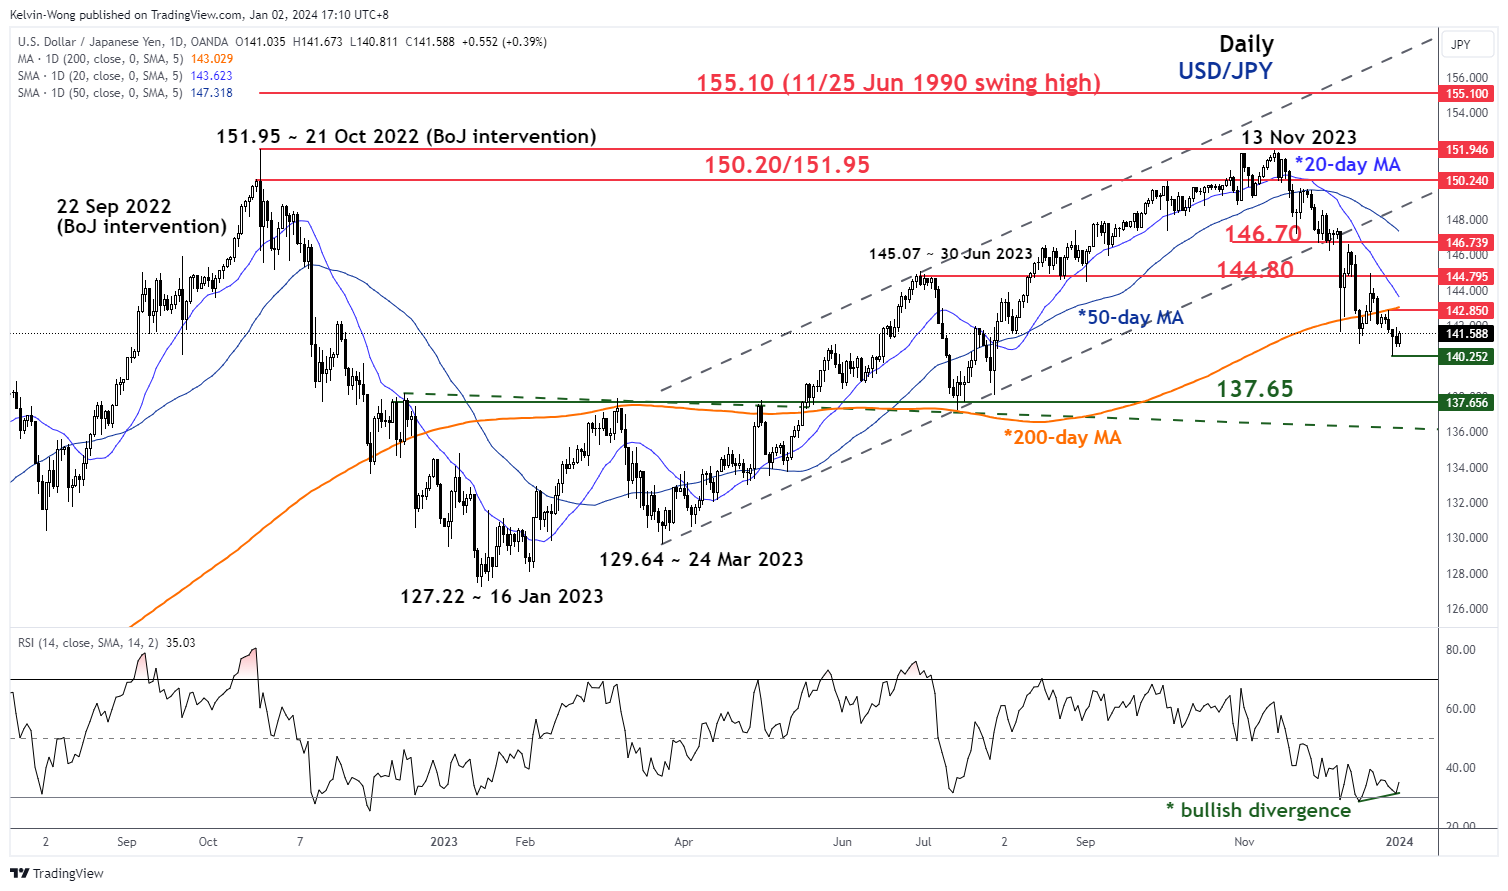
Fig 1: USD/JPY medium-term trend as of 2 Jan 2024 (Source: TradingView, click to enlarge chart)
The medium-term downtrend of the USD/JPY is still firmly intact as depicted by its price actions that are still trading below the downward-sloping 50-day moving average that is now acting as a medium-term resistance at around 146.70 (also coincides closely with the 50% Fibonacci retracement of the medium-term downtrend from 13 November 2023 high to 28 December 2023 low).
The daily RSI momentum indicator has just flashed out a bullish divergence condition after it hit its oversold region (below 70) on 14 December 2023. These observations suggest that medium-term downside momentum may have been exhausted which reduces the odds of price action to continue downwards to print “lower lows”.
A clearance above 142.85 intermediate resistance (also the area where 20 and 200-day moving averages are acting as a ceiling) may kickstart a more pronounced countertrend corrective rebound to retrace a portion of the ongoing medium-term downtrend phase of the USD/JPY with the next resistances to watch at 144.80 and 146.70 (also the 50-day moving average).
Watch the 140.25 key short-term support
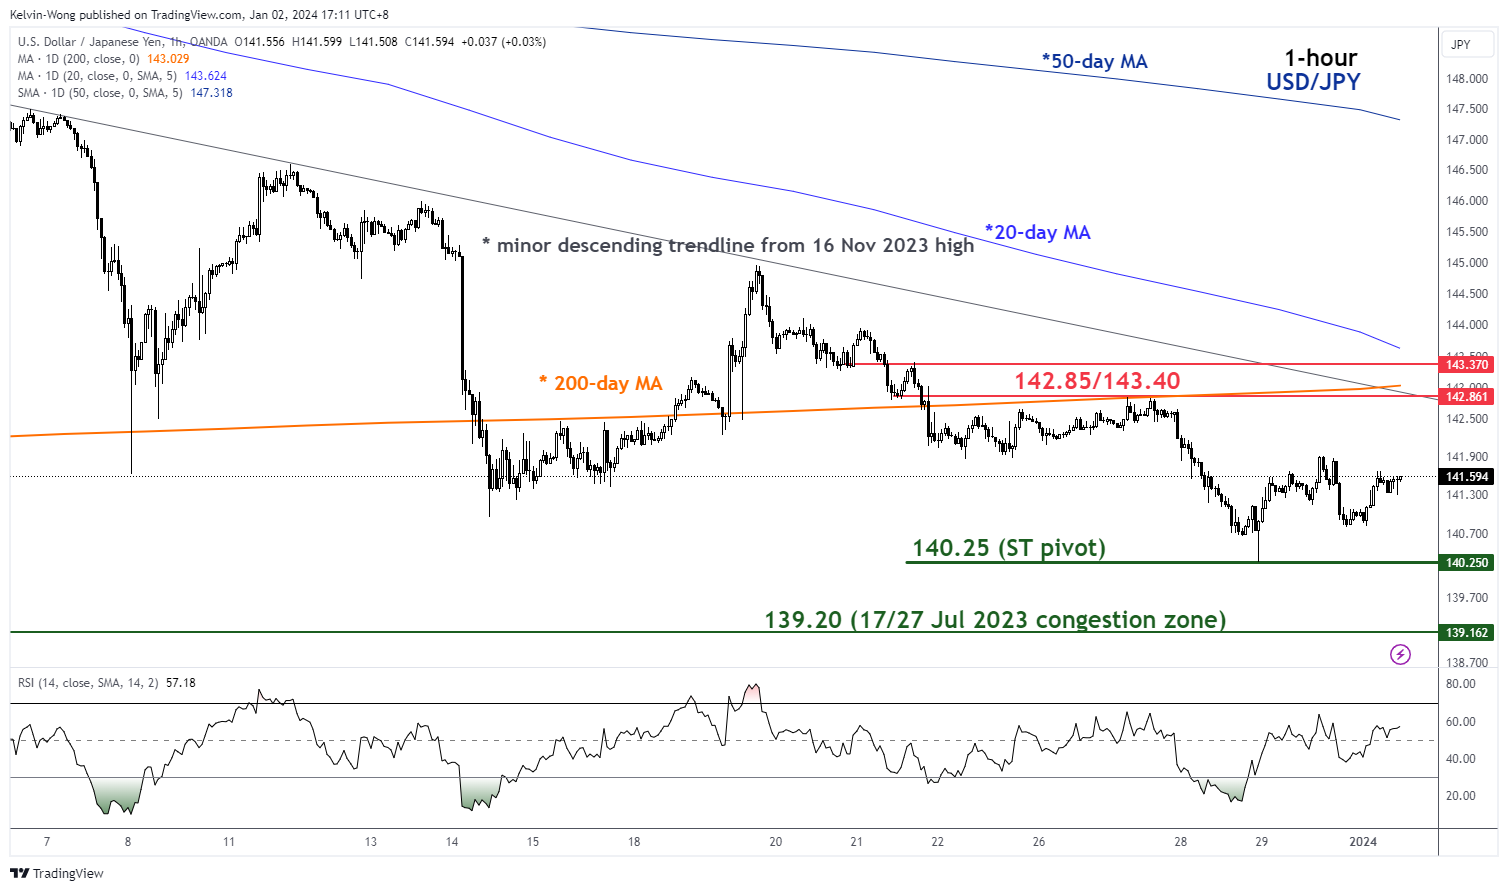
Fig 2: USD/JPY short-term minor trend as of 19 Dec 2023 (Source: TradingView, click to enlarge chart
If the 140.25 key short-term pivotal support manages to hold, the USD/JPY may stage the first leg of the potential countertrend rebound with the immediate resistance zone coming in at 142.85/143.40.
However, failure to hold at 140.25 invalidates the countertrend rebound scenario to reinstate the impulsive down move sequence toward the next immediate support at 139.20 in the first step.
Australian Dollar Edges Higher After Chinese Data
- China Caixin Manufacturing posts slight growth
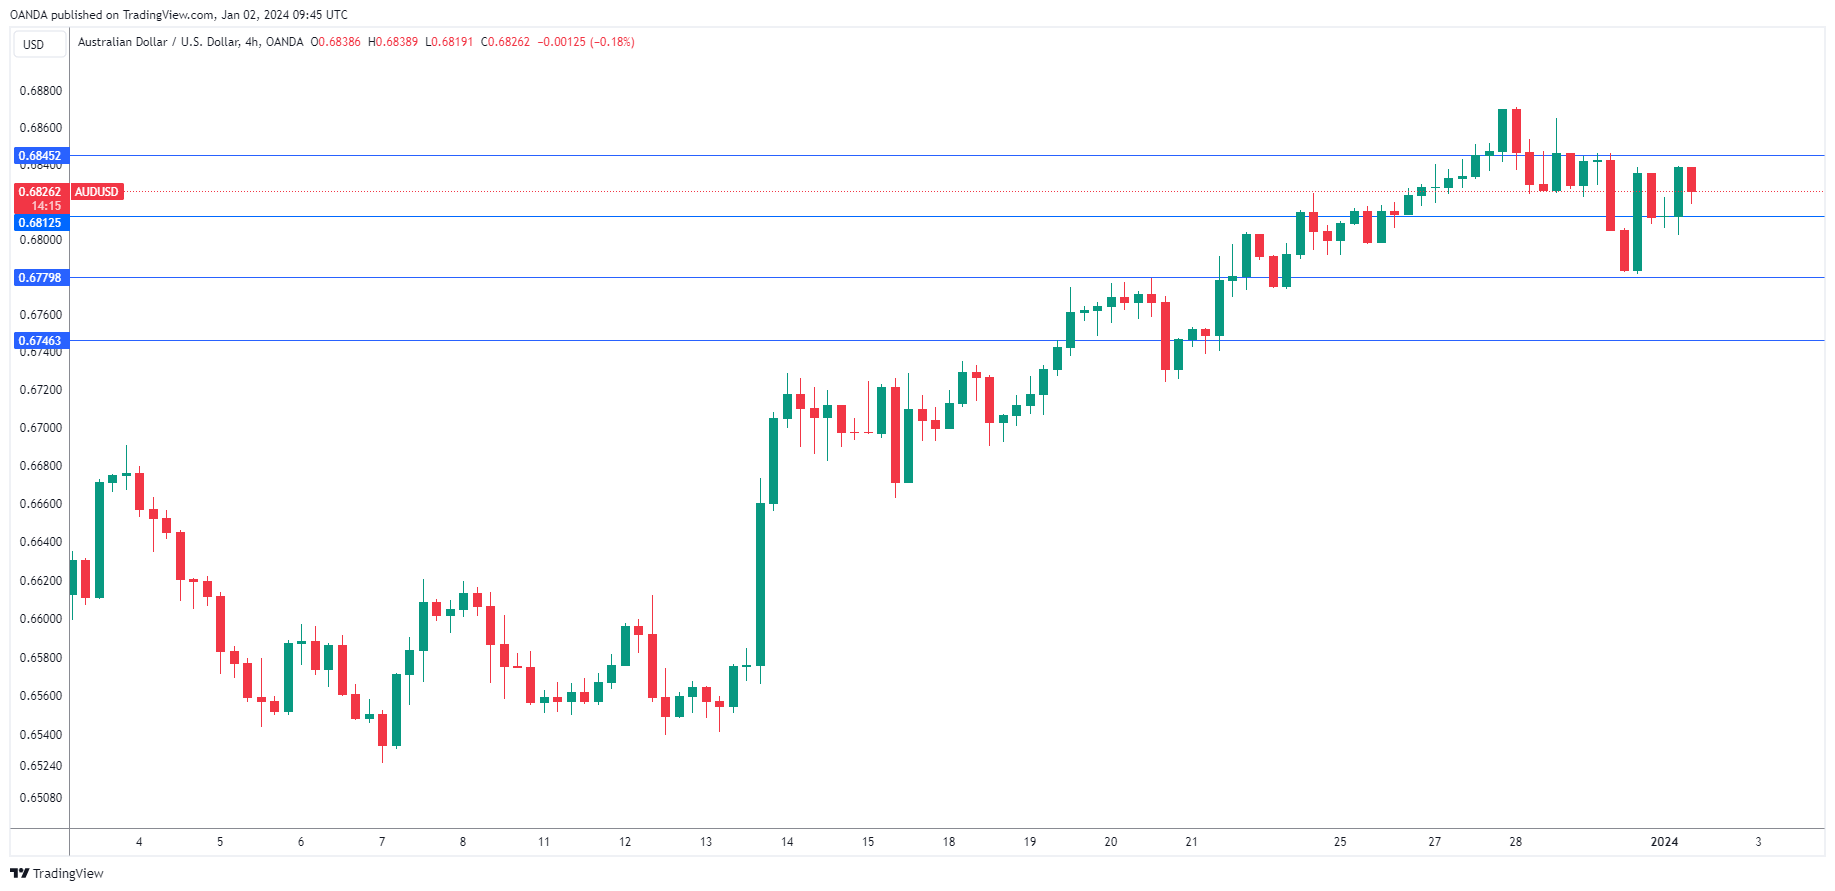
The Australian dollar is in positive territory on Tuesday. In the European session, AUD/USD is trading at 0.6826, up 0.22%.
The week between Christmas and New Year’s was subdued in the currency markets. Still, the Australian dollar hit a six-month high on Christmas Day, rising to 0.6871. The Aussie ended the year on a roll, gaining 3.1% in December.
China’s Caixin Manufacturing PMI ticked up to 50.8 in December, up from 50.7 in November and above the consensus of 50.4. This was the highest reading since August, but the reading points to stagnation in manufacturing. The reading was better than the official Manufacturing PMI release on Saturday of 49.0 which indicates contraction. The non-manufacturing PMI edged up to 50.4, compared to 50.2 in November. Activity in the non-manufacturing sector has been minimal over the past six months, as China remains mired in an economic slowdown as we move into 2024.
Where is RBA headed?
The Reserve Bank of Australia meets next on February 6 and it’s anyone’s guess what the central bank has in mind for 2024. The RBA has raised interest rates just once since June and held the cash rate at 4.35% at the December meeting. It’s likely that the RBA is done with raising rates, but the timing of a rate cut is unclear. Many economists are circling September for the first rate cut, while Bank of America is predicting a rate cut only in 2025. The markets are more optimistic and have priced in a rate cut in mid-2024.
What all the views can agree on is that the inflation rate will play a critical role in determining the RBA’s rate path. Inflation has fallen to 4.9% but remains much higher than the RBA’s target band of 2-3%. Australia will release the December inflation report on January 10 and the release should be treated as a market-mover.
AUD/USD Technical
- AUD/USD is testing resistance at 0.6812. Next, there is resistance at 0.6845
- 0.6779 and 0.6746 are providing support
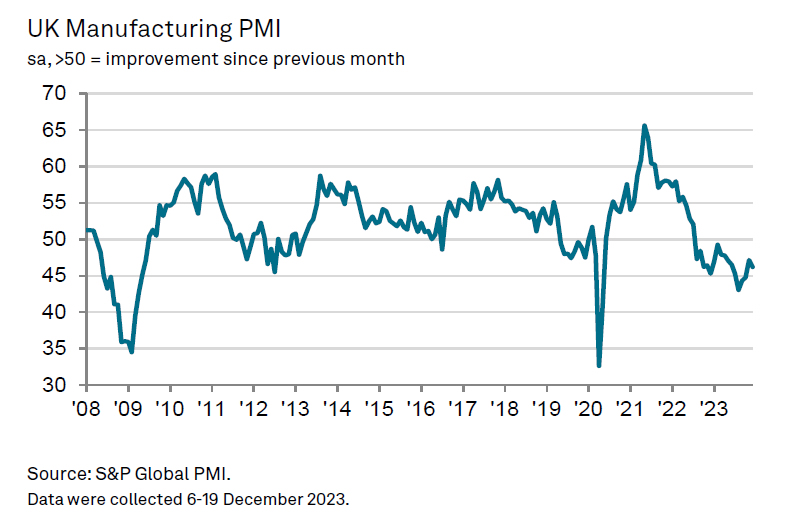
UK PMI manufacturing finalized at 46.2, 17th month of contraction
UK PMI Manufacturing was finalized at 46.2 in December, down from November's 47.2. This marks the seventeenth consecutive month where the index has remained below the neutral 50 threshold, indicating ongoing contraction. According to S&P Global, key aspects such as output, new orders, and employment are all in decline. Additionally, business optimism has reached a 12-month low.
Rob Dobson, Director at S&P Global Market Intelligence, pointed out demand environment remains challenging, with new orders continuing to decline due to difficult conditions in both domestic and key export markets, particularly the European Union.
The downturn is prompting companies to adopt a more cautious approach to costs. There have been notable cutbacks in stock levels, purchasing, and employment as firms grapple with the ongoing challenges.
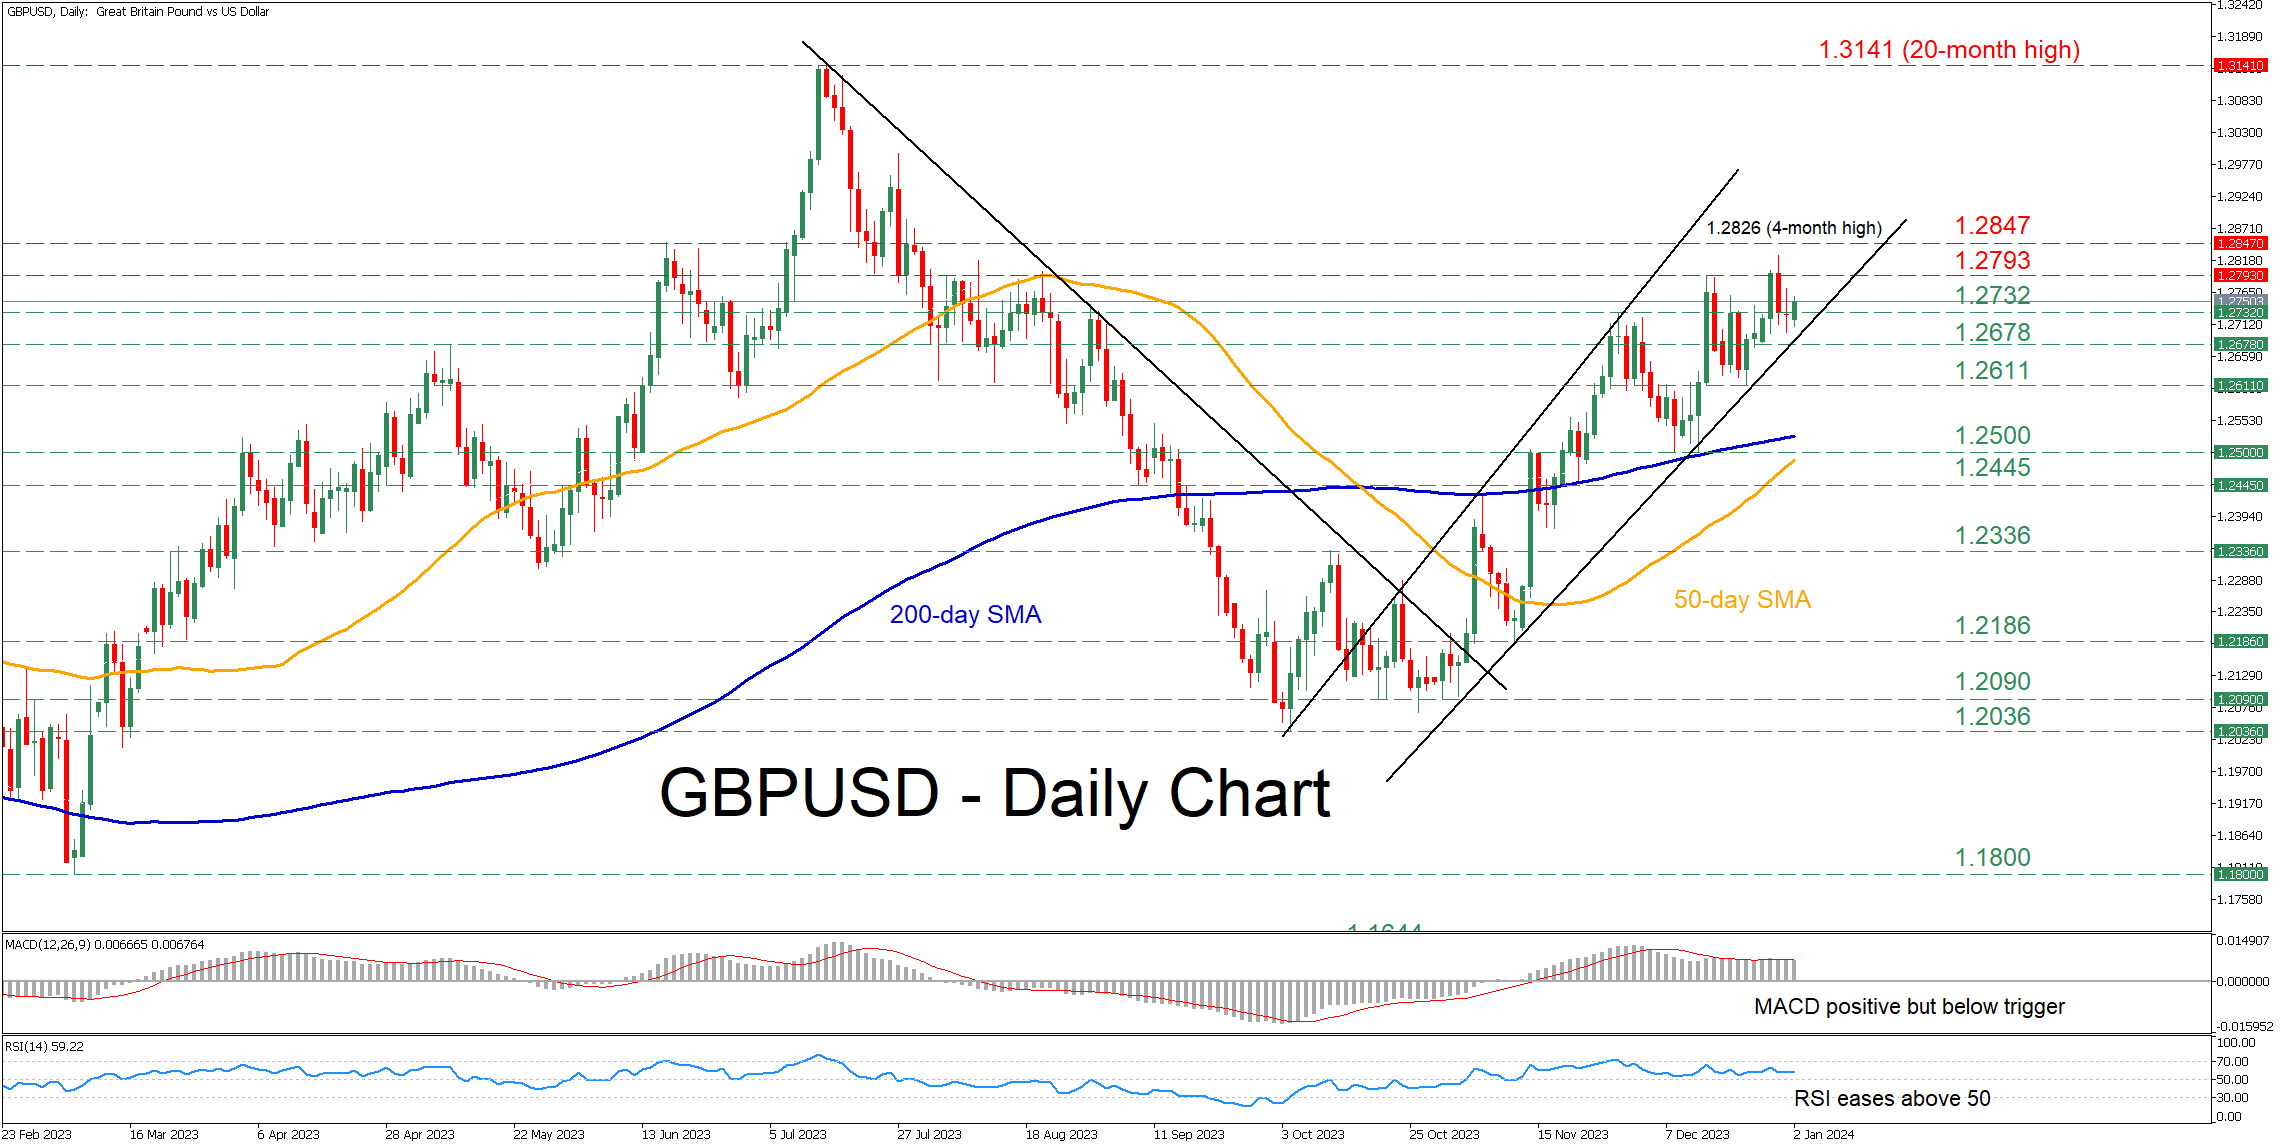
GBPUSD Begins 2024 in a Muted Tone
- GBPUSD pares some gains after posting a 4-month peak
- But remains within its upward sloping channel
- Positive bias holds as momentum indicators are skewed to the upside
GBPUSD had been forming a profound structure of higher highs following its break above a crucial descending trendline in early November. Although the pair’s rally has temporarily paused at the four-month peak of 1.2826, the impending completion of a golden cross between the 50- and 200-day simple moving averages (SMAs) could infuse upside pressures.
Given that the short-term oscillators are providing cautiously positive signals, the bulls could attempt to erase the latest weakness and conquer the December resistance of 1.2793. A violation of that hurdle could open the door for the four-month peak of 1.2826. Failing to halt there, the pair might advance towards the June high of 1.2847.
On the flipside, if the pair reverses lower, a couple of previous resistance territories such as 1.2732 and 1.2678 may now act as initial lines of defense. Piercing through that floor, the price may then descend towards the recent support of 1.2611. Even lower, the December bottom of 1.2500 could provide downside correction.
In brief, even if GBPUSD’s advance seems to be losing steam, near-term risks remain cautiously tilted to the upside. For that to change, the price needs to decisively break below its upward sloping channel.
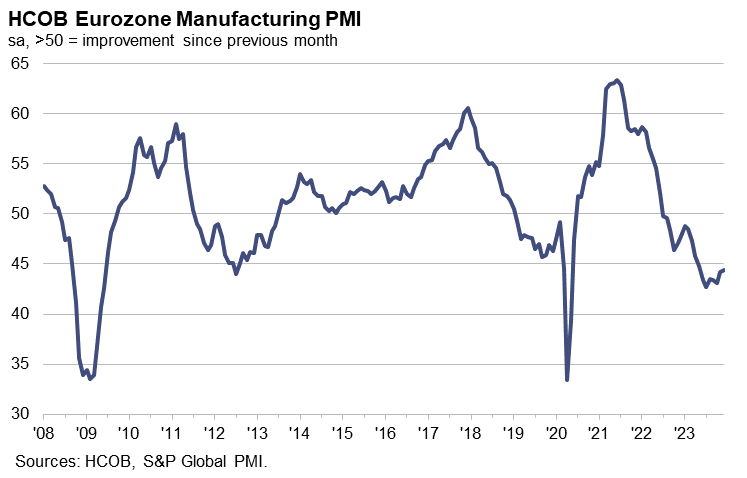
Eurozone’s PMI manufacturing finalized at 44.4, relentless slump continues
Eurozone's PMI Manufacturing was finalized at 44.4 in December, up slightly from November's 44.2. Despite this minor uptick, marking a seven-month high, the index remained below the critical 50.0 threshold, signaling a continued deterioration in operating conditions across the sector.
Country-by-country breakdown of Manufacturing PMI reveals a diverse picture. Greece stands out with a PMI of 51.3, indicating expansion and marking a four-month high. In contrast, other major economies like Ireland, Spain, Italy, the Netherlands, Germany, France, and Austria all recorded PMIs indicative of contraction, with varying degrees of severity. Notably, France registered a PMI of 42.1, a 43-month low. On the other hand, Germany rose to an 8-month high at 433.
Cyrus de la Rubia, Chief Economist at Hamburg Commercial Bank, remarked on the "relentless slump" in Eurozone's manufacturing sector, noting that the marginal improvement in the PMI does little to alleviate concerns about the persistent decline in activity and demand for manufactured goods. The consistent sluggishness in new orders was particularly alarming, reflecting a pervasive gloom across the sector.
According to HCOB's Nowcast model anticipates a contraction in the Eurozone's GDP for the fourth quarter. This projection, if realized, indicates that Eurozone may have already entered a recession as early as the third quarter.