Sample Category Title
USD/JPY Daily Outlook
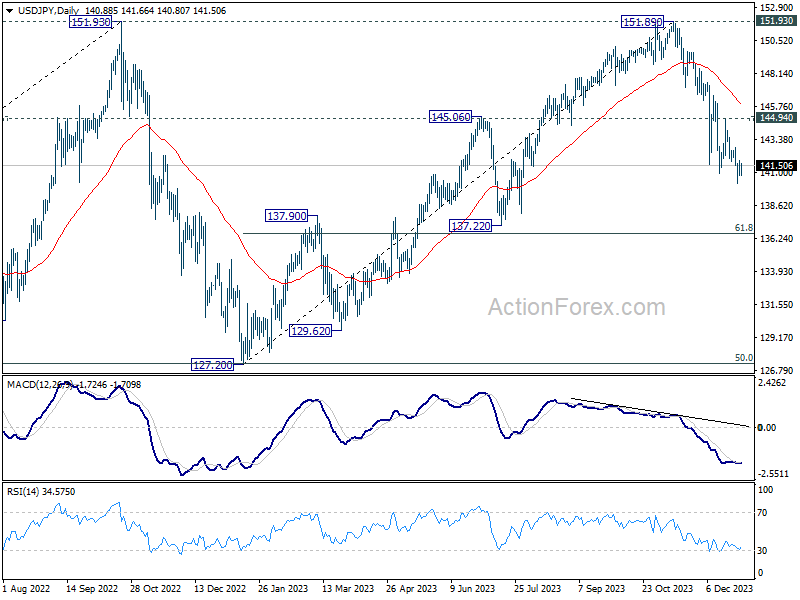
Daily Pivots: (S1) 140.58; (P) 141.25; (R1) 141.69; More...
USD/JPY continues to lose downside momentum as seen in 4H MACD. But further decline will remain in favor as long as 142.84 minor resistance holds. Current fall from 151.89 would target 136.63 fibonacci level. Nevertheless, break of 142.84 will turn bias back to the upside for stronger rebound.
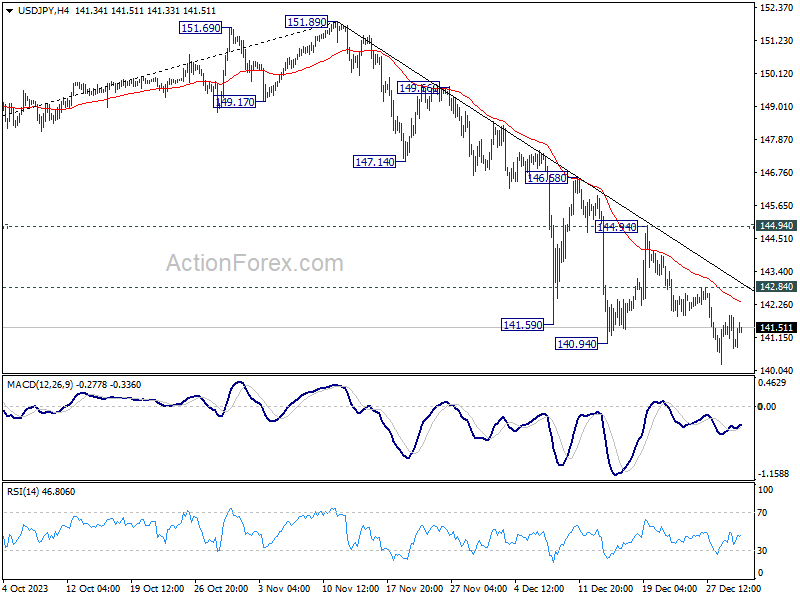
In the bigger picture, fall from 151.89 is seen as the third leg of the corrective pattern from 151.93 (2022 high). Deeper decline would be seen to 61.8% retracement of 127.20 to 151.89 at 136.63, sustained break there will pave the way to 127.20 support (2022 low). This will now remain the favored as long as 144.94 resistance holds.
USD/CHF Daily Outlook
Daily Pivots: (S1) 0.8363; (P) 0.8409; (R1) 0.8462; More....
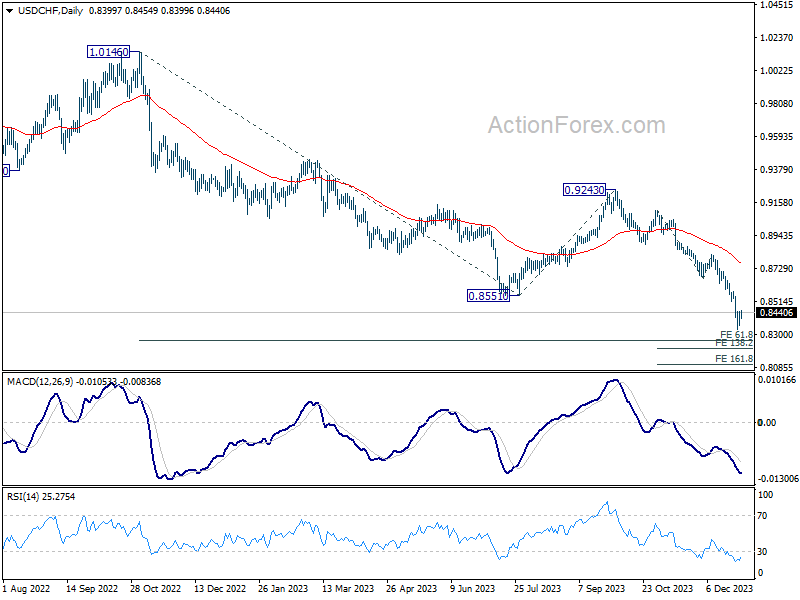
USD/CHF is staying in consolidation from 0.8332 and intraday bias remains neutral at this point. Stronger recovery cannot be ruled out, but outlook will stay bearish as long as 0.8665 support turned resistance holds. Break of 0.8332 will resume larger fall from 0.9243 to 138.2% projection of 0.9111 to 0.8665 from 0.8819 at 0.8203 next.
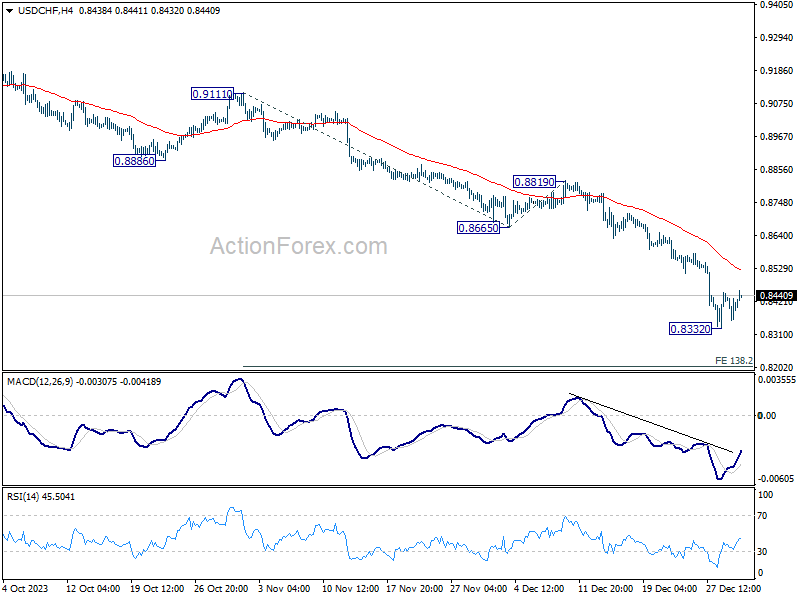
In the bigger picture, break of 0.8551 support indicates resumption of whole decline from 1.0146 (2022 high). Next target is 61.8% retracement of 1.0146 to 0.8551 from 0.9243 at 0.8257. Sustained break there could prompt downside acceleration to 100% projection at 0.7648. This will now remain the favored case as long as 0.8819 resistance holds.
GBP/USD Daily Outlook
Daily Pivots: (S1) 1.2698; (P) 1.2735; (R1) 1.2770; More...
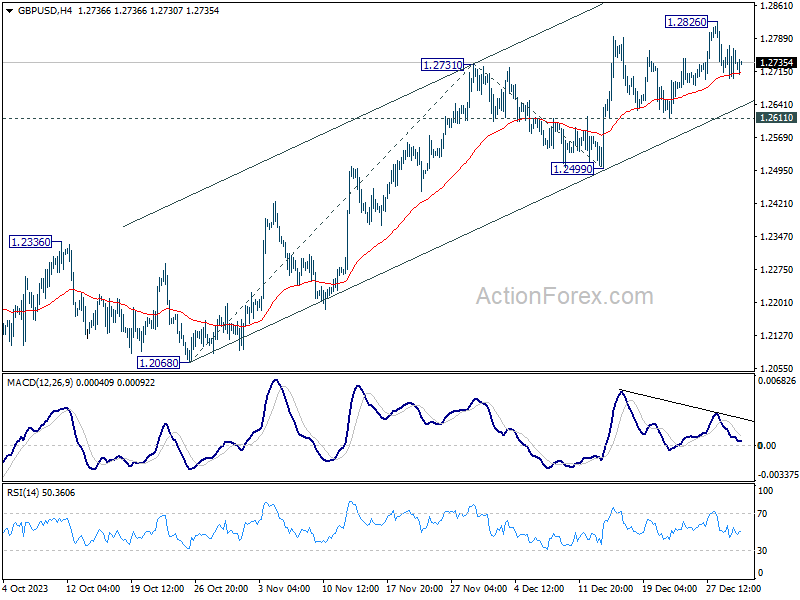
GBP/USD is staying in consolidation from 1.2826 and intraday bias stays neutral at this point. With 1.2611 support intact, further rally is in favor. On the upside, break of 1.2826 will resume larger rise from 1.2036 to 61.8% projection of 1.2068 to 1.2731 from 1.2499 at 1.2909. Nevertheless, break of 1.2611 will indicate short term topping, and turn bias back to the downside for 1.2499 support.
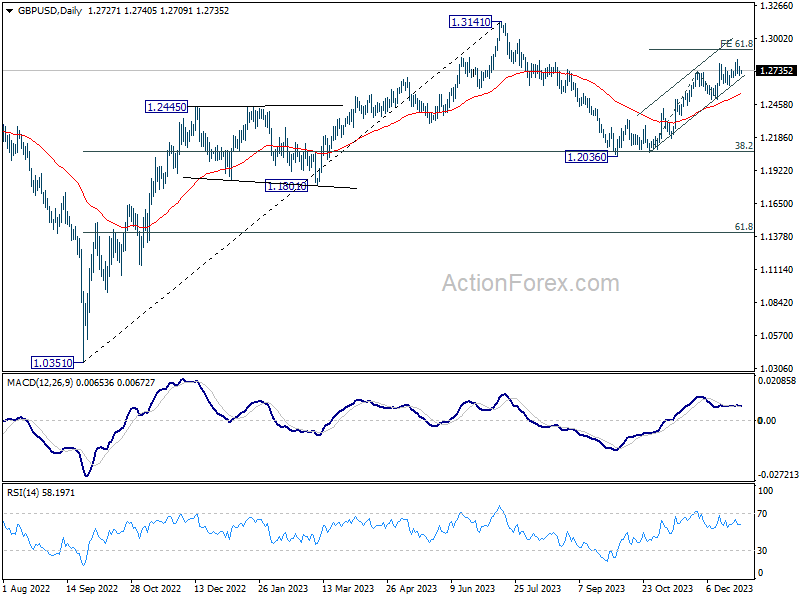
In the bigger picture, price actions from 1.3141 medium term top are seen as a corrective pattern to rise from 1.0351 (2022 low). Rise from 1.2036 is seen as the second leg that's in progress. Upside should be limited by 1.3141 to bring the third leg of the pattern. Meanwhile, break of 1.2499 support will argue that the third leg has already started for 38.2% retracement of 1.0351 (2022 low) to 1.3141 at 1.2075 again.
Technical Outlook and Review
DXY:
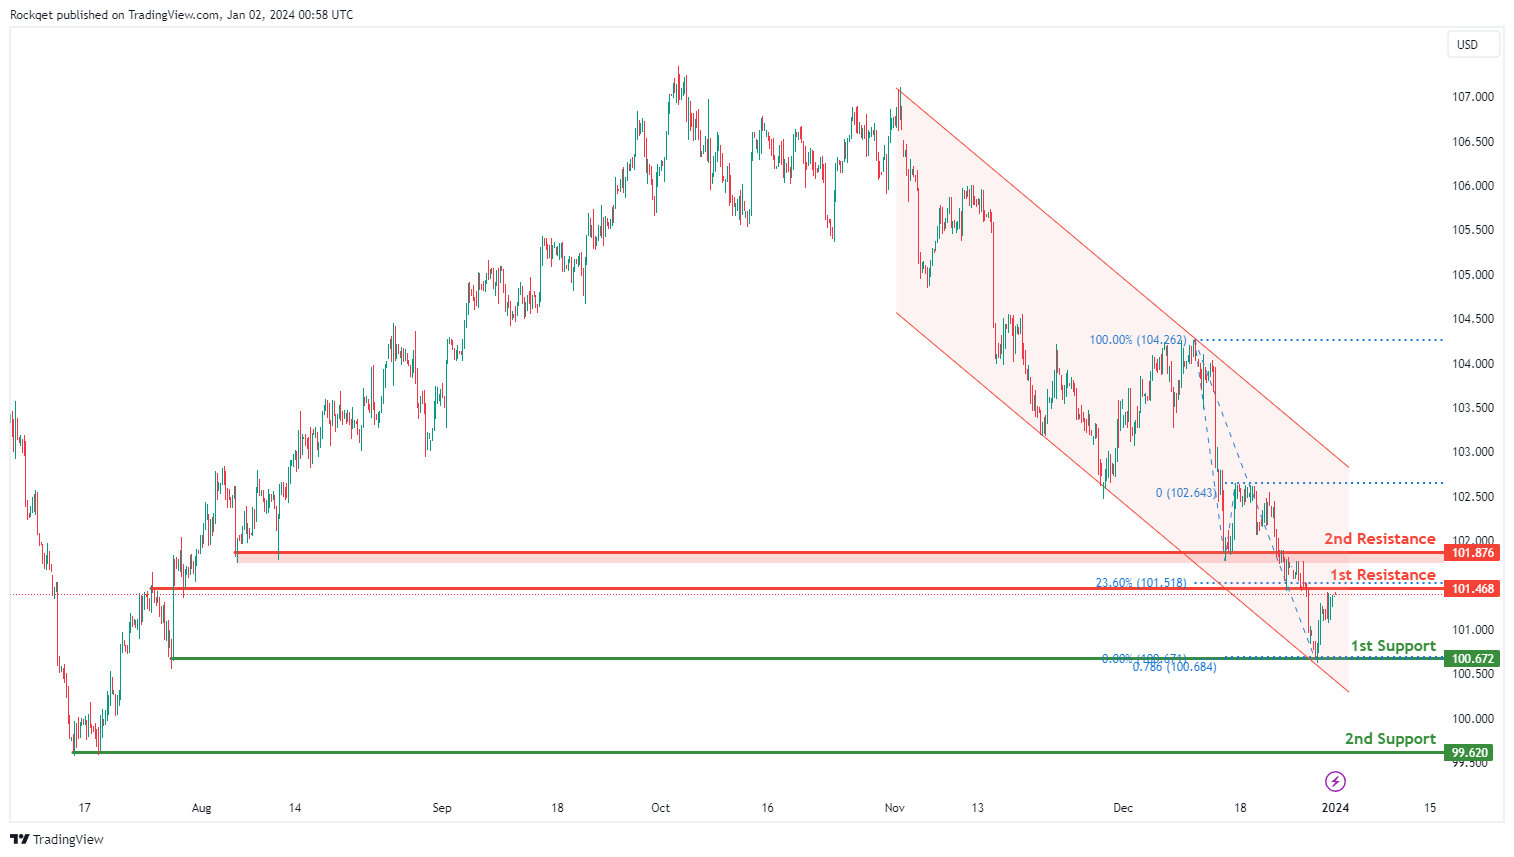
The DXY (US Dollar Index) chart currently shows an overall bearish momentum. However, there is a potential for price to make a bullish rise towards the 1st resistance.
The 1st resistance level at 101.46 is identified as an overlap resistance that aligns with the 23.60% Fibonacci retracement level. Higher up, the 2nd resistance level at 101.87 is also marked as an overlap resistance, suggesting a potential barrier for further upside movement.
To the downside, the 1st support level at 100.67 is identified as a swing-low support that aligns with the 78.60% Fibonacci projection level. Further below, the 2nd support level at 99.62 is noted as pullback support, further reinforcing its importance as a potential key support level.
EUR/USD:
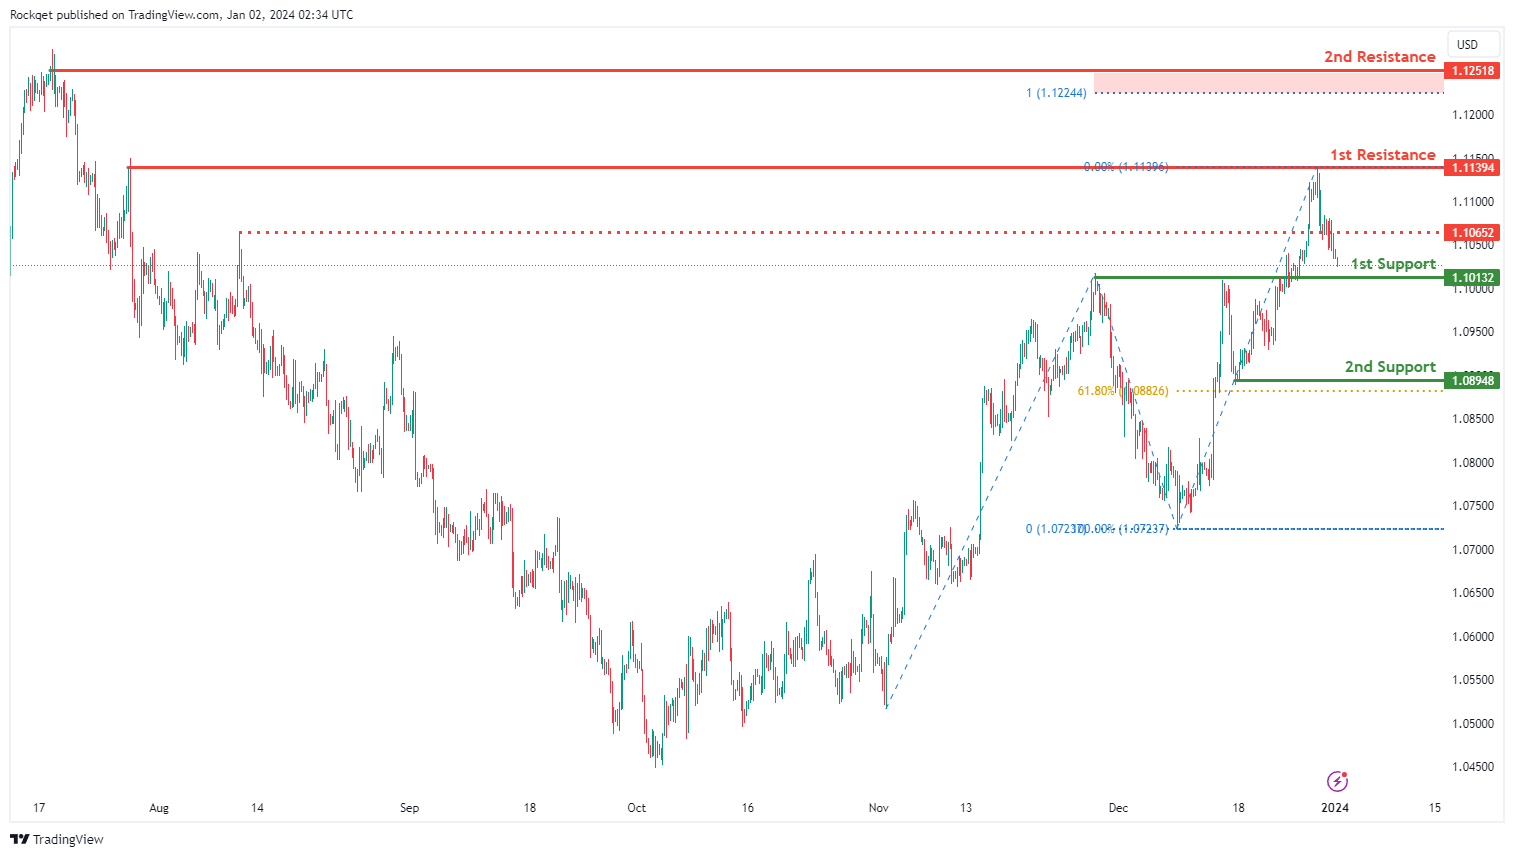
The EUR/USD chart currently exhibits an overall bullish momentum. However, there is a potential scenario for price to drop towards the 1st support and make a bullish bounce off this level.
The 1st support level at 1.1013 is identified as an overlap support. Further below, the 2nd support level at 1.0894 is marked as a pullback support that aligns with the 61.80% Fibonacci retracement level, further reinforcing its importance as a potential key support level.
To the upside, the intermediate resistance level at 1.1065 is identified as a pullback resistance while the 1st resistance level at 1.1139 is noted as a multi-swing-high resistance. Higher up, the 2nd resistance level at 1.1251 is marked as a swing-high resistance that aligns close to the 100.00% Fibonacci projection level, suggesting a potential barrier for further upside movement.
EUR/JPY:
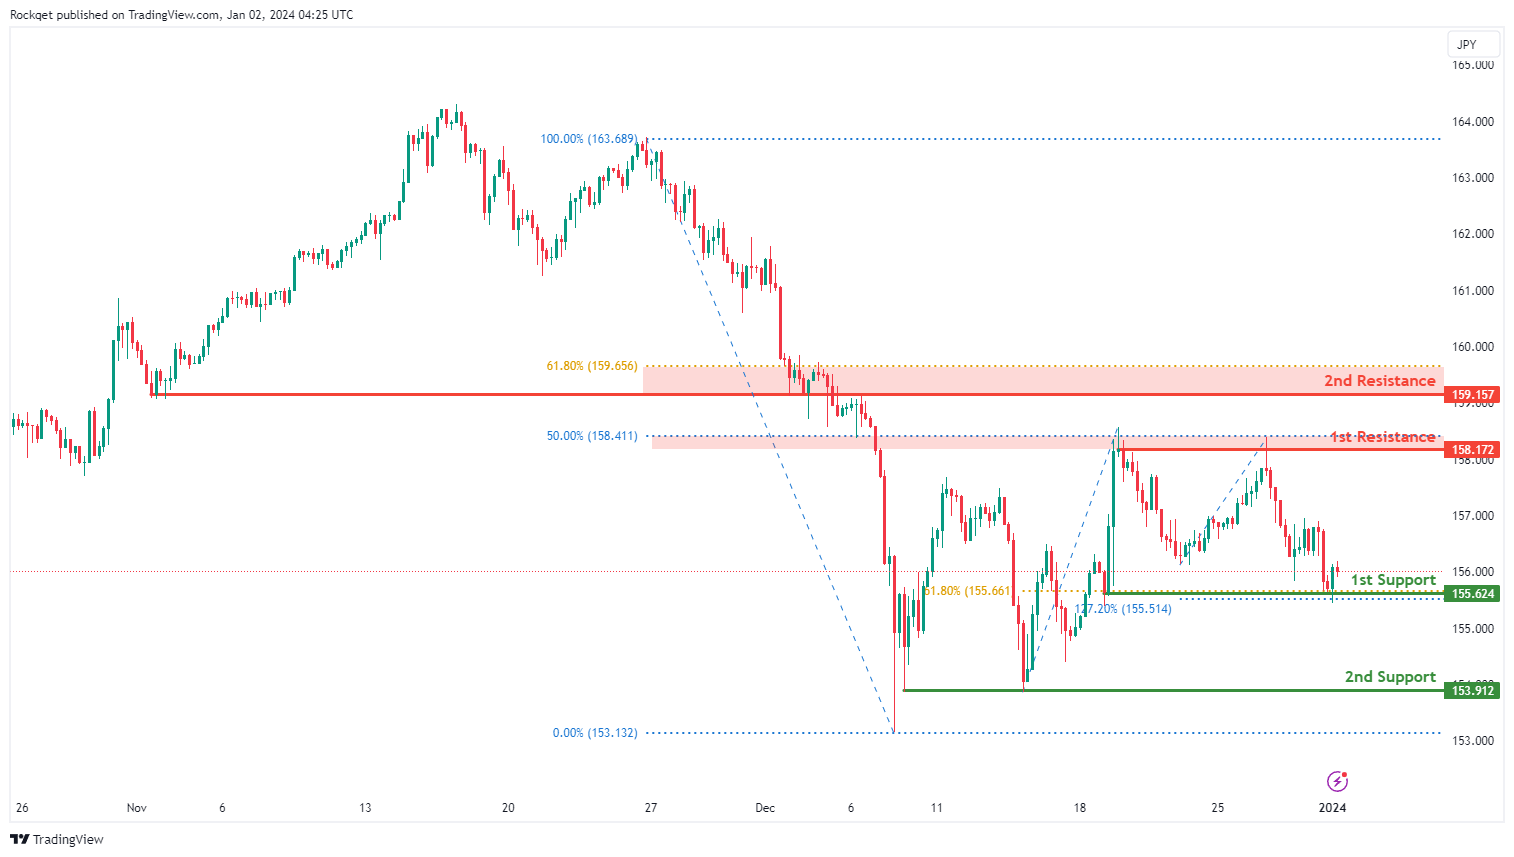
The EUR/JPY chart currently displays a neutral bias. In this context, there is a potential scenario for price to fluctuate between the 1st resistance and the 1st support.
The 1st support at 155.62 is considered as a pullback support that aligns with the 61.80% Fibonacci retracement level. Additionally, the 2nd support at 153.91 is identified as a multi-swing low support, providing an additional layer of potential support.
On the resistance side, the 1st resistance at 158.17 is linked to a pullback resistance that aligns with the 50.00% Fibonacci retracement level. Furthermore, the 2nd resistance at 159.15 is associated with an overlap resistance that aligns with the 61.80% Fibonacci retracement level, adding an extra layer of potential resistance.
EUR/GBP:
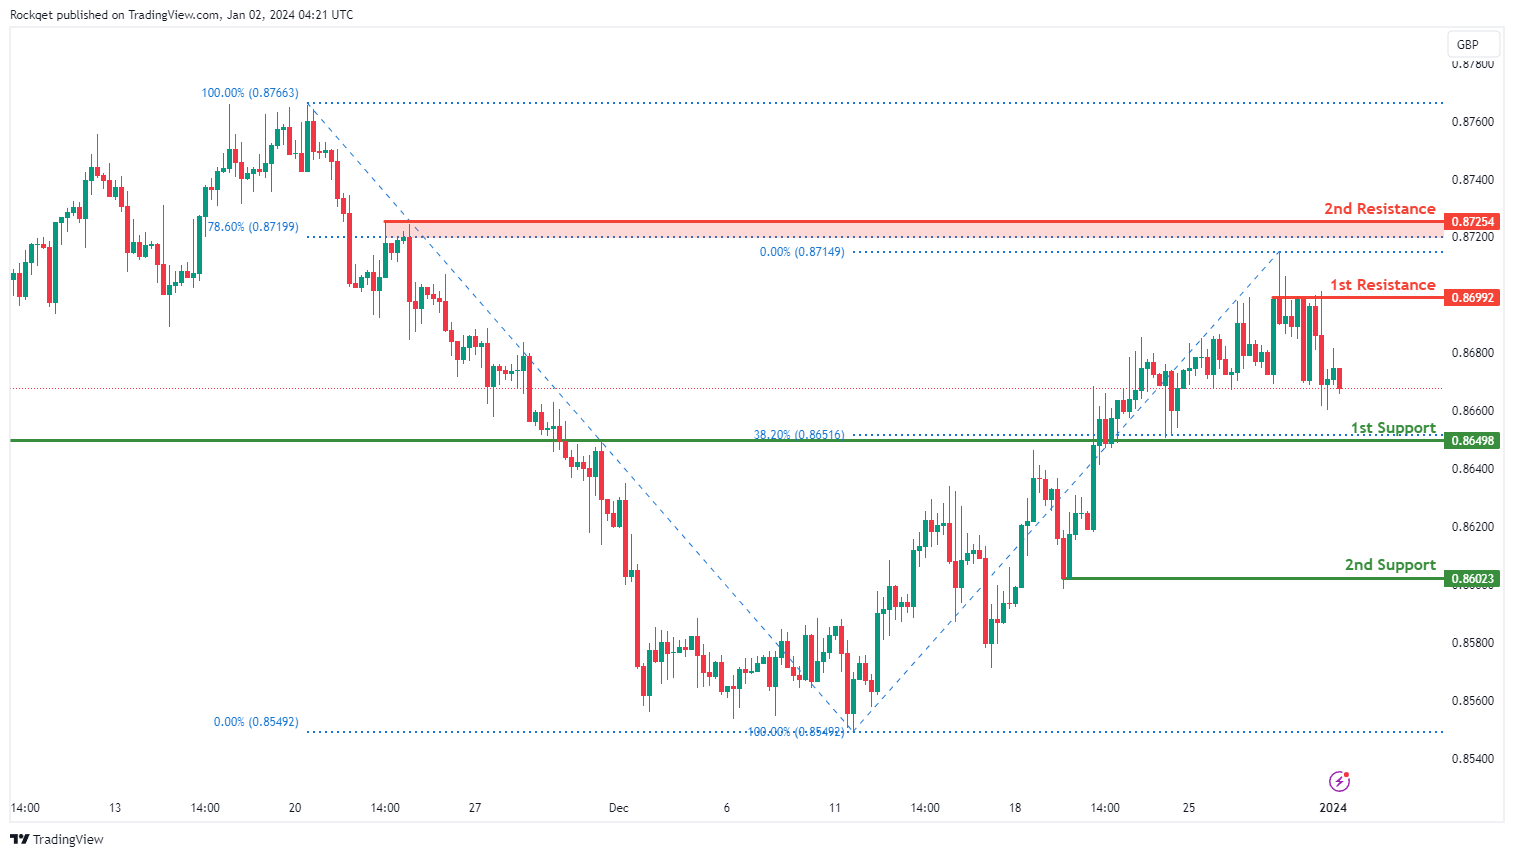
The EUR/GBP chart currently exhibits an overall bearish momentum. In this context, there is a potential scenario for price to make a bearish continuation towards the 1st support.
The 1st support at 0.8649 is considered an overlap support that aligns with the 38.20% Fibonacci retracement level. Additionally, the 2nd support at 0.8602 is identified as a pullback support.
On the resistance side, the 1st resistance at 0.8699 is linked to a pullback resistance. Furthermore, the 2nd resistance at 0.8725 also represents a pullback resistance that aligns with the 78.60% Fibonacci retracement level, suggesting a level where selling interest could intensify.
GBP/USD:
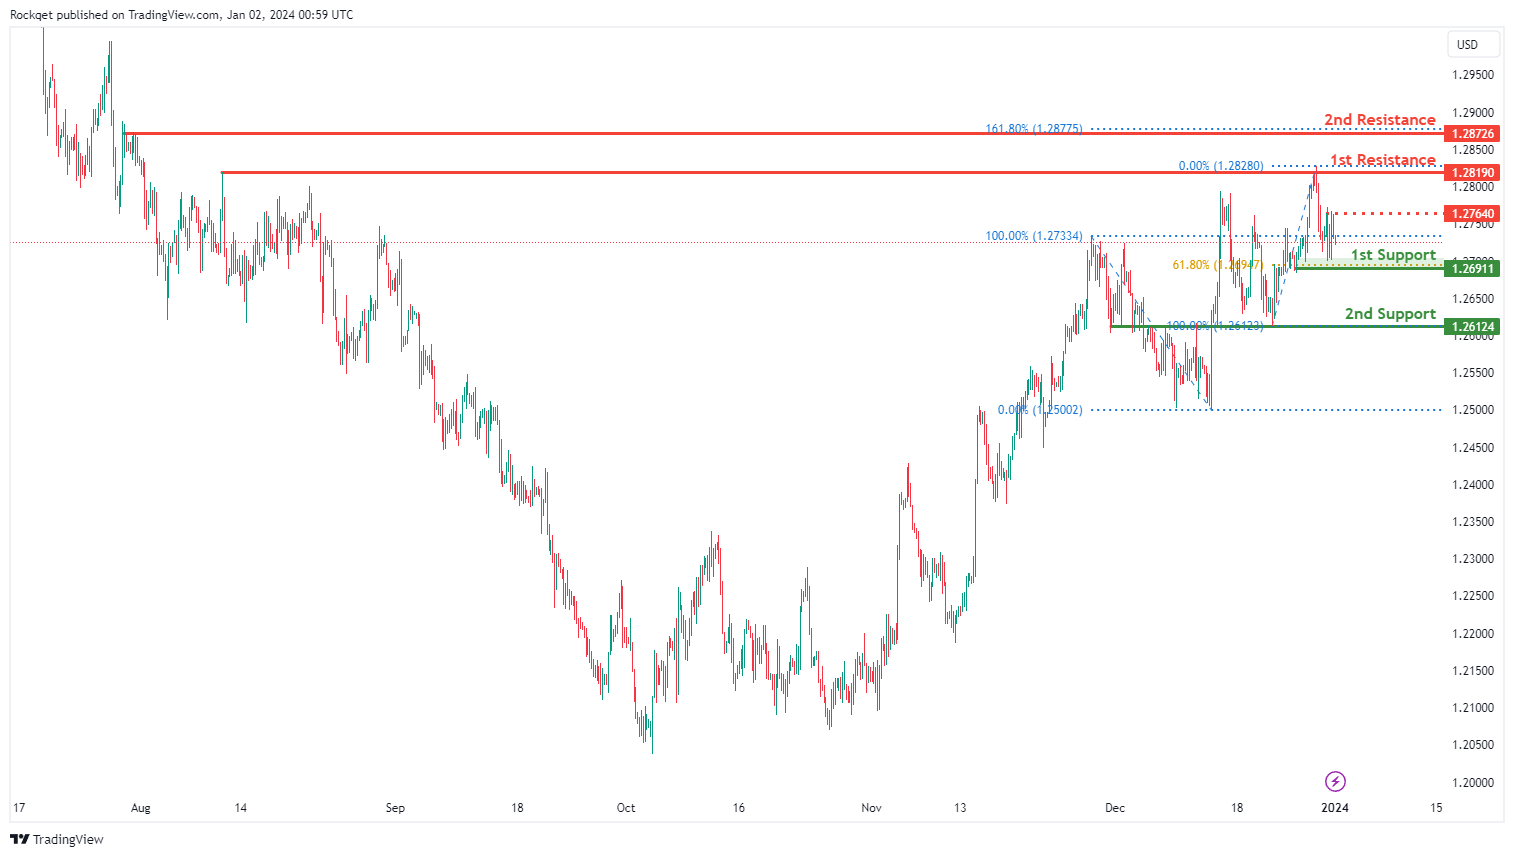
The GBP/USD chart currently exhibits a neutral bias. In this context, there is a potential scenario for price to fluctuate between the 1st resistance and the 1st support.
The intermediate resistance level at 1.2764 is identified as a pullback resistance while the 1st resistance level at 1.2819 is marked as a pullback resistance. Higher up, the 2nd resistance level at 1.2872 is also noted as a pullback resistance that aligns with the 161.80% Fibonacci extension level, suggesting a potential barrier for further upside movement.
To the downside, the 1st support level at 1.2691 is identified as a pullback support that aligns with the 61.80% Fibonacci retracement level. Further below, the 2nd support level at 1.2612 is noted as an overlap support, further reinforcing its importance as a potential key support level.
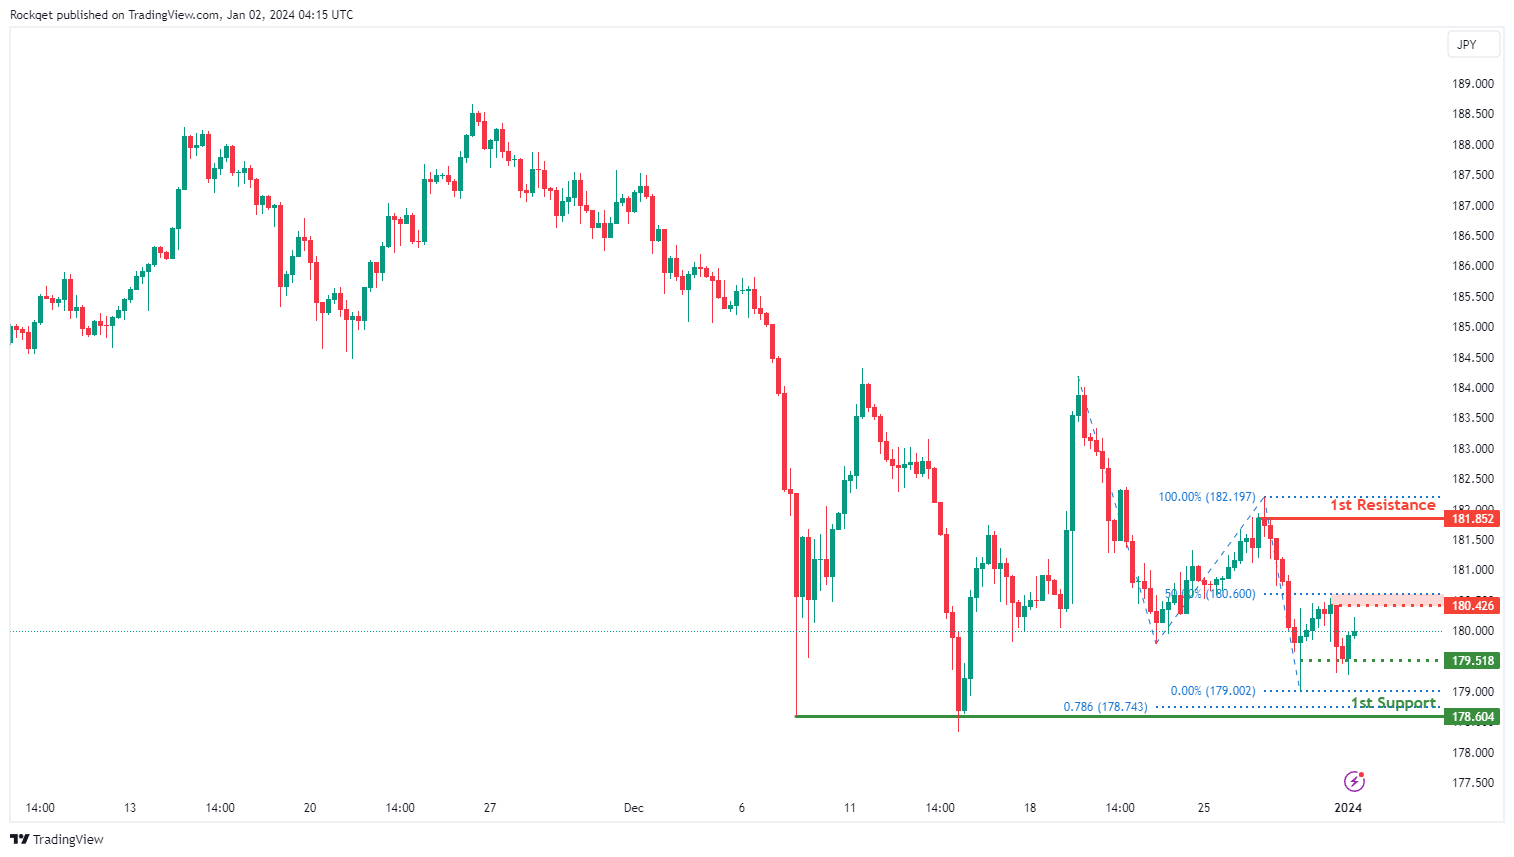
GBP/JPY:
The GBP/JPY chart currently exhibits a neutral bias, suggesting a potential scenario for price to fluctuate between the intermediate resistance and the intermediate support.
The intermediate support at 179.51 is considered as a pullback low support. Additionally, the 1st support at 178.60 is identified as a multi-swing low support, providing an additional layer of potential support for the currency pair.
On the resistance side, the intermediate resistance at 180.42 is associated with a pullback resistance that aligns close to the 50.00% Fibonacci retracement level. Furthermore, the 1st resistance at 181.85 also represents a pullback resistance, indicating a level where selling interest could intensify.
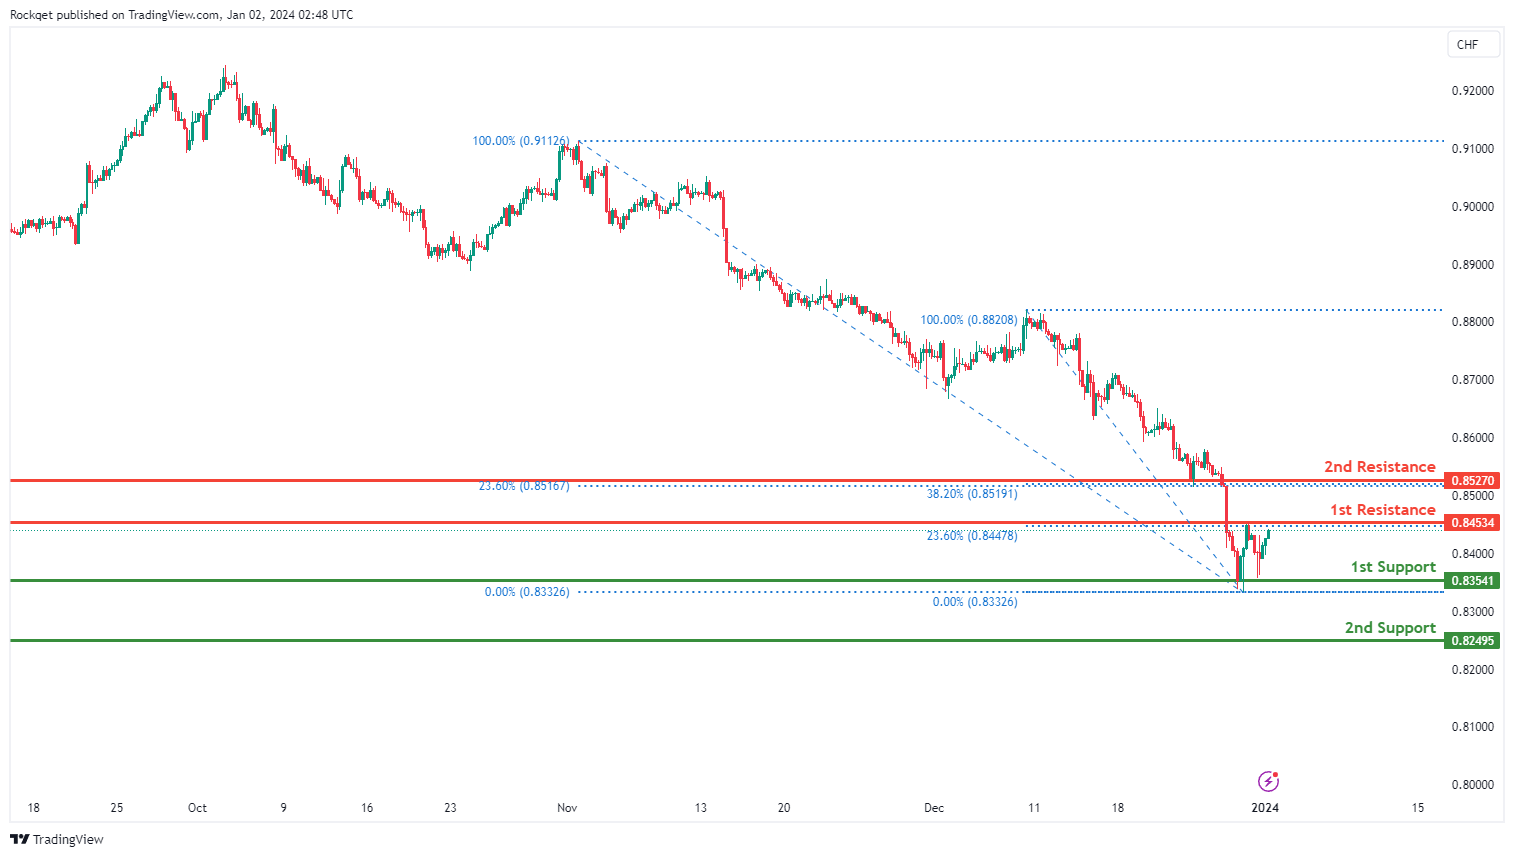
USD/CHF:
The USD/CHF chart currently exhibits an overall bearish momentum. However, there is a potential scenario for price to rise towards the 1st resistance.
The 1st resistance level at 0.8453 is identified as a pullback resistance that aligns with the 23.60% Fibonacci retracement level. Higher up, the 2nd resistance level at 0.8527 is also also marked as a pullback resistance that aligns with a confluence of Fibonacci levels i.e. the 23.60 and the 38.20% Fibonacci retracement levels, suggesting a potential barrier for further upside movement.
To the downside, the 1st support level at 0.8354 is identified as a pullback support. Further below, the 2nd support level at 0.8249 is noted as a pullback support, further reinforcing its importance as a key support level.
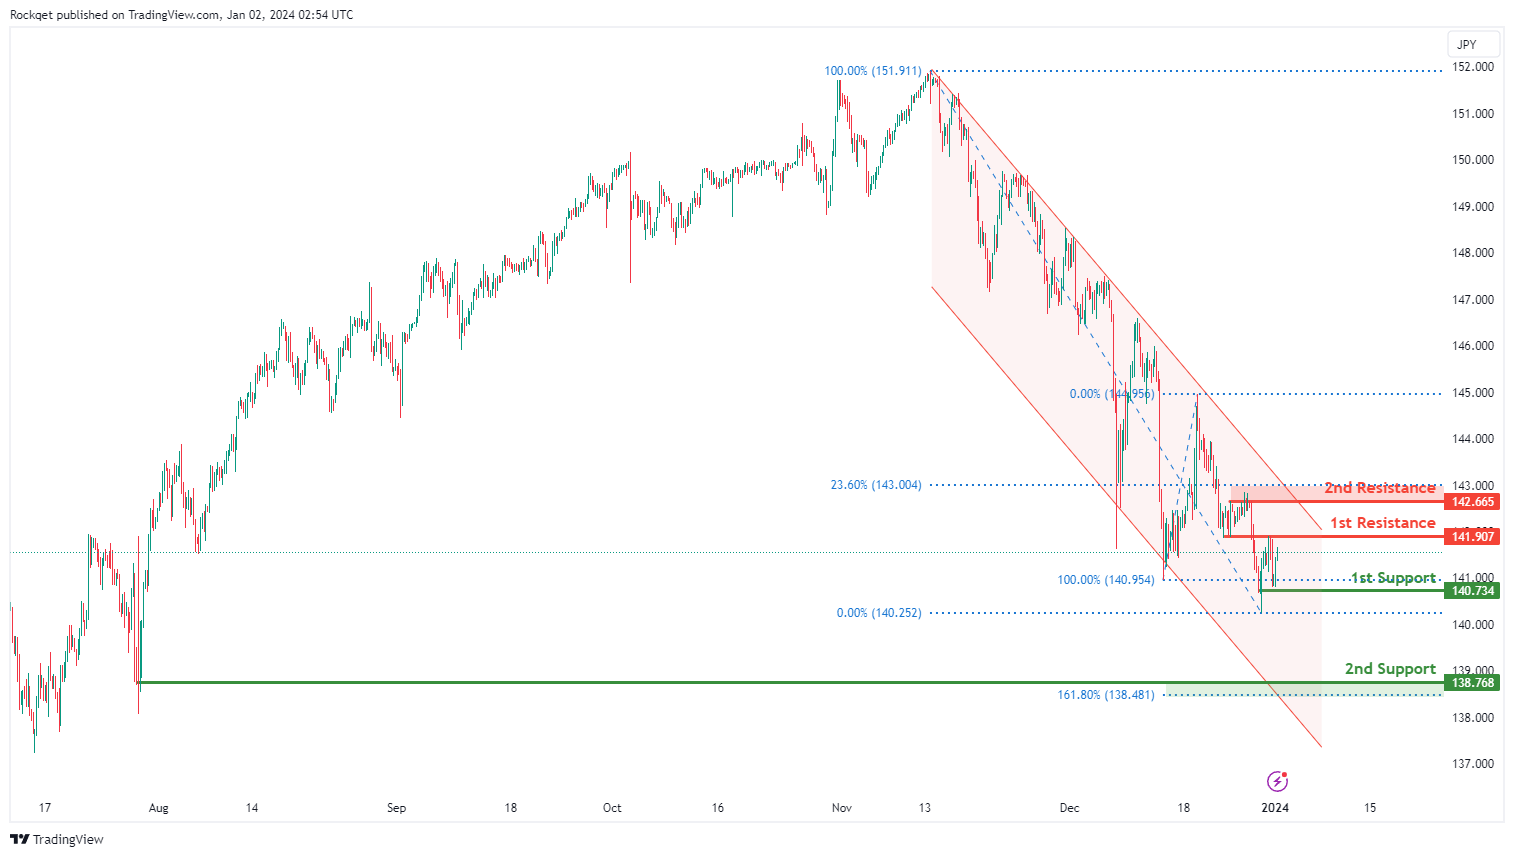
USD/JPY:
The USD/JPY chart currently exhibits an overall bearish momentum. However, there is a potential for price to rise towards the 1st resistance.
The 1st resistance level at 141.90 is identified as an overlap resistance. Higher up, the 2nd resistance level at 142.66 is marked as a pullback resistance that aligns close to the 23.60% Fibonacci retracement level, suggesting a potential barrier for further upside movement.
To the downside, the 1st support level at 140.73 is identified as a pullback support. Further below, the 2nd support level at 138.76 is noted as a swing-low support that aligns close to the 161.80% Fibonacci extension level, further reinforcing its importance as a key support level.
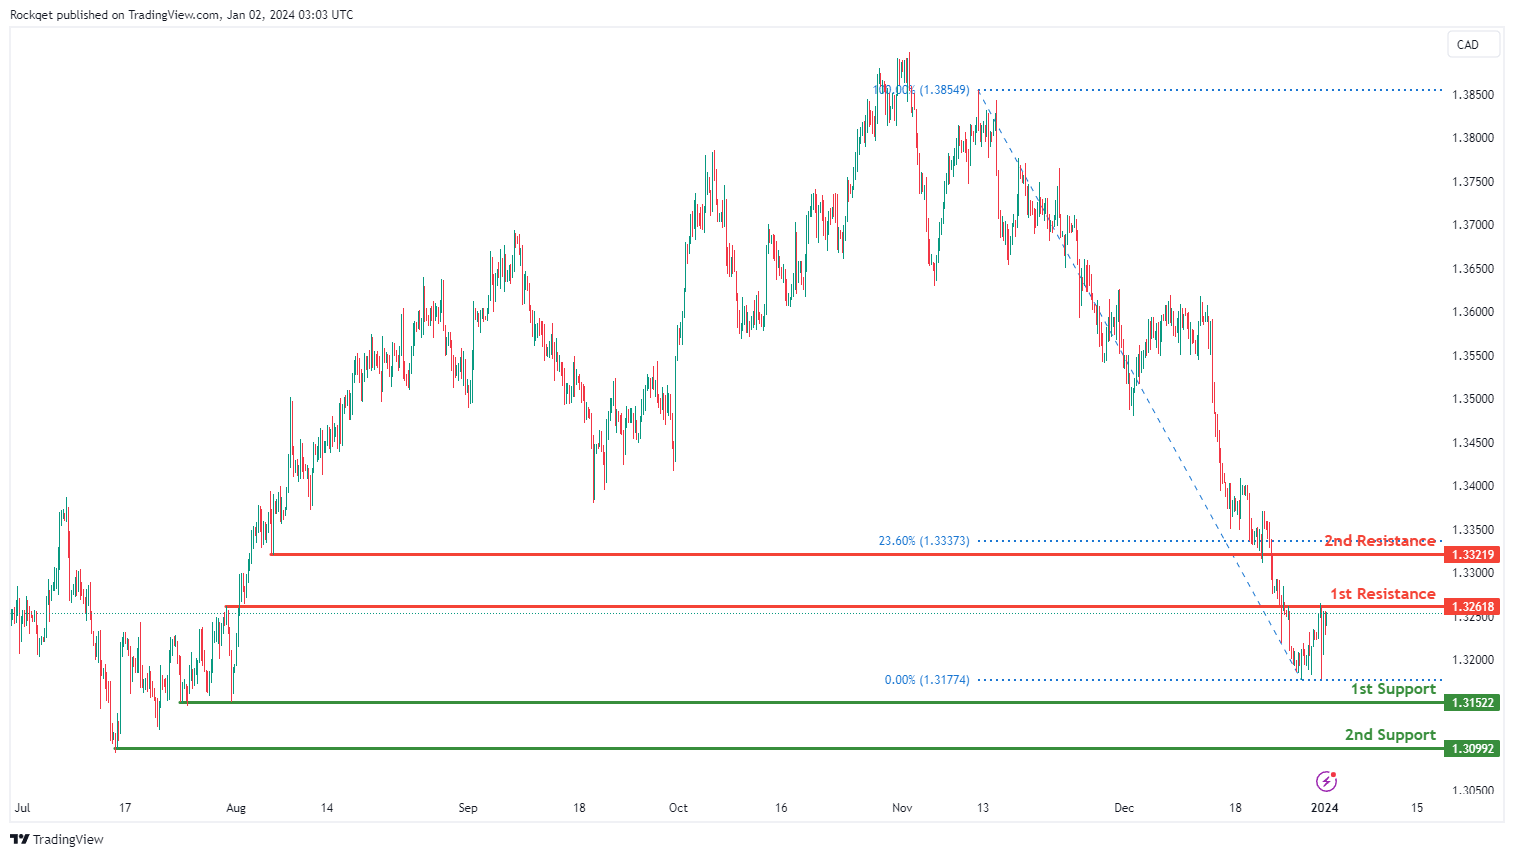
USD/CAD:
The USD/CAD chart currently exhibits an overall bearish momentum. In this context, there is a potential scenario for price to make a bearish reversal off the 1st resistance and drop towards the 1st support.
The 1st resistance level at 1.3261 is identified as an overlap resistance. Higher up, the 2nd resistance level at 1.3321 is marked as a pullback resistance that aligns with the 2360% Fibonacci retracement level, suggesting a potential barrier for further upside movement.
To the downside, the 1st support level at 1.3152 is identified as a pullback support. Further below, the 2nd support level at 1.3099 is noted as a swing-low support, further reinforcing its importance as a key support level.
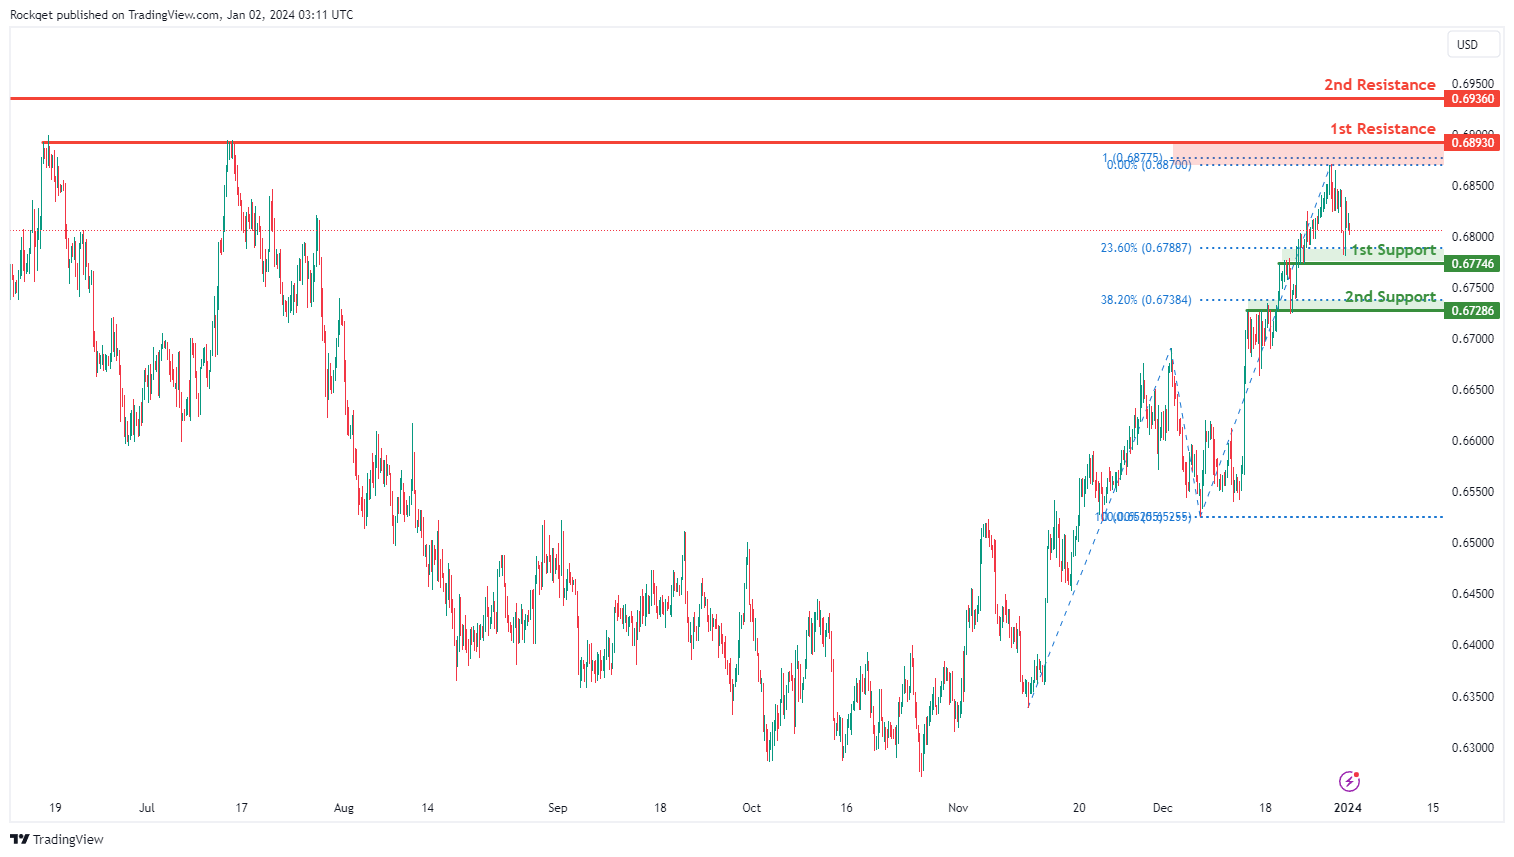
AUD/USD:
The AUD/USD chart currently exhibits an overall bullish momentum. However, there is a potential scenario for price to drop towards the 1st support,
The 1st support level at 0.6774 is identified as an overlap support that aligns close to the 23.60 Fibonacci retracement level. Further below, the 2nd support level at 0.6728 is also marked as an overlap support that aligns close to the 38.20 Fibonacci retracement level, further reinforcing its importance as a key support level.
To the upside, the 1st resistance level at 0.6893 is identified as a multi-swing-high resistance that aligns close to the 100.00% Fibonacci projection level. Higher up, the 2nd resistance level at 0.6936 is noted as a pullback resistance, indicating its potential significance as a barrier for further upward movement.
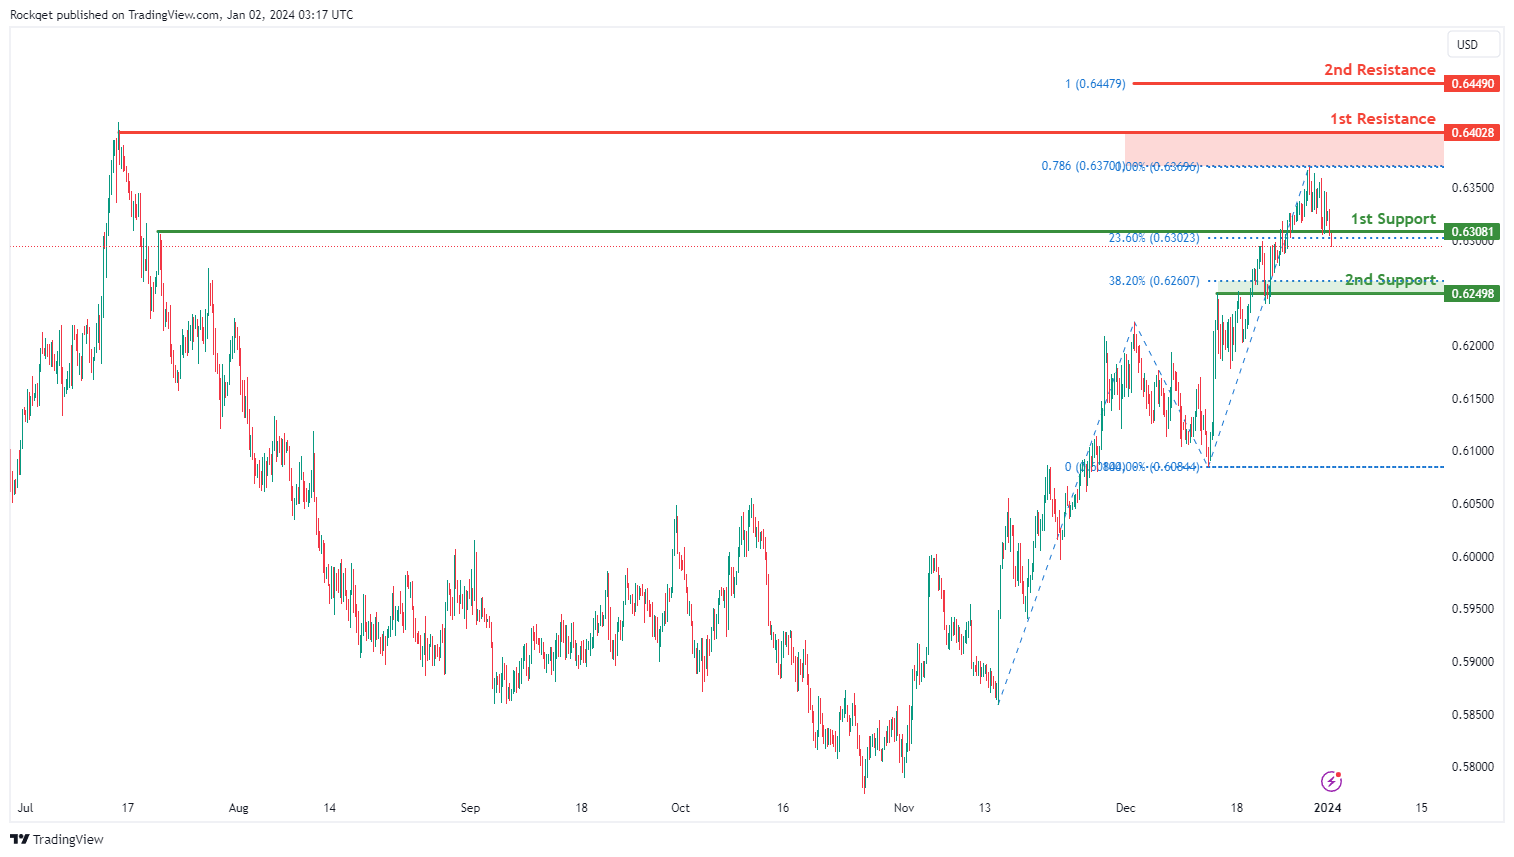
NZD/USD
The NZD/USD chart currently exhibits an overall bullish momentum. However, there is a potential scenario for price to break below the 1st support and fall towards the 2nd support to mark the start of a bearish downward trend.
The 1st support level at 0.6308 is identified as an overlap support that is close to the 23.60% Fibonacci retracement level. Further below, the 2nd support level at 0.6246 is also noted as an overlap support that is close to with the 38.20% Fibonacci retracement level, further reinforcing its importance as a key support level.
To the upside, the 1st resistance level at 0.6402 is identified as a swing-high resistance that aligns close to the 78.60% Fibonacci projection level. Higher up, the 2nd resistance level at 0.6449 is marked as a resistance that aligns with the 100.00% Fibonacci projection level, indicating its potential significance as a barrier for further upward movement.
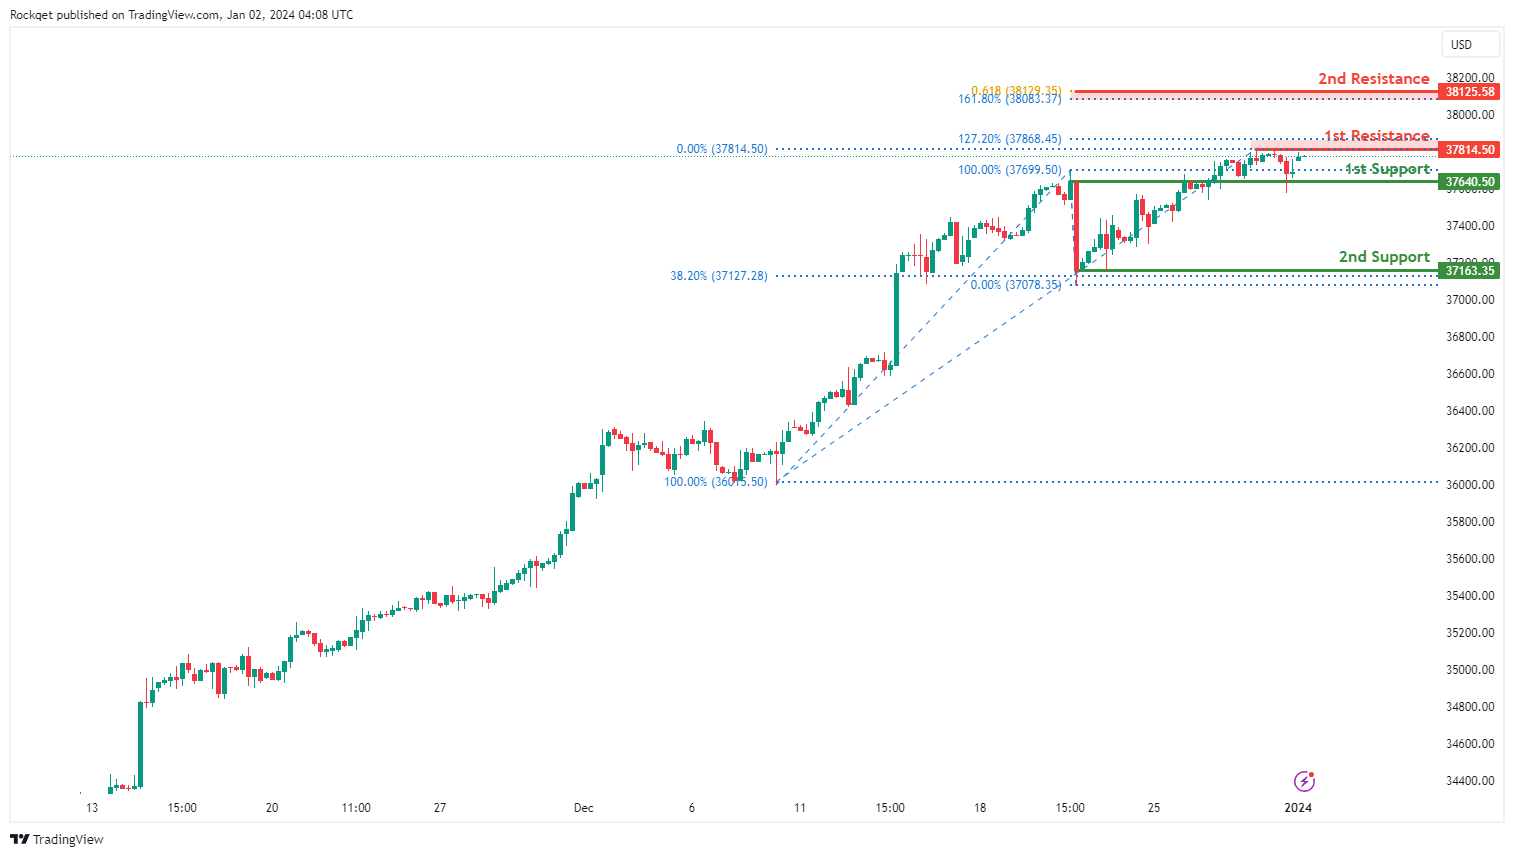
DJ30:
The DJ30 chart currently exhibits a bullish overall momentum. However, there is a potential for price to fluctuate between the 1st resistance and the 1st support.
The 1st resistance at 37,814.50 is associated with a pullback resistance that aligns with the 127.20% Fibonacci extension level. Furthermore, the 2nd resistance at 38,125.58 represents a resistance that aligns with a confluence of Fibonacci levels i.e. the 161.80% extension and the 61.80% projection levels, indicating a level where selling interest could intensify.
To the downside, the 1st support at 37,640.50 is considered as an overlap support. Additionally, the 2nd support at 37,163.35 is identified as a swing-low support that aligns with the 38.20% Fibonacci retracement level, providing an additional layer of potential support.
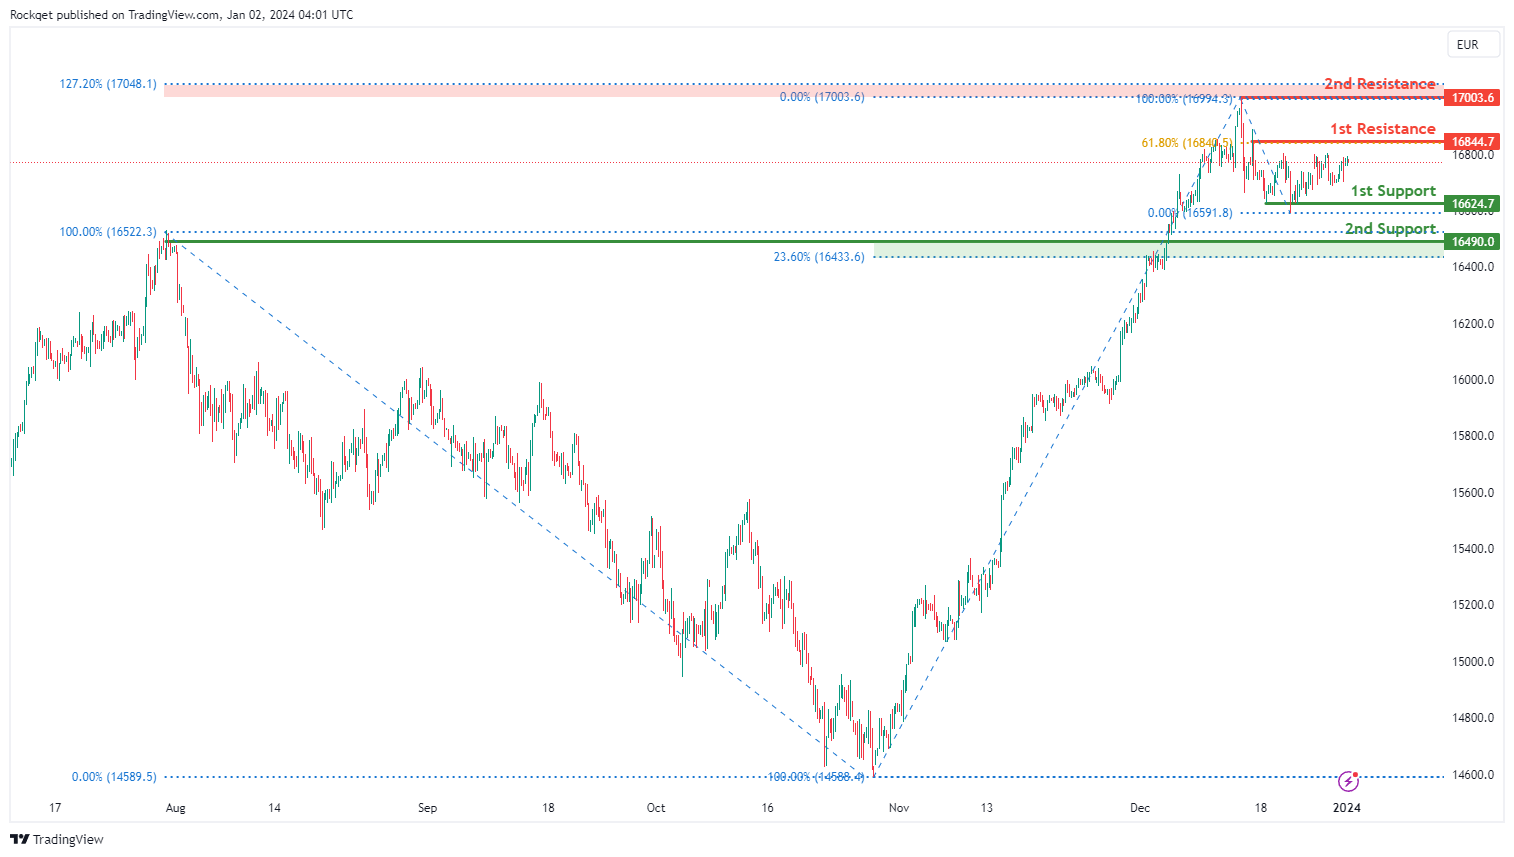
GER40:
The GER40 chart currently exhibits a bullish overall momentum. However, there is a potential for price to fluctuate between the 1st resistance and the 1st support.
The 1st resistance at 16,844.70 is associated with a pullback resistance that aligns with the 61.80% Fibonacci retracement level. Furthermore, the 2nd resistance at 17,003.60 represents a swing-high resistance that aligns with the 127.20% Fibonacci extension level, indicating a level where selling interest could intensify.
To the downside, the 1st support at 16,624.70 is considered as a pullback support. Additionally, the 2nd support at 16,490.00 is also identified as a pullback support that aligns with the 23.60% Fibonacci retracement level, providing an additional layer of potential support.
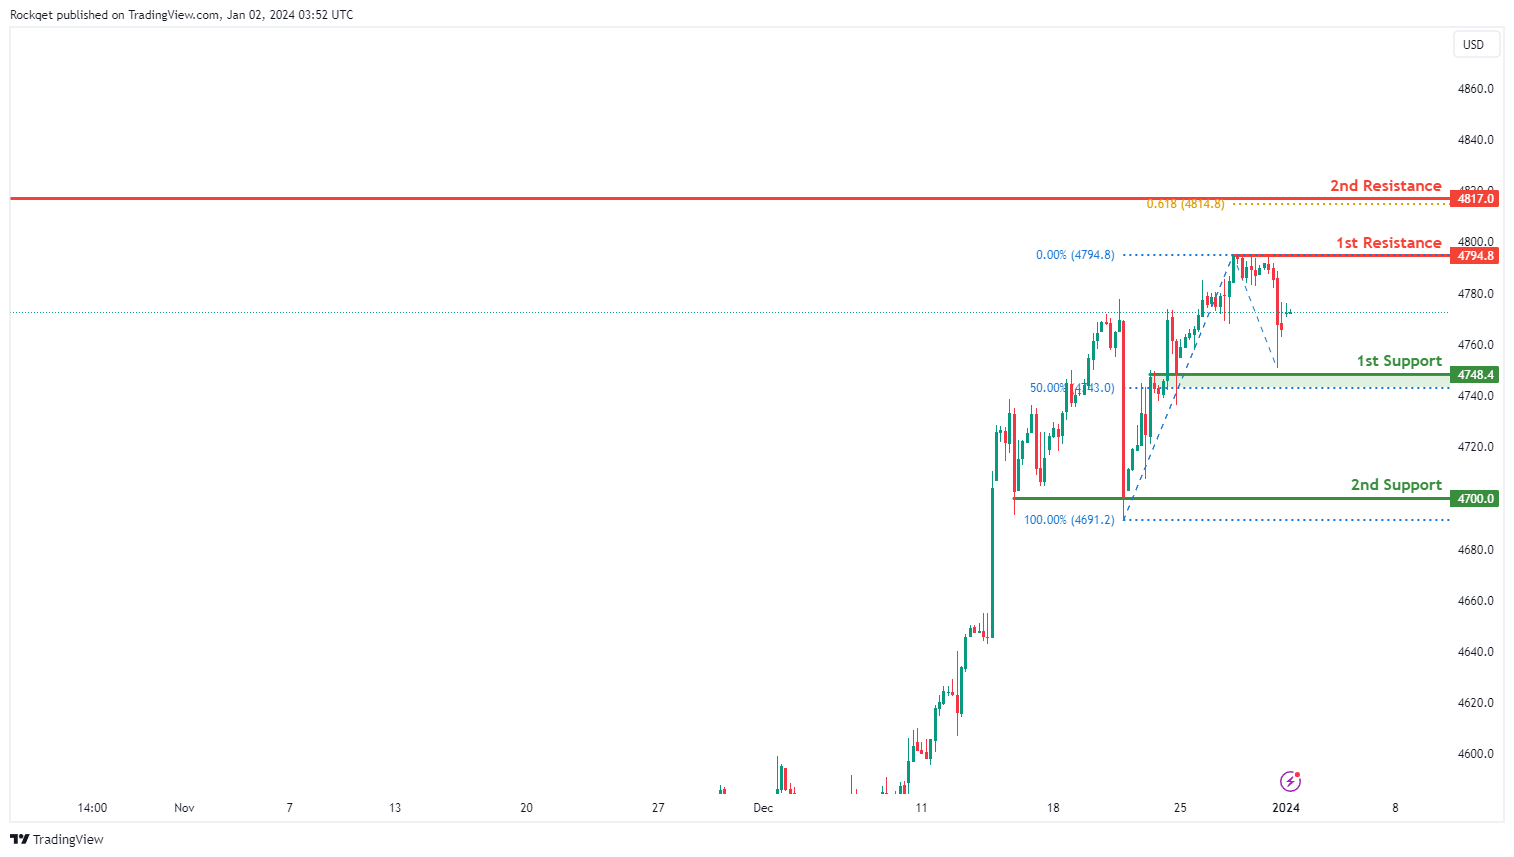
US500:
The US500 chart currently maintains an overall bullish momentum. However, there is a potential for price to fluctuate between the 1st resistance and the 1st support.
The 1st resistance at 4,794.80 is associated with a pullback resistance. Furthermore, the 2nd resistance at 4,817.00 represents a swing-high resistance that aligns with the 61.80% Fibonacci projection level, indicating a level where selling interest could intensify.
To the downside, the 1st support at 4,748.40 is considered as an overlap support that aligns with the 50.00% Fibonacci retracement level. Additionally, the 2nd support at 4,700.00 is identified as a pullback support, providing an additional layer of potential support.
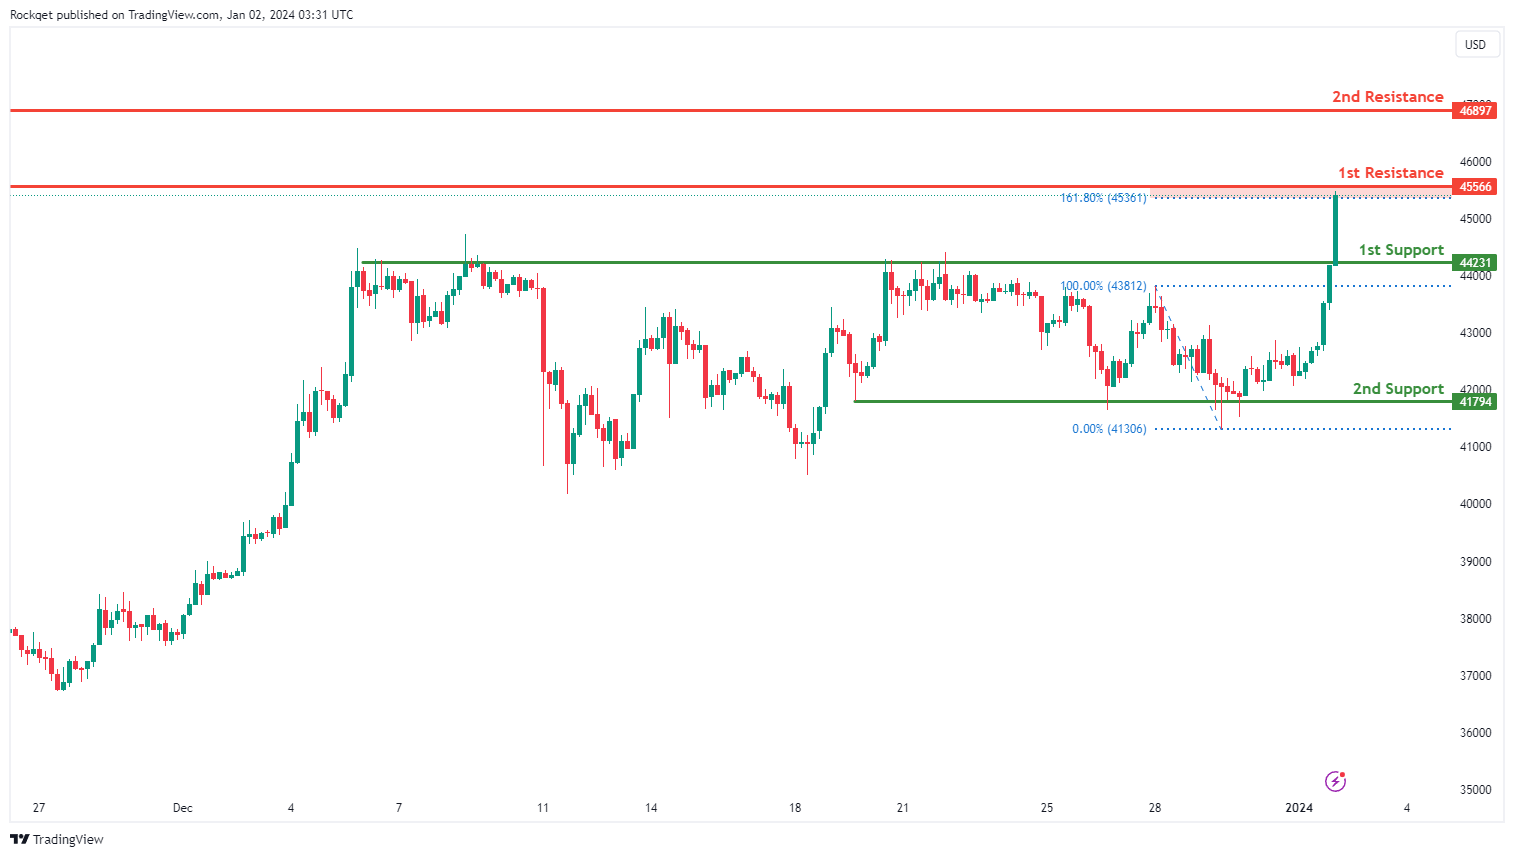
BTC/USD:
The BTC/USD chart currently displays an overall bullish momentum, suggesting a potential scenario for price to make a bullish continuation towards the 1st resistance.
The 1st resistance at 45,566 is associated with a pullback resistance that aligns close to the 161.80% Fibonacci extension level. Furthermore, the 2nd resistance at 46,897 represents an overlap resistance, indicating a level where selling interest could intensify.
To the downside, the 1st support at 44,231 is considered as a pullback support. Additionally, the 2nd support at 41,794 is also identified as a pullback support, providing an additional layer of potential support.
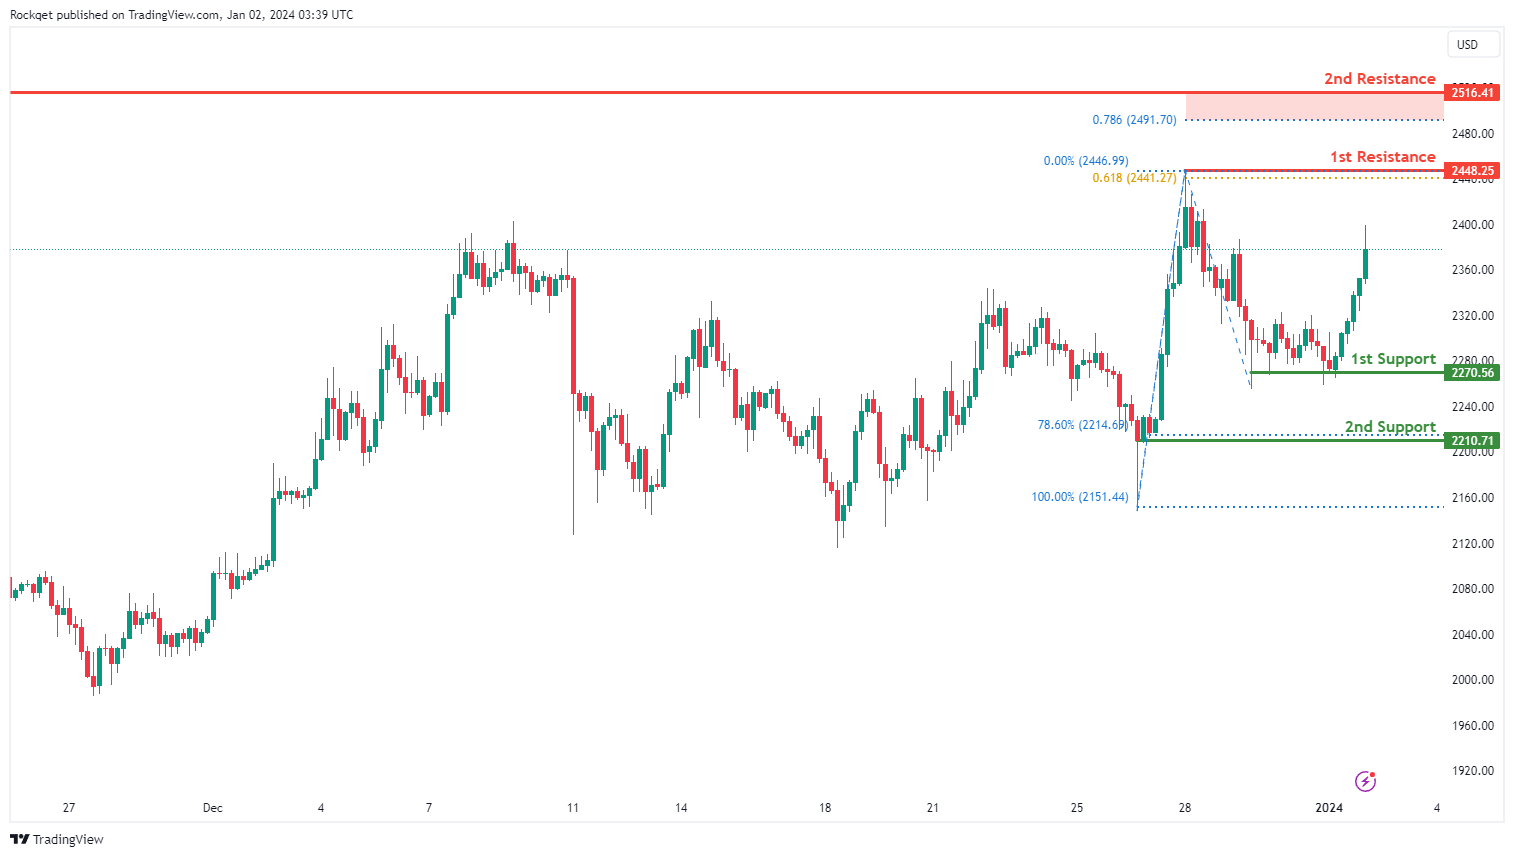
ETH/USD:
The ETH/USD chart currently exhibits an overall bullish momentum, suggesting a potential scenario for price to make a bullish continuation towards the 1st resistance.
The 1st resistance at 2,4448.25 is associated with a swing high resistance that aligns with the 61.80% Fibonacci projection level. Furthermore, the 2nd resistance at 2,516.41 represents a pullback resistance that aligns close to the 78.60% Fibonacci projection level, indicating a level where selling interest could intensify.
To the downside, the 1st support at 2,270.56 is considered as a pullback support that aligns with the 61.80% Fibonacci retracement level. Additionally, the 2nd support at 2,210.71 is identified as a swing-low support that aligns with the 78.60% Fibonacci retracement level, providing an additional layer of potential support.
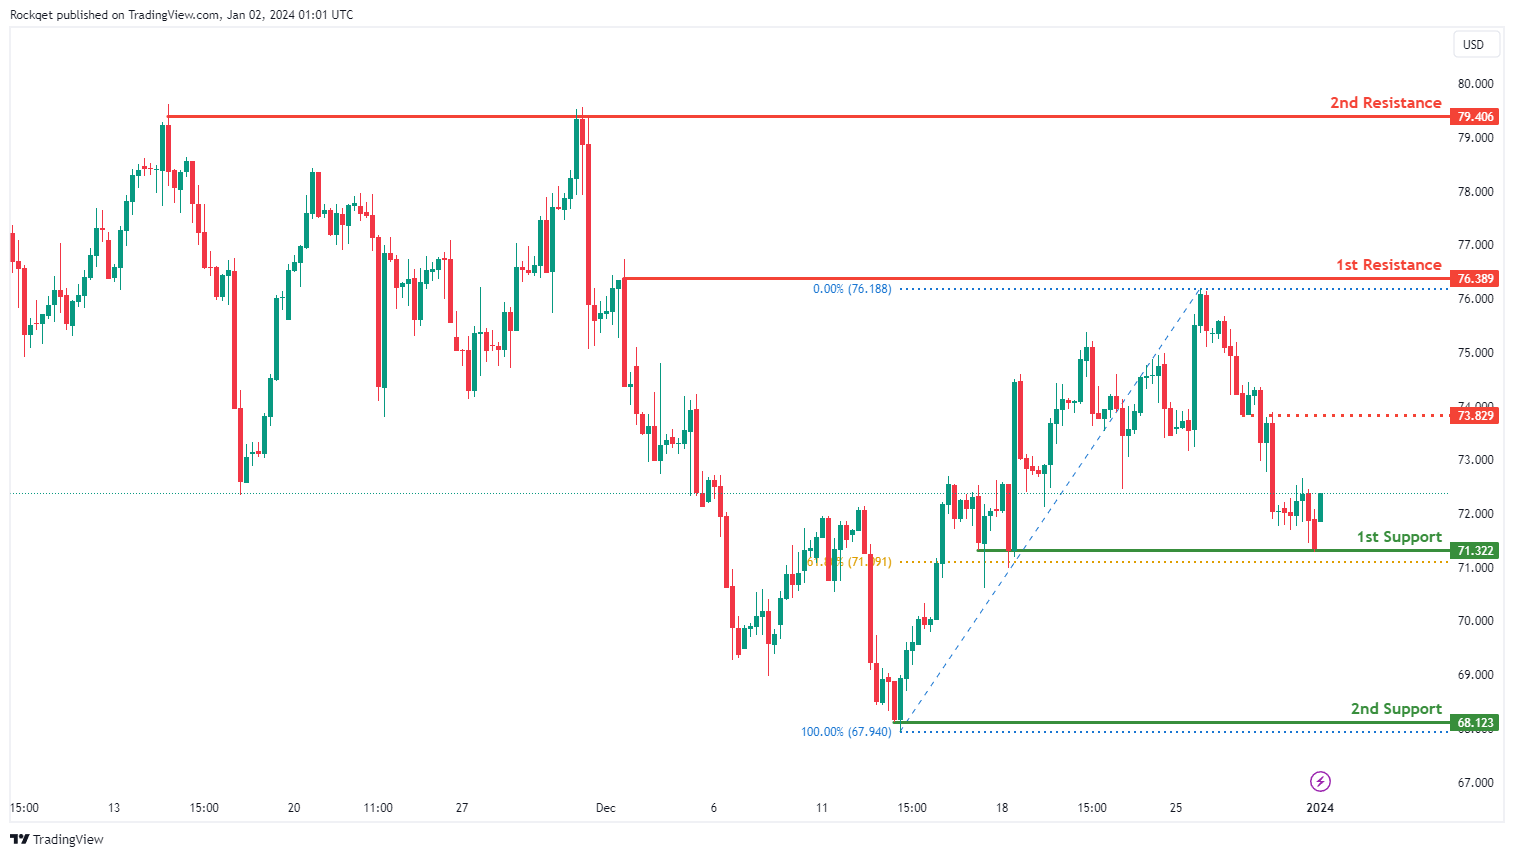
WTI/USD:
The WTI chart currently exhibits an overall bearish momentum. However, there is a potential scenario for price to rise towards the 1st resistance should it break above the intermediate resistance.
The intermediate resistance level at 73.82 is identified as an overlap resistance while the 1st resistance level at 76.38 is identified as a pullback resistance. Higher up, the 2nd resistance level at 79.40 is noted as a multi-swing-high resistance, further indicating its potential significance as a barrier for further upward movement.
To the downside, the 1st support level at 71.32 is identified as a pullback support that aligns close to the 61.80% Fibonacci retracement level. Further below, the 2nd support level at 68.12 is marked as a swing-low support, reinforcing its importance as a key support level.
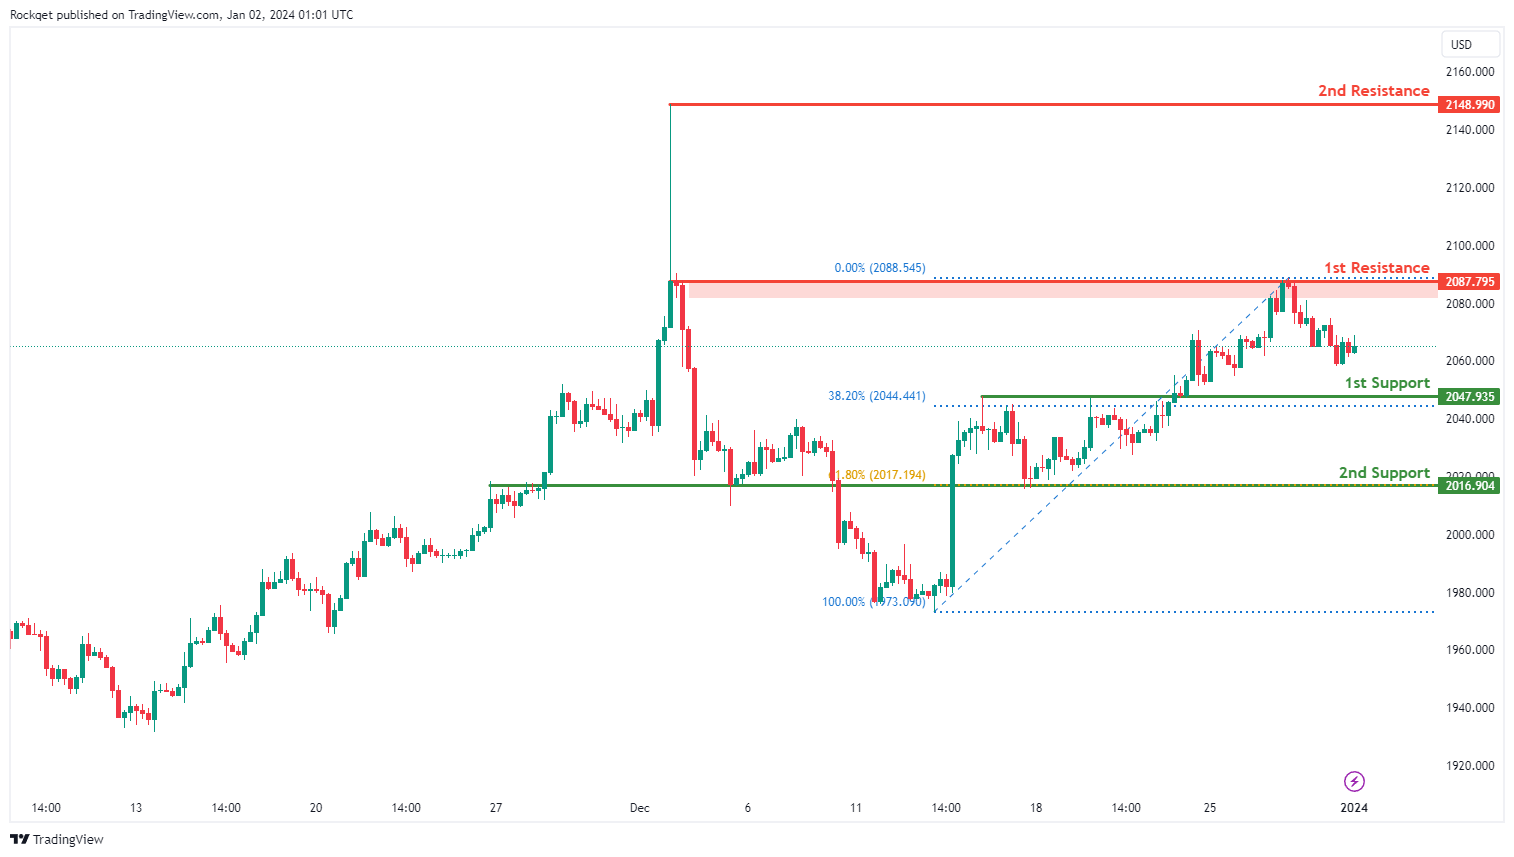
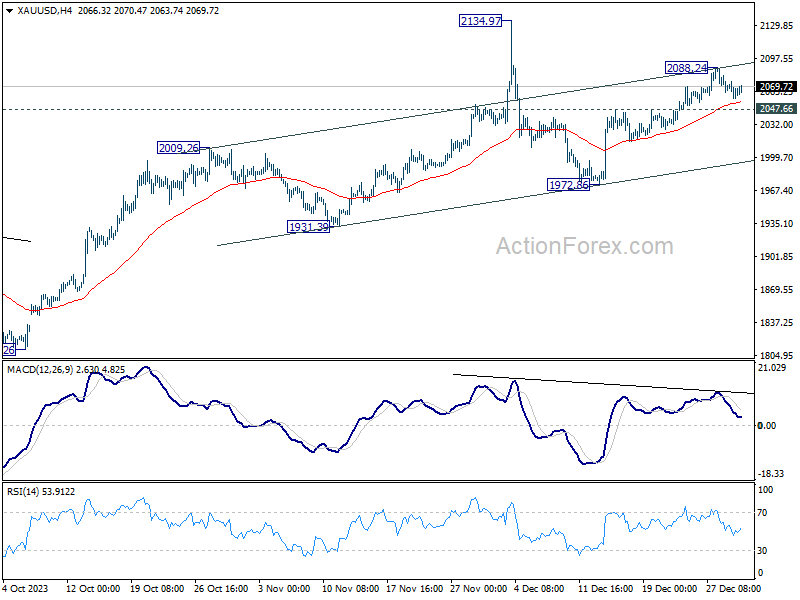
XAU/USD (GOLD):
The XAU/USD chart currently demonstrates a bullish momentum, indicating a potential for price to make a bullish continuation towards the 1st resistance.
The 1st resistance level at 2,087.79 is identified as a pullback resistance. Higher up, the 2nd resistance level at 2,148.99 is marked as a swing-high resistance, further indicating its potential significance as a barrier for further upward movement.
To the downside, the 1st support level at 2,047.93 is identified as a pullback support that aligns close to the 38.20% Fibonacci retracement level. Further below, the 2nd support level at 2,016.90 is noted as an overlap support that aligns with the 61.80% Fibonacci retracement level, reinforcing its importance as a key support level.
EUR/USD Daily Outlook
Daily Pivots: (S1) 1.1020; (P) 1.1052; (R1) 1.1070; More...
EUR/USD's retreat from 1.1138 extends lower today but stays well above 1.0929 support. Intraday bias remains neutral for the moment. Further rally is expected as long as 1.0929 support holds. Break of 1.1138 will resume the rise from 1.0447 to retest 1.1274 high. Strong resistance should be seen from there to limit upside, at least on first attempt. Meanwhile, break of 1.0929 will indicate short term topping and turn bias back to the downside for 1.0772 support.
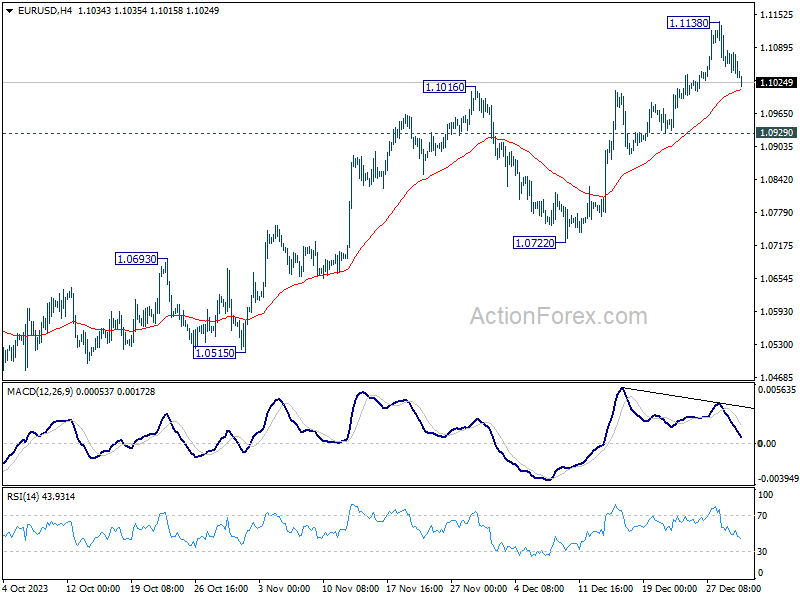
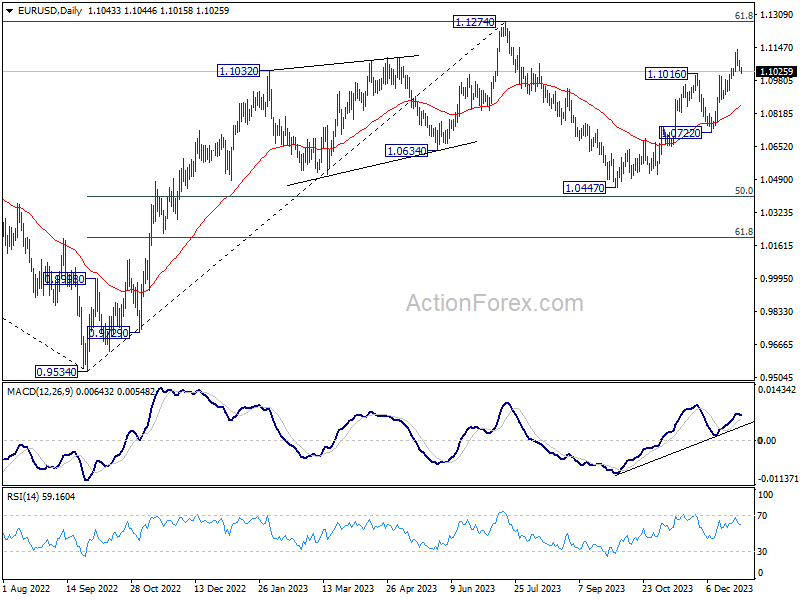
In the bigger picture, price actions from 1.1274 are viewed as a corrective pattern to rise from 0.9534 (2022 low). Rise from 1.0447 is seen as the second leg. While further rally could cannot be ruled out, upside should be limited by 1.1274 to bring the third leg of the pattern. Meanwhile, sustained break of 1.0722 support will argue that the third leg has already started for 1.0447 and below.
Dollar Gains on Risk-Off Mood: Mixed China Data and Japan Earthquake Drive Cautious Trading
Dollar gains modest ground in Asian session today, driven by mild risk-off sentiment. Mixed data emerging from China's PMI manufacturing sector has cast a shadow over market sentiment, contributing to a tepid start in Hong Kong's stock market. The HSI index is grappling with the aftermath of its fourth consecutive year of losses, as a prolonged period of underperformance continues.
Contrasting this, Japanese Yen is showing a broad softening while Japan is on holiday. A powerful earthquake in Japan's central region on New Year's Day adds a layer of uncertainty to the economic outlook. Investors are closely monitoring the situation, assessing the potential repercussions of this natural disaster.
In Europe, both the Swiss Franc and the Euro are seeing The British Pound, meanwhile, is showing a mixed performance. Meanwhile, Aussie and Loonie are on the firmer side.
Looking ahead, trading activity is poised to intensify with focus on crucial economic data releases. Markets are particularly attuned to ISMs and NFP from US, as well as inflation data from Eurozone. FOMC minutes is also a major highlight.
Technically, Gold lost much upside momentum after hitting channel resistance (disregarding the exaggerated spike to 2134.97 on thin liquidity). For now, further rise is still in favor as long as 2047.66 resistance turned support holds. Sustained break of the channel resistance could prompt upside acceleration. However, break of 2047.66 will bring deeper pull back to channel support (now at around 2000 psychological level.
In Asia, at the time of writing, Hong Kong HSI is down -1.45%. China Shanghai SSE is down -0.21%. Singapore Strait Times is down -0.27%. Japan is on holiday.
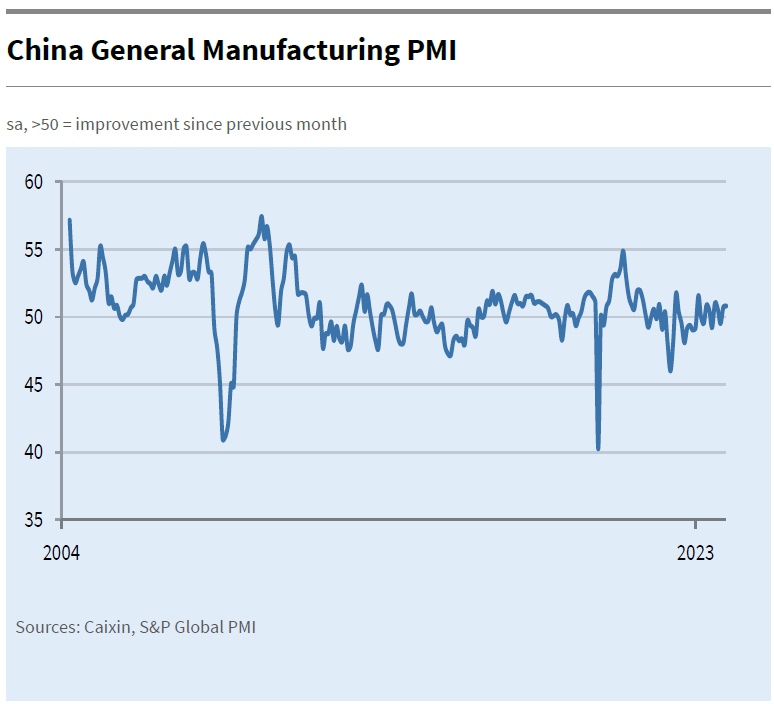
China's Caixin PMI manufacturing rises, as NBS PMI shows contraction
December brought mixed signals from China's manufacturing sector, as indicated by two key indices: Caixin PMI and official NBS PMI. Caixin PMI Manufacturing slightly increased from 50.7 to 50.8, surpassing expectations of 50.4, suggesting a marginal yet steady expansion in the manufacturing sector. Notably, Caixin highlighted that both output and new orders are rising at faster rates, indicating increased production and demand within the industry.
However, the same period saw a dip in official PMI Manufacturing, which fell from 49.4 to 49.0. This decline suggests contraction in the sector, contrasting with optimism reflected in Caixin PMI data. The difference between these two indices can be attributed to their varied focus groups; Caixin PMI typically surveys small and medium-sized enterprises, while NBS PMI is more reflective of larger, state-owned companies.
Wang Zhe, Senior Economist at Caixin Insight Group, emphasized the improved economic outlook for the manufacturing sector, with expanding supply and demand, and stable price levels. Yet, he also pointed out significant challenge in employment, highlighting businesses' cautious approach in areas like hiring, raw material purchasing, and inventory management.
On the other hand, NBS PMI Non-Manufacturing showed a slight improvement, rising from 50.2 to 50.4. This marginal increase suggests a modest expansion in China's services sector.
Bitcoin Price Rallies On Rumors of Spot ETF Approval
Bitcoin is trying to resume its medium term up trend, breaking 45k handle for the first time in nearly two years. Bitcoin could be gathering momentum at the start of the year in anticipation of two important events. One is SEC approval of one or several of the 14 outstanding applications for a spot Bitcoin ETF product, currently pending a decision with the regulator. Another is The halving, which happens every four years, is an event written in bitcoin's code.
Technically, break of 44727 short term top indicates resumption of whole up trend from 15452 (2022 low). Near term outlook will stay bullish as long as 41511 support holds. Next target is 161.8% projection of 15452 to 31815 from 24896 at 51371.
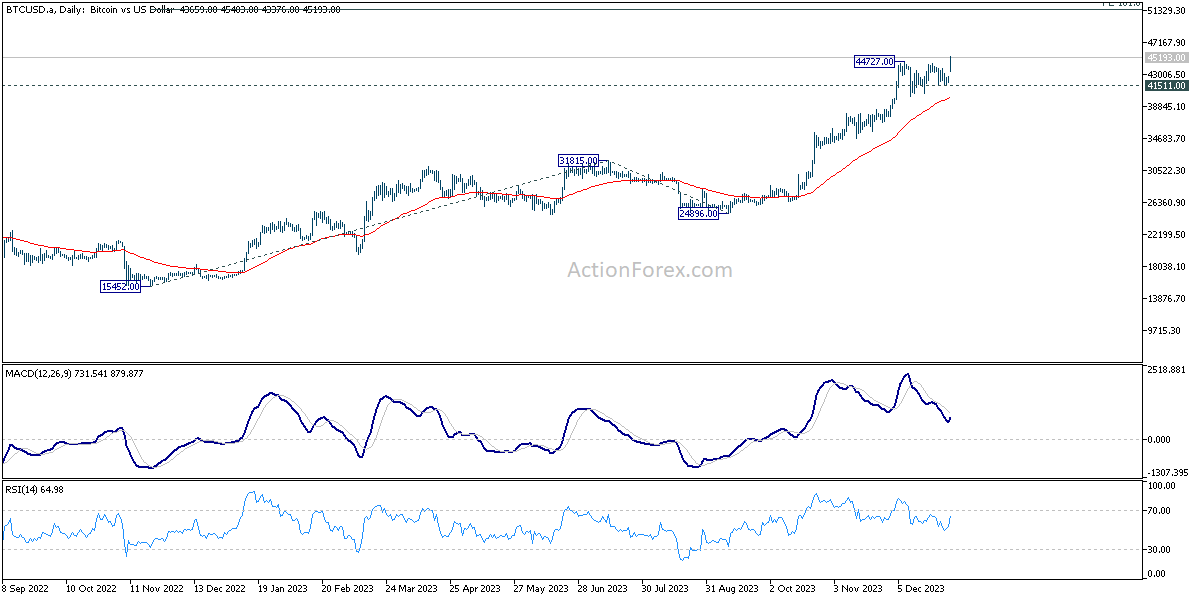
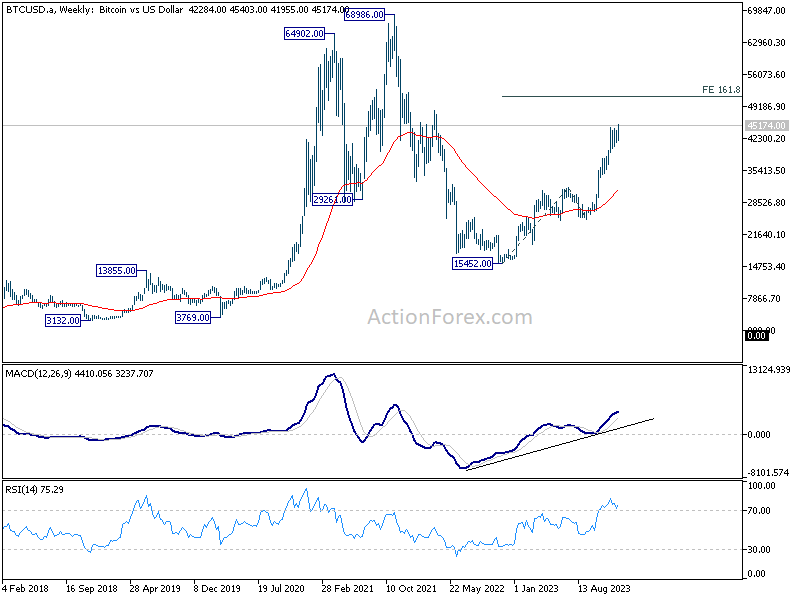
In the bigger picture, upside acceleration as seen in W MACD suggests that rise from 15452 is an impulsive move. Hence, sustained break of 51371 would solidify the case that Bitcoin is ready to resume the long term up trend through 68986 historical high at a later stage.
Fed Minutes, NFP, and Eurozone inflation in focus as year of rate cuts starts
The upcoming release of FOMC's minutes from its December 12-13 meeting is anticipated to shed light on Fed's pivotal policy shift. This meeting is particularly notable for its projection of downward adjustment in interest rates from the current 5.25-5.50% to 4.625% by the end of 2024, followed a further reduction to 3.625% by the end of 2025. The financial community is bracing for insights into FOMC's deliberations on key issues: the planned trajectory of interest rate reductions, with a keen focus on the timing of the initial cut. Current market sentiment, as indicated by Fed funds futures, strongly anticipates a reduction as soon as March, with a probability exceeding 80%.
Furthermore, the upcoming release of US ISM manufacturing and services data, along with non-farm payroll statistics, holds considerable weight. These datasets serve as critical barometers for assessing the strength and resilience of the economy, labor market health, and inflationary undercurrents. Their outcomes will not only provide valuable insights into the current state of the economy but will also play a decisive role in steering Fed's forthcoming policy decisions.
In Europe, Eurozone's CPI flash report is drawing considerable attention. Forecast suggests rebound in headline inflation to 3.0%, while core inflation is expected to continue its slowdown to 3.4%. ECB, yet to signal a shift in policy direction, is closely monitored amidst market speculations about a possible easing of policy in the second quarter. The rate at which inflationary pressures ease will be a critical factor for ECB as it contemplates the appropriate timing for reducing borrowing costs.
Canadian economic scenario is also under scrutiny, with the focus on employment data. Unemployment rate, which has been on a gradual uptick since last May, is projected to increase further to 5.9%. A crucial factor in this context is the rate at which job market is loosening and the economy is slowing down. These dynamics will be pivotal in influencing BoC decision on whether to initiate interest rate cuts this year.
Here are some highlights for the week:
- Tuesday: China Caixin PMI manufacturing; Eurozone PMI manufacturing final, M3 money supply; UK PMI manufacturing final; Canada PMI manufacturing; US PMI manufacturing final, construction spending.
- Wednesday: Swiss PMI manufacturing; Germany unemployment; US ISM manufacturing, FOMC minutes.
- Thursday: Japan PMI manufacturing final; China Caixin PMI services; Germany CPI flash; Eurozone PMI services final; UK PMI services final, M4 money supply, mortgage approvals; US Challenger job cuts, ADP private employment, jobless claims, PMI services final.
- Friday: Japan monetary base, consumer confidence; Germany retail sales; UK PMI construction; Eurozone CPI flash, PPI; Canada employment, Ivey PMI; US non-farm payrolls, ISM services, factory orders.
EUR/USD Daily Outlook
Daily Pivots: (S1) 1.1020; (P) 1.1052; (R1) 1.1070; More...
EUR/USD's retreat from 1.1138 extends lower today but stays well above 1.0929 support. Intraday bias remains neutral for the moment. Further rally is expected as long as 1.0929 support holds. Break of 1.1138 will resume the rise from 1.0447 to retest 1.1274 high. Strong resistance should be seen from there to limit upside, at least on first attempt. Meanwhile, break of 1.0929 will indicate short term topping and turn bias back to the downside for 1.0772 support.
In the bigger picture, price actions from 1.1274 are viewed as a corrective pattern to rise from 0.9534 (2022 low). Rise from 1.0447 is seen as the second leg. While further rally could cannot be ruled out, upside should be limited by 1.1274 to bring the third leg of the pattern. Meanwhile, sustained break of 1.0722 support will argue that the third leg has already started for 1.0447 and below.
Economic Indicators Update
| GMT | Ccy | Events | Actual | Forecast | Previous | Revised |
|---|---|---|---|---|---|---|
| 00:01 | GBP | BRC Shop Price Index Y/Y Nov | 4.30% | 4.30% | ||
| 01:45 | CNY | Caixin Manufacturing PMI Dec | 50.8 | 50.4 | 50.7 | |
| 08:45 | EUR | Italy Manufacturing PMI Dec | 44.4 | 44.4 | ||
| 08:50 | EUR | France Manufacturing PMI Dec F | 42 | 42 | ||
| 08:55 | EUR | Germany Manufacturing PMI Dec F | 43.1 | 43.1 | ||
| 09:00 | EUR | Eurozone Manufacturing PMI Dec F | 44.2 | 44.2 | ||
| 09:00 | EUR | Eurozone M3 Money Supply Y/Y Nov | -1% | -1% | ||
| 09:30 | GBP | Manufacturing PMI Dec F | 46.4 | 46.4 | ||
| 14:30 | CAD | Manufacturing PMI Dec | 47.7 | |||
| 14:45 | USD | Manufacturing PMI Dec F | 48.2 | 48.2 | ||
| 15:00 | USD | Construction Spending M/M Nov | 0.60% | 0.60% |
Bitcoin Price Rallies On Rumors of Spot ETF Approval
Key Highlights
- Bitcoin price started a fresh rally after rumors of spot ETF approval by today.
- BTC broke a major declining channel with resistance at $43,000 on the 4-hour chart.
- The price could continue higher if it remains stable above $44,000.
- The US Manufacturing PMI could remain at 48.2 in Dec 2023.
Bitcoin Price Technical Analysis
Bitcoin price remained strong above the $42,000 support zone. BTC formed a base and recently started a fresh increase as rumors of spot ETF approval escalated.
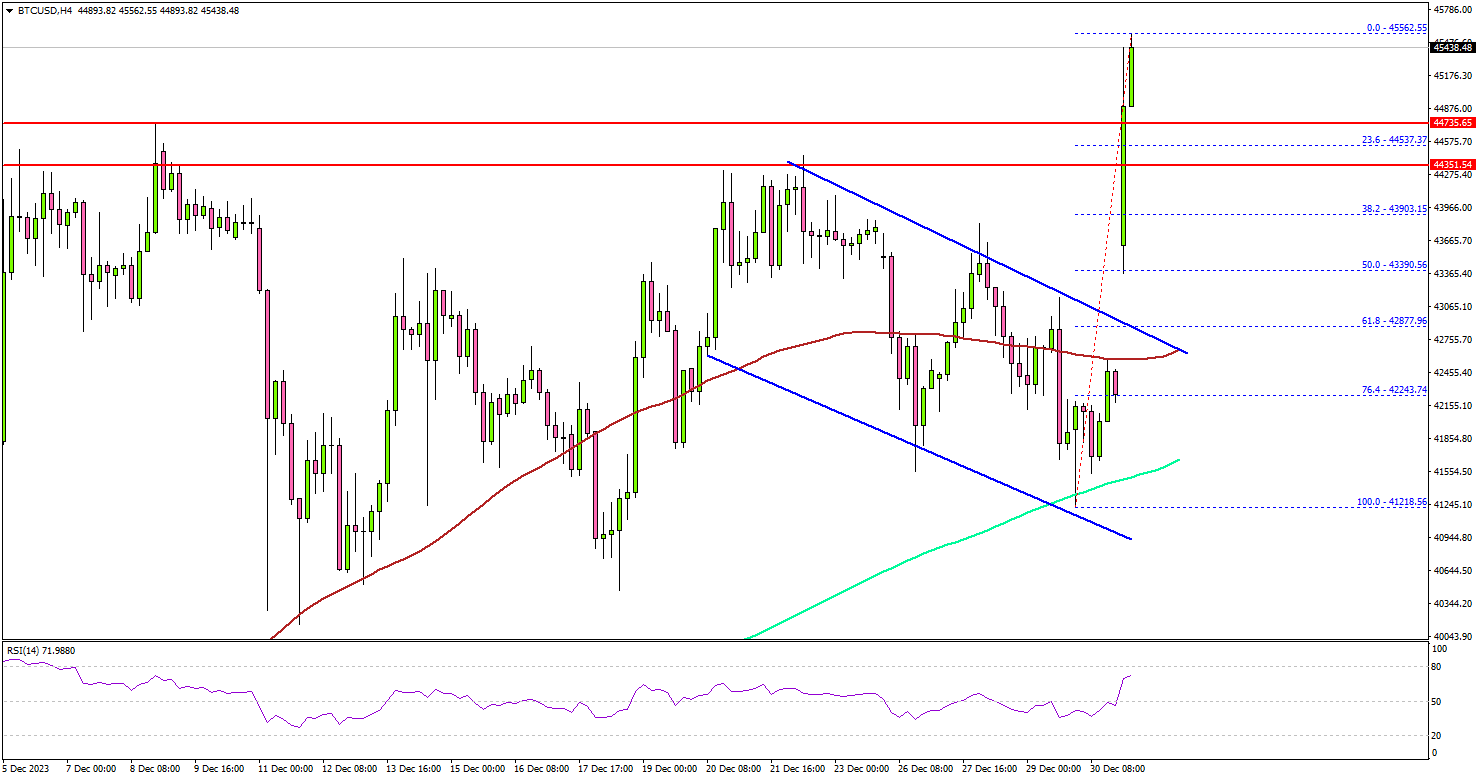
Looking at the 4-hour chart, the price broke many hurdles near $43,000. It broke a major declining channel with resistance at $43,000. The price even settled above $44,000, the 100 simple moving average (red, 4 hours), and the 200 simple moving average (green, 4 hours).
A new multi-week high was formed near $45,562 and the price is now consolidating gains. If there is a fresh increase, Bitcoin could face resistance near $46,200.
The next resistance is near $48,000. A successful close above the $48,000 level might start a decent increase. In the stated case, the price may perhaps rise toward the $50,000 level.
If not, the price might start a downside correction. Immediate support is near the $44,750 level. The next major support is near $44,350. Any more losses might send the price toward the $43,000 level.
Economic Releases
- Euro Zone Manufacturing PMI for Dec 2023 – Forecast 44.2, versus 44.2 previous.
- UK Manufacturing PMI for Dec 2023 – Forecast 46.4, versus 46.4 previous.
- US Manufacturing PMI for Dec 2023 – Forecast 48.2, versus 48.2 previous.
Bitcoin breaks 45k barrier, eyeing 50k
Bitcoin soars notably today, and breaks 45k mark for the first time in nearly two years, signaling a resurgence in its medium-term uptrend. The flagship cryptocurrency could be gathering momentum to extend its medium term up trend at the start of the year.
Two key events are driving this optimism: the pending SEC approval for spot Bitcoin ETF products, with 14 applications currently under review, and the much-anticipated Bitcoin halving event, a code-embedded process that occurs every four years.
From a technical perspective, break of 44727 short term top indicates resumption of whole up trend from 15452 (2022 low). Near term outlook will stay bullish as long as 41511 support holds. Next target is 161.8% projection of 15452 to 31815 from 24896 at 51371.
In the bigger picture, upside acceleration as seen in W MACD suggests that rise from 15452 is an impulsive move. Hence, sustained break of 51371 would solidify the case that Bitcoin is ready to resume the long term up trend through 68986 historical high at a later stage.
China’s Caixin PMI manufacturing rises, as NBS PMI shows contraction
December brought mixed signals from China's manufacturing sector, as indicated by two key indices: Caixin PMI and official NBS PMI. Caixin PMI Manufacturing slightly increased from 50.7 to 50.8, surpassing expectations of 50.4, suggesting a marginal yet steady expansion in the manufacturing sector. Notably, Caixin highlighted that both output and new orders are rising at faster rates, indicating increased production and demand within the industry.
However, the same period saw a dip in official PMI Manufacturing, which fell from 49.4 to 49.0. This decline suggests contraction in the sector, contrasting with optimism reflected in Caixin PMI data. The difference between these two indices can be attributed to their varied focus groups; Caixin PMI typically surveys small and medium-sized enterprises, while NBS PMI is more reflective of larger, state-owned companies.
Wang Zhe, Senior Economist at Caixin Insight Group, emphasized the improved economic outlook for the manufacturing sector, with expanding supply and demand, and stable price levels. Yet, he also pointed out significant challenge in employment, highlighting businesses' cautious approach in areas like hiring, raw material purchasing, and inventory management.
On the other hand, NBS PMI Non-Manufacturing showed a slight improvement, rising from 50.2 to 50.4. This marginal increase suggests a modest expansion in China's services sector.