Sample Category Title
USD/JPY Daily Outlook
Daily Pivots: (S1) 140.50; (P) 141.16; (R1) 142.08; More...
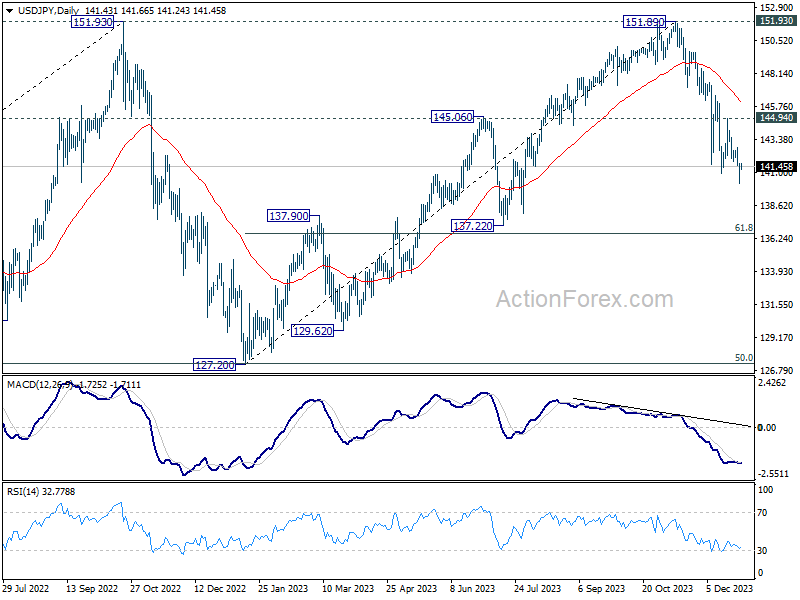
Intraday bias in USD/JPY remains on the downside for the moment. Current fall from 151.89 would target 136.63 fibonacci level. On the upside, above 142.84 minor resistance will turn intraday bias neutral gain. But recovery should be limited below 144.94 resistance to bring another decline.
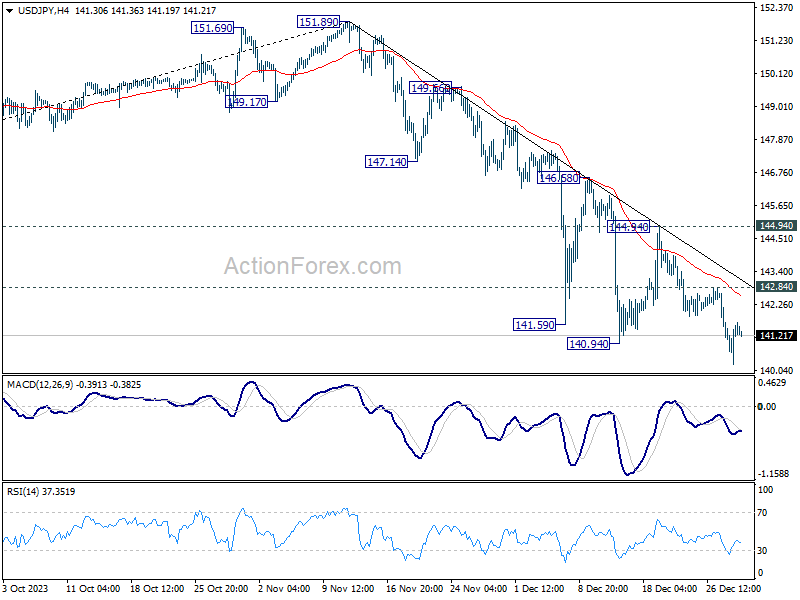
In the bigger picture, fall from 151.89 is seen as the third leg of the corrective pattern from 151.93 (2022 high). Deeper decline would be seen to 61.8% retracement of 127.20 to 151.89 at 136.63, sustained break there will pave the way to 127.20 support (2022 low). This will now remain the favored as long as 146.58 resistance holds.

USD/CAD Daily Outlook
Daily Pivots: (S1) 1.3196; (P) 1.3216; (R1) 1.3249; More...
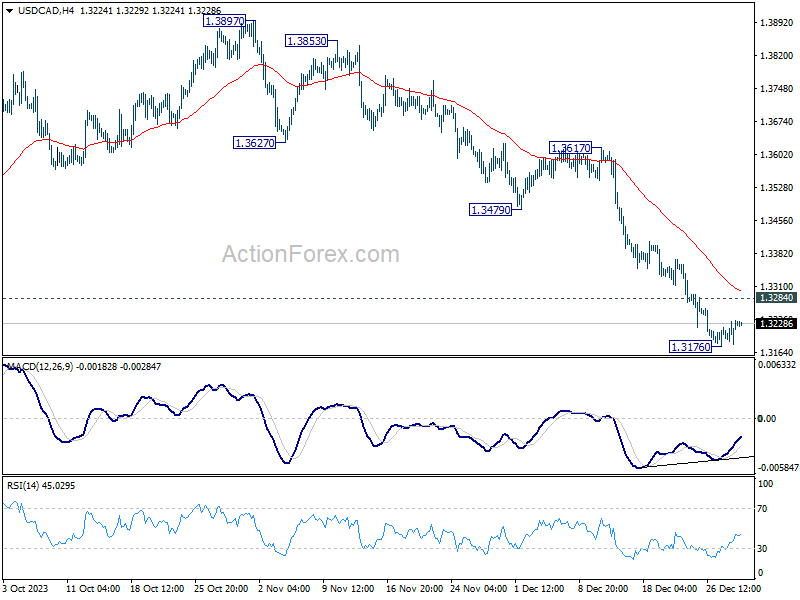
Intraday bias in USD/CAD is turned neutral first with current recovery. On the downside, break of 1.3176 will resume the fall from 1.3897 to 1.3091 support and possibly below. Nevertheless, considering bullish convergence condition in 4H MACD, break of 1.3284 will indicate short term bottoming, and turn bias back to the upside for stronger rebound.
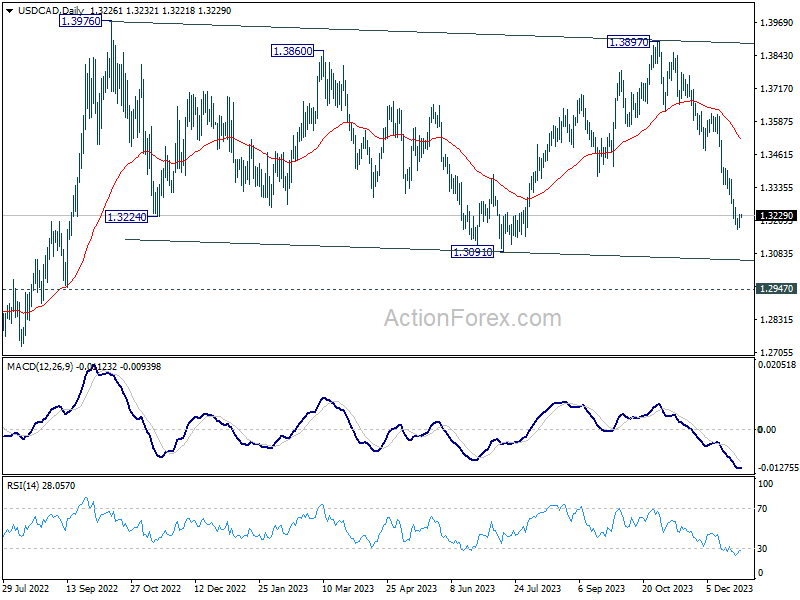
In the bigger picture, outlook is mixed up by deeper then expected fall from 1.3897. But after all, price actions from 1.3976 (2022 high) are viewed as a corrective pattern that's in progress. Larger up trend from 1.2005 (2021 low) is still expected to resume at a later stage as long as 1.2947 resistance turned support holds.
AUD/USD Daily Report
Daily Pivots: (S1) 0.6812; (P) 0.6841; (R1) 0.6859; More...
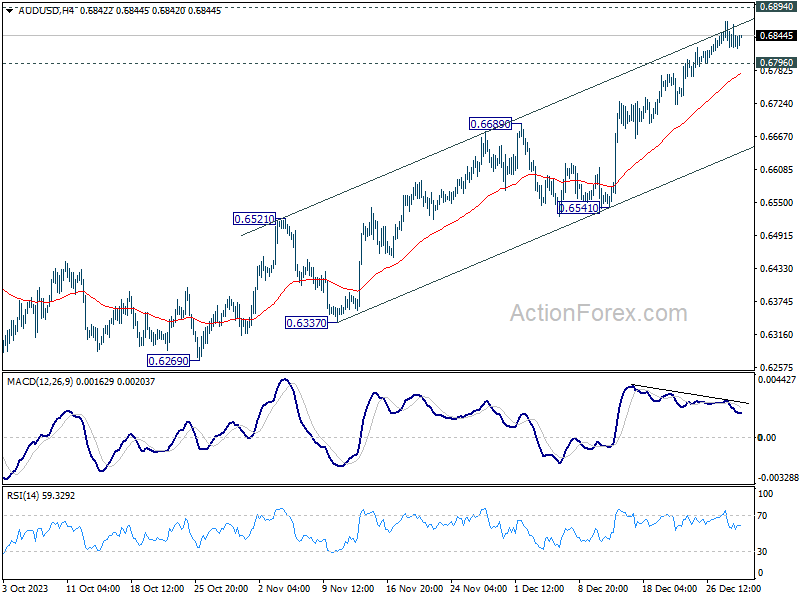
AUD/USD continues to lose upside momentum ahead of 0.6894 resistance and intraday bias is turned neutral first. On the upside, decisive break of 0.6894 will extend the rally from 0.6269 towards 0.7156 key resistance next. On the downside, however, break of 0.6796 support will indicate short term topping, on bearish divergence condition in 4H MACD. Intraday bias will be turned back to the downside for pullback to 0.6689 resistance turned support.
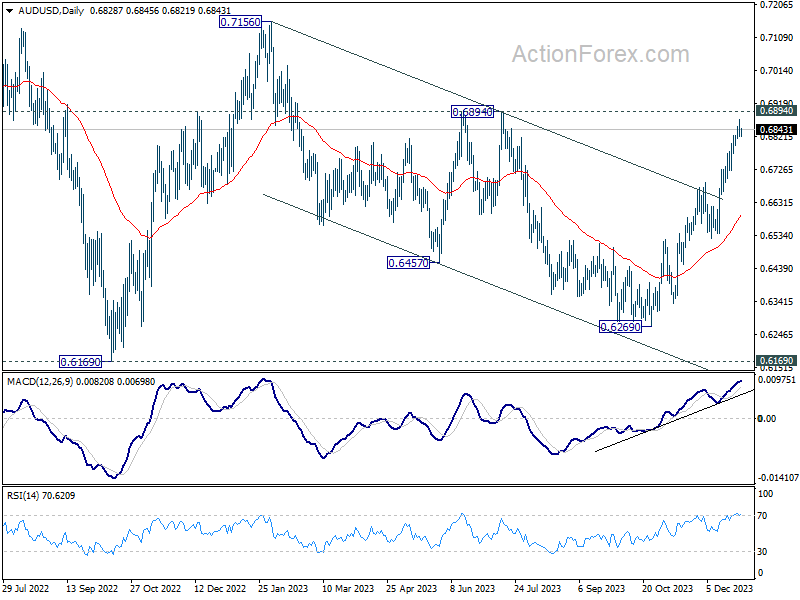
In the bigger picture, there is no confirmation that down trend from 0.8006 (2021 high) has completed. Price actions from 0.6169 (2022 low) could be just a medium term corrective pattern. Rise from 0.6269 is seen as the third leg of the pattern. For now, range trading should be seen between 0.6169 and 0.7156 (2023 high), until further developments.
End-of-Year Forex Market Lull; Bitcoin’s Prospects for Resurgence in 2024 Under Watch
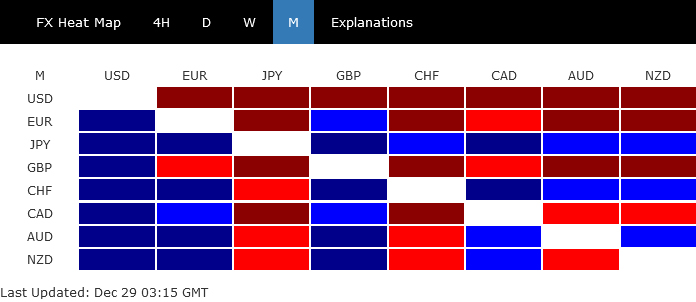
Trading activity is rather subdued in the last Asian session of the year. With no major economic events on the calendar for the day, trading is expected to remain quiet. Dollar is making an attempt to recover but continues to be the weakest performer for the week. It is followed by Euro and Sterling in terms of weak performance. Conversely, Swiss Franc and Japanese Yen are standing out as the strongest currencies. Australian Dollar and New Zealand Dollar are showing slight strength, while Canadian Dollar is leaning towards the weaker side.
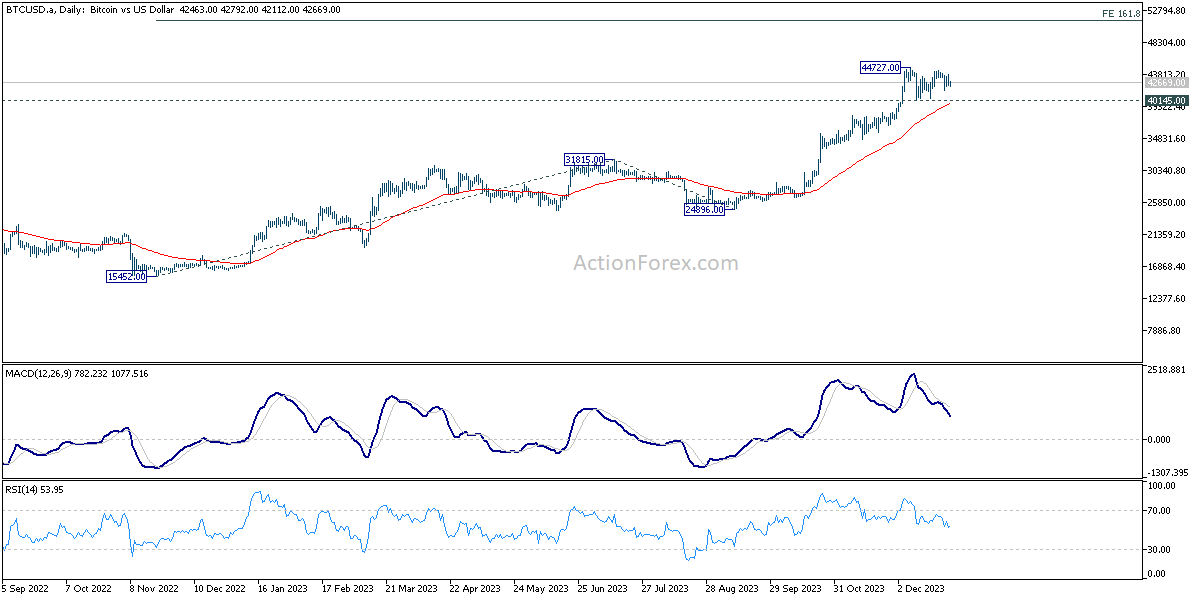
From a technical analysis perspective, a key focus as we enter 2024 is the trajectory of Bitcoin. The primary question is whether Bitcoin will resume its medium-term upward trend towards 50k handle. Consolidation from 44,727 appears to be near completion. Break of 44727 will target 161.8% projection of 15452 to 31815 from 24896 at 51371. However, break of 40145 support will dampen this immediate bullish view, and bring deeper correction first.
In Asia, Nikkei closed down -0.51%. Hong Kong HSI is down -0.04%. China Shanghai SSE is up 0.48%. Singapore Strait Times is up 0.92%. Japan 10-year JGB yield rose 0.0234 at 0.616. Overnight, DOW rose 0.14%. S&P 500 rose 0.04%. NASDAQ fell -0.03%. 10-year yield rose 0.061 to 3.850.
Happy New Year to our readers. We'll be back on January 2.
Dollar marks December as worst performer, market foresees 88% chance of March Fed rate cut
As December 2023 concludes, Dollar is set to be the month's weakest performer. The persistent selloff can be largely attributed to Fed's signal of the possibility of implementing rate cuts totaling 75 basis points in the coming year, as seen in latest economic projections. This unexpected pivot towards more accommodative monetary policy had a ripple effect across financial markets, notably propelling DOW to record highs and bringing S&P 500 close to its peak levels.
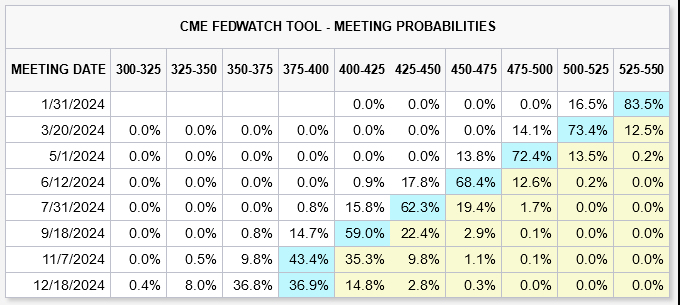
The market's response to Fed's policy shift has been markedly aggressive. Traders have priced in an 88% probability of a 25bps cut as soon as March. Looking ahead to the entirety of 2024, there's a strong consensus, with over an 80% chance, that federal funds rate could decrease to a range of 3.75-4.00%, a notable drop from the current rate of 5.25-5.50%. The underlying rationale for such aggressive market expectations centers around the anticipation of recession in the US next year, a scenario that some analysts believe is increasingly likely.
However, it is important to note that Fed is not alone. ECB and BoE are also expected by the markets to commence rate cuts at some point in the next year. Officials from both these institutions continue to resist these market expectations, but their efforts have fallen into deaf ears. Sterling and Euro have emerged as the second and third weakest currencies, respectively, for December.
Yen dominates December as best performer on BoJ expectations
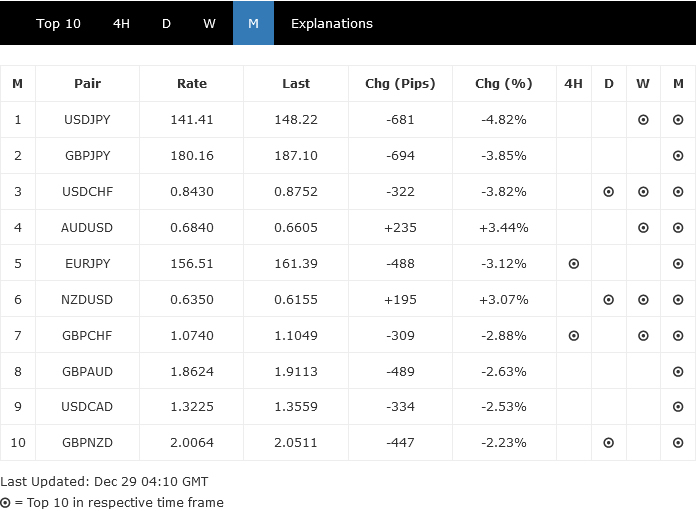
Japanese Yen is poised to be December's best performer in the currency markets. Its strength is primarily driven by growing expectations that BoJ will eventually exit its long-standing negative interest rate policy in 2024. Yen's performance is particularly noteworthy against Dollar (USD/JPY) and Sterling (GBP/JPY), both of which are top movers for the month, with the possibility of ending down more than 700 pips.
The strengthening of Yen comes amidst a broader context where other major global central banks, such as Fed, ECB, and BoE, are expected to start loosening their monetary policies or, in some cases like SNB, BoC and RBNZ, maintain unchanged rates.
BoJ Governor Kazuo Ueda has recently softened his typically dovish tone, acknowledging that the likelihood of a rate hike in 2024 is "not zero." He also emphasized the importance of the Spring wage negotiations and the need for wage hikes to "broaden" from large companies to small businesses. This change in stance has contributed further to Yen's rally, with April being viewed as a probable timing for rate hike. Yen could see further gains if incoming information in Q1 solidifies this expectation.
Technically, USD/JPY's fall from 151.89 is seen as the third leg of the consolidation pattern from 151.93. Further decline is expected as long as 144.94 resistance holds. Next target is 61.8% retracement of 127.20 to 151.89 at 136.63, sustained break there will pave the way to 127.20 support (2022 low).
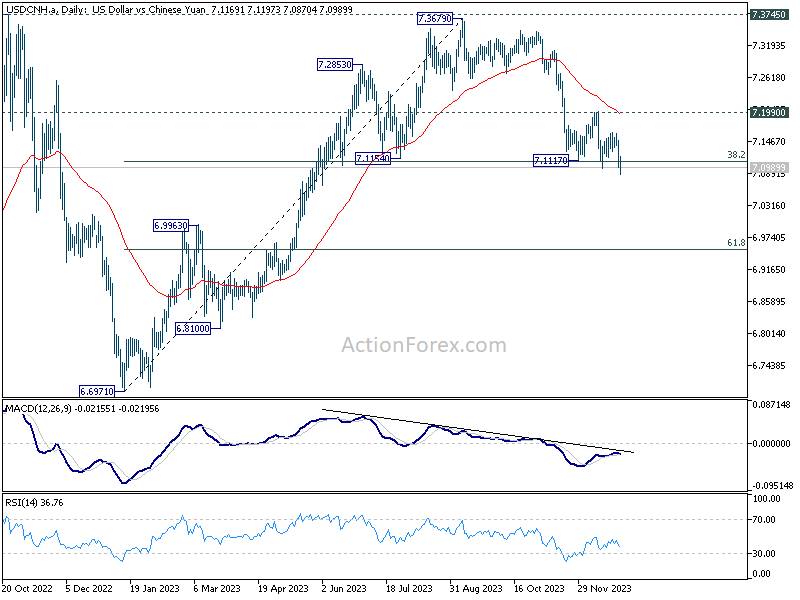
At the same time, USD/CNH is undergoing similar development. The pair is having a second attempt to break through 38.2% retracement of 6.6971 to 7.3679 at 7.1117. Sustained trading below this level will strengthen the case that fall from 7.3679 is the third leg of the consolidation pattern from 7.3745, aligning with the outlook of USD/JPY. In this case, deeper fall would be seen to 61.8% retracement at 6.9533, with prospect of having a take on 6.6971 support.
Looking ahead
Swiss KOF economic barometer and US Chicago PMI are the only features today.
AUD/USD Daily Report
Daily Pivots: (S1) 0.6812; (P) 0.6841; (R1) 0.6859; More...
AUD/USD continues to lose upside momentum ahead of 0.6894 resistance and intraday bias is turned neutral first. On the upside, decisive break of 0.6894 will extend the rally from 0.6269 towards 0.7156 key resistance next. On the downside, however, break of 0.6796 support will indicate short term topping, on bearish divergence condition in 4H MACD. Intraday bias will be turned back to the downside for pullback to 0.6689 resistance turned support.
In the bigger picture, there is no confirmation that down trend from 0.8006 (2021 high) has completed. Price actions from 0.6169 (2022 low) could be just a medium term corrective pattern. Rise from 0.6269 is seen as the third leg of the pattern. For now, range trading should be seen between 0.6169 and 0.7156 (2023 high), until further developments.
Economic Indicators Update
| GMT | Ccy | Events | Actual | Forecast | Previous | Revised |
|---|---|---|---|---|---|---|
| 08:00 | CHF | KOF Economic Barometer Dec | 97.3 | 96.7 | ||
| 14:45 | USD | Chicago PMI Dec | 50.7 | 55.8 |
Technical Outlook and Review
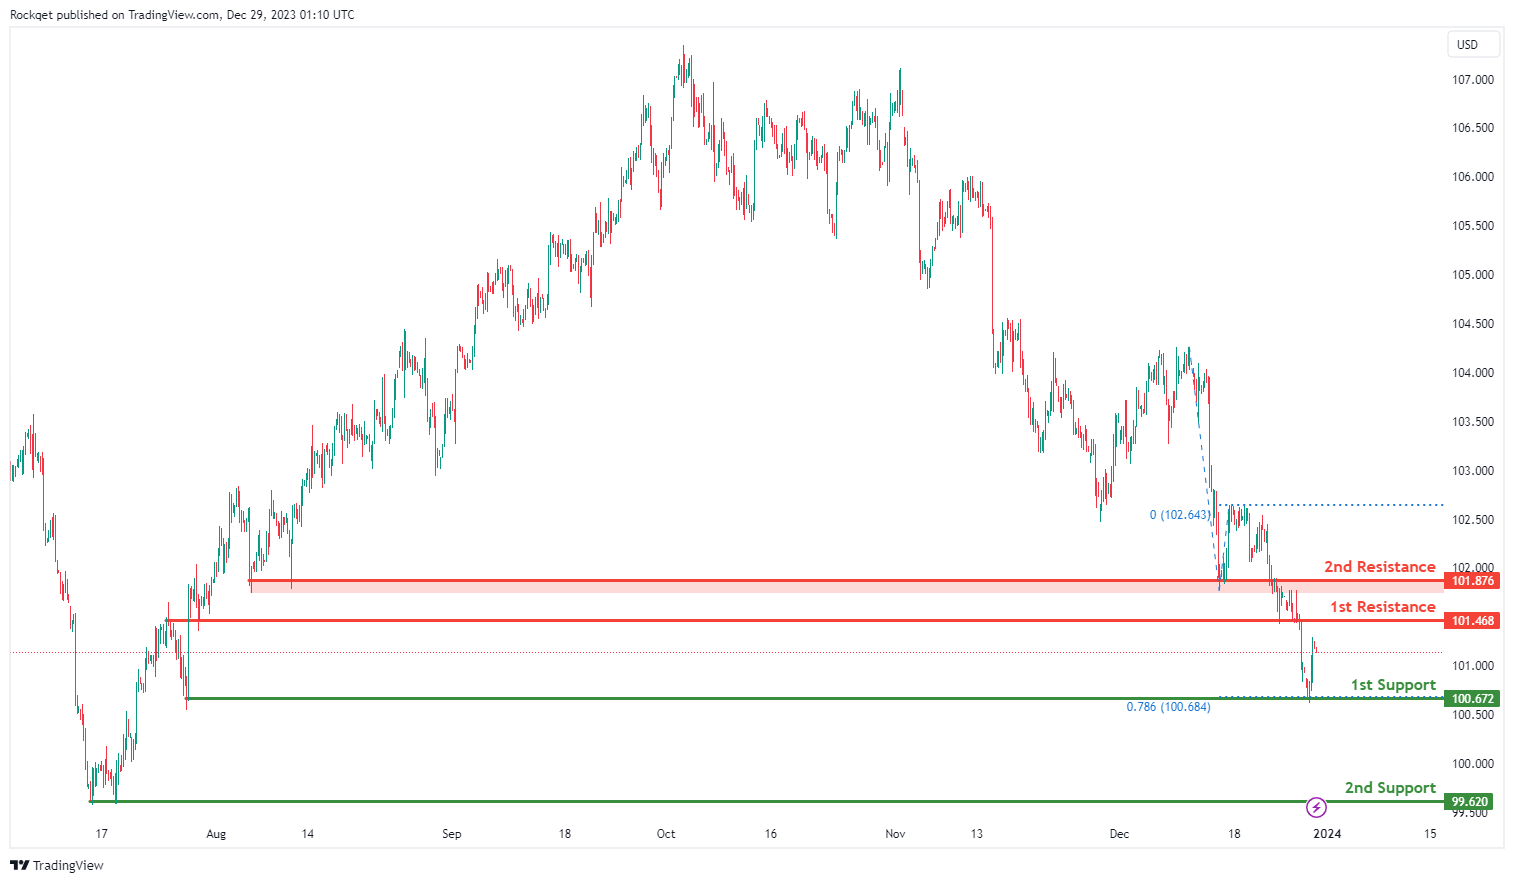
DXY:
The DXY (US Dollar Index) chart currently shows an overall bearish momentum, indicating a potential for price to make a bearish continuation towards the 1st support.
The 1st support level at 100.67 is identified as a swing-low support that aligns with the 78.60% Fibonacci projection level. Further below, the 2nd support level at 99.62 is noted as pullback support, further reinforcing its importance as a potential key support level.
To the upside, the 1st resistance level at 101.46 is identified as an overlap resistance. Higher up, the 2nd resistance level at 101.87 is also marked as an overlap resistance, suggesting a potential barrier for further upside movement.
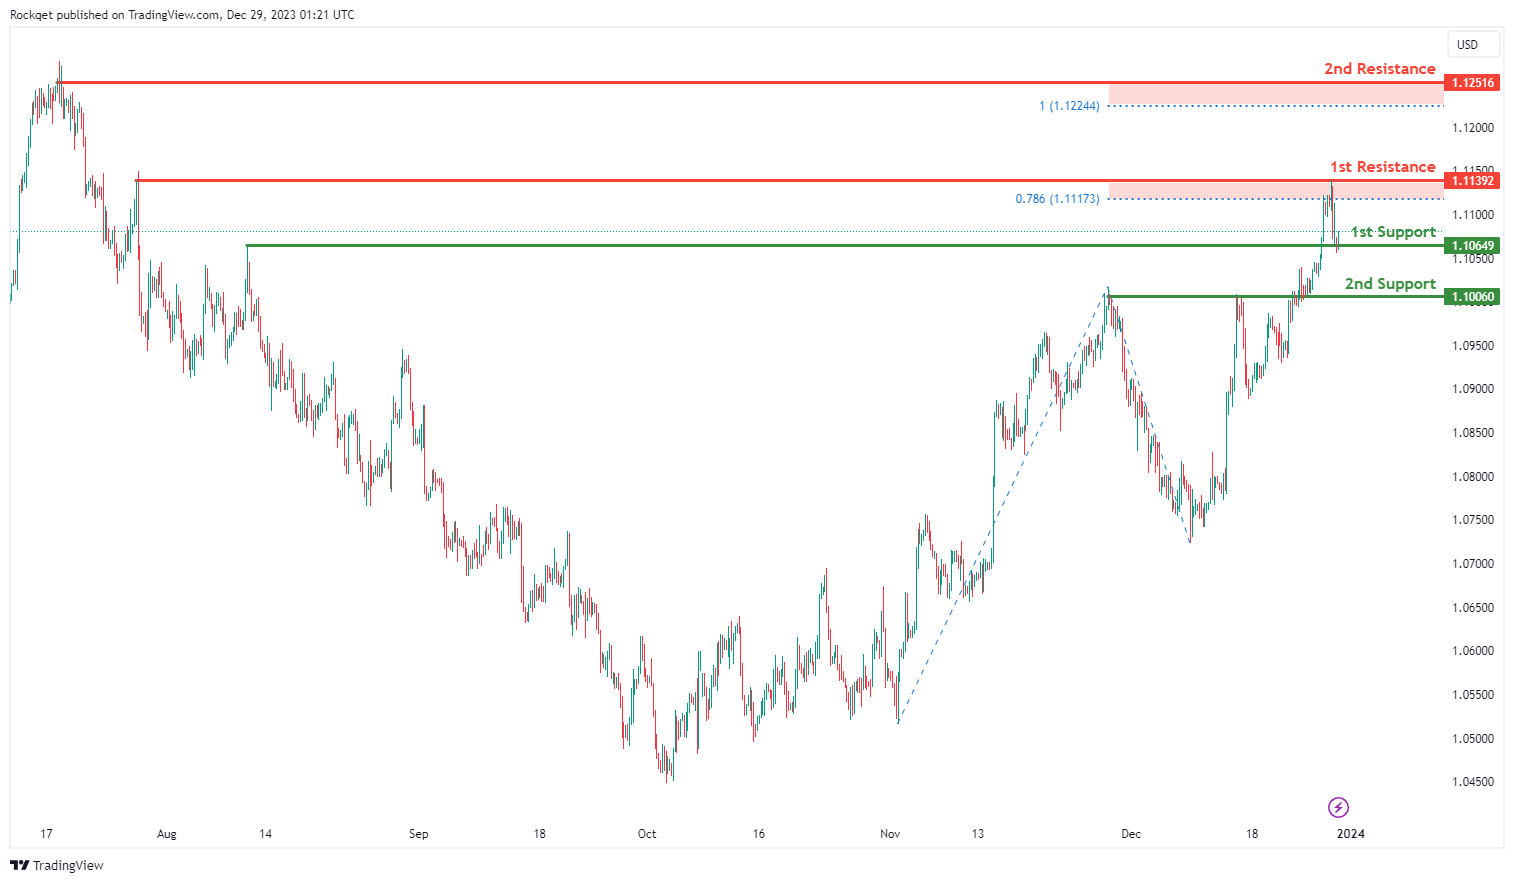
EUR/USD:
The EUR/USD chart currently exhibits an overall bullish momentum. In this context, there is a potential scenario for price to make a bullish bounce off the 1st support and rise higher towards the 1st resistance.
The 1st resistance level at 1.1139 is identified as a swing-high resistance that aligns close to the 78.60% Fibonacci projection level. Higher up, the 2nd resistance level at 1.1251 is also noted as a swing-high resistance that aligns close to the 100.00% Fibonacci projection level, suggesting a potential barrier for further upside movement.
To the downside, the 1st support level at 1.1064 is identified as an overlap support. Further below, the 2nd support level at 1.1006 is also marked as an overlap support, further reinforcing its importance as a potential key support level.
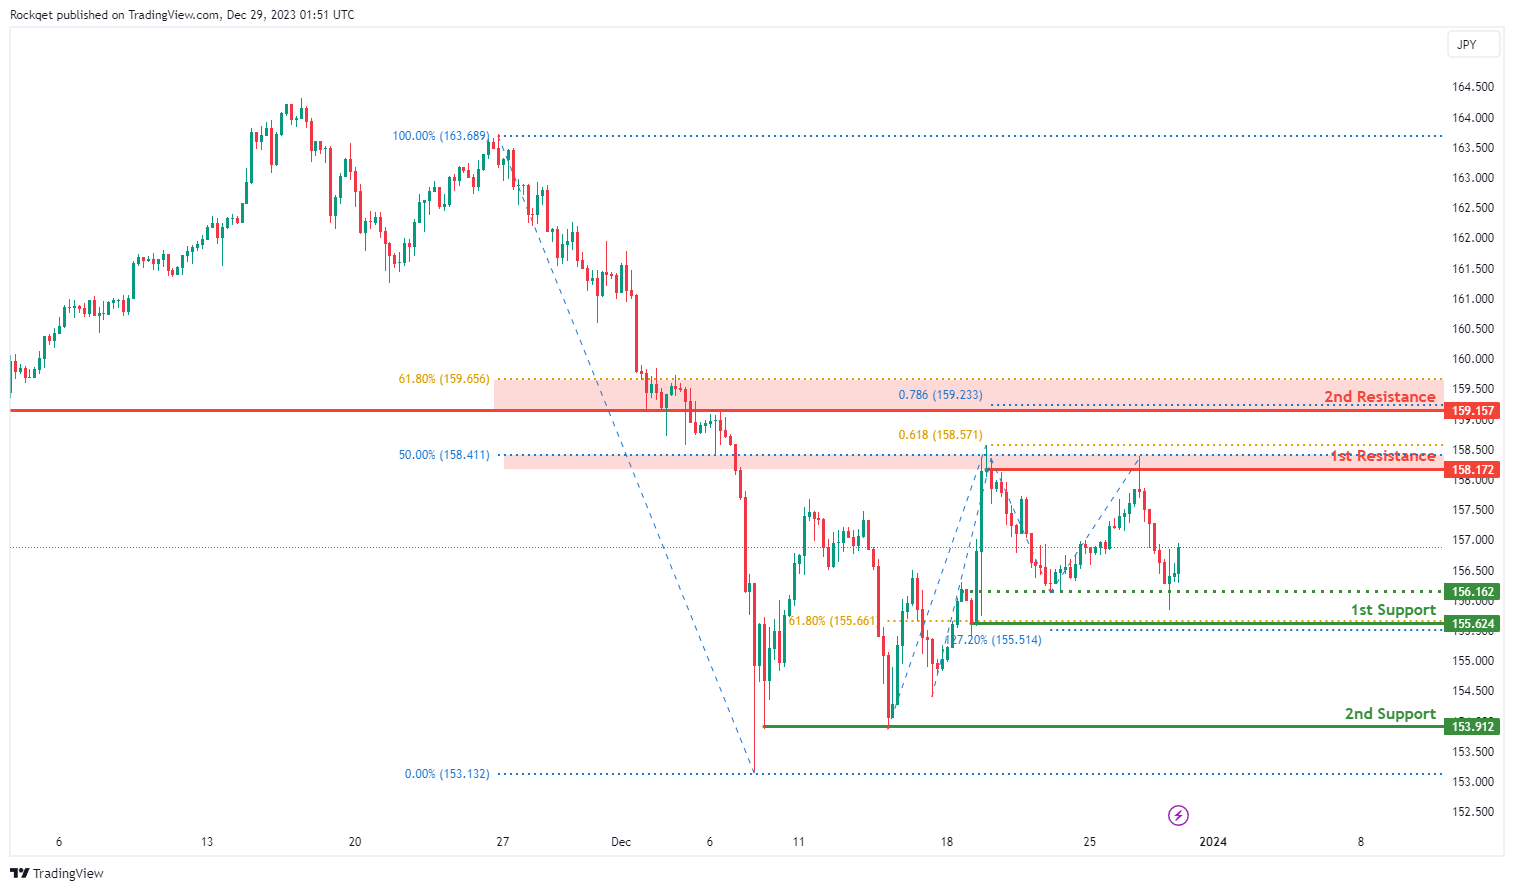
EUR/JPY:
The EUR/JPY chart currently displays a bullish overall momentum, indicating the potential for a bullish continuation towards the 1st resistance.
The 1st support at 155.62 is considered significant as it represents a pullback support, signifying a historical area where buying interest has been evident.
Additionally, the 2nd support at 153.91 is identified as a multi-swing low support, providing an additional layer of potential support for the currency pair.
On the resistance side, the 1st resistance at 158.17 is linked to a swing high resistance, indicating a level where selling interest could intensify.
Furthermore, the 2nd resistance at 159.16 is associated with an overlap resistance and the 61.80% Fibonacci Retracement, adding an extra layer of potential resistance for EUR/JPY.
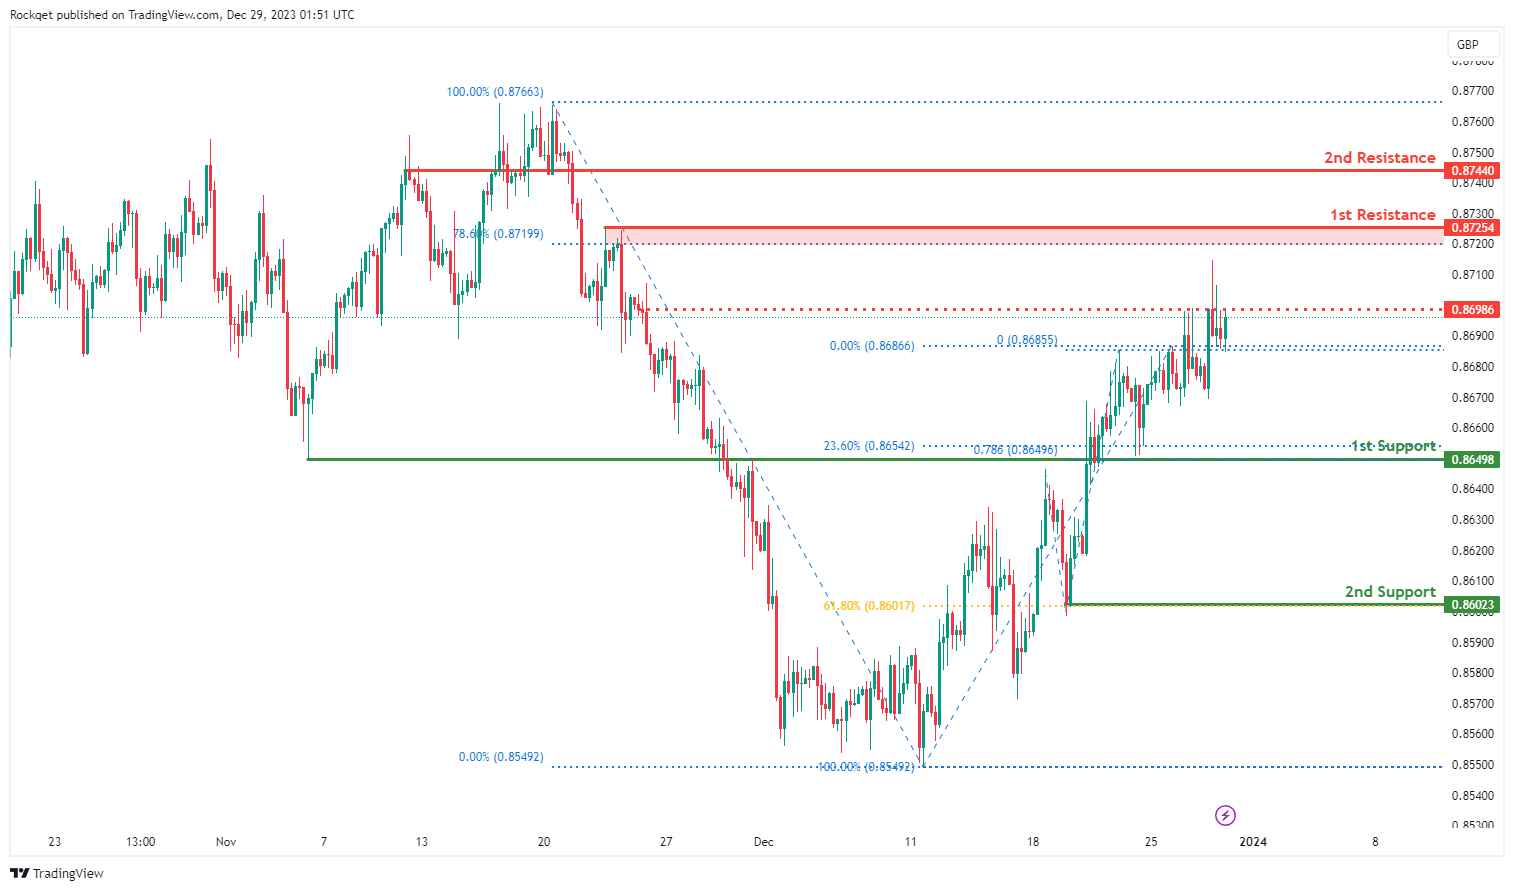
EUR/GBP:
The EUR/GBP chart currently exhibits a weak bullish momentum with low confidence, suggesting a potential scenario for a cautious bullish continuation towards the 1st resistance.
The 1st support at 0.8650 is considered significant as it represents an overlap support, indicating a historical area where buying interest has been observed. Additionally, the 23.60% Fibonacci Retracement and 78.60% Fibonacci Projection add an extra layer of potential support for the currency pair at this level.
The 2nd support at 0.8602 is identified as a pullback support, further contributing to the potential bullish scenario.
On the resistance side, the 1st resistance at 0.8725 is linked to a pullback resistance and the 78.60% Fibonacci Retracement, suggesting a level where selling interest could intensify.
Furthermore, the 2nd resistance at 0.8744 represents an overlap resistance, providing an additional layer of potential resistance for EUR/GBP.
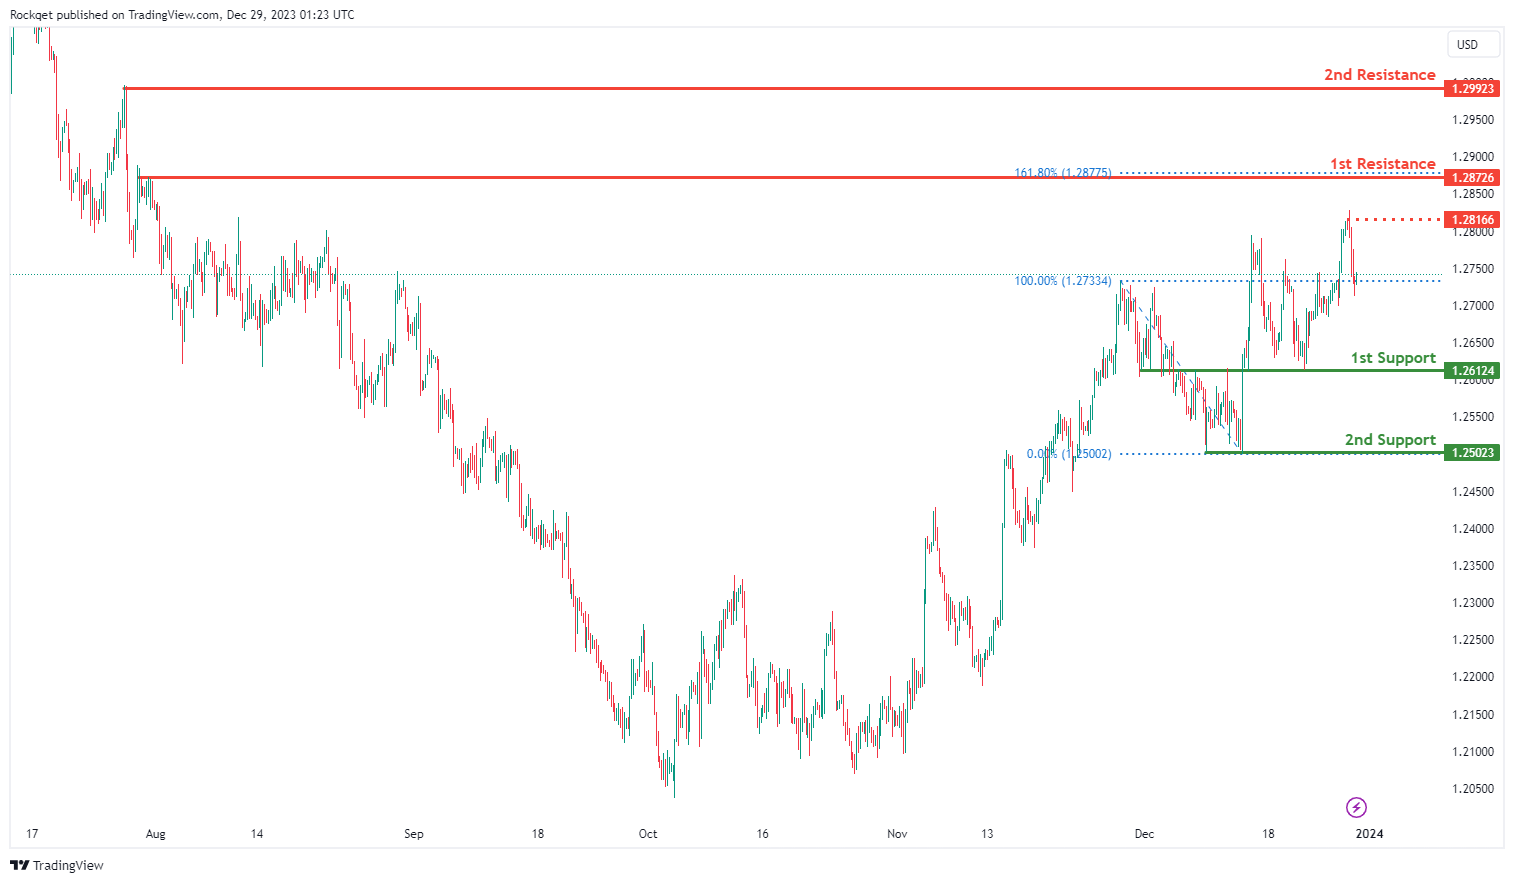
GBP/USD:
The GBP/USD chart currently exhibits a neutral bias. In this context, there is a potential scenario for price to fluctuate between the 1st resistance and the 1st support.
The intermediate resistance level at 1.2816 is identified as a pullback resistance while the 1st resistance level at 1.2872 is marked as a pullback resistance that aligns with the 161.80% Fibonacci extension level. Higher up, the 2nd resistance level at 1.2992 is noted as a swing-high resistance, suggesting a potential barrier for further upside movement.
To the downside, the 1st support level at 1.2612 is identified as an overlap support. Further below, the 2nd support level at 1.2502 is marked as a swing-low support, further reinforcing its importance as a potential key support level.
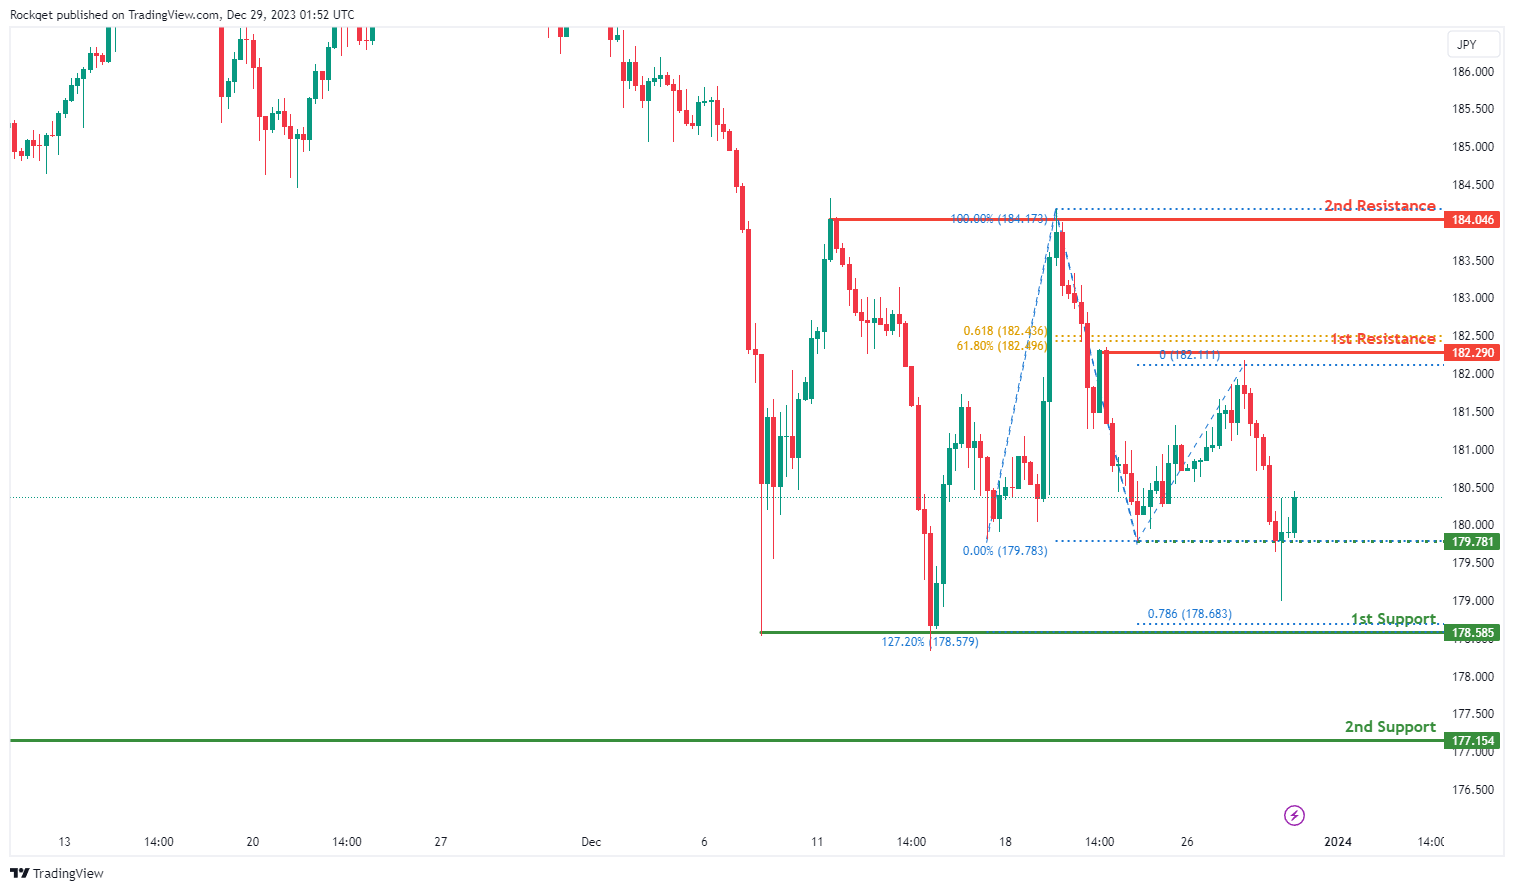
GBP/JPY:
The GBP/JPY chart currently exhibits a bullish overall momentum, suggesting a potential scenario for a bullish bounce off the 1st support towards the 1st resistance.
The 1st support at 178.59 is considered strong as it represents a multi-swing low support and aligns with the 127.20% Fibonacci Expansion and the 78.60% Fibonacci Projection.
Additionally, the 2nd support at 177.15 is identified as a multi-swing low support, providing an additional layer of potential support for the currency pair.
On the resistance side, the 1st resistance at 182.29 is associated with a pullback resistance and the 61.80% Fibonacci Projection, indicating a level where selling interest could intensify.
Furthermore, the 2nd resistance at 184.05 represents a multi-swing high resistance.
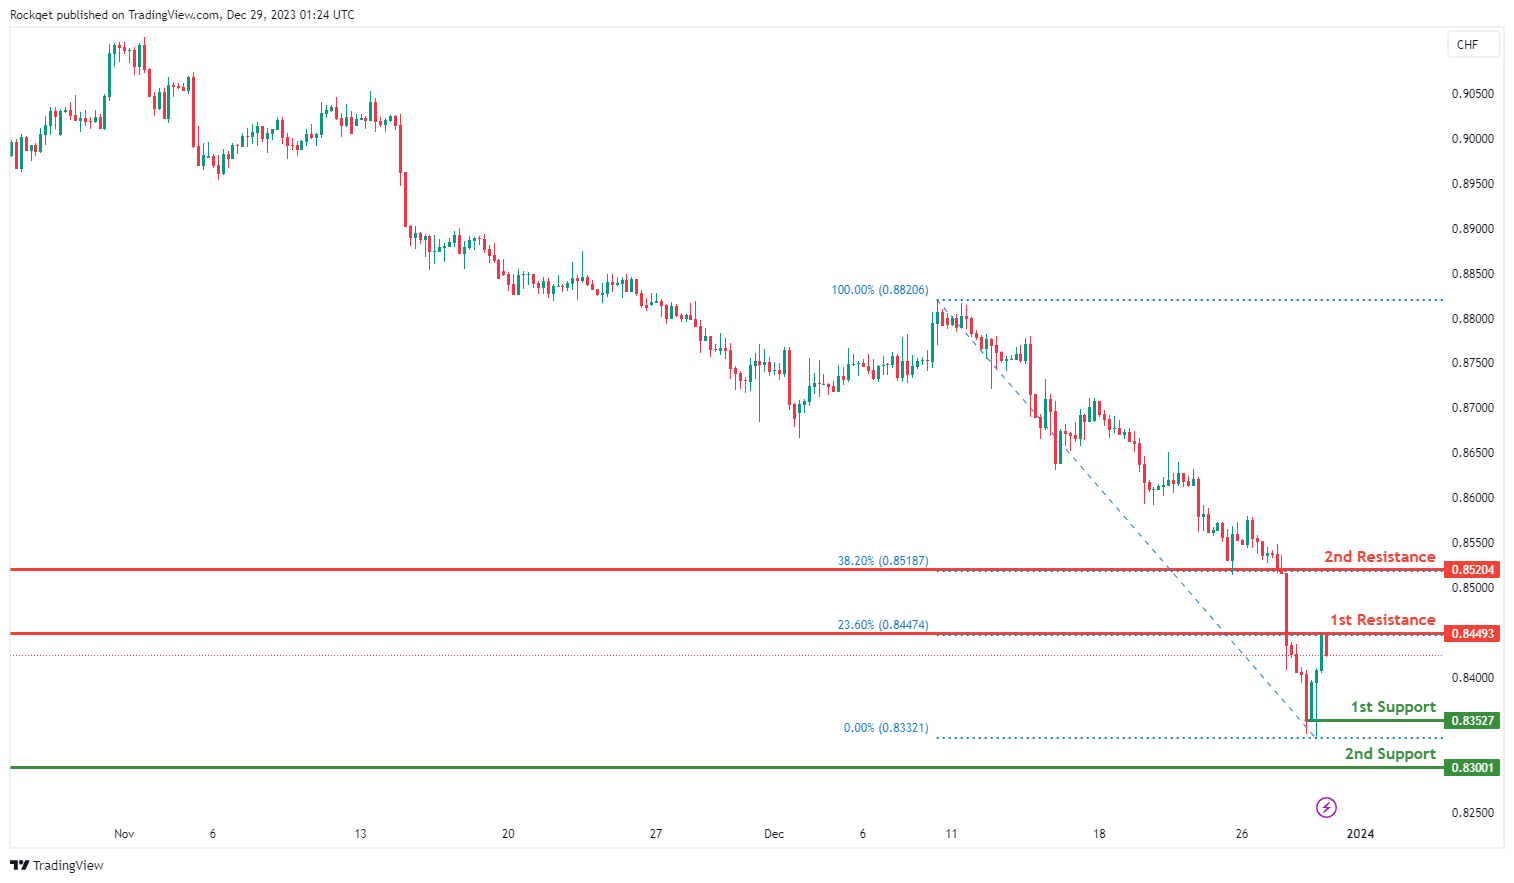
USD/CHF:
The USD/CHF chart currently exhibits an overall bearish momentum. In this context, there is a potential scenario for price to make a bearish continuation towards the 1st support.
The 1st support level at 0.8352 is identified as a pullback support. Further below, the 2nd support level at 0.8300 is noted as a swing-low support, further reinforcing its importance as a key support level.
To the upside, the 1st resistance level at 0.8449 is identified as a pullback resistance that aligns with the 23.60% Fibonacci retracement level. Higher up, the 2nd resistance level at 0.8520 is also also marked as a pullback resistance that aligns with the 38.20% Fibonacci retracement level, suggesting a potential barrier for further upside movement.
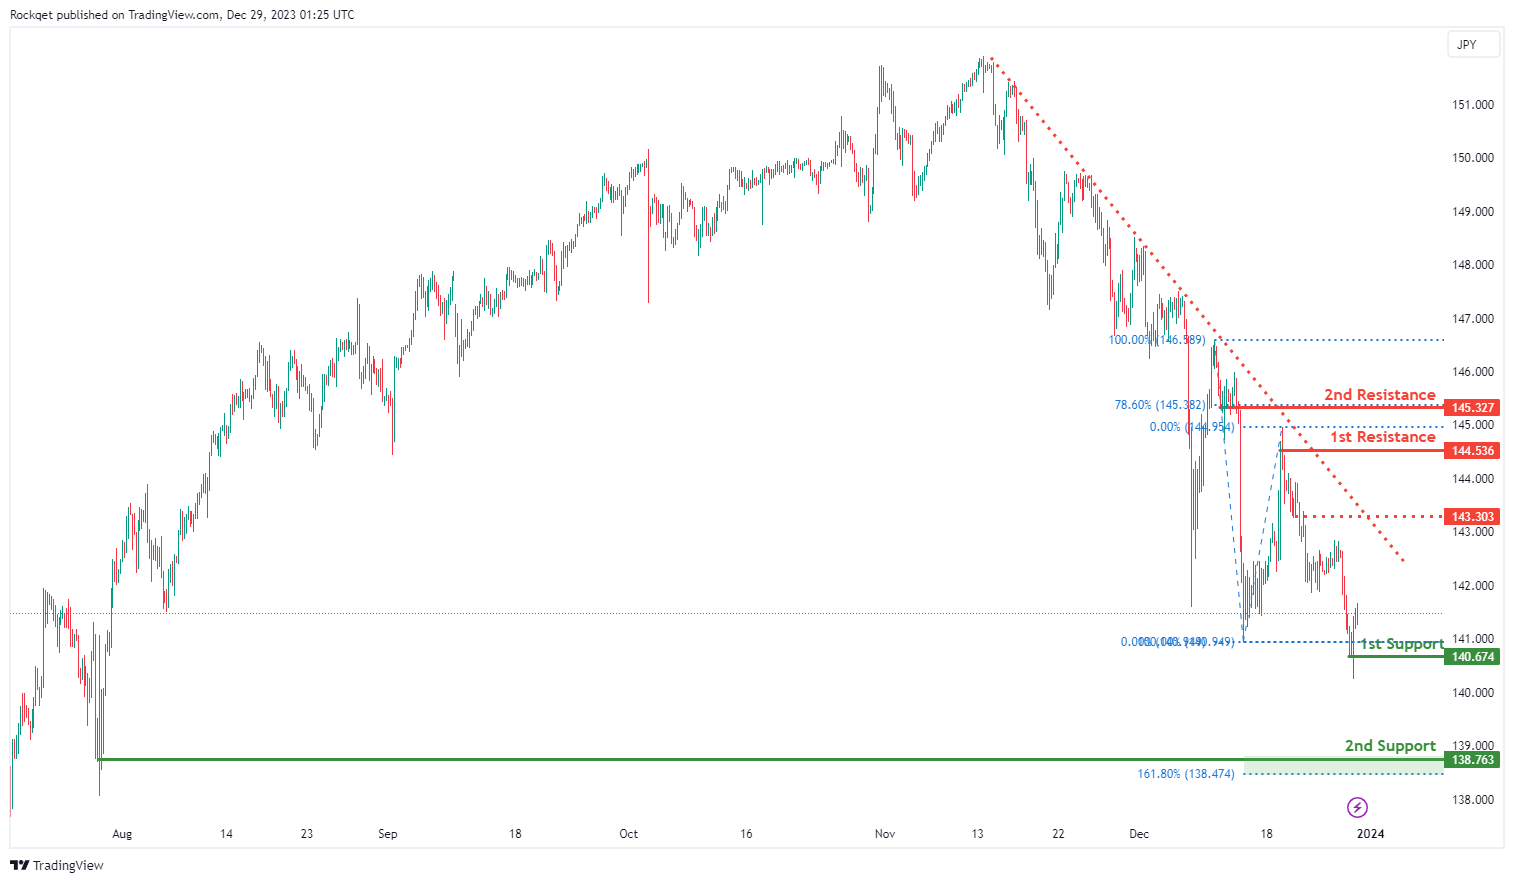
USD/JPY:
The USD/JPY chart currently exhibits an overall bearish momentum. In this context, there is a potential for price to make a bearish continuation towards the 1st support.
The 1st support level at 140.67 is identified as a pullback support. Further below, the 2nd support level at 138.76 is noted as a swing-low support that aligns close to the 161.80% Fibonacci extension level, further reinforcing its importance as a key support level.
To the upside, the intermediate resistance level at 143.30 is identified as a pullback resistance while the 1st resistance level at 144.53 is noted as a swing-high resistance. Higher up, the 2nd resistance level at 145.32 is marked as a pullback resistance that aligns with the 78.60% Fibonacci retracement level, suggesting a potential barrier for further upside movement.
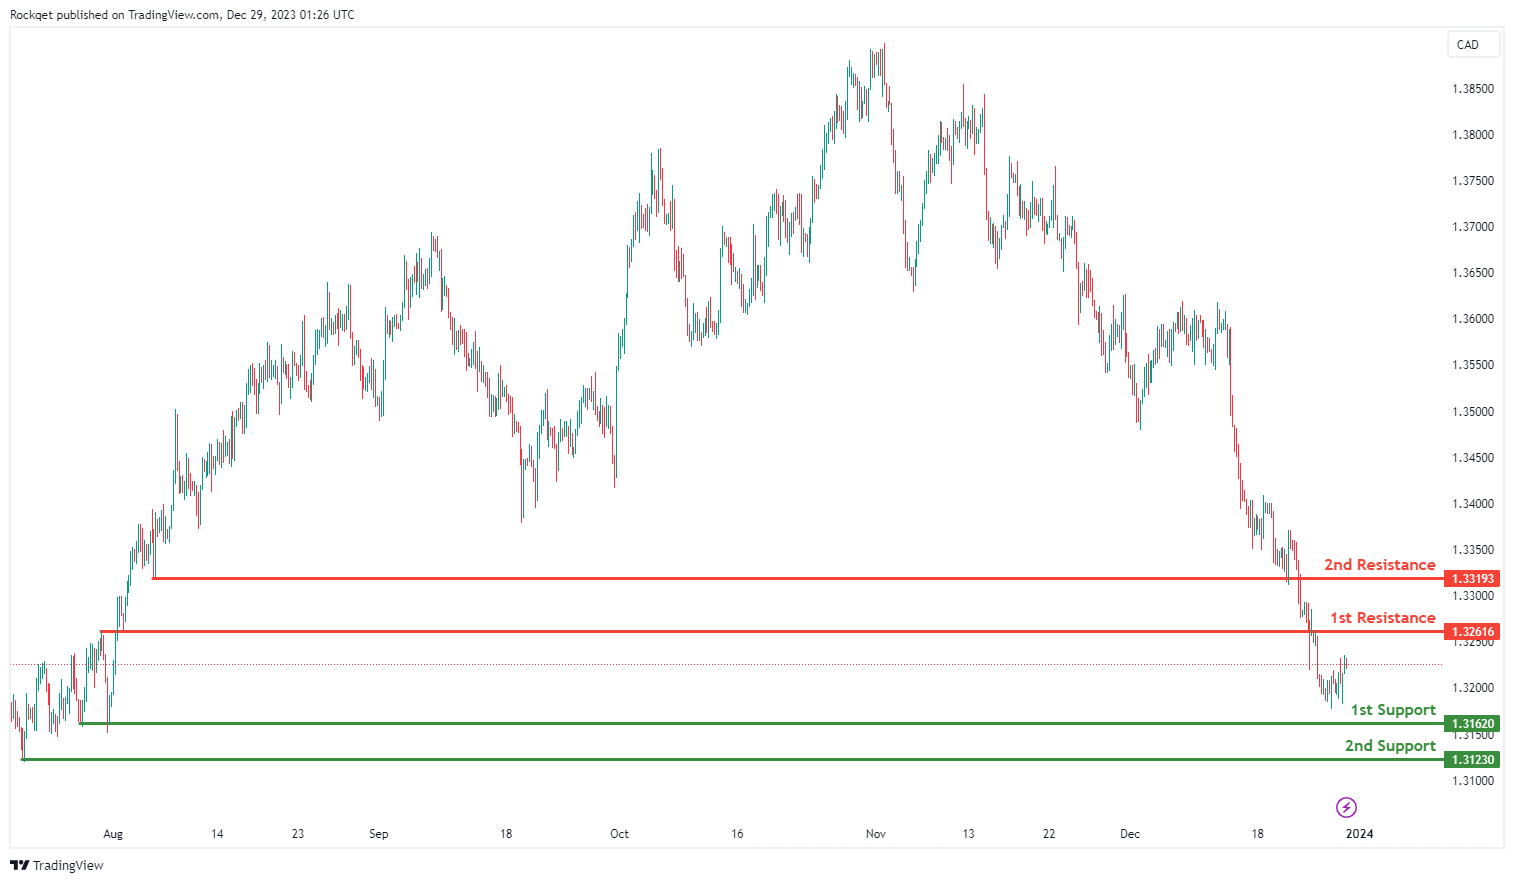
USD/CAD:
The USD/CAD chart currently exhibits an overall bearish momentum. In this context, there is a potential scenario for price to make a bearish continuation towards the 1st support.
The 1st support level at 1.3162 is identified as a multi-swing-low support. Further below, the 2nd support level at 1.3123 is noted as a swing-low support, further reinforcing its importance as a key support level.
To the upside, the 1st resistance level at 1.3261 is identified as an overlap resistance. Higher up, the 2nd resistance level at 1.3319 is marked as a pullback resistance, suggesting a potential barrier for further upside movement.
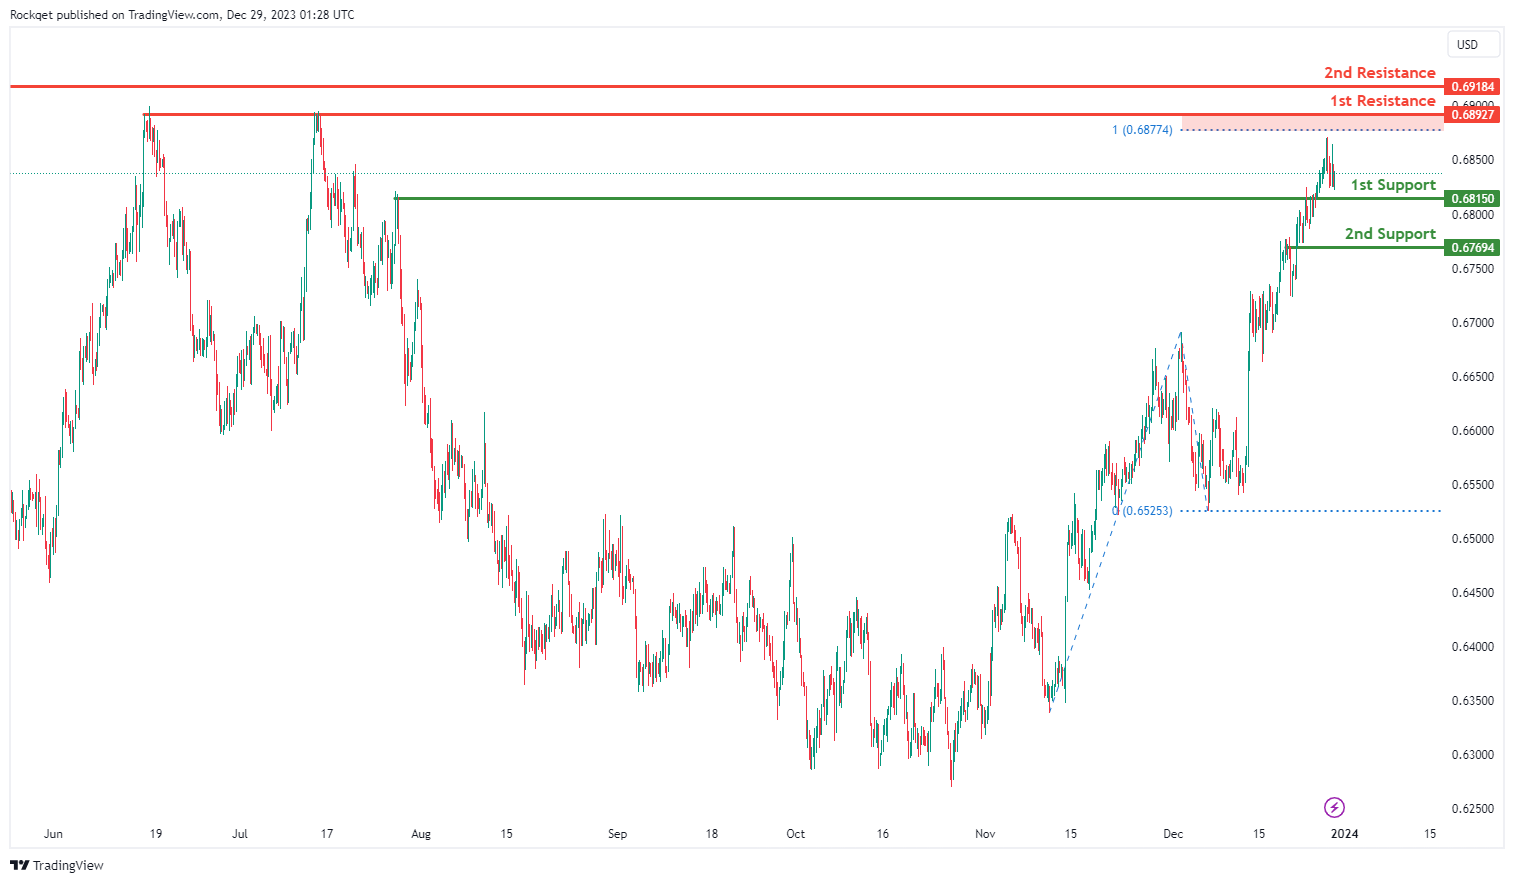
AUD/USD:
The AUD/USD chart currently exhibits an overall bullish momentum. In this context, there is a potential scenario for price to make a bullish continuation towards the 1st resistance.
The 1st resistance level at 0.6892 is identified as a multi-swing-high resistance that aligns close to the 100.00% Fibonacci projection level. Higher up, the 2nd resistance level at 0.6918 is noted as a swing-high resistance, indicating its potential significance as a barrier for further upward movement.
To the downside, the 1st support level at 0.6815 is identified as an overlap support. Further below, the 2nd support level at 0.6769 is also marked as an overlap support, further reinforcing its importance as a key support level.
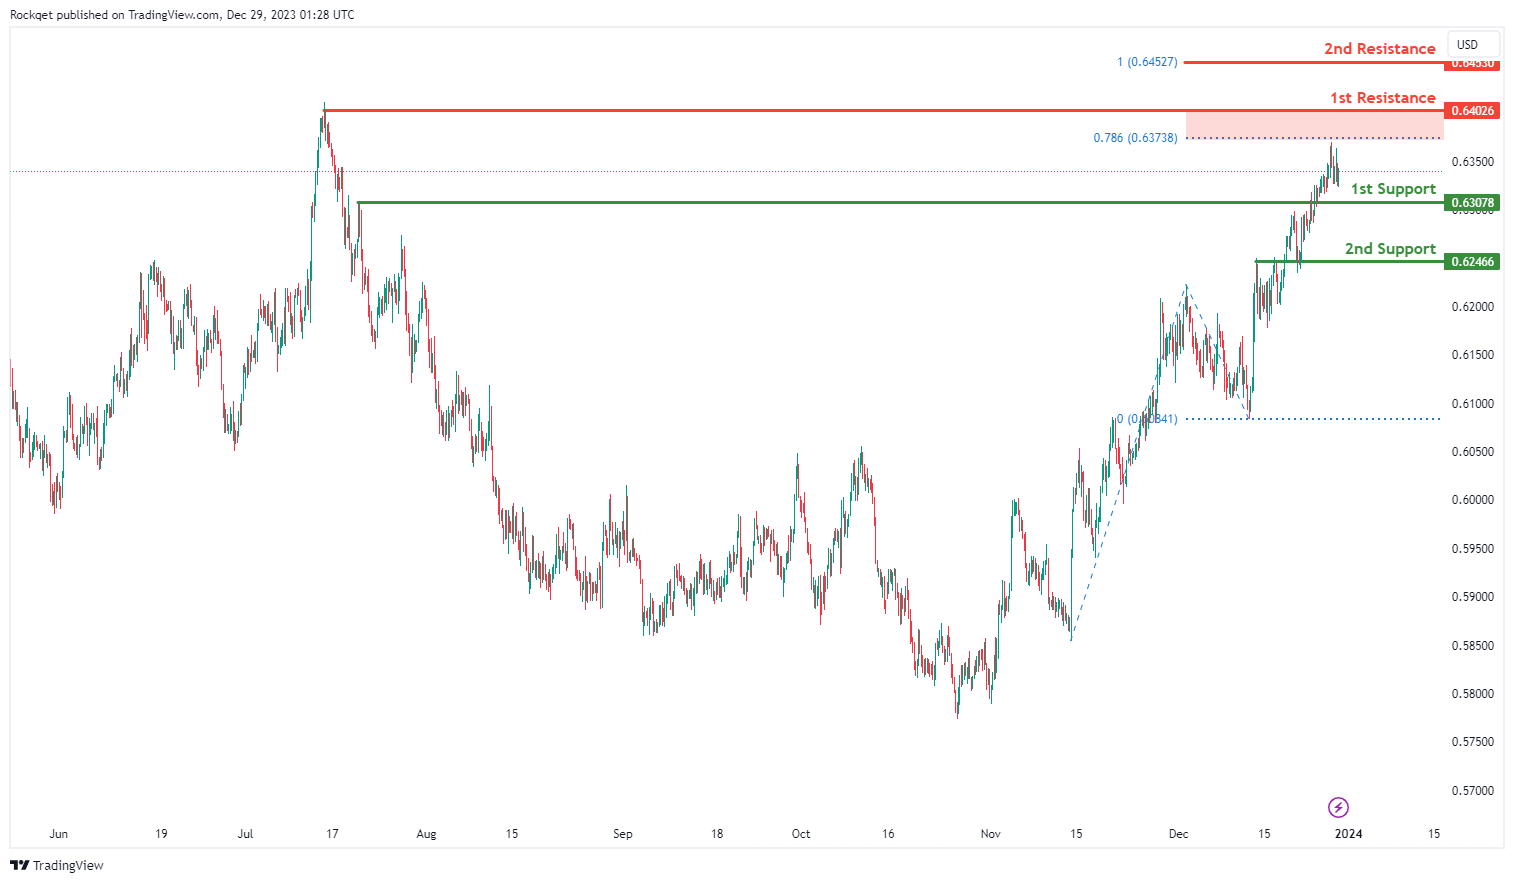
NZD/USD
The NZD/USD chart currently exhibits an overall bullish momentum. In this context, there is a potential scenario for price to make a bullish continuation towards the 1st resistance.
The 1st resistance level at 0.6402 is identified as a swing-high resistance that aligns close to the 78.60% Fibonacci projection level. Higher up, the 2nd resistance level at 0.6453 is marked as a resistance that aligns with the 100.00% Fibonacci projection level, indicating its potential significance as a barrier for further upward movement.
To the downside, the 1st support level at 0.6307 is identified as an overlap support. Further below, the 2nd support level at 0.6246 is also noted as an overlap support, further reinforcing its importance as a key support level.
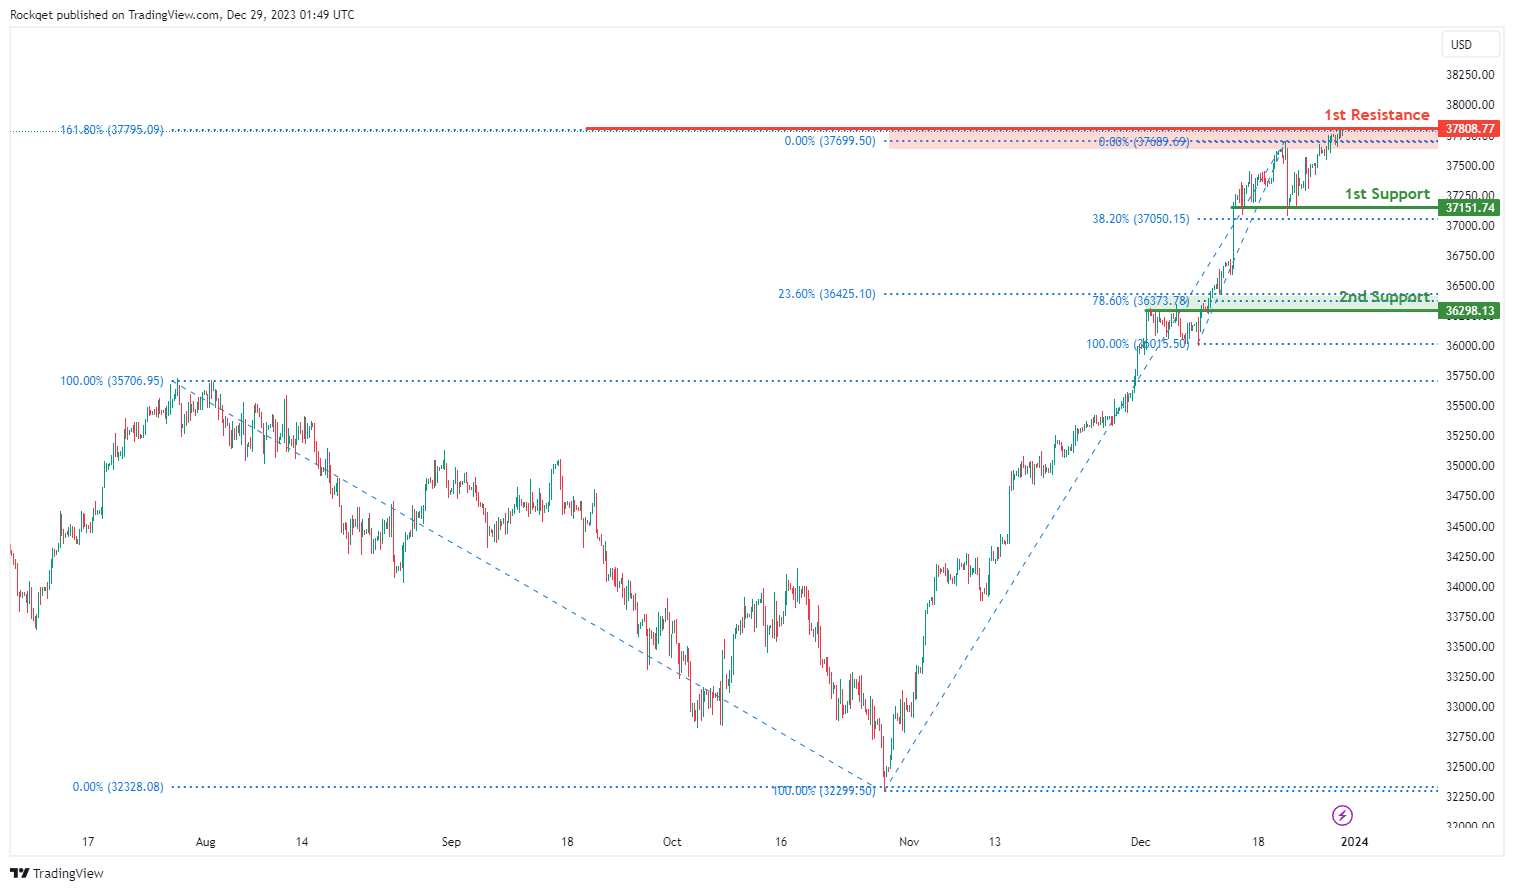
DJ30:
The DJ30 chart currently exhibits a bullish overall momentum, suggesting a potential scenario for a bullish continuation towards the 1st resistance.
The 1st support at 37151.74 is considered significant as it represents an overlap support and is associated with the 38.20% Fibonacci Retracement, indicating a historical area where buying interest has been present.
Additionally, the 2nd support at 36298.13 is identified as another overlap support and is associated with the 23.60% Fibonacci Retracement and the 78.60% Fibonacci Retracement, providing multiple layers of potential support for the index.
On the resistance side, the 1st resistance at 37808.77 is deemed significant as it is linked to the 161.80% Fibonacci Extension, indicating a level where selling interest could intensify.
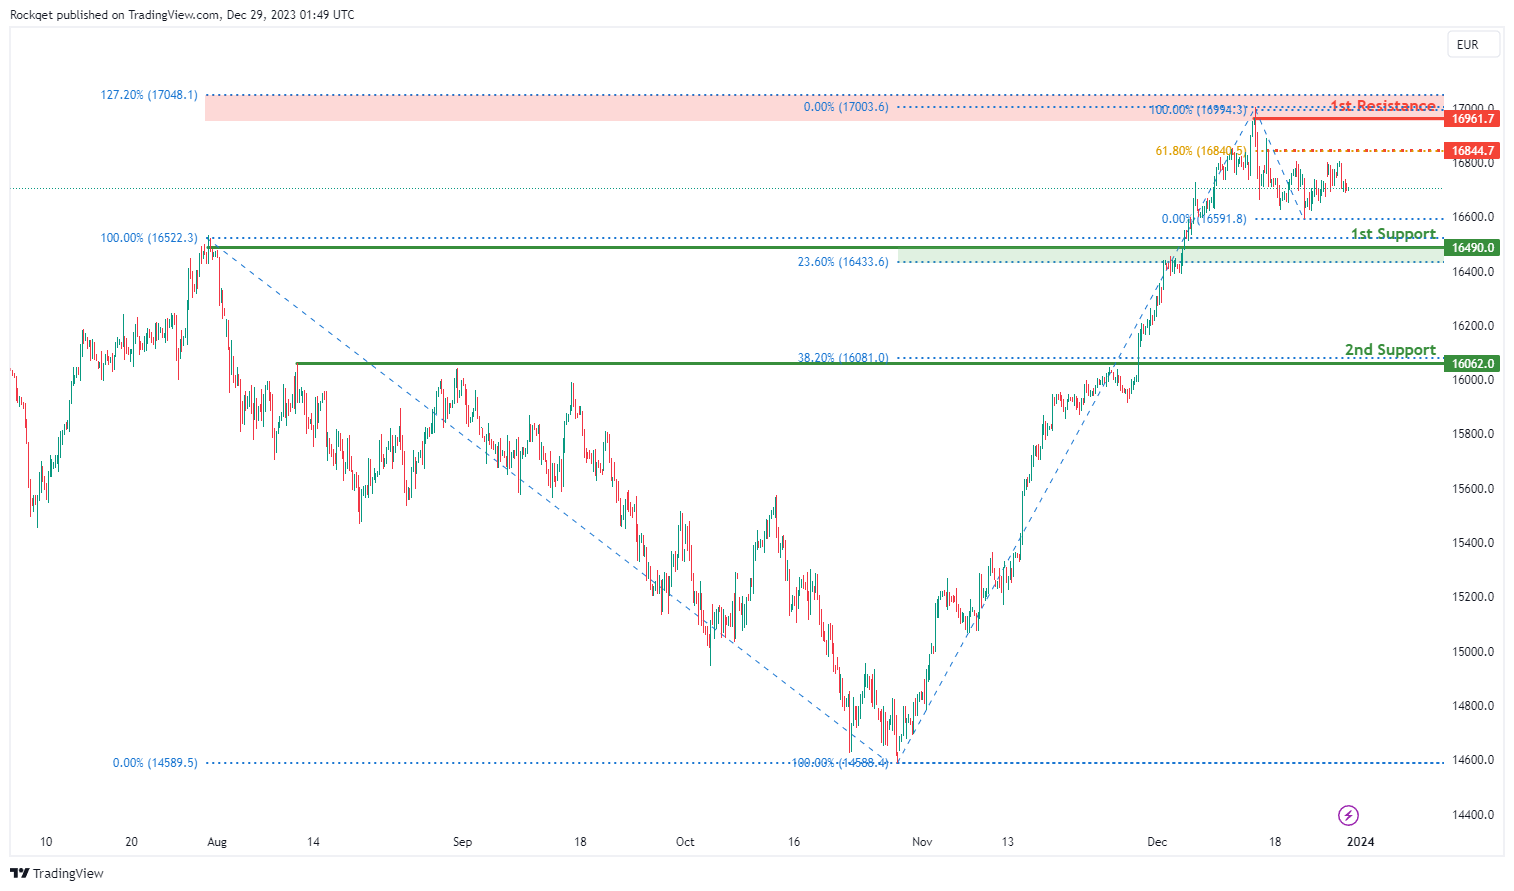
GER40:
The GER40 chart currently exhibits a bullish overall momentum, contributing to the potential for a bullish continuation towards the 1st resistance.
The 1st support at 16490.00 is considered significant as it represents an overlap support and is associated with the 23.60% Fibonacci Retracement, indicating a historical area where buying interest has been present.
Furthermore, the 2nd support at 16062.00 is identified as another significant level, characterized as a pullback support and associated with the 38.20% Fibonacci Retracement, providing additional layers of potential support for the index.
On the resistance side, the 1st resistance at 16961.70 is considered significant as it is linked to a swing high resistance and the 127.20% Fibonacci Extension, indicating a level where selling interest could intensify.
Additionally, the intermediate resistance at 16844.70 is associated with a pullback resistance and the 61.80% Fibonacci Retracement, adding an extra layer of potential resistance for the index.
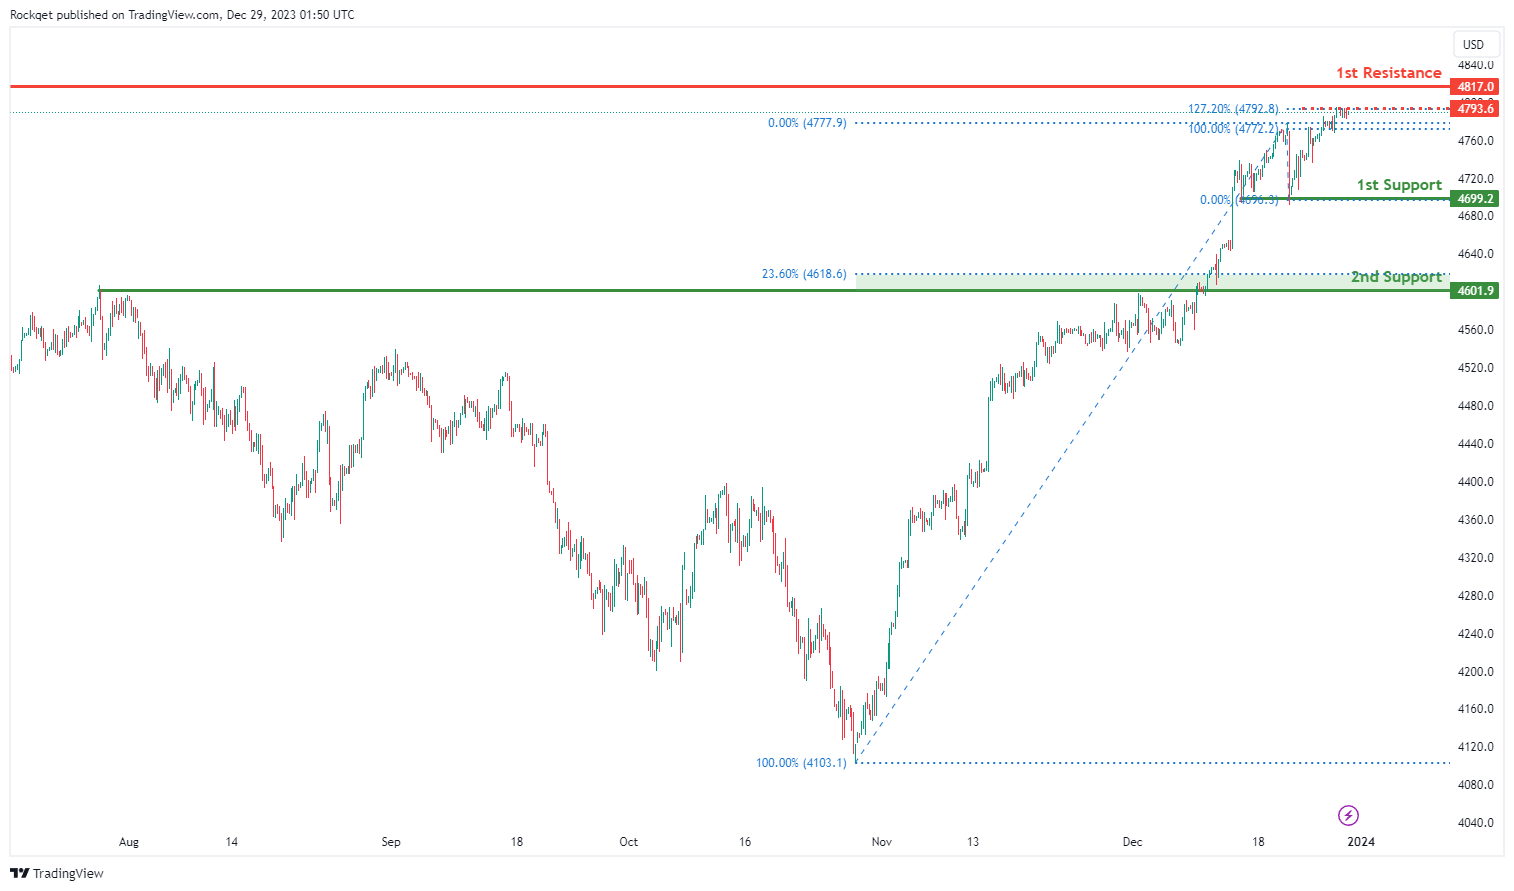
US500:
The US500 chart currently maintains a bullish overall momentum, driven by several factors. For potential upward movement, the chart could make a bullish continuation towards the 1st resistance.
The 1st support is a multi-swing low at 4699.2, signifying a historical area where buying interest has been prevalent.
Additionally, the 2nd support at 4601.9 is deemed significant as it represents an overlap support and is associated with the 23.60% Fibonacci Retracement, providing added support.
The intermediate resistance at 4793.6 is considered noteworthy, linked to the 127.20% Fibonacci Extension, indicating a level where selling interest may intensify.
Furthermore, the 2nd resistance at 4817.0 is associated with a swing high resistance, adding another layer of potential resistance for the index.
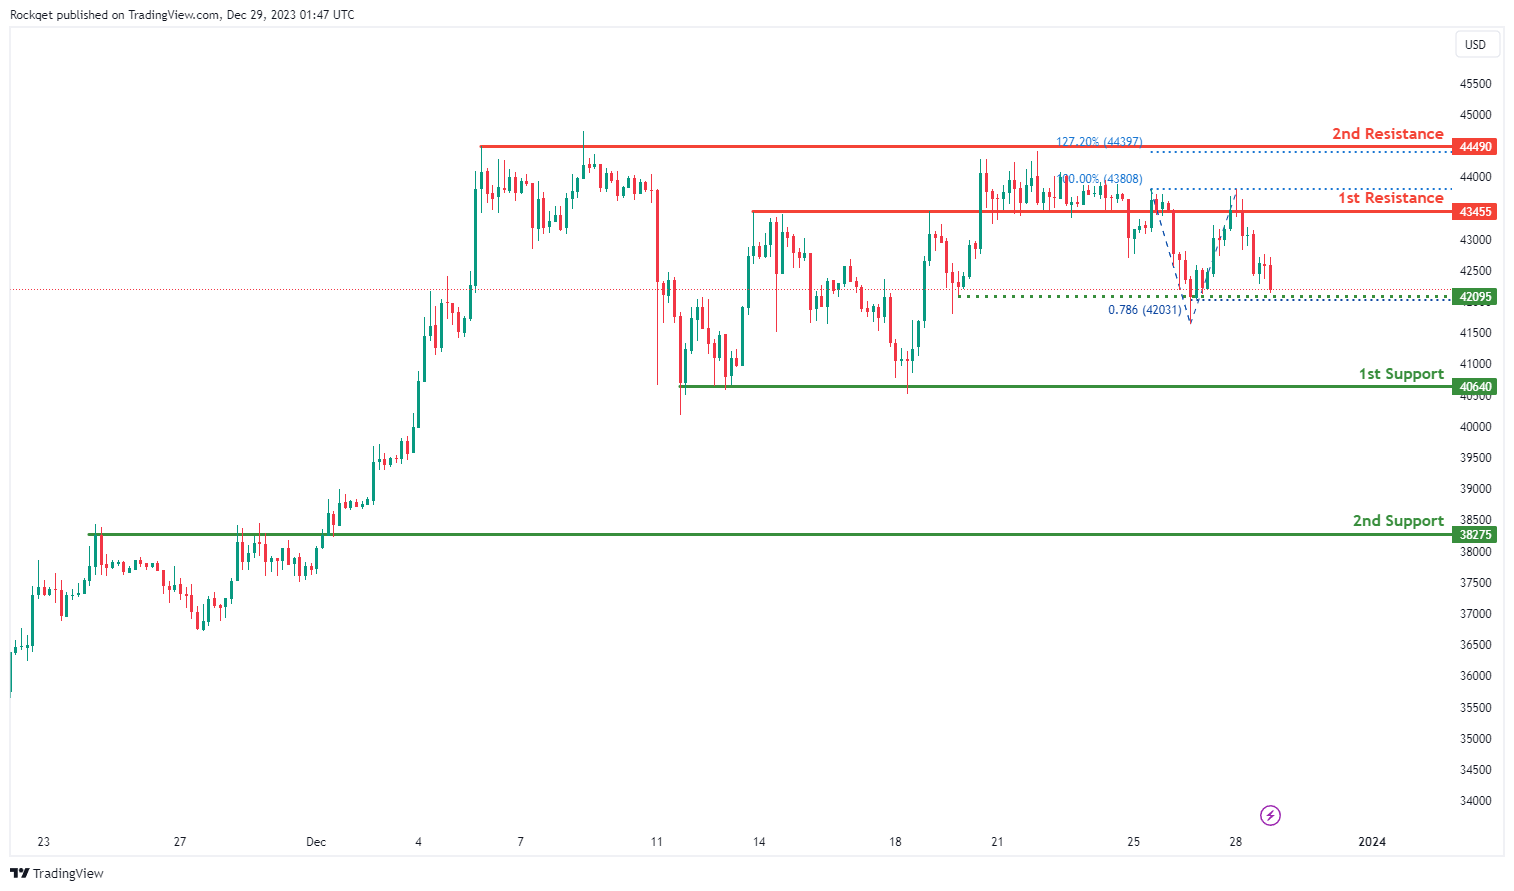
BTC/USD:
The BTC/USD chart currently displays a bearish overall momentum, suggesting a potential scenario for a bearish reaction off the 1st resistance and a subsequent drop towards the 1st support.
The 1st support at 40640 is considered significant as it aligns with a pullback support, indicating a historical area where buying interest has been present.
Additionally, the 2nd support at 38275 is identified as another overlap support, providing an additional layer of potential support for the cryptocurrency pair.
On the resistance side, the 1st resistance at 43455 is associated with an overlap resistance, indicating a level where selling interest could intensify.
Furthermore, the 2nd resistance at 44490 represents a swing high resistance and the 127.20% Fibonacci Extension.
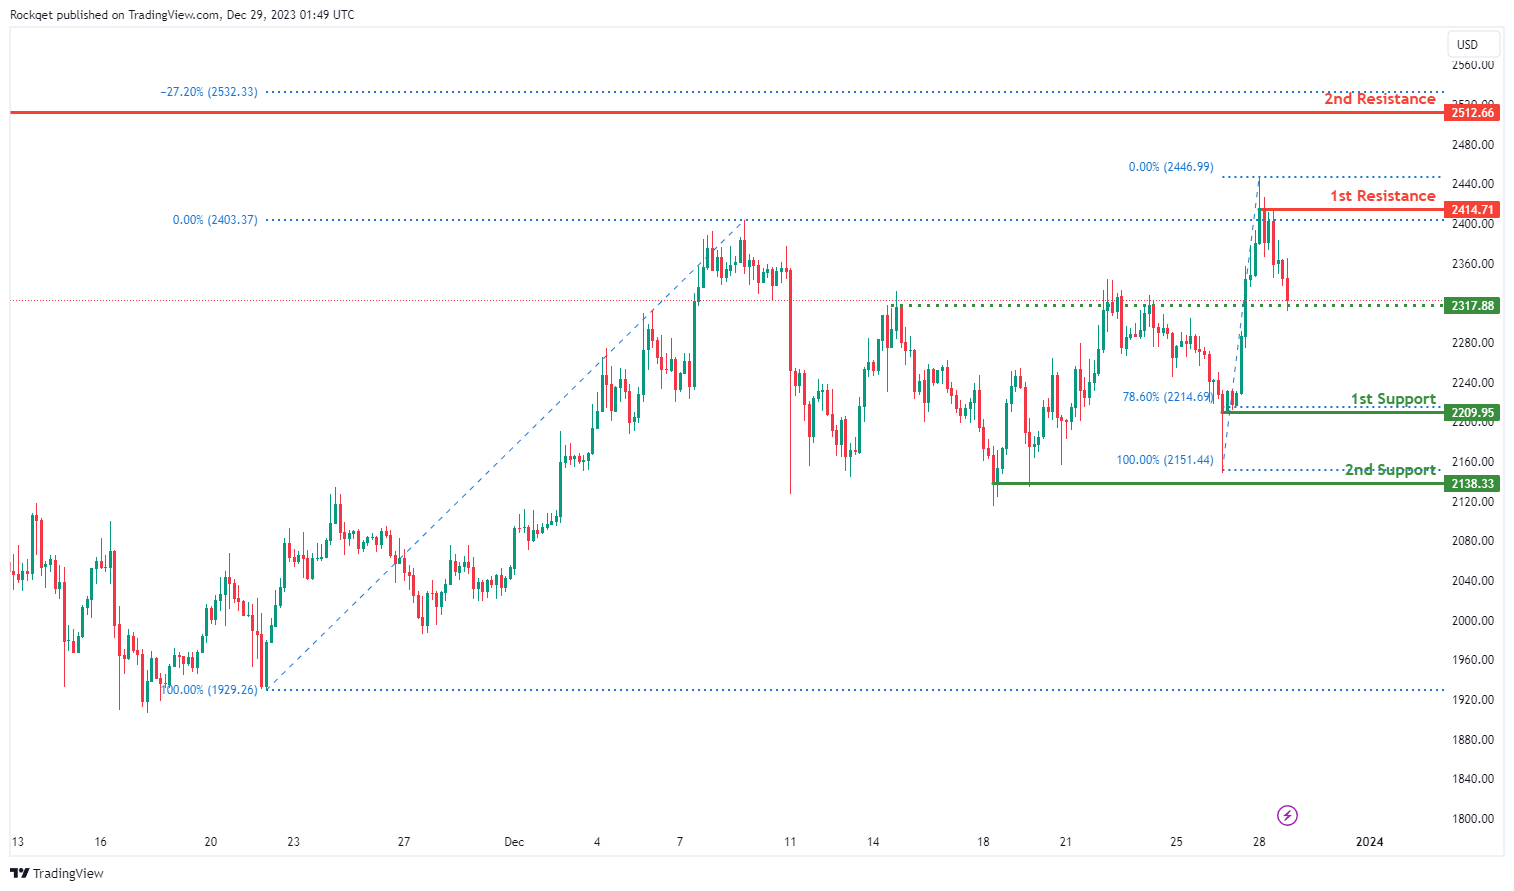
ETH/USD:
The ETH/USD chart currently exhibits a bearish overall momentum, suggesting a potential scenario for a bearish reaction off the 1st resistance and a subsequent drop towards the 1st support.
The 1st support at 2209.95 is considered significant as it aligns with a pullback support and the 78.60% Fibonacci Retracement, indicating a historical area where buying interest has been present.
Additionally, the 2nd support at 2138.33 is identified as another pullback support, providing an additional layer of potential support for the cryptocurrency pair.
On the resistance side, the 1st resistance at 2414.71 is associated with a swing high resistance, indicating a level where selling interest could intensify.
Furthermore, the 2nd resistance at 2512.66 represents another swing high resistance.
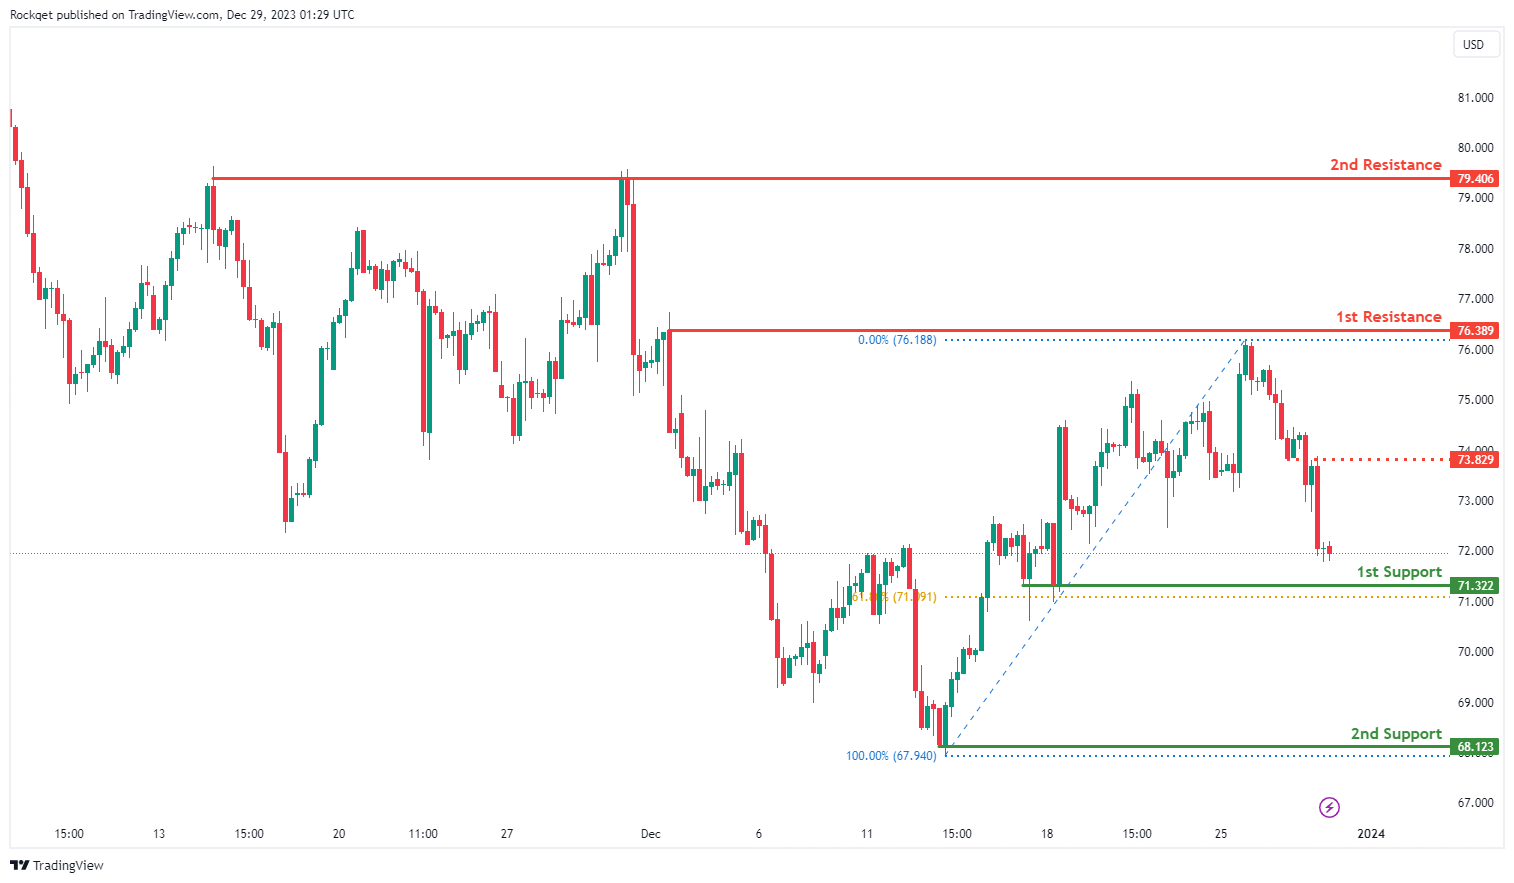
WTI/USD:
The WTI chart currently exhibits an overall bearish momentum, suggesting a new downtrend. In this context, there is a potential scenario for price to fall towards the 1st support.
The 1st support level at 71.32 is identified as a pullback support that aligns close to the 61.80% Fibonacci retracement level. Further below, the 2nd support level at 68.12 is marked as a swing-low support, reinforcing its importance as a key support level.
To the upside, the intermediate resistance level at 73.82 is identified as an overlap resistance while the 1st resistance level at 76.38 is identified as a pullback resistance. Higher up, the 2nd resistance level at 79.40 is noted as a multi-swing-high resistance, further indicating its potential significance as a barrier for further upward movement.
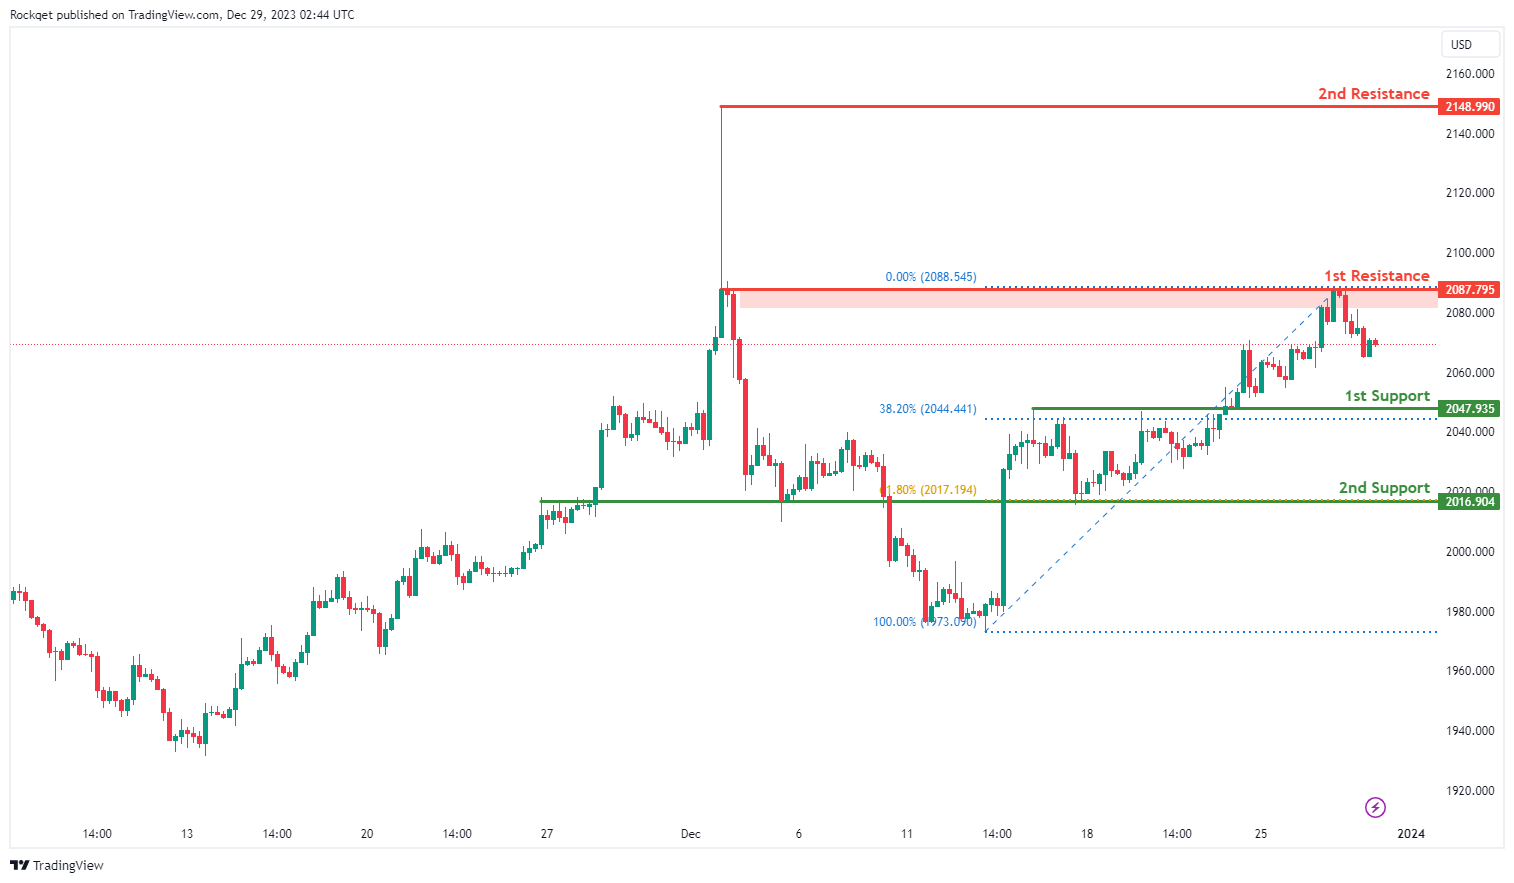
XAU/USD (GOLD):
The XAU/USD chart currently demonstrates a bullish momentum, indicating a potential for price to make a bullish continuation towards the 1st resistance.
The 1st resistance level at 2,087.79 is identified as a pullback resistance. Higher up, the 2nd resistance level at 2,148.99 is marked as a swing-high resistance, further indicating its potential significance as a barrier for further upward movement.
To the downside, the 1st support level at 2,047.93 is identified as a pullback support that aligns with the 38.20% Fibonacci retracement level. Further below, the 2nd support level at 2,016.90 is noted as an overlap support that aligns with the 61.80% Fibonacci retracement level, reinforcing its importance as a key support level.
Yen dominates December as best performer on BoJ expectations
Japanese Yen is poised to be December's best performer in the currency markets. Its strength is primarily driven by growing expectations that BoJ will eventually exit its long-standing negative interest rate policy in 2024. Yen's performance is particularly noteworthy against Dollar (USD/JPY) and Sterling (GBP/JPY), both of which are top movers for the month, with the possibility of ending down more than 700 pips.
The strengthening of Yen comes amidst a broader context where other major global central banks, such as Fed, ECB, and BoE, are expected to start loosening their monetary policies or, in some cases like SNB, BoC and RBNZ, maintain unchanged rates.
BoJ Governor Kazuo Ueda has recently softened his typically dovish tone, acknowledging that the likelihood of a rate hike in 2024 is "not zero." He also emphasized the importance of the Spring wage negotiations and the need for wage hikes to "broaden" from large companies to small businesses. This change in stance has contributed further to Yen's rally, with April being viewed as a probable timing for rate hike. Yen could see further gains if incoming information in Q1 solidifies this expectation.
Technically, USD/JPY's fall from 151.89 is seen as the third leg of the consolidation pattern from 151.93. Further decline is expected as long as 144.94 resistance holds. Next target is 61.8% retracement of 127.20 to 151.89 at 136.63, sustained break there will pave the way to 127.20 support (2022 low).
At the same time, USD/CNH is undergoing similar development. The pair is having a second attempt to break through 38.2% retracement of 6.6971 to 7.3679 at 7.1117. Sustained trading below this level will strengthen the case that fall from 7.3679 is the third leg of the consolidation pattern from 7.3745, aligning with the outlook of USD/JPY. In this case, deeper fall would be seen to 61.8% retracement at 6.9533, with prospect of having a take on 6.6971 support.
Dollar marks December as worst performer, market foresees 88% chance of March Fed rate cut
As December 2023 concludes, Dollar is set to be the month's weakest performer. The persistent selloff can be largely attributed to Fed's signal of the possibility of implementing rate cuts totaling 75 basis points in the coming year, as seen in latest economic projections. This unexpected pivot towards more accommodative monetary policy had a ripple effect across financial markets, notably propelling DOW to record highs and bringing S&P 500 close to its peak levels.
The market's response to Fed's policy shift has been markedly aggressive. Traders have priced in an 88% probability of a 25bps cut as soon as March. Looking ahead to the entirety of 2024, there's a strong consensus, with over an 80% chance, that federal funds rate could decrease to a range of 3.75-4.00%, a notable drop from the current rate of 5.25-5.50%. The underlying rationale for such aggressive market expectations centers around the anticipation of recession in the US next year, a scenario that some analysts believe is increasingly likely.
However, it is important to note that Fed is not alone. ECB and BoE are also expected by the markets to commence rate cuts at some point in the next year. Officials from both these institutions continue to resist these market expectations, but their efforts have fallen into deaf ears. Sterling and Euro have emerged as the second and third weakest currencies, respectively, for December.
USD/JPY Turns Red And At Risk of More Losses
Key Highlights
- USD/JPY started a major decline below the 145.00 support.
- A major bearish trend line is forming with resistance near 142.10 on the 4-hour chart.
- EUR/USD surged above the 1.1040 and 1.1080 levels.
- GBP/USD retested the 1.2820 resistance, where the bears emerged.
USD/JPY Technical Analysis
The US Dollar failed to remain stable above the 145.00 zone against the Japanese Yen. USD/JPY declined below the 143.20 support zone to enter a bearish zone.
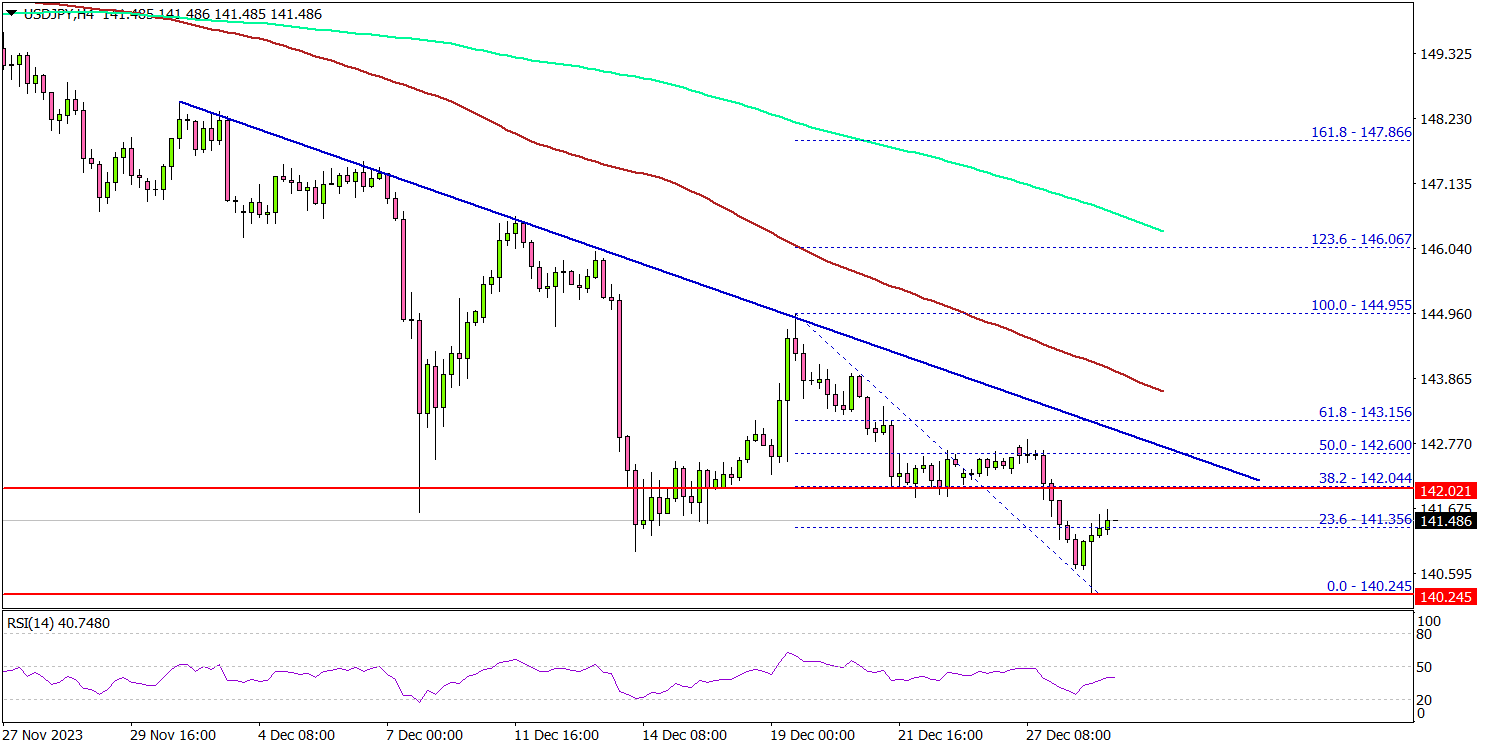
Looking at the 4-hour chart, the pair settled below the 142.50 level, the 100 simple moving average (red, 4 hours), and the 200 simple moving average (green, 4 hours).
The pair even declined below the 141.20 level. A low was formed near 140.24 and the pair is now consolidating losses. On the upside, immediate resistance is near the 141.50 level. The first major resistance is near 142.00.
There is also a major bearish trend line forming with resistance near 142.10 on the same chart. A clear move above the trend line could send the pair further higher toward 142.60.
The next key resistance is near the 143.20 level. A close above the 143.20 zone could open the doors for more upsides. The next stop for the bulls might be 144.00. Any more gains might call for a drift toward the 145.00 level.
If there are more downsides, the pair could drop below the 140.25 level. The next major support is 140.00, below which the pair might decline and test 139.20. Any more losses might send the pair toward the 138.50 support.
Looking at EUR/USD, the pair gained bullish momentum and even climbed above the 1.1100 level before the bears appeared.
Economic Releases
- Chicago Purchasing Manager’s Index for Dec 2023 – Forecast 51.0, versus 55.8 previous.
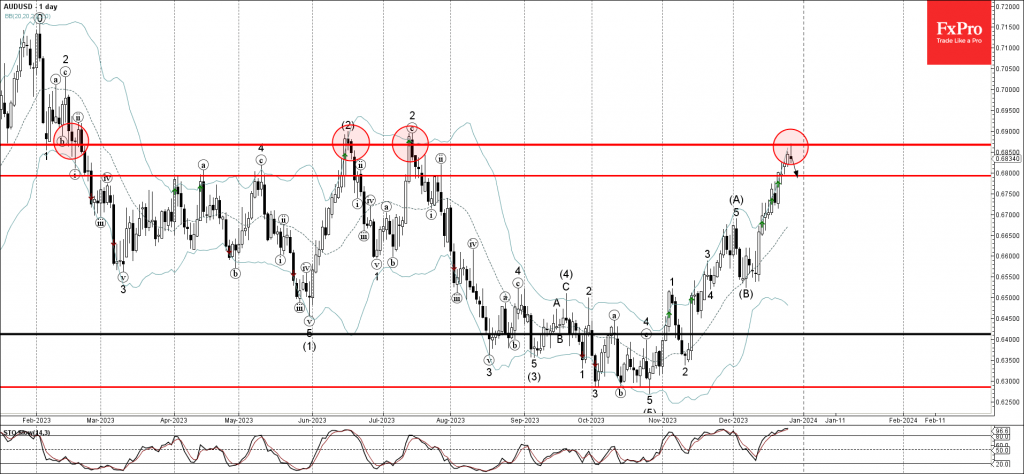
AUDUSD Wave Analysis
- AUDUSD reversed from resistance level 0.6865
- Likely to fall to support level 0.6800
AUDUSD currency pair recently reversed down from the major resistance level 0.6865 (which has been reversing the pair from June).
The resistance level 0.6865 was further strengthened by the nearby upper daily Bollinger Band.
Given the strength of the resistance level 0.6865 and the overbought daily Stochastic, AUDUSD currency pair can be expected to fall further to the next support level 0.6800.