
Sample Category Title
AUD/USD Daily Report
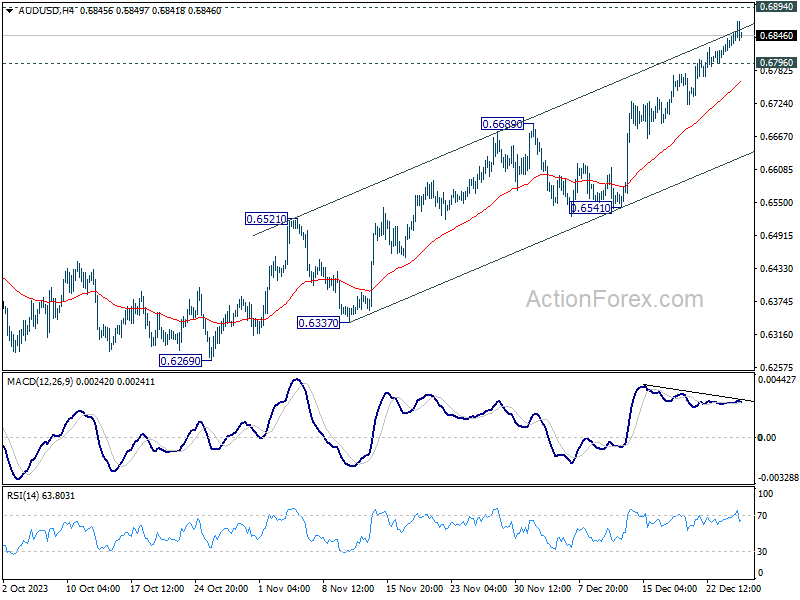
Daily Pivots: (S1) 0.6826; (P) 0.6839; (R1) 0.6860; More...
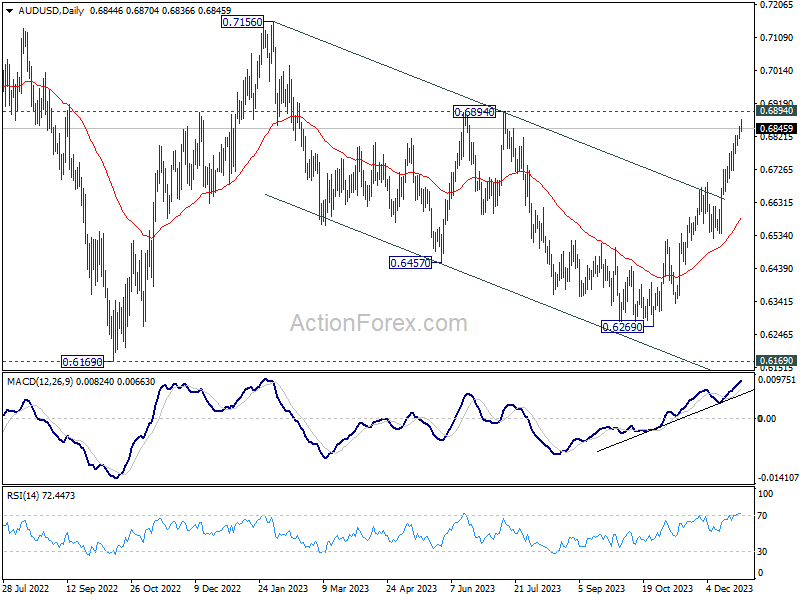
Intraday bias in AUD/USD remains on the upside, as rise from 0.6269 is in progress for 0.6894 resistance first. Sustained break there will target 0.7156 next. On the downside, below 0.6796 minor support will turn intraday bias neutral first. But outlook will remain bullish as long as 0.6689 resistance turned support holds, in case of retreat.
In the bigger picture, there is no confirmation that down trend from 0.8006 (2021 high) has completed. Price actions from 0.6169 (2022 low) could be just a medium term corrective pattern. Rise from 0.6269 is seen as the third leg of the pattern. For now, range trading should be seen between 0.6169 and 0.7156 (2023 high), until further developments.
USD/CAD Daily Outlook
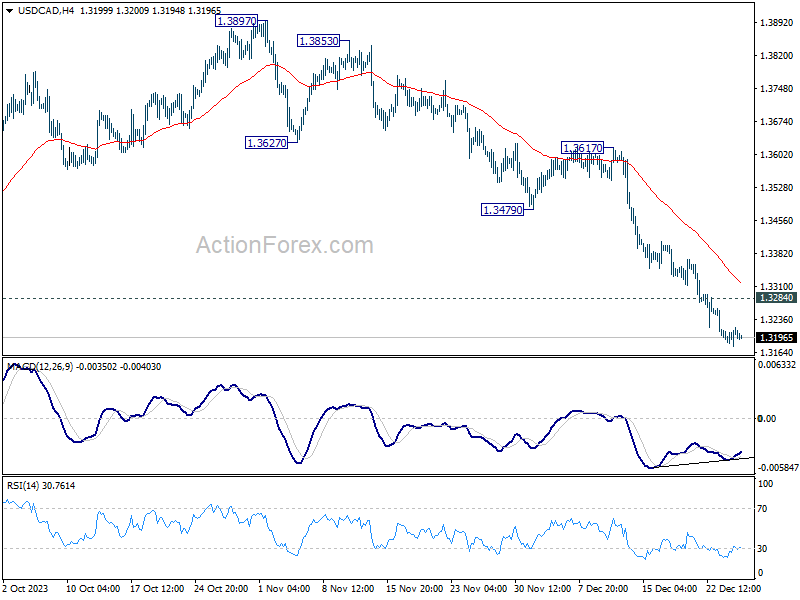
Daily Pivots: (S1) 1.3184; (P) 1.3202; (R1) 1.3226; More...
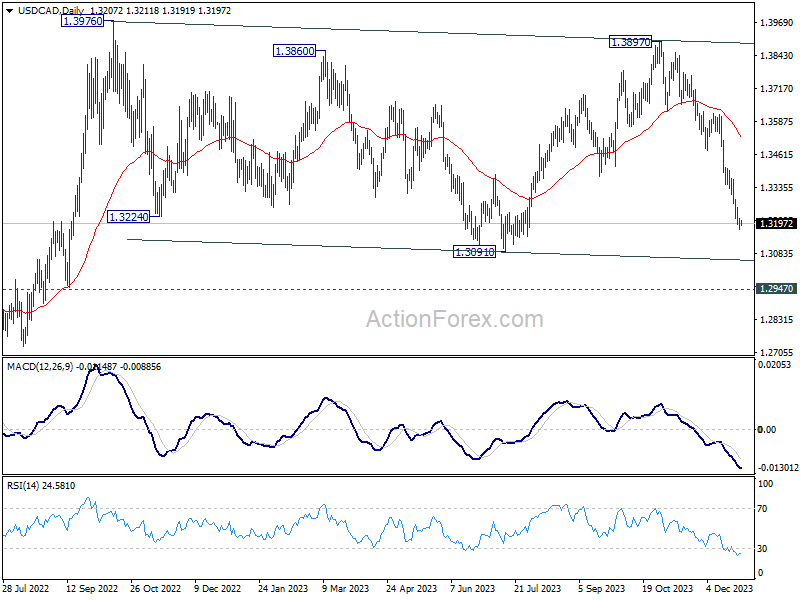
Intraday bias in USD/CAD remains on the downside at this point. Current fall from 1.3897 should target 1.3091 support and possibly below. On the upside, above 1.3284 minor resistance will turn intraday bias neutral and bring consolidations. But another decline will remain in favor as long as 1.3479 support turned resistance holds.
In the bigger picture, outlook is mixed up by deeper then expected fall from 1.3897. But after all, price actions from 1.3976 (2022 high) are viewed as a corrective pattern that's in progress. Larger up trend from 1.2005 (2021 low) is still expected to resume at a later stage as long as 1.2947 resistance turned support holds.
GBP/JPY Daily Outlook
Daily Pivots: (S1) 180.98; (P) 181.58; (R1) 182.14; More...
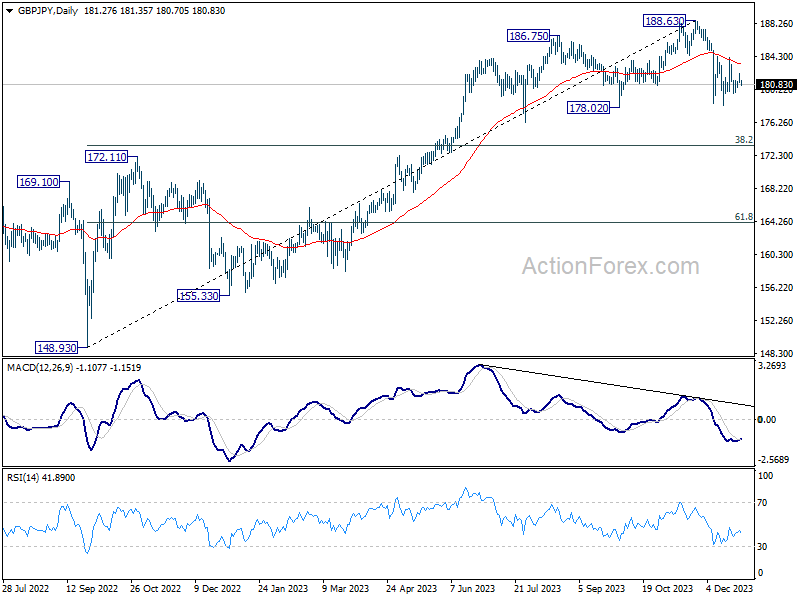
GBP/JPY is still bounded in sideway trading and intraday bias remains neutral at this point. Further decline is expected as long as 184.15 resistance holds. On the downside, break of will resume the decline from 188.63 and target 38.2% retracement of 148.93 to 188.63 at 173.46. However, decisive break of 184.15 will argue that pull back from 188.63 has completed and bring retest of this high.
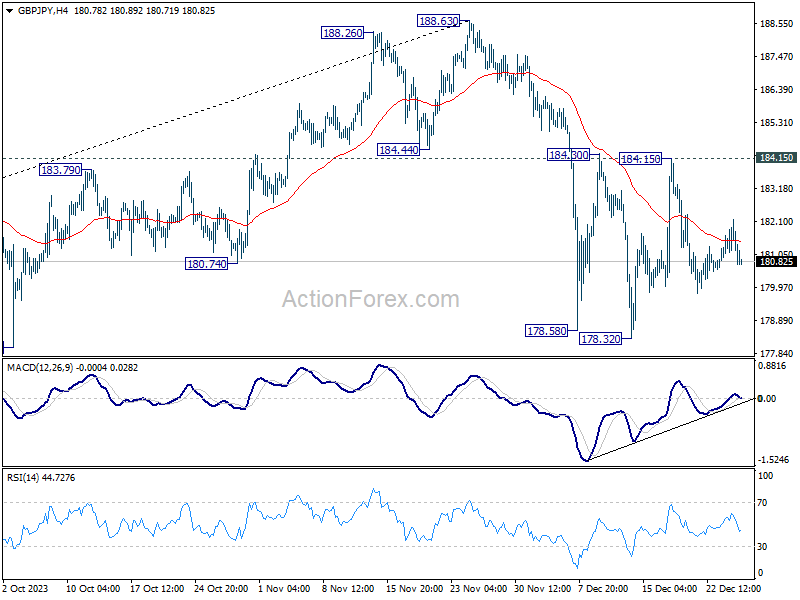
In the bigger picture, price actions from 188.63 medium term top are currently seen as a correction to the up trend from 148.93 (2022 low) only. As long as 172.11 resistance turned support holds, larger up trend from 123.94 (2020 low) is still in favor to resume through 188.63 at a later stage.
EUR/JPY Daily Outlook
Daily Pivots: (S1) 156.96; (P) 157.67; (R1) 158.25; More..
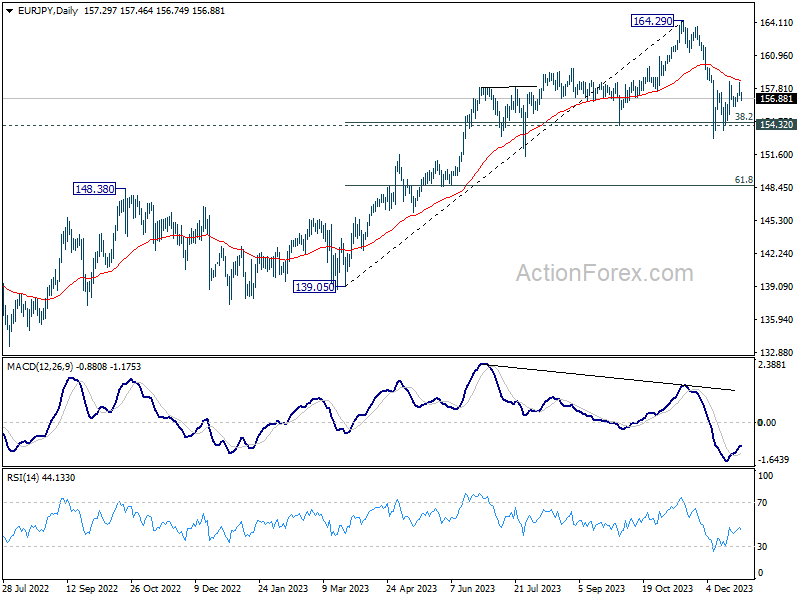
EUR/JPY is still bounded in range of 153.15/158.55 and intraday bias remains neutral. On the upside, above 158.55 will resume the rebound from 153.15. On the downside, break of 153.15 will resume whole fall from 164.39 to 61.8% retracement of 139.05 to 164.29 at 148.69.
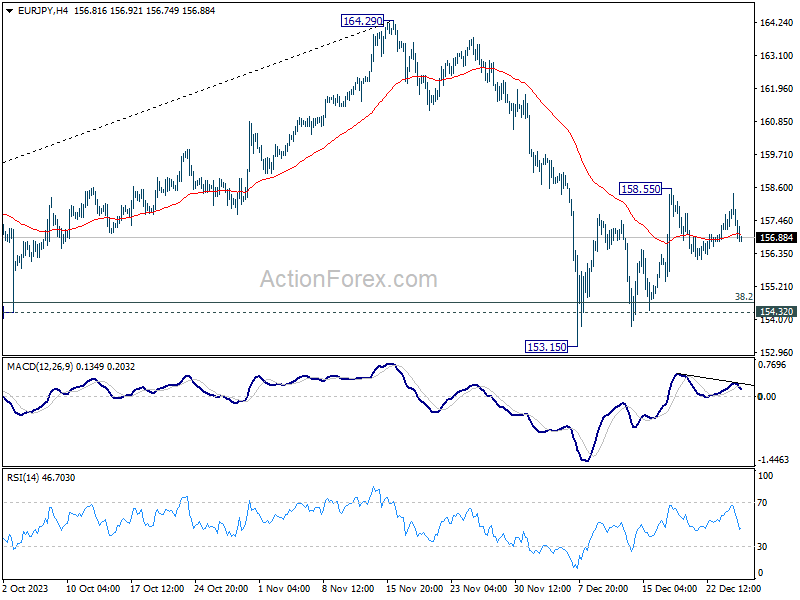
In the bigger picture, price actions from 164.29 medium term top are tentatively seen as a correction to rise from 139.05 for now. As long as 148.48 resistance turned support holds (2022 high), larger up trend from 114.42 (2020 low) could still resume through 164.29 at a later stage.
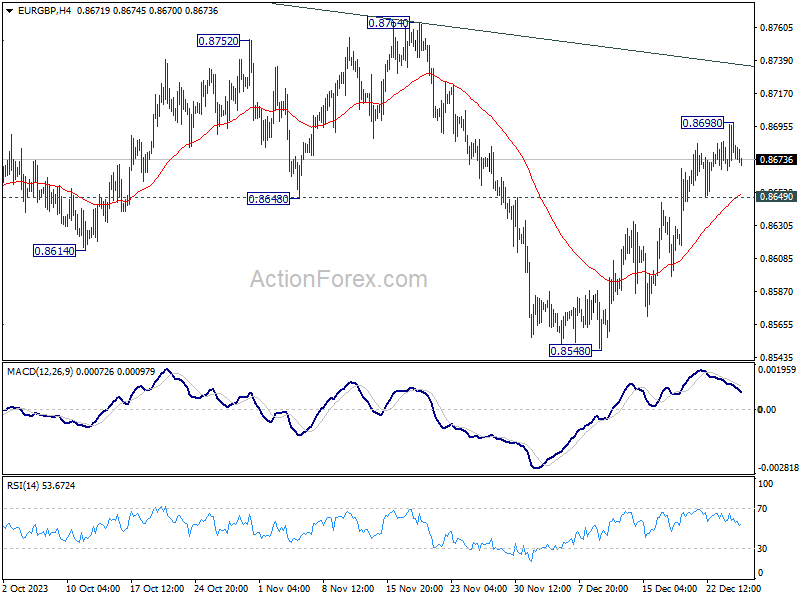
EUR/GBP Daily Outlook
Daily Pivots: (S1) 0.8664; (P) 0.8681; (R1) 0.8695; More...
Intraday bias in EUR/GBP is turned neutral with current retreat, and some consolidations could be seen. On the upside, above 0.8698 will resume the rebound from 0.8548 to 0.8764 key resistance next. Nevertheless, break of 0.8649 will argue that the rebound has completed, and turn bias back to the downside for 0.8548 support instead.
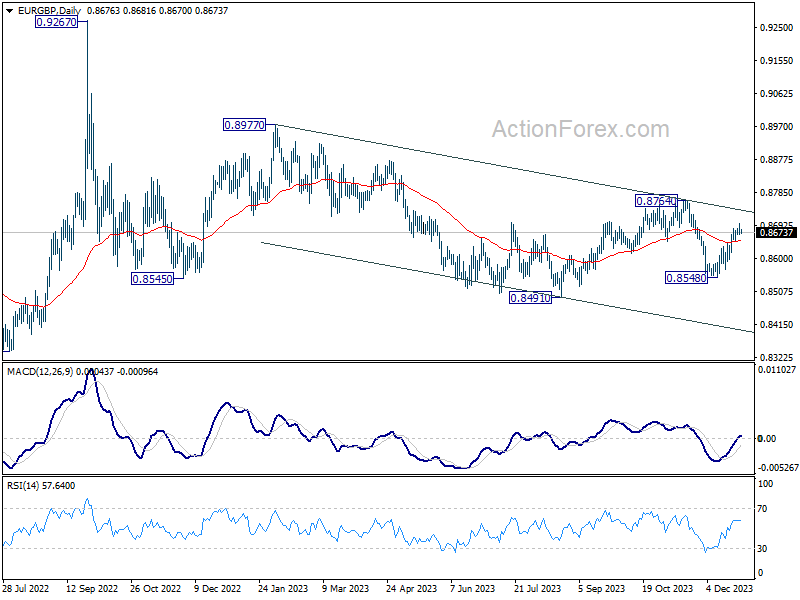
In the bigger picture, current development suggests that down trend from 0.9267 (2022 high) is still in progress. This decline is seen as the third leg of the pattern from 0.9499 (2020 high). Break of 0.8201 will target 100% projection of 0.9499 to 0.8201 from 0.9267 at 0.7969. In any case, outlook will stay bearish as long as 0.8764 resistance holds.
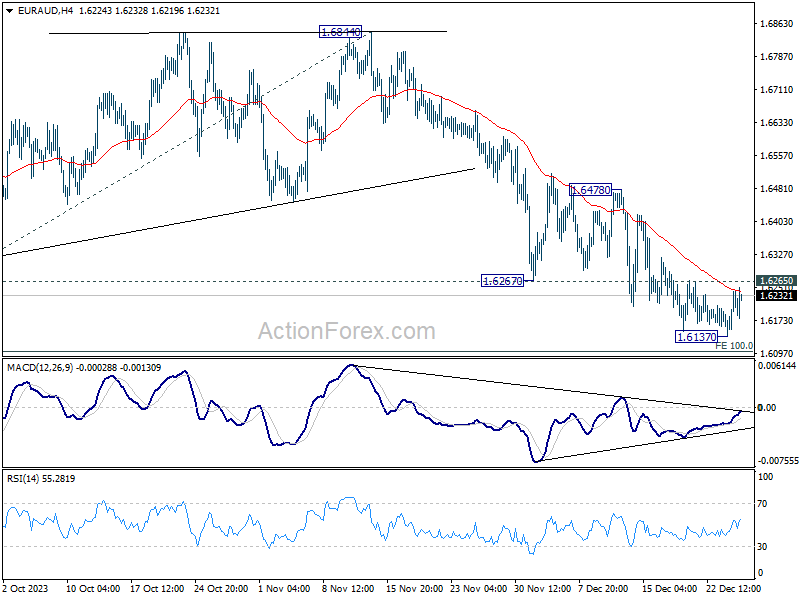
EUR/AUD Daily Outlook
Daily Pivots: (S1) 1.6160; (P) 1.6201; (R1) 1.6263; More...
EUR/AUD recovered again after brief dip to 1.6137 and intraday bias is turned neutral again. Below 1.6137 will target 100% projection of 1.7062 to 1.6319 from 1.6844 at 1.6106. Meanwhile, considering bullish convergence condition in 4H MACD, firm break of 1.6265 resistance should indicate short term bottoming, and turn bias back to the upside for 1.6478 resistance instead.
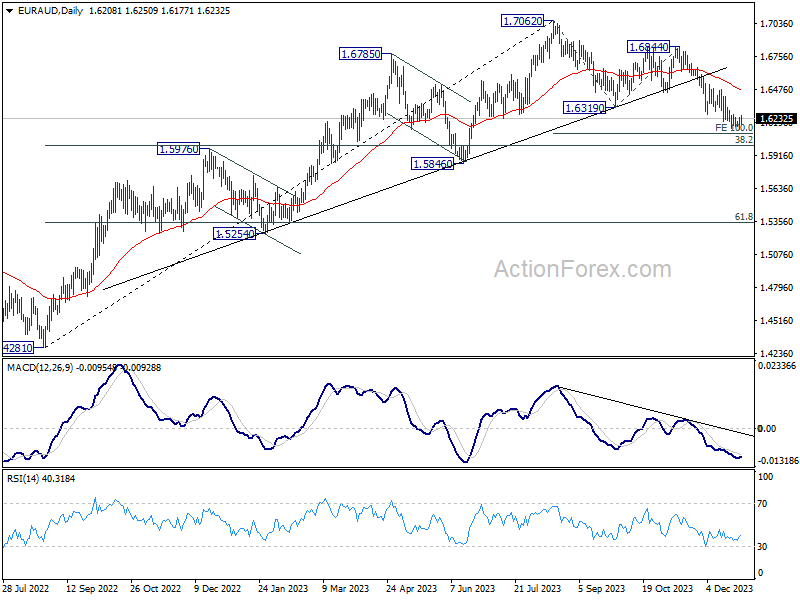
In the bigger picture, fall from 1.7062 medium term top is seen as correcting the whole up trend from 1.4281 (2022 low). Deeper decline would be seen to 38.2% retracement of 1.4281 to 1.7062 at 1.6000. Strong support could be seen there to bring rebound on first attempt. But risk will stay on the downside as long as 1.6844 resistance holds. Sustained break of 1.6000 would bring further fall to 61.8% retracement at 1.5343.
EUR/CHF Daily Outlook
Daily Pivots: (S1) 0.9329; (P) 0.9387; (R1) 0.9421; More...
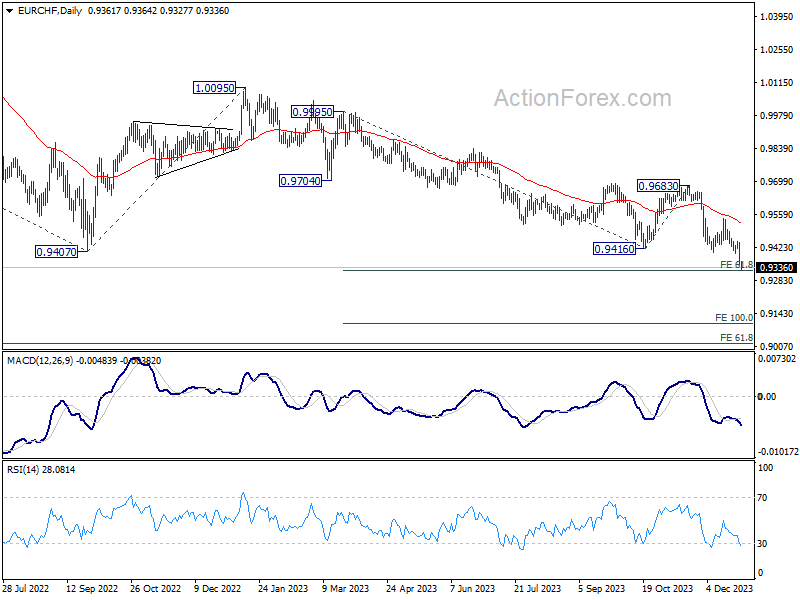
EUR/CHF's decline resumed after brief consolidations and hit as low as 0.9327 so far. Intraday bias is back on the downside. Firm break of 61.8% projection of 0.9995 to 0.9416 from 0.9683 at 0.9325, will pave the way to 100% projection at 0.9104 next. On the upside, above 0.9395 minor resistance will turn bias neutral fist. but outlook will stay bearish as long as 0.9543 resistance holds, even in case of strong recovery.
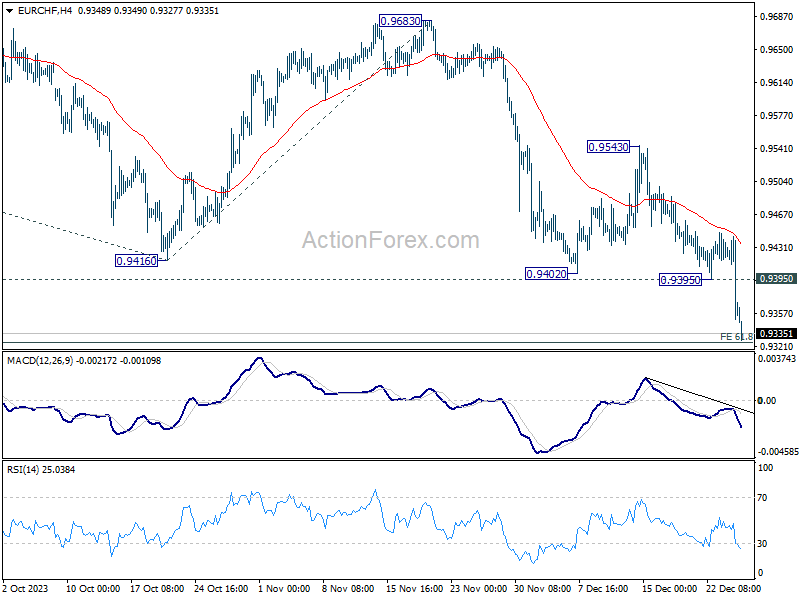
In the bigger picture, medium term outlook remains bearish as long as 0.9683 resistance holds. Current fall from 1.2004 (2018 high) is part of the multi-decade down trend. Next target is 61.8% projection of 1.1149 (2020 high) to 0.9407 from 1.0095 at 0.9018.
Yen Strengthens on BoJ Ueda, Swiss Franc Hits Highs, Dollar Struggles
Japanese Yen soars broadly in Asian session today, likely in delayed reactions to comment made by BoJ Governor Kazuo Ueda. Speaking to NHK, Governor Ueda indicated that the chance of moving the short-term interest rate out of negative territory in 2024 was "not zero."
This remark marks a notable shift in tone from the central bank, even though Ueda also stated that he is "not quite convinced yet" that inflation in Japan can sustainably reach the 2% target. He emphasized the importance of the upcoming Spring wage negotiations as a critical factor in the central bank's decision-making process. Additionally, he further elaborated that BoJ would like to see wages hikes "broaden" to smaller firms.
Despite Yen's rally, Swiss Franc has outshone it by reaching multi-year highs against major currencies such as the Dollar, Euro, and Sterling. A significant factor behind the strength of the Franc is the relatively low interest rate of 1.75% set by SNB, which reduces the likelihood of an imminent rate cut. This contrasts with the higher interest rates of other major central banks like Fed at 5.50%, ECB at 4.50%, BoE at 5.25%.
For the week so far, Dollar is positioned at the bottom of the performance chart, influenced a risk-on sentiment that saw DOW reached another record high overnight. However, commodity currencies are not faring much better, with Canadian Dollar ranking as the second weakest. Swiss Franc leads as the top performer, followed by Sterling and Euro, while Yen shows mixed performance.
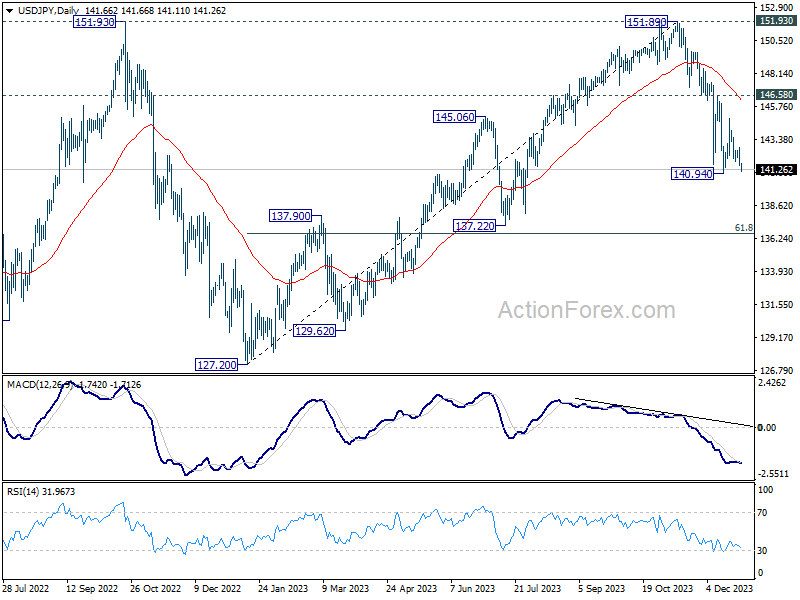
Technically, a key focus for the rest of the week will be on whether USD/JPY could break through 140.94 support to resume the decline from 151.89. Such fall is seen as the third leg of the pattern from 151.93. Break of 140.94 will target 61.8% retracement of 127.20 to 151.89 at 136.63, sustained break there will pave the way to 127.20 support (2022 low).
In Asia, at the time of writing, Nikkei is down -0.38%. Hong Kong HSI is up 2.47%. China Shanghai SSE is up 1.42%. Singapore Strait Times is up 1.77%. Japan 10-year JGB yield is down -0.0069 at 0.592. Overnight, DOW rose 0.30%. S&P 500 rose 0.14%. NASDAQ rose 0.16%. 10-year yield fell -0.097 to 3.789.
Japan's industrial production down -0.9% mom, continues to seesaw indecisively
Japan's industrial production fell -0.9% mom in November, marking the first decrease in three months. This drop, however, was less severe than the expected -1.6% mom decline. A notable factor in the contraction was -2.5% mom fall in motor vehicle production. Among the 15 sectors surveyed, 11 reported decreased production, while four sectors experienced increases.
Index of industrial shipments also dropped by -1.3% mom, aligning with overall decline in industrial production. Conversely, Index of inventories saw a marginal increase of 0.1% mom.
The Ministry of Economy, Trade and Industry maintained its assessment of industrial output as "fluctuating indecisively." Looking ahead, manufacturers expect a rebound in output by 6.0% mom in December, followed by -7.2% mom decrease in January 2023.
An METI official said, "We'll continue to monitor the impact of the global economic downturn and rising prices".
In separate release, retail sales data painted a more positive picture. Sales in November rose 5.3% yoy, exceeding forecast of 5.0% yoy, and marked the 21st consecutive month of expansion since March 2022. On a month-on-month basis, retail sales grew 1.0%, following 1.7% growth in October.
Looking ahead
The European economic calendar is empty today. US will release jobless claims, goods trade balance, and pending home sales.
EUR/CHF Daily Outlook
Daily Pivots: (S1) 0.9329; (P) 0.9387; (R1) 0.9421; More...
EUR/CHF's decline resumed after brief consolidations and hit as low as 0.9327 so far. Intraday bias is back on the downside. Firm break of 61.8% projection of 0.9995 to 0.9416 from 0.9683 at 0.9325, will pave the way to 100% projection at 0.9104 next. On the upside, above 0.9395 minor resistance will turn bias neutral fist. but outlook will stay bearish as long as 0.9543 resistance holds, even in case of strong recovery.
In the bigger picture, medium term outlook remains bearish as long as 0.9683 resistance holds. Current fall from 1.2004 (2018 high) is part of the multi-decade down trend. Next target is 61.8% projection of 1.1149 (2020 high) to 0.9407 from 1.0095 at 0.9018.
Economic Indicators Update
| GMT | Ccy | Events | Actual | Forecast | Previous | Revised |
|---|---|---|---|---|---|---|
| 23:50 | JPY | Industrial Production M/M Nov P | -0.90% | -1.60% | 1.30% | |
| 23:50 | JPY | Retail Trade Y/Y Nov | 5.30% | 5.00% | 4.20% | 4.10% |
| 13:30 | USD | Initial Jobless Claims (Dec 22) | 204K | 205K | ||
| 13:30 | USD | Goods Trade Balance (USD) Nov P | -89.5B | -89.6B | ||
| 13:30 | USD | Wholesale Inventories Nov P | -0.20% | -0.40% | ||
| 15:00 | USD | Pending Home Sales M/M Nov | 1.10% | -1.50% | ||
| 15:30 | USD | Natural Gas Storage | -80B | -87B | ||
| 15:30 | USD | Crude Oil Inventories | -2.7M | 2.9M |
Technical Outlook and Review
DXY:
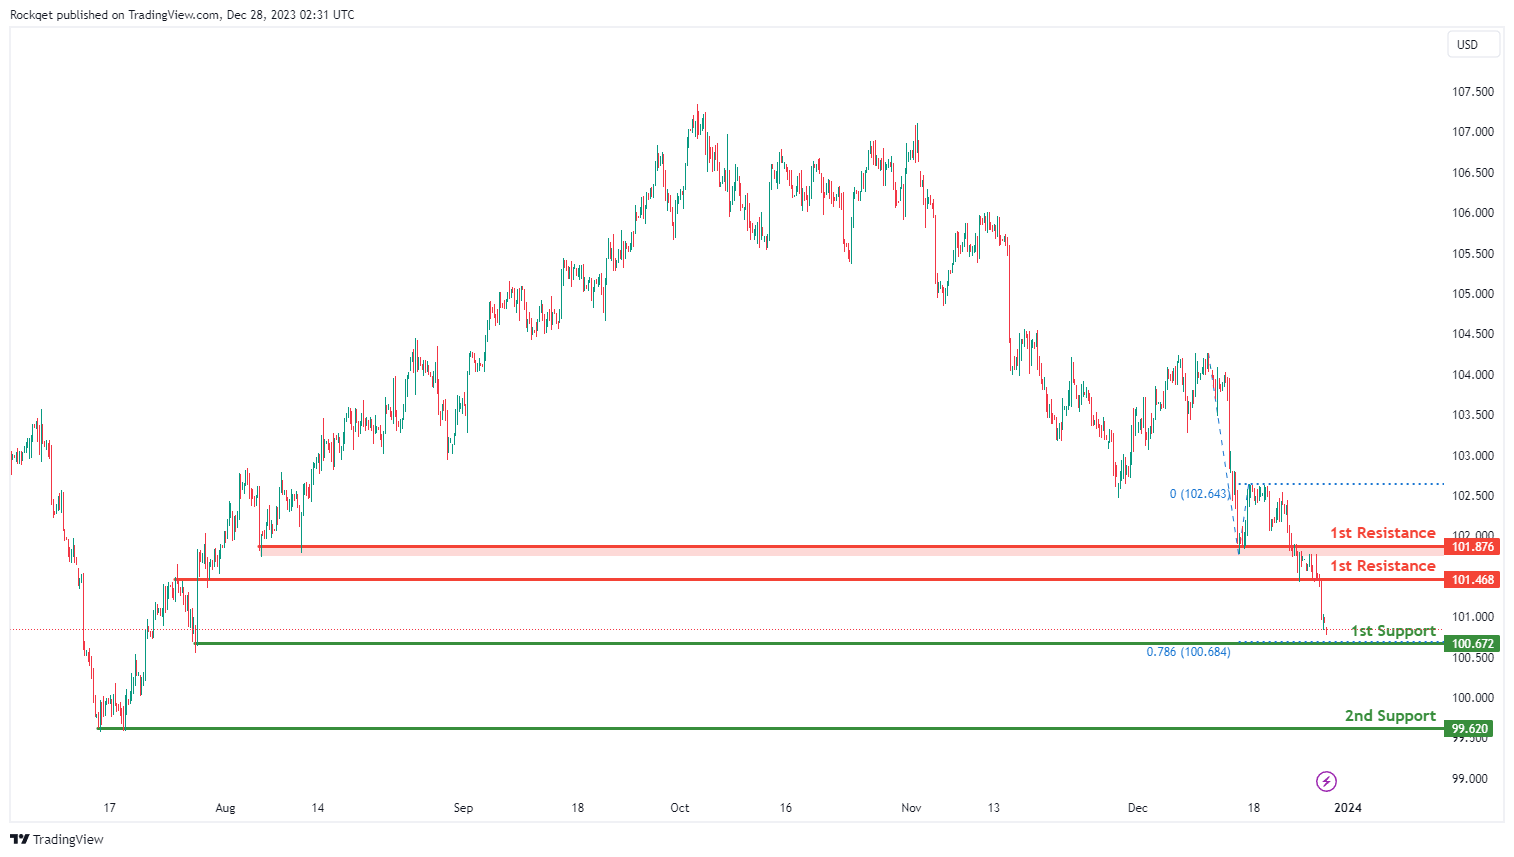
The DXY (US Dollar Index) chart currently shows an overall bearish momentum, indicating a potential for price to make a bearish continuation towards the 1st support.
The 1st support level at 100.67 is identified as a swing-low support that aligns with the 78.60% Fibonacci projection level. Further below, the 2nd support level at 99.62 is noted as pullback support, further reinforcing its importance as a potential key support level.
To the upside, the 1st resistance level at 101.46 is identified as an overlap resistance. Higher up, the 2nd resistance level at 101.87 is also marked as an overlap resistance, suggesting a potential barrier for further upside movement.
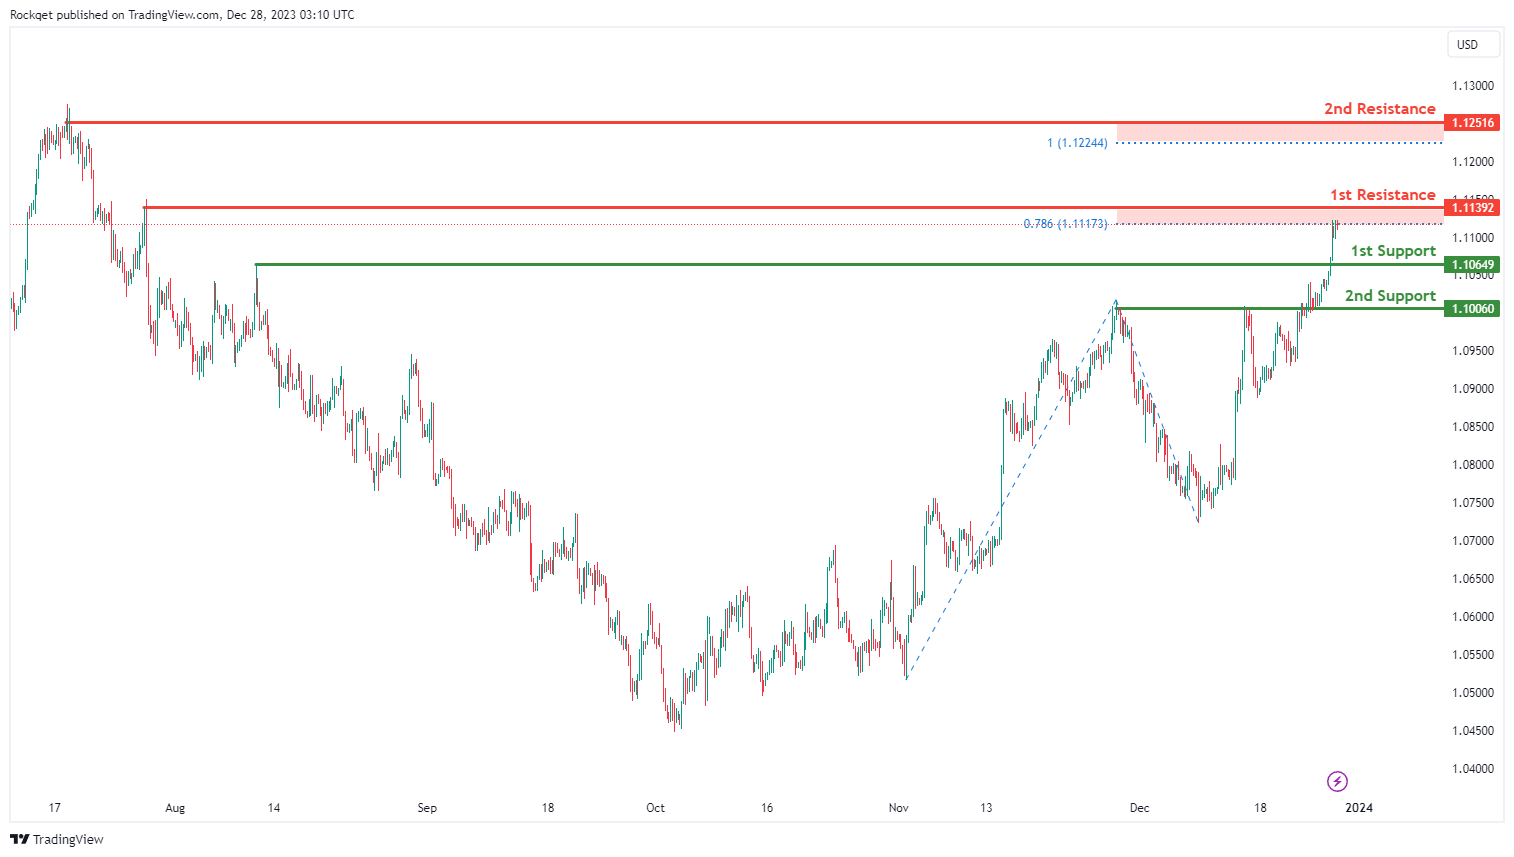
EUR/USD:
The EUR/USD chart currently exhibits an overall bullish momentum. In this context, there is a potential scenario for price to make a bullish continuation towards the 1st resistance.
The 1st resistance level at 1.1139 is identified as a swing-high resistance that aligns close to the 78.60% Fibonacci projection level. Higher up, the 2nd resistance level at 1.1251 is also noted as a swing-high resistance that aligns close to the 100.00% Fibonacci projection level, suggesting a potential barrier for further upside movement.
To the downside, the 1st support level at 1.1064 is identified as a pullback support. Further below, the 2nd support level at 1.1006 is marked as an overlap support, further reinforcing its importance as a potential key support level.
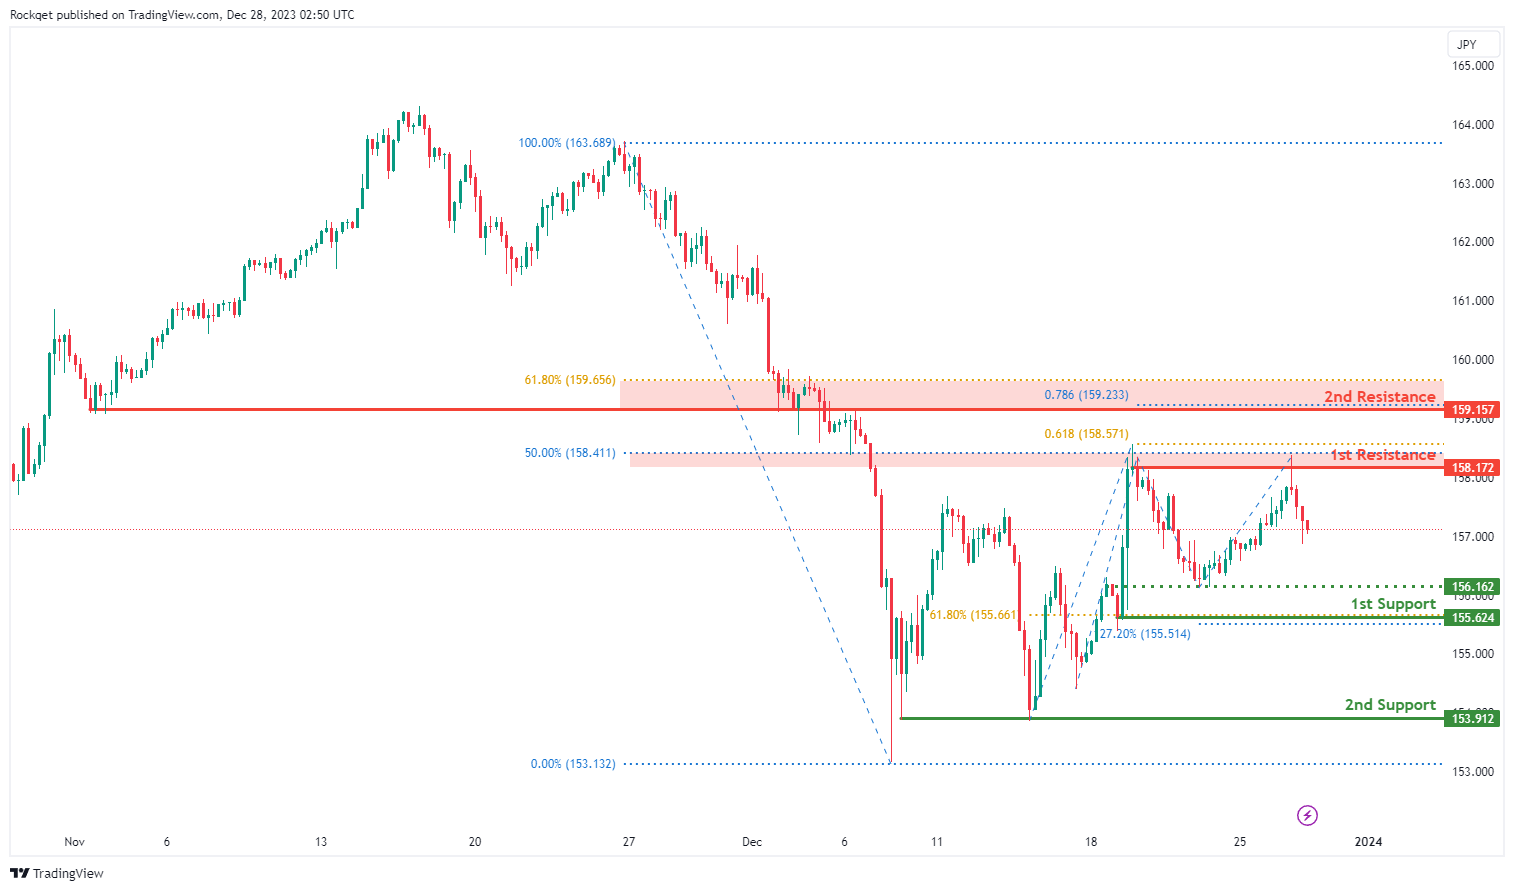
EUR/JPY:
The EUR/JPY chart currently exhibits a bearish overall momentum, indicating a potential scenario for a bearish continuation towards the 1st support.
The 1st support at 155.62 is considered significant as it represents a pullback support and is associated with the 61.80% Fibonacci Retracement and the -27% Fibonacci Expansion. This level indicates a historical area where buying interest has been present.
Additionally, the 2nd support at 153.91 is identified as a multi-swing low support, providing an additional layer of potential support for the currency pair.
The intermediate support at 156.62 is marked as an overlap support.
On the resistance side, the 1st resistance at 158.17 is marked as a swing high resistance and is associated with the 61.80% Fibonacci Projection. This represents a level where selling interest could intensify.
Furthermore, the 2nd resistance at 159.16 is identified as an overlap resistance and is associated with the 61.80% Fibonacci Retracement and the 78.60% Fibonacci Projection, presenting potential barriers for upward movement.
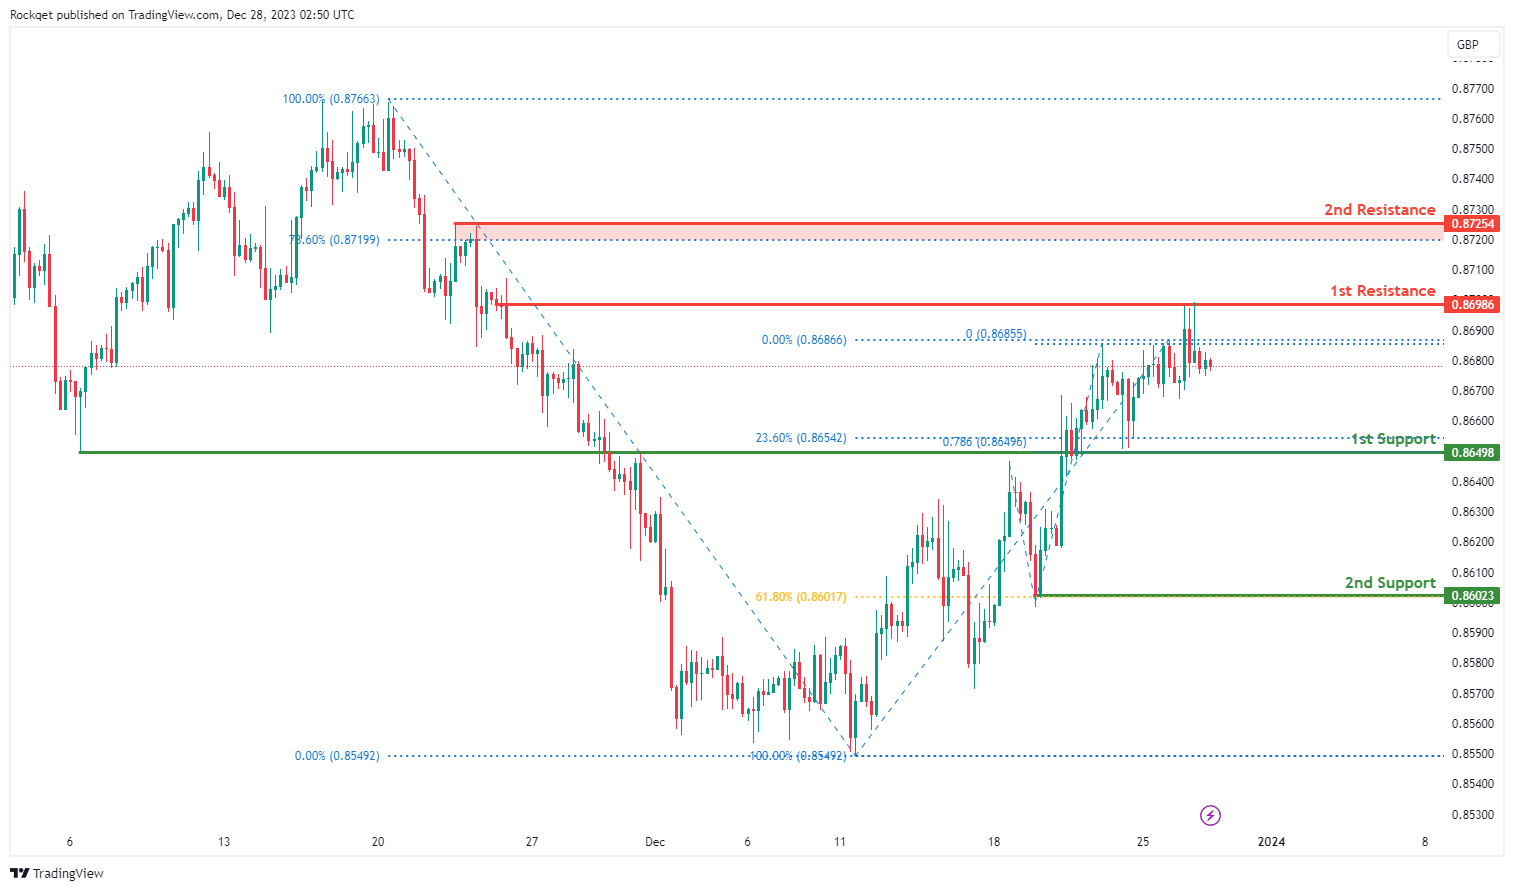
EUR/GBP:
The EUR/GBP chart currently exhibits a bearish overall momentum, indicating a potential scenario for a bearish continuation towards the 1st support.
The 1st support at 0.8650 is considered significant as it represents an overlap support and is associated with the 23.60% Fibonacci Retracement and the 78.60% Fibonacci Projection. This level indicates a historical area where buying interest has been present.
Additionally, the 2nd support at 0.8602 is identified as a pullback support and is associated with the 61.80% Fibonacci Retracement, providing an additional layer of potential support for the currency pair.
On the resistance side, the 1st resistance at 0.8689 is marked as an overlap resistance, representing a level where selling interest could intensify.
Furthermore, the 2nd resistance at 0.8725 is identified as a pullback resistance and is associated with the 78.60% Fibonacci Retracement, presenting potential barriers for upward movement.
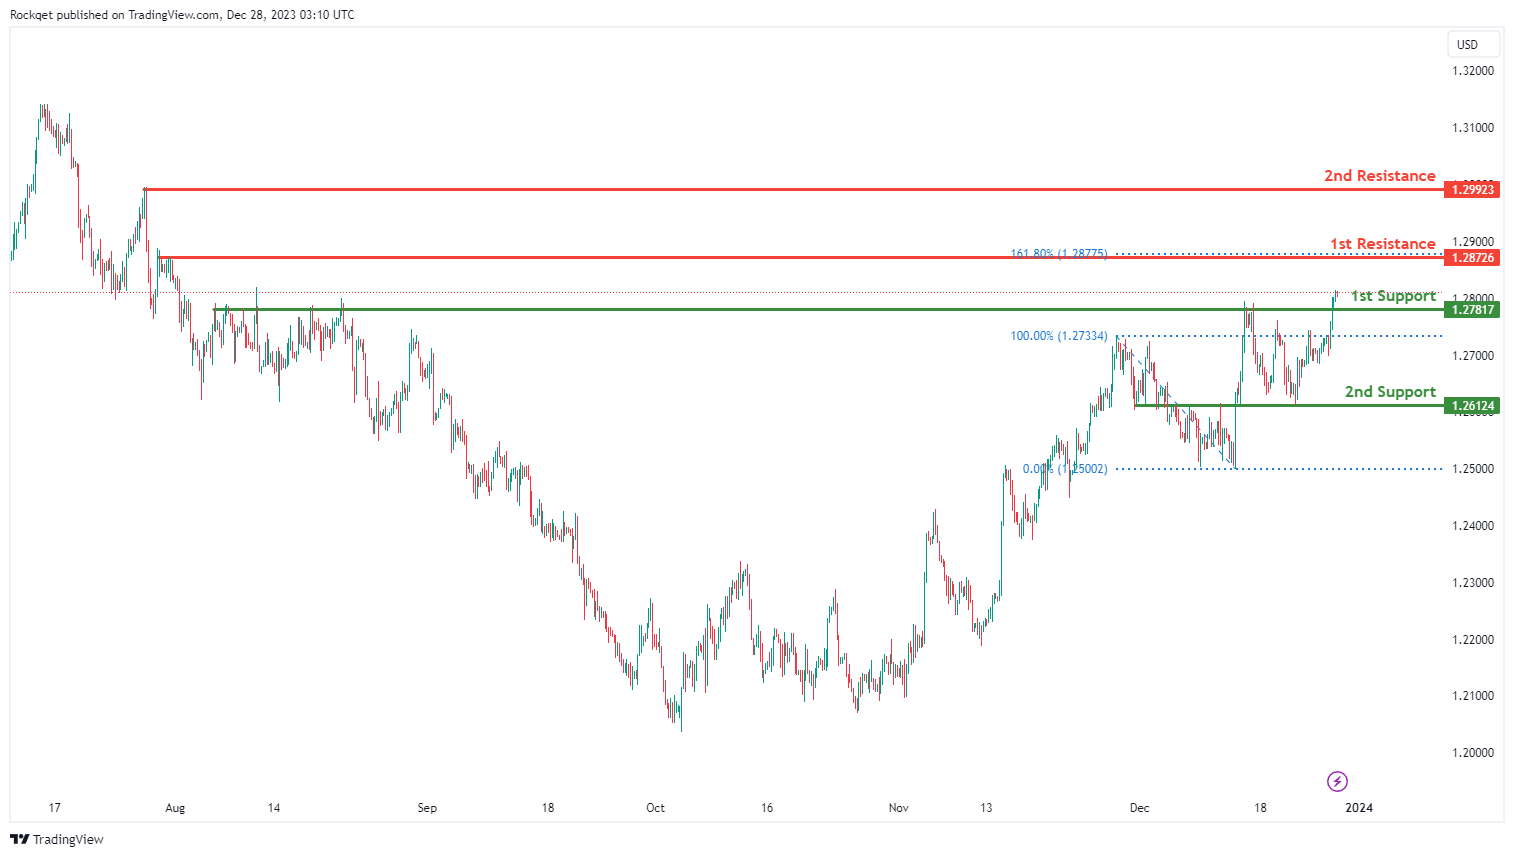
GBP/USD:
The GBP/USD chart currently exhibits an overall bullish momentum. In this context, there is a potential scenario for price to make a bullish continuation towards the 1st resistance.
The 1st resistance level at 1.2872 is identified as a pullback resistance that aligns with the 161.80% Fibonacci extension level. Higher up, the 2nd resistance level at 1.2992 is noted as a swing-high resistance, suggesting a potential barrier for further upside movement.
To the downside, the 1st support level at 1.2781 is identified as a pullback support. Further below, the 2nd support level at 1.2612 is marked as an overlap support, further reinforcing its importance as a potential key support level.
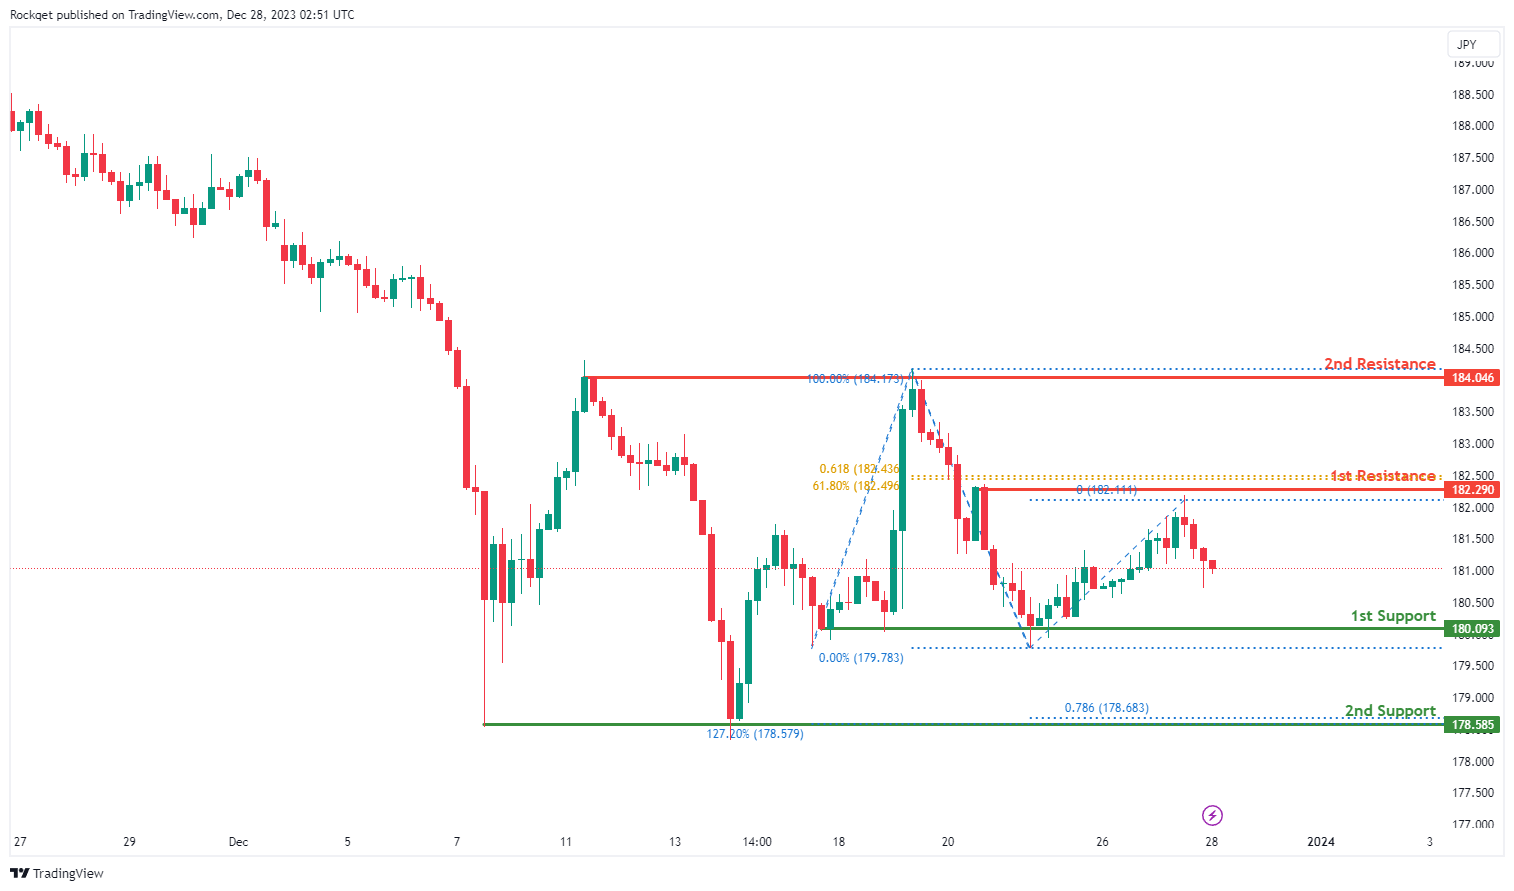
GBP/JPY:
The GBP/JPY chart currently demonstrates a bearish overall momentum, indicating a potential scenario for a bearish continuation towards the 1st support.
The 1st support at 180.09 is deemed significant as it represents a multi-swing low support, suggesting a historical area where buying interest has been notable.
Additionally, the 2nd support at 178.59 is identified as a multi-swing low support and is associated with the 127.20% Fibonacci Extension and the 78.60% Fibonacci Projection, adding layers of potential support for the currency pair.
On the resistance side, the 1st resistance at 182.29 is marked as a pullback resistance and is associated with the 61.80% Fibonacci Projection, presenting a level where selling interest could intensify.
Furthermore, the 2nd resistance at 184.05 is noted as a multi-swing high resistance, indicating a historical area where selling interest has been prevalent.
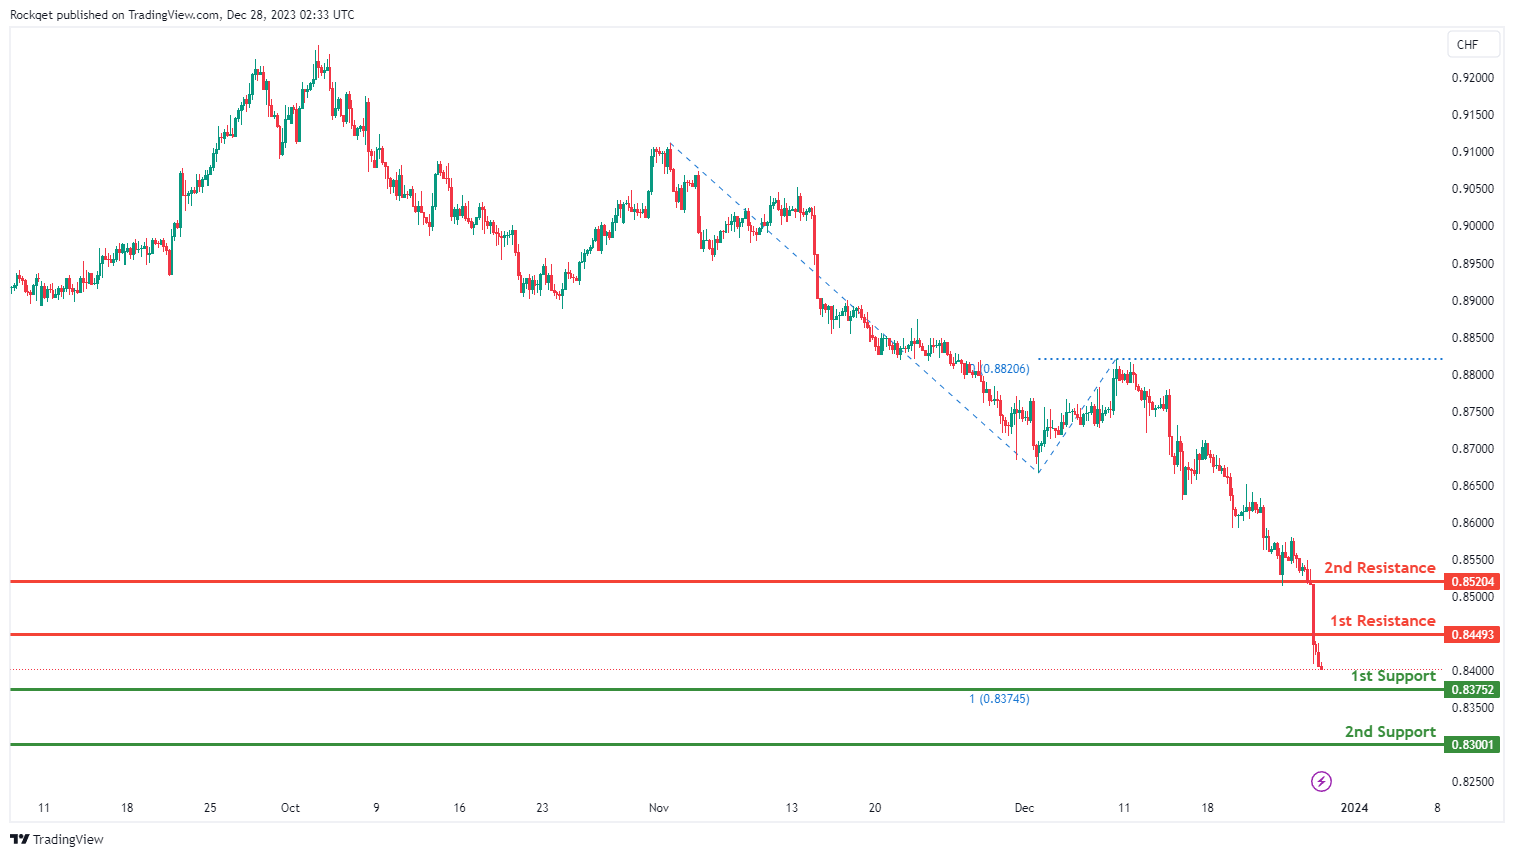
USD/CHF:
The USD/CHF chart currently exhibits an overall bearish momentum. In this context, there is a potential scenario for price to make a bearish continuation towards the 1st support.
The 1st support level at 0.8375 is identified as a multi-swing-low support that aligns with the 100.00% Fibonacci projection level. Further below, the 2nd support level at 0.8300 is noted as a swing-low support, further reinforcing its importance as a key support level.
To the upside, the 1st resistance level at 0.8449 is identified as a pullback resistance. Higher up, the 2nd resistance level at 0.8520 is also also marked as a pullback resistance, suggesting a potential barrier for further upside movement.
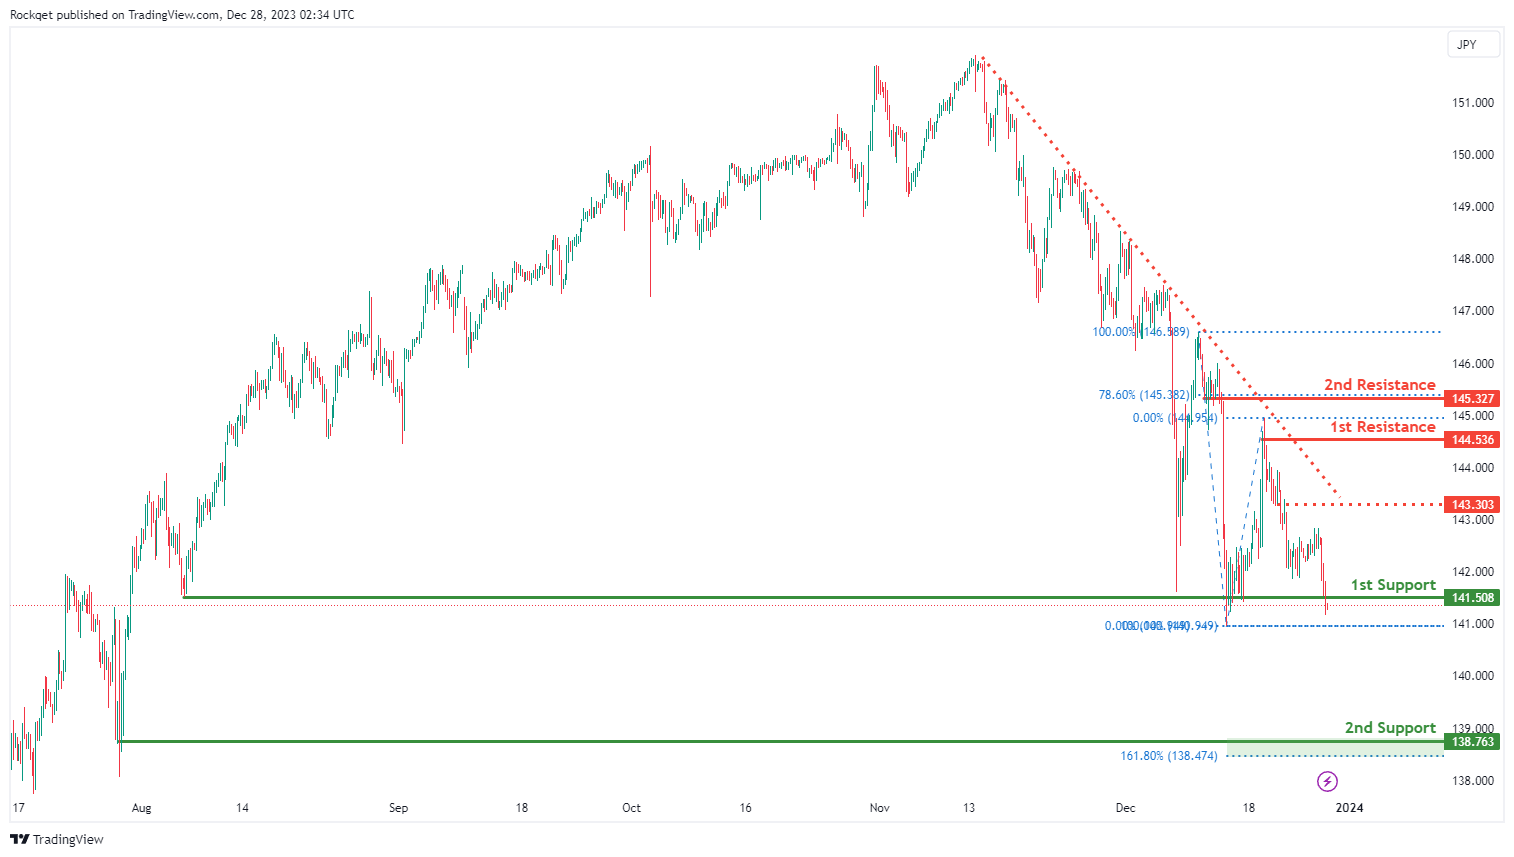
USD/JPY:
The USD/JPY chart currently exhibits an overall bearish momentum. In this context, there is a potential for price to break under the 1st support and drop towards the 2nd support.
The 1st support level at 141.50 is identified as a multi-swing-low support. Further below, the 2nd support level at 138.76 is noted as a swing-low support that aligns close to the 161.80% Fibonacci extension level, further reinforcing its importance as a key support level.
To the upside, the intermediate resistance level at 143.30 is identified as a pullback resistance while the 1st resistance level at 144.53 is noted as a swing-high resistance. Higher up, the 2nd resistance level at 145.32 is marked as a pullback resistance that aligns with the 78.60% Fibonacci retracement level, suggesting a potential barrier for further upside movement.
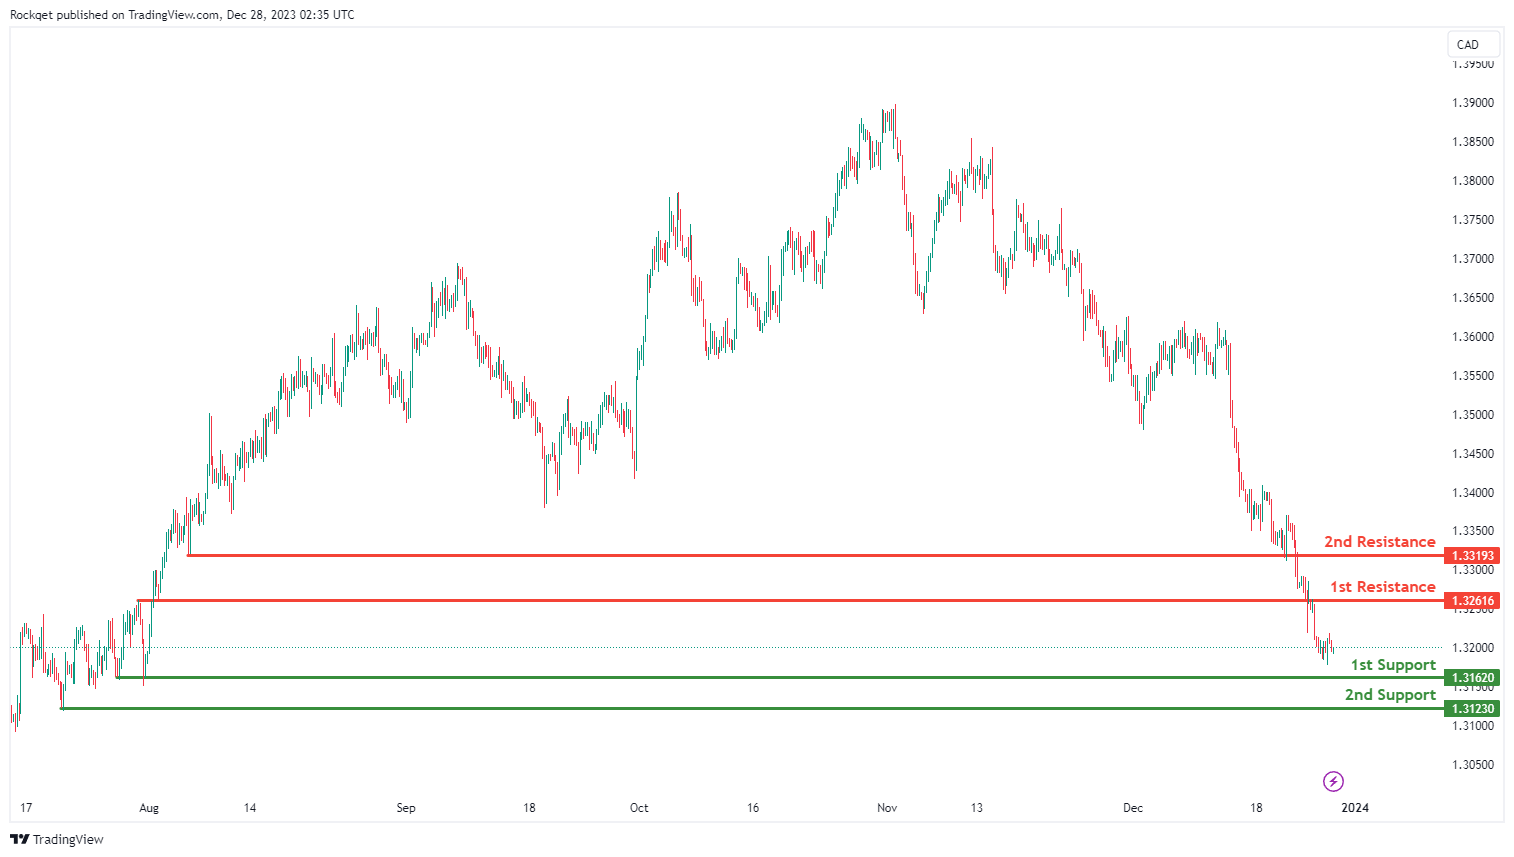
USD/CAD:
The USD/CAD chart currently exhibits an overall bearish momentum. In this context, there is a potential scenario for price to make a bearish continuation towards the 1st support.
The 1st support level at 1.3162 is identified as a multi-swing-low support. Further below, the 2nd support level at 1.3123 is noted as a swing-low support, further reinforcing its importance as a key support level.
To the upside, the 1st resistance level at 1.3261 is identified as an overlap resistance. Higher up, the 2nd resistance level at 1.3319 is marked as a pullback resistance, suggesting a potential barrier for further upside movement.
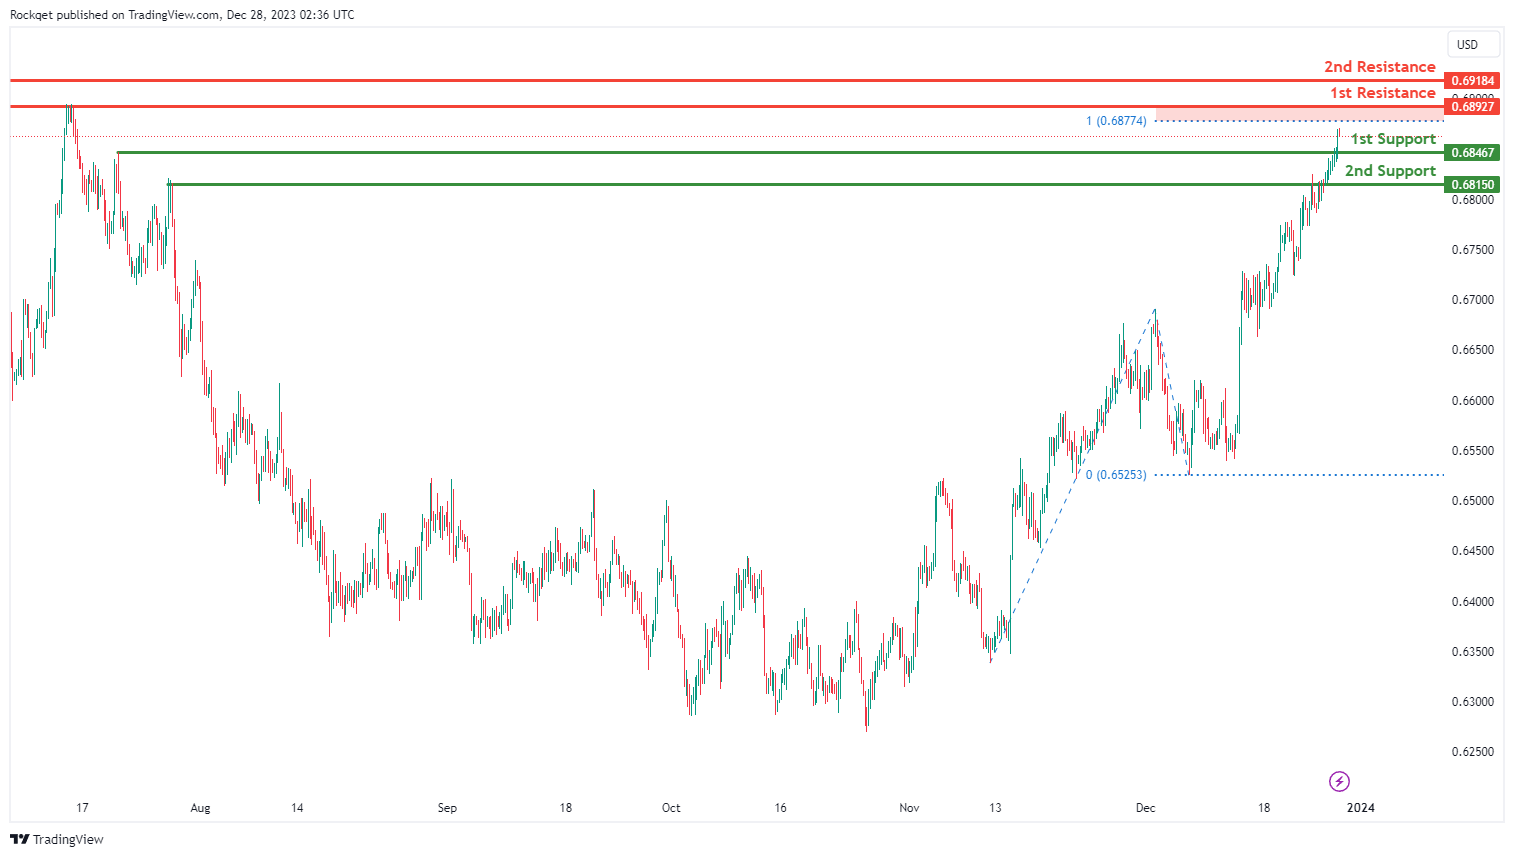
AUD/USD:
The AUD/USD chart currently exhibits an overall bullish momentum. In this context, there is a potential scenario for price to make a bullish continuation towards the 1st resistance.
The 1st resistance level at 0.6892 is identified as a multi-swing-high resistance that aligns close to the 100.00% Fibonacci projection level. Higher up, the 2nd resistance level at 0.6918 is noted as a swing-high resistance, indicating its potential significance as a barrier for further upward movement.
To the downside, the 1st support level at 0.6846 is identified as a pullback support. Further below, the 2nd support level at 0.6815 is marked as an overlap support, further reinforcing its importance as a key support level.
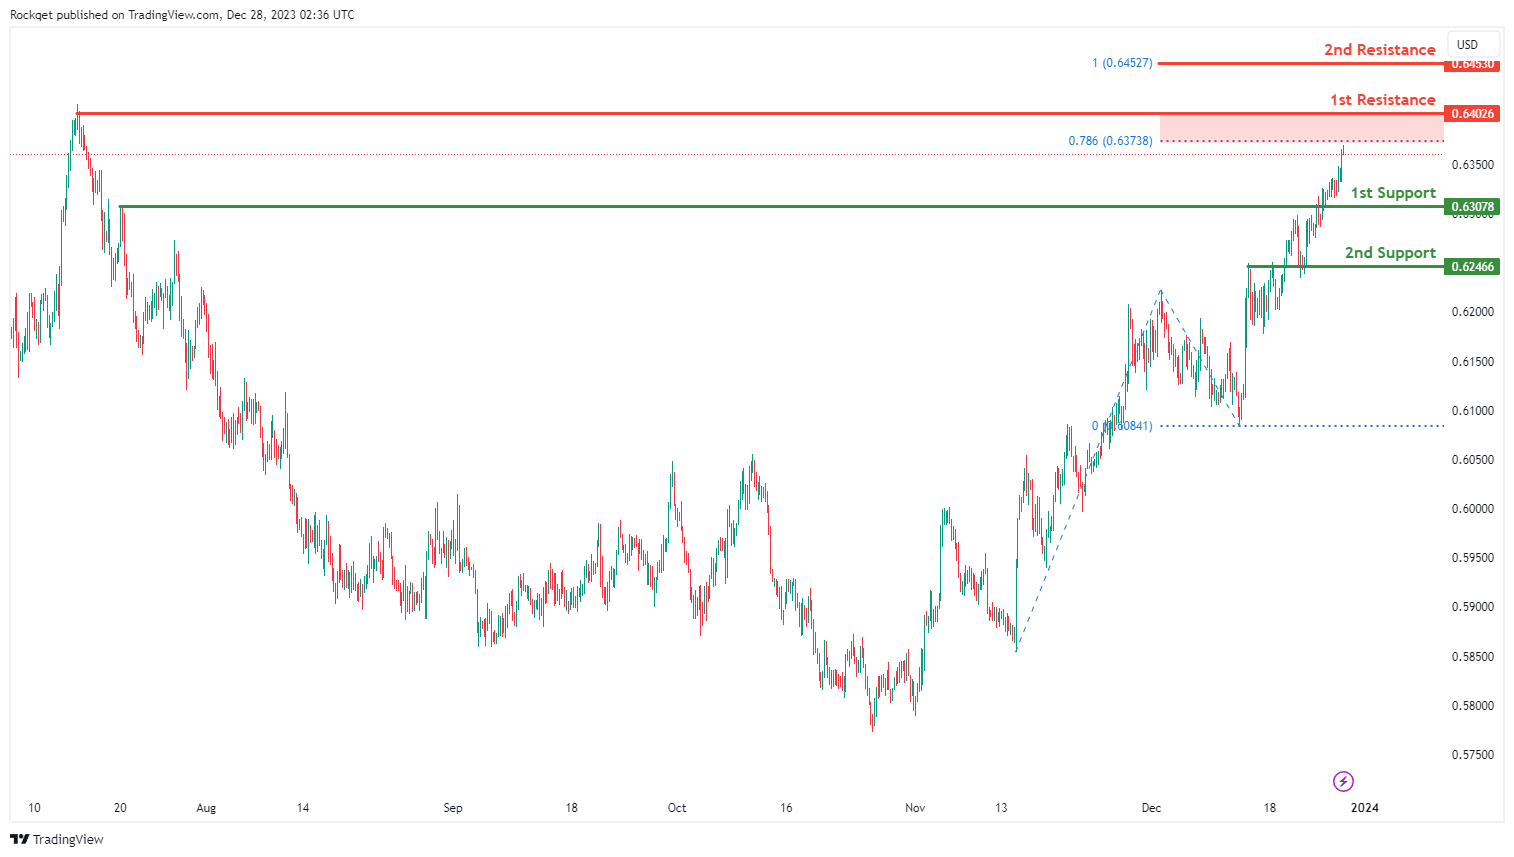
NZD/USD
The NZD/USD chart currently exhibits an overall bullish momentum. In this context, there is a potential scenario for price to make a bullish continuation towards the 1st resistance.
The 1st resistance level at 0.6402 is identified as a swing-high resistance. Higher up, the 2nd resistance level at 0.6453 is marked as a resistance that aligns with the 100.00% Fibonacci projection level, indicating its potential significance as a barrier for further upward movement.
To the downside, the 1st support level at 0.6307 is identified as an overlap support. Further below, the 2nd support level at 0.6246 is also noted as an overlap support, further reinforcing its importance as a key support level.
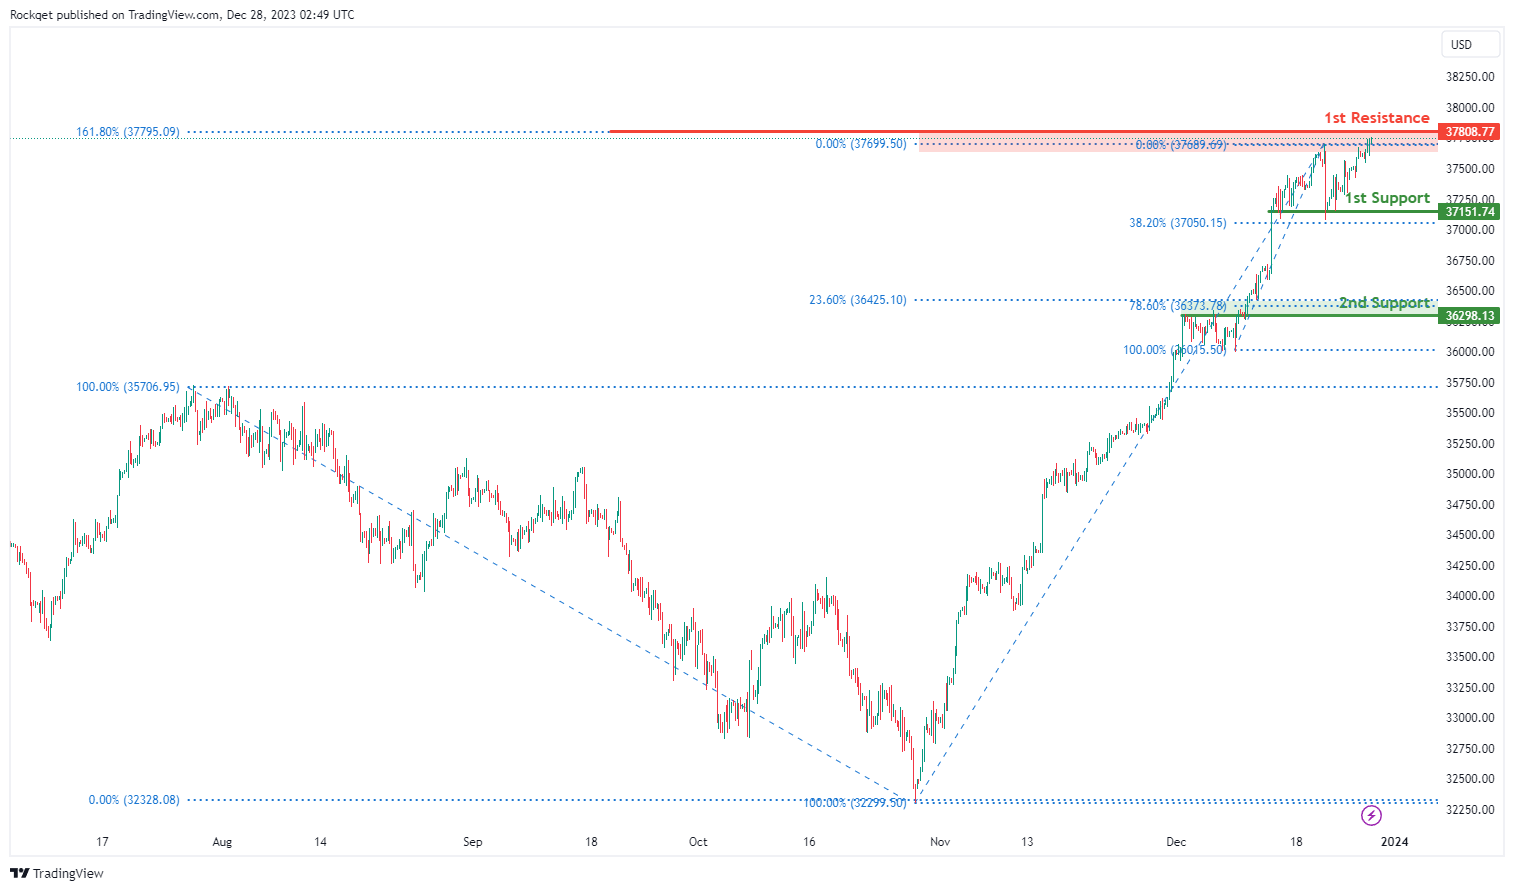
DJ30:
The DJ30 chart currently exhibits a bullish overall momentum, suggesting a potential scenario for a bullish continuation towards the 1st resistance.
The 1st support at 37151.74 is considered significant as it represents an overlap support and is associated with the 38.20% Fibonacci Retracement, indicating a historical area where buying interest has been present.
Additionally, the 2nd support at 36298.13 is identified as another overlap support and is associated with the 23.60% Fibonacci Retracement and the 78.60% Fibonacci Retracement, providing multiple layers of potential support for the index.
On the resistance side, the 1st resistance at 37808.77 is deemed significant as it is linked to the 161.80% Fibonacci Extension, indicating a level where selling interest could intensify.
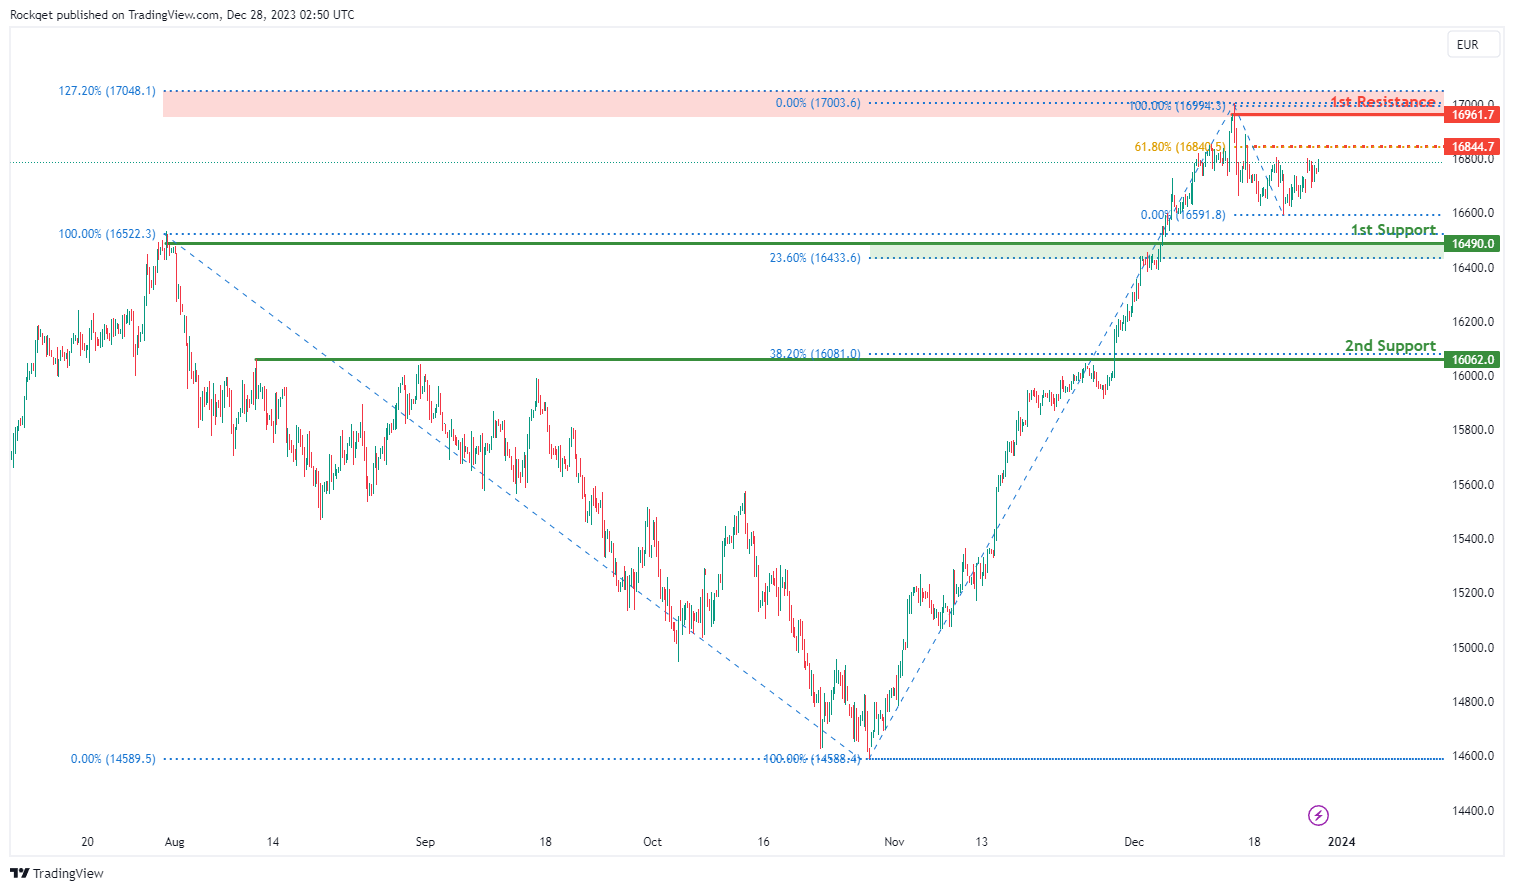
GER40:
The GER40 chart currently exhibits a bullish overall momentum, contributing to the potential for a bullish continuation towards the 1st resistance.
The 1st support at 16490.00 is considered significant as it represents an overlap support and is associated with the 23.60% Fibonacci Retracement, indicating a historical area where buying interest has been present.
Furthermore, the 2nd support at 16062.00 is identified as another significant level, characterized as a pullback support and associated with the 38.20% Fibonacci Retracement, providing additional layers of potential support for the index.
On the resistance side, the 1st resistance at 16961.70 is considered significant as it is linked to a swing high resistance and the 127.20% Fibonacci Extension, indicating a level where selling interest could intensify.
Additionally, the intermediate resistance at 16844.70 is associated with a pullback resistance and the 61.80% Fibonacci Retracement, adding an extra layer of potential resistance for the index.
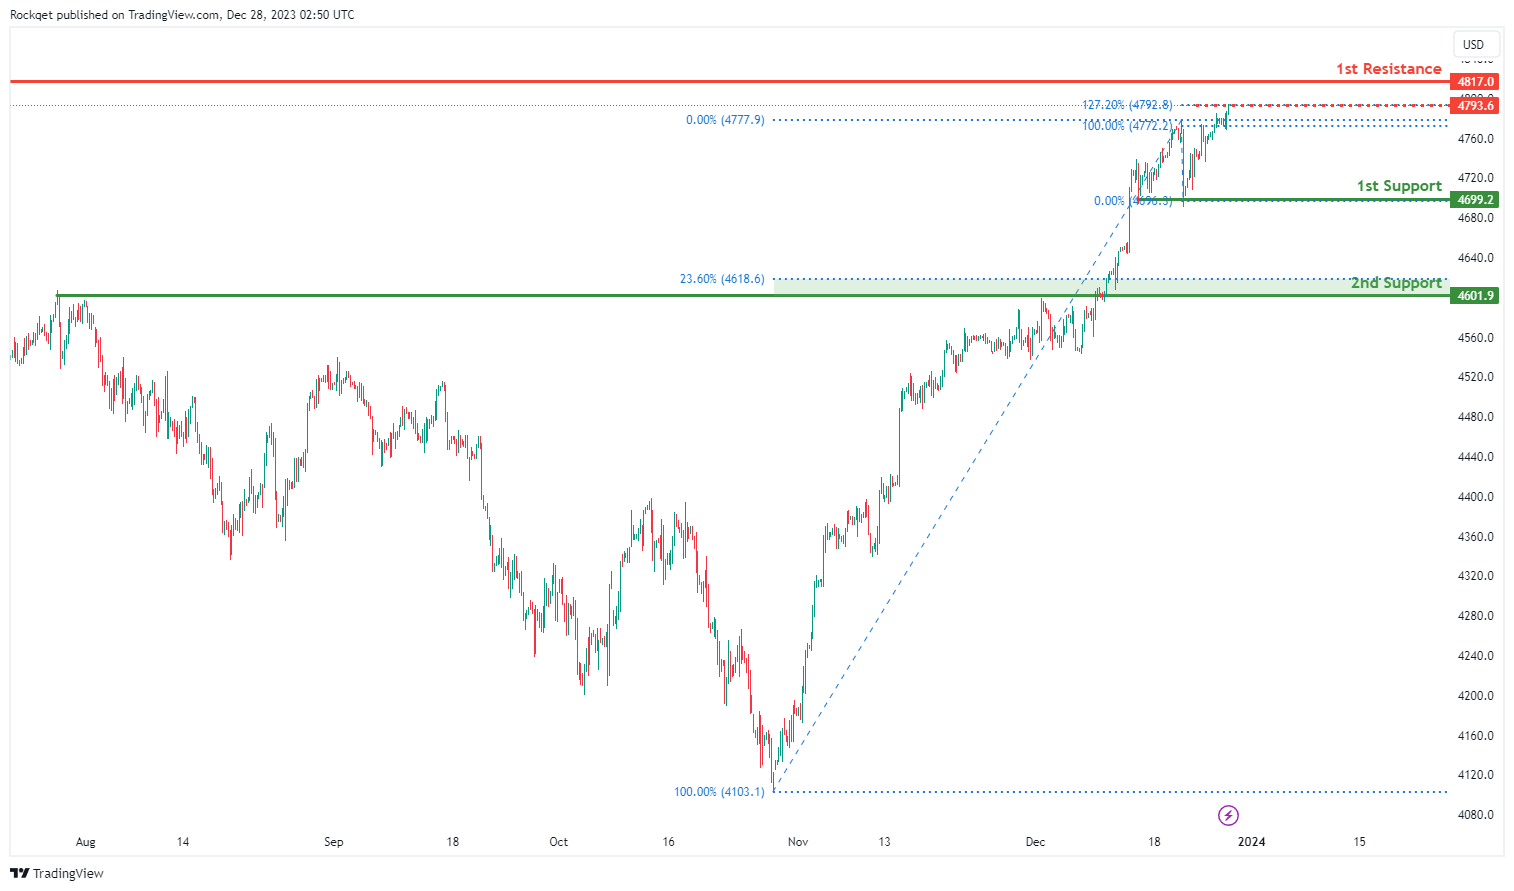
US500:
The US500 chart currently maintains a bullish overall momentum, driven by several factors. For potential upward movement, the chart could make a bullish continuation towards the 1st resistance.
The 1st support is a multi-swing low at 4699.2, signifying a historical area where buying interest has been prevalent.
Additionally, the 2nd support at 4601.9 is deemed significant as it represents an overlap support and is associated with the 23.60% Fibonacci Retracement, providing added support.
The intermediate resistance at 4793.6 is considered noteworthy, linked to the 127.20% Fibonacci Extension, indicating a level where selling interest may intensify.
Furthermore, the 2nd resistance at 4817.0 is associated with a swing high resistance, adding another layer of potential resistance for the index.
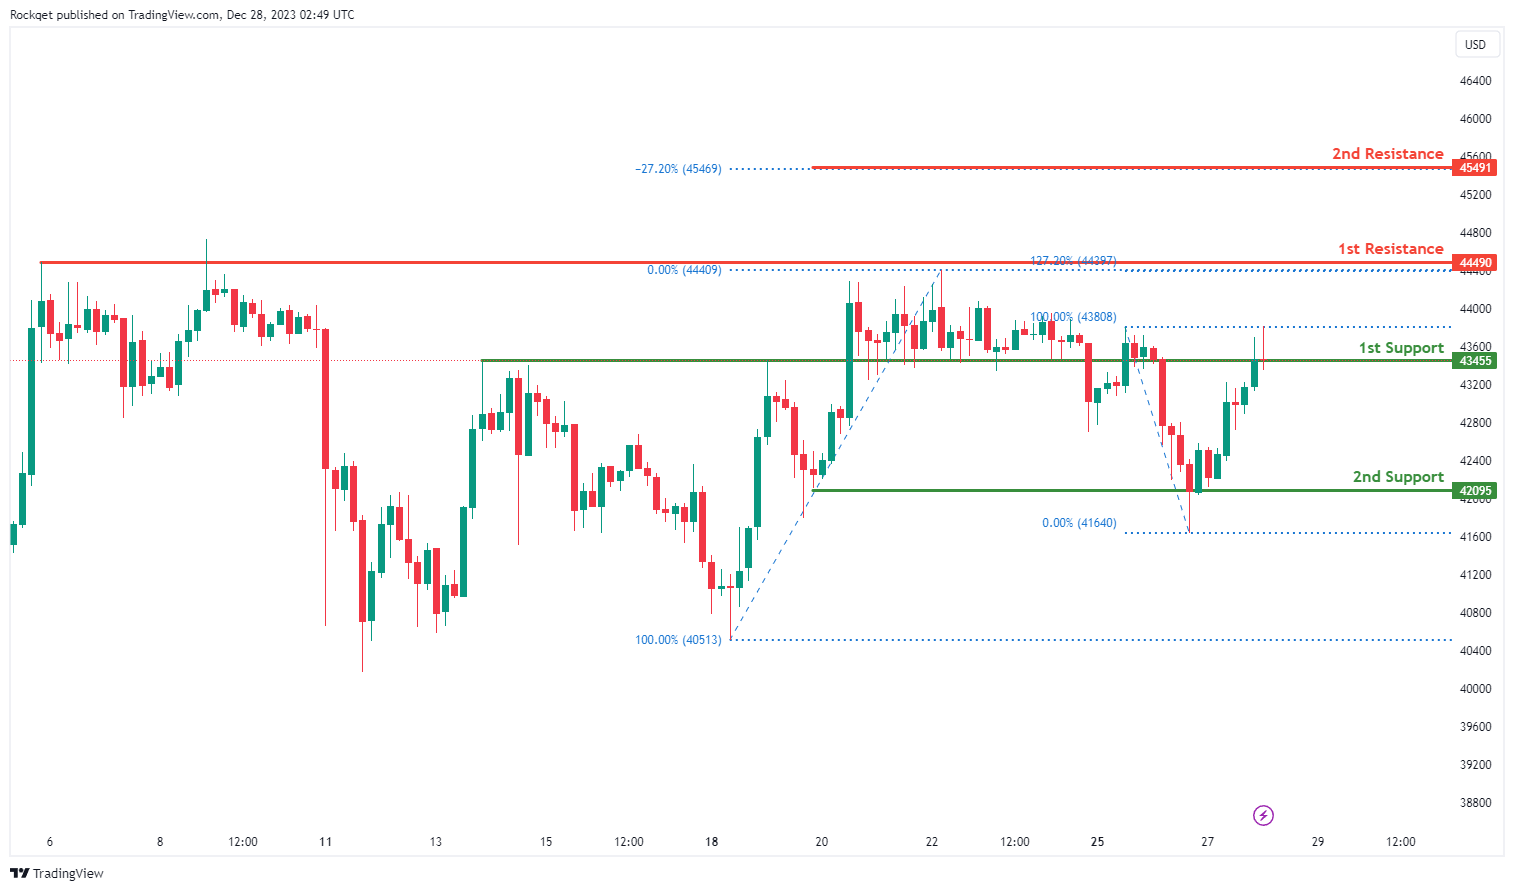
BTC/USD:
The BTC/USD chart exhibits a bullish overall momentum, and there’s potential for a bullish bounce off the 1st support, signaling a move towards the 1st resistance.
The 1st support at 43455 is considered significant as it represents an overlap support, indicating a historical area where buying interest has been present.
Additionally, the 2nd support at 42095 is identified as a pullback support, providing an additional layer of potential support for the cryptocurrency.
On the resistance side, the 1st resistance at 44490 is linked to a swing high resistance, representing a level where selling interest could intensify.
Furthermore, the 2nd resistance at 45491 is associated with a -27% Fibonacci Expansion, adding another layer of potential resistance for BTC/USD.
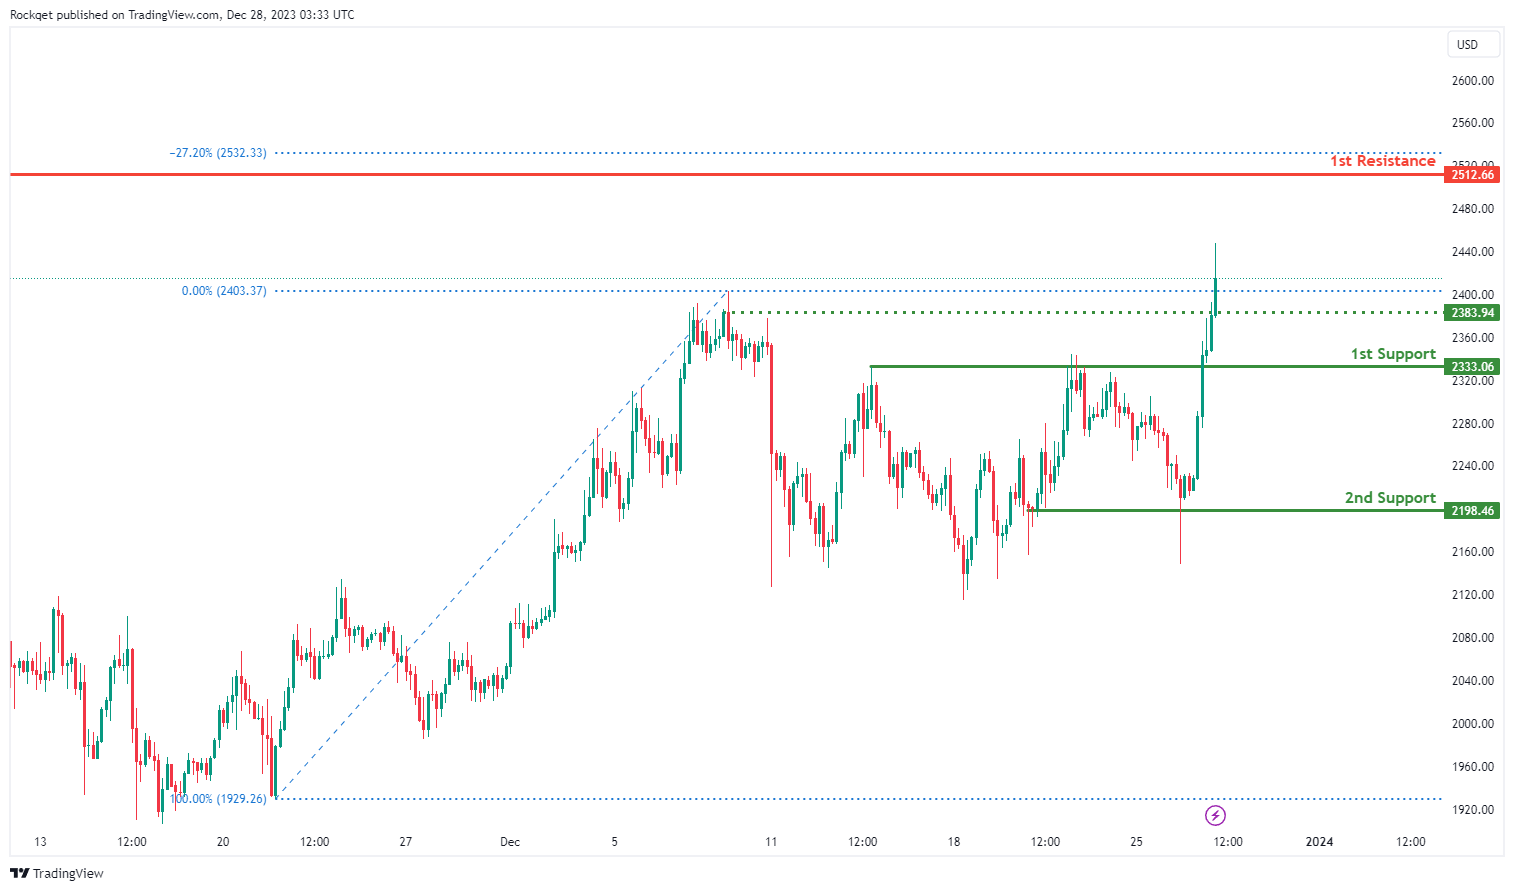
ETH/USD:
The ETH/USD chart demonstrates a bullish overall momentum, suggesting a potential for a bullish continuation towards the 1st resistance.
The 1st support at 2333.06 is considered significant as it represents a pullback support, indicating a historical area where buying interest has been present.
Additionally, the 2nd support at 2198.46 is identified as another pullback support, providing an additional layer of potential support for the cryptocurrency.
On the resistance side, the 1st resistance at 2512.66 is linked to a swing high resistance, representing a level where selling interest could intensify.
Furthermore, the intermediate support at 2383.94 is associated with an overlap support, adding another layer of potential support for ETH/USD.
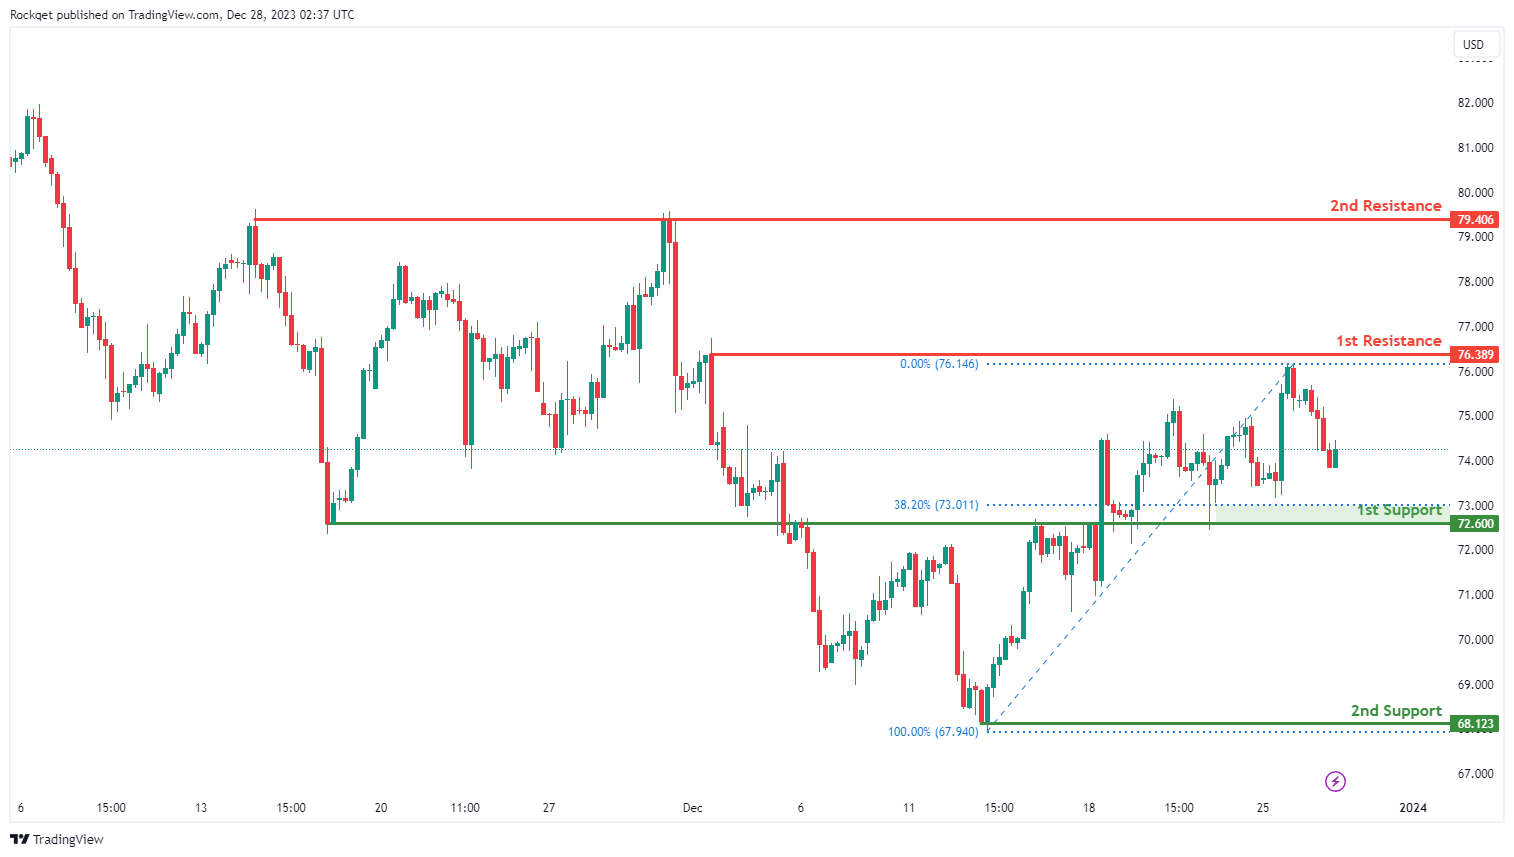
WTI/USD:
The WTI chart currently exhibits an overall bullish momentum, suggesting a prevailing uptrend. However, there is a potential scenario for price to fall towards the 1st support before resuming the uptrend.
The 1st support level at 72.60 is identified as an overlap support that aligns close to the 38.20% Fibonacci retracement level. Further below, the 2nd support level at 68.12 is marked as a swing-low support, reinforcing its importance as a key support level.
To the upside, the 1st resistance level at 76.38 is identified as a pullback resistance. Higher up, the 2nd resistance level at 79.40 is noted as a multi-swing-high resistance, further indicating its potential significance as a barrier for further upward movement.
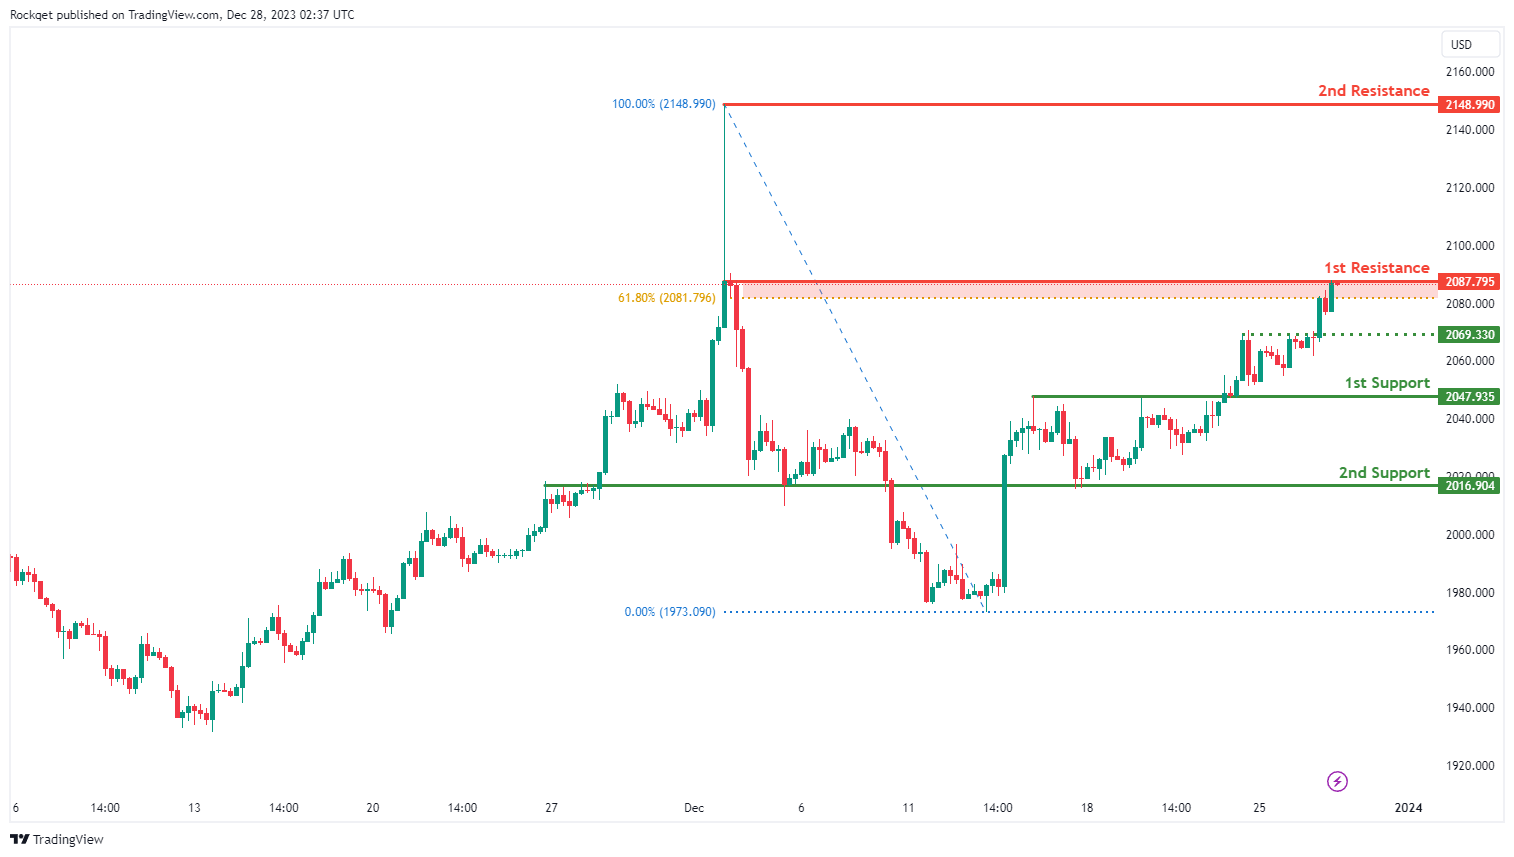
XAU/USD (GOLD):
The XAU/USD chart currently demonstrates a bullish momentum, indicating a potential for price to break above the 1st resistance and make a bullish continuation towards the 2nd resistance.
The 1st resistance level at 2,087.79 is identified as a pullback resistance that aligns close to the 61.80% Fibonacci retracement level. Higher up, the 2nd resistance level at 2,148.99 is marked as a swing-high resistance, further indicating its potential significance as a barrier for further upward movement.
To the downside, the intermediate support level at 2,069.33 is identified as an overlap support while the 1st support level at 2,047.93 is also marked as an overlap support. Further below, the 2nd support level at 2,016.90 is also noted as an overlap support, reinforcing its importance as a key support level.
Japan’s industrial production down -0.9% mom, continues to seesaw indecisively
Japan's industrial production fell -0.9% mom in November, marking the first decrease in three months. This drop, however, was less severe than the expected -1.6% mom decline. A notable factor in the contraction was -2.5% mom fall in motor vehicle production. Among the 15 sectors surveyed, 11 reported decreased production, while four sectors experienced increases.
Index of industrial shipments also dropped by -1.3% mom, aligning with overall decline in industrial production. Conversely, Index of inventories saw a marginal increase of 0.1% mom.
The Ministry of Economy, Trade and Industry maintained its assessment of industrial output as "fluctuating indecisively." Looking ahead, manufacturers expect a rebound in output by 6.0% mom in December, followed by -7.2% mom decrease in January 2023.
An METI official said, "We'll continue to monitor the impact of the global economic downturn and rising prices".
In separate release, retail sales data painted a more positive picture. Sales in November rose 5.3% yoy, exceeding forecast of 5.0% yoy, and marked the 21st consecutive month of expansion since March 2022. On a month-on-month basis, retail sales grew 1.0%, following 1.7% growth in October.