Sample Category Title
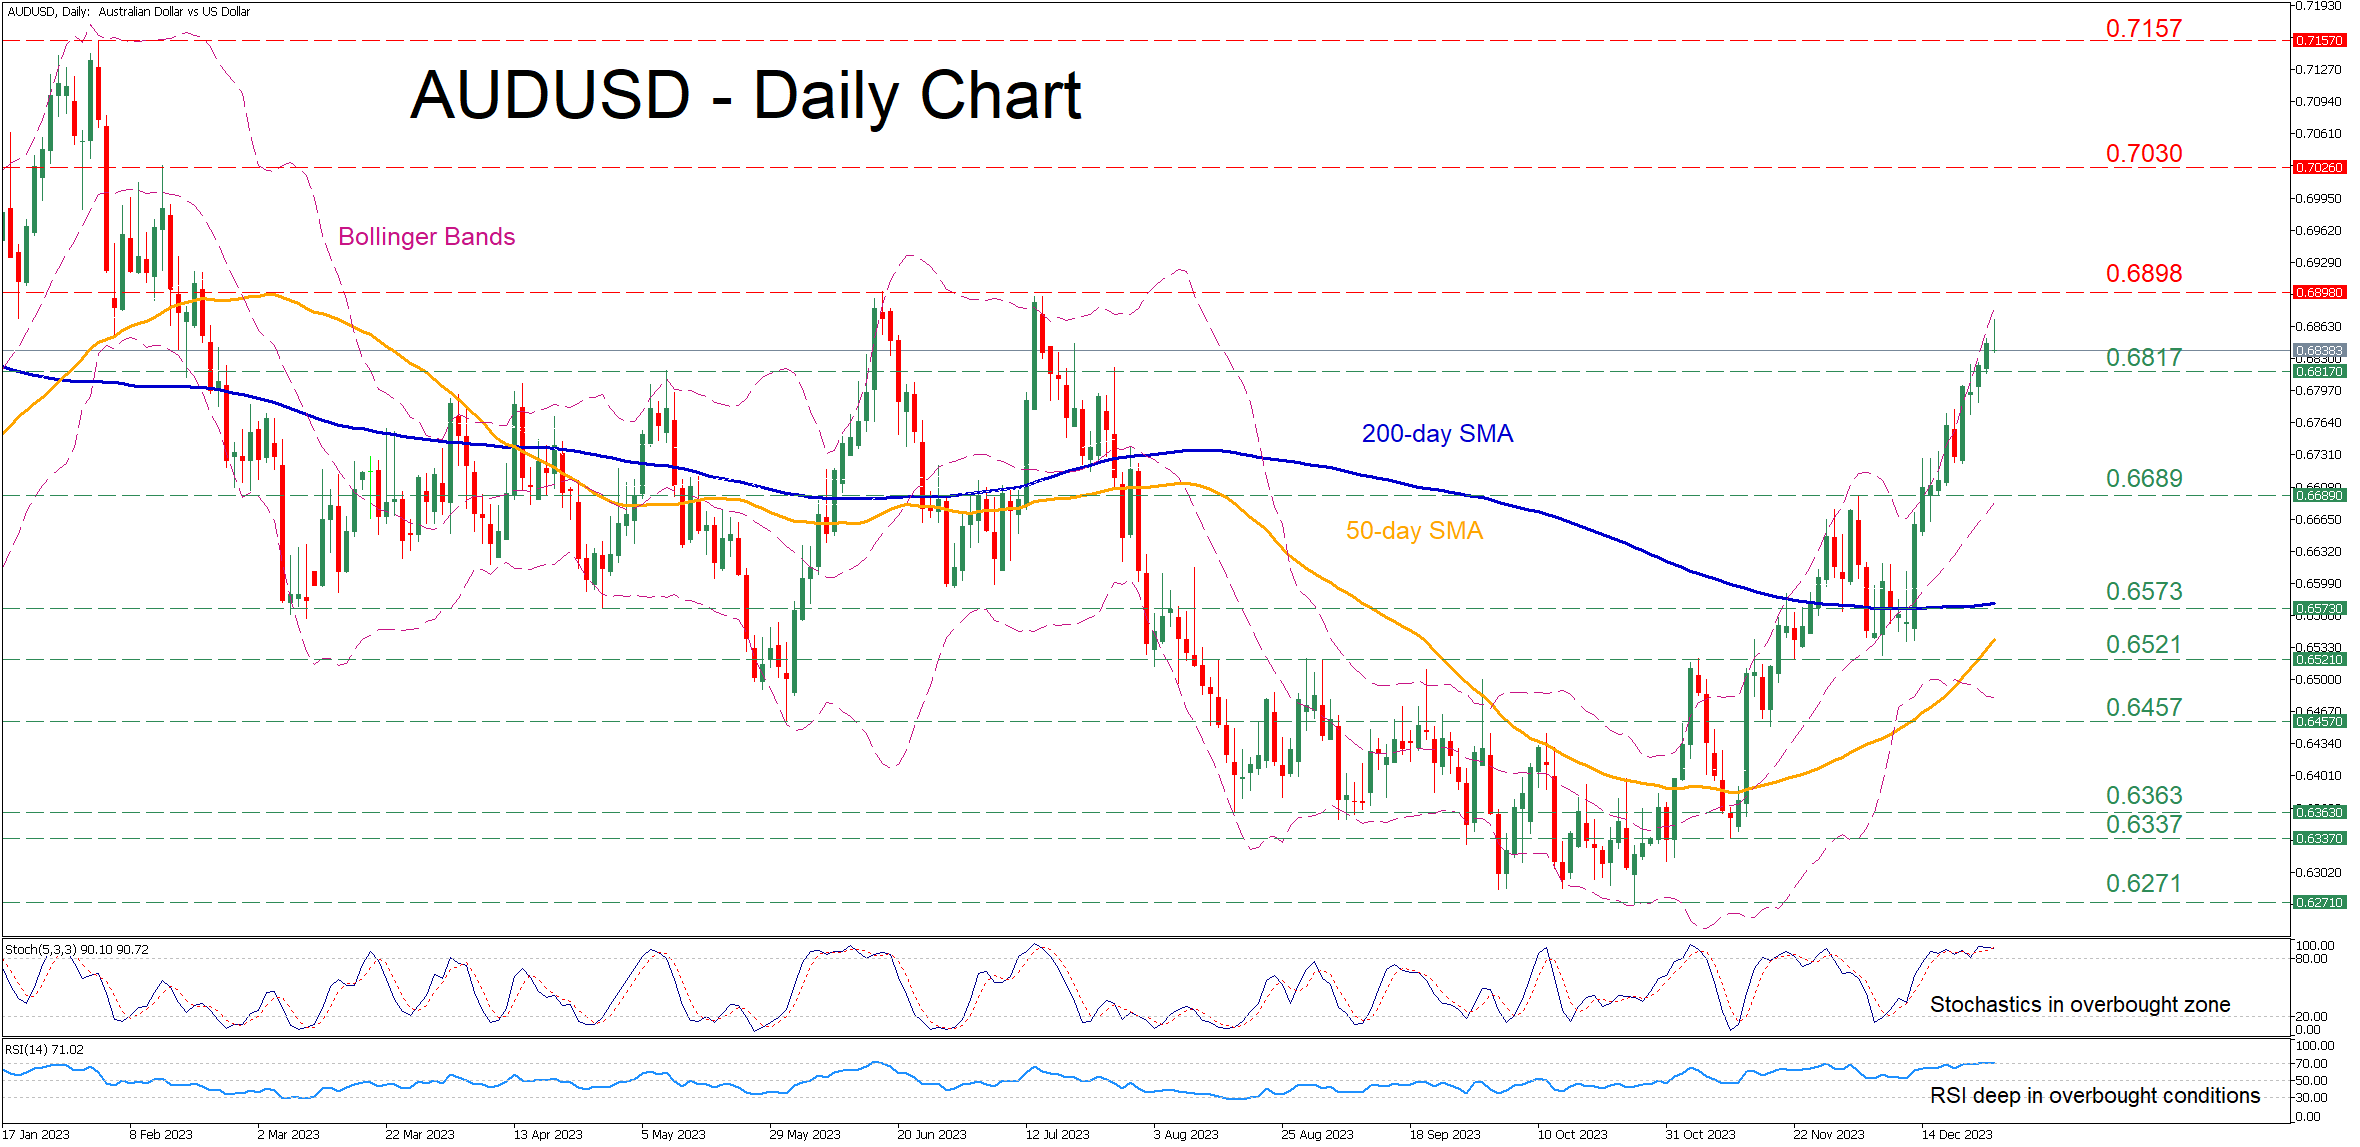
AUDUSD Extends Recovery; Crucial Double Top in Sight
- AUDUSD hits a fresh five-month peak on Thursday
- But oscillators have been in overbought levels for several sessions
- Can the rally resume or are we heading for a pullback?
AUDUSD has been staging a solid recovery following its 2023 bottom of 0.6271 in October, generating a clear structure of consecutive higher highs. However, the risk of an impending correction is more than evident as both the RSI and stochastics have been within their overbought areas for the past few sessions.
If the pair manages to resume its short-term uptrend, immediate resistance could be found at the double top of 0.6898 registered this summer. Jumping above that zone, the price might encounter strong resistance at 0.7030. Should that barricade also fail, the spotlight could turn to the 2023 peak of 0.7157.
On the flipside, in case of a pullback, the previous resistance of 0.6817 could now serve as initial support. A violation of that territory could open the door for the 0.6689 hurdle. Further retreats might then cease at the April support of 0.6573, which overlaps with the 200-day simple moving average (SMA).
Overall, AUDUSD has been in a recovery mode for the past few months, but the short-term oscillators are starting to warn of an overstretched advance. Meanwhile, the ascending 50-day SMA is closing the gap with the 200-day SMA, where a potential golden cross could add more fuel to the short-term rally.
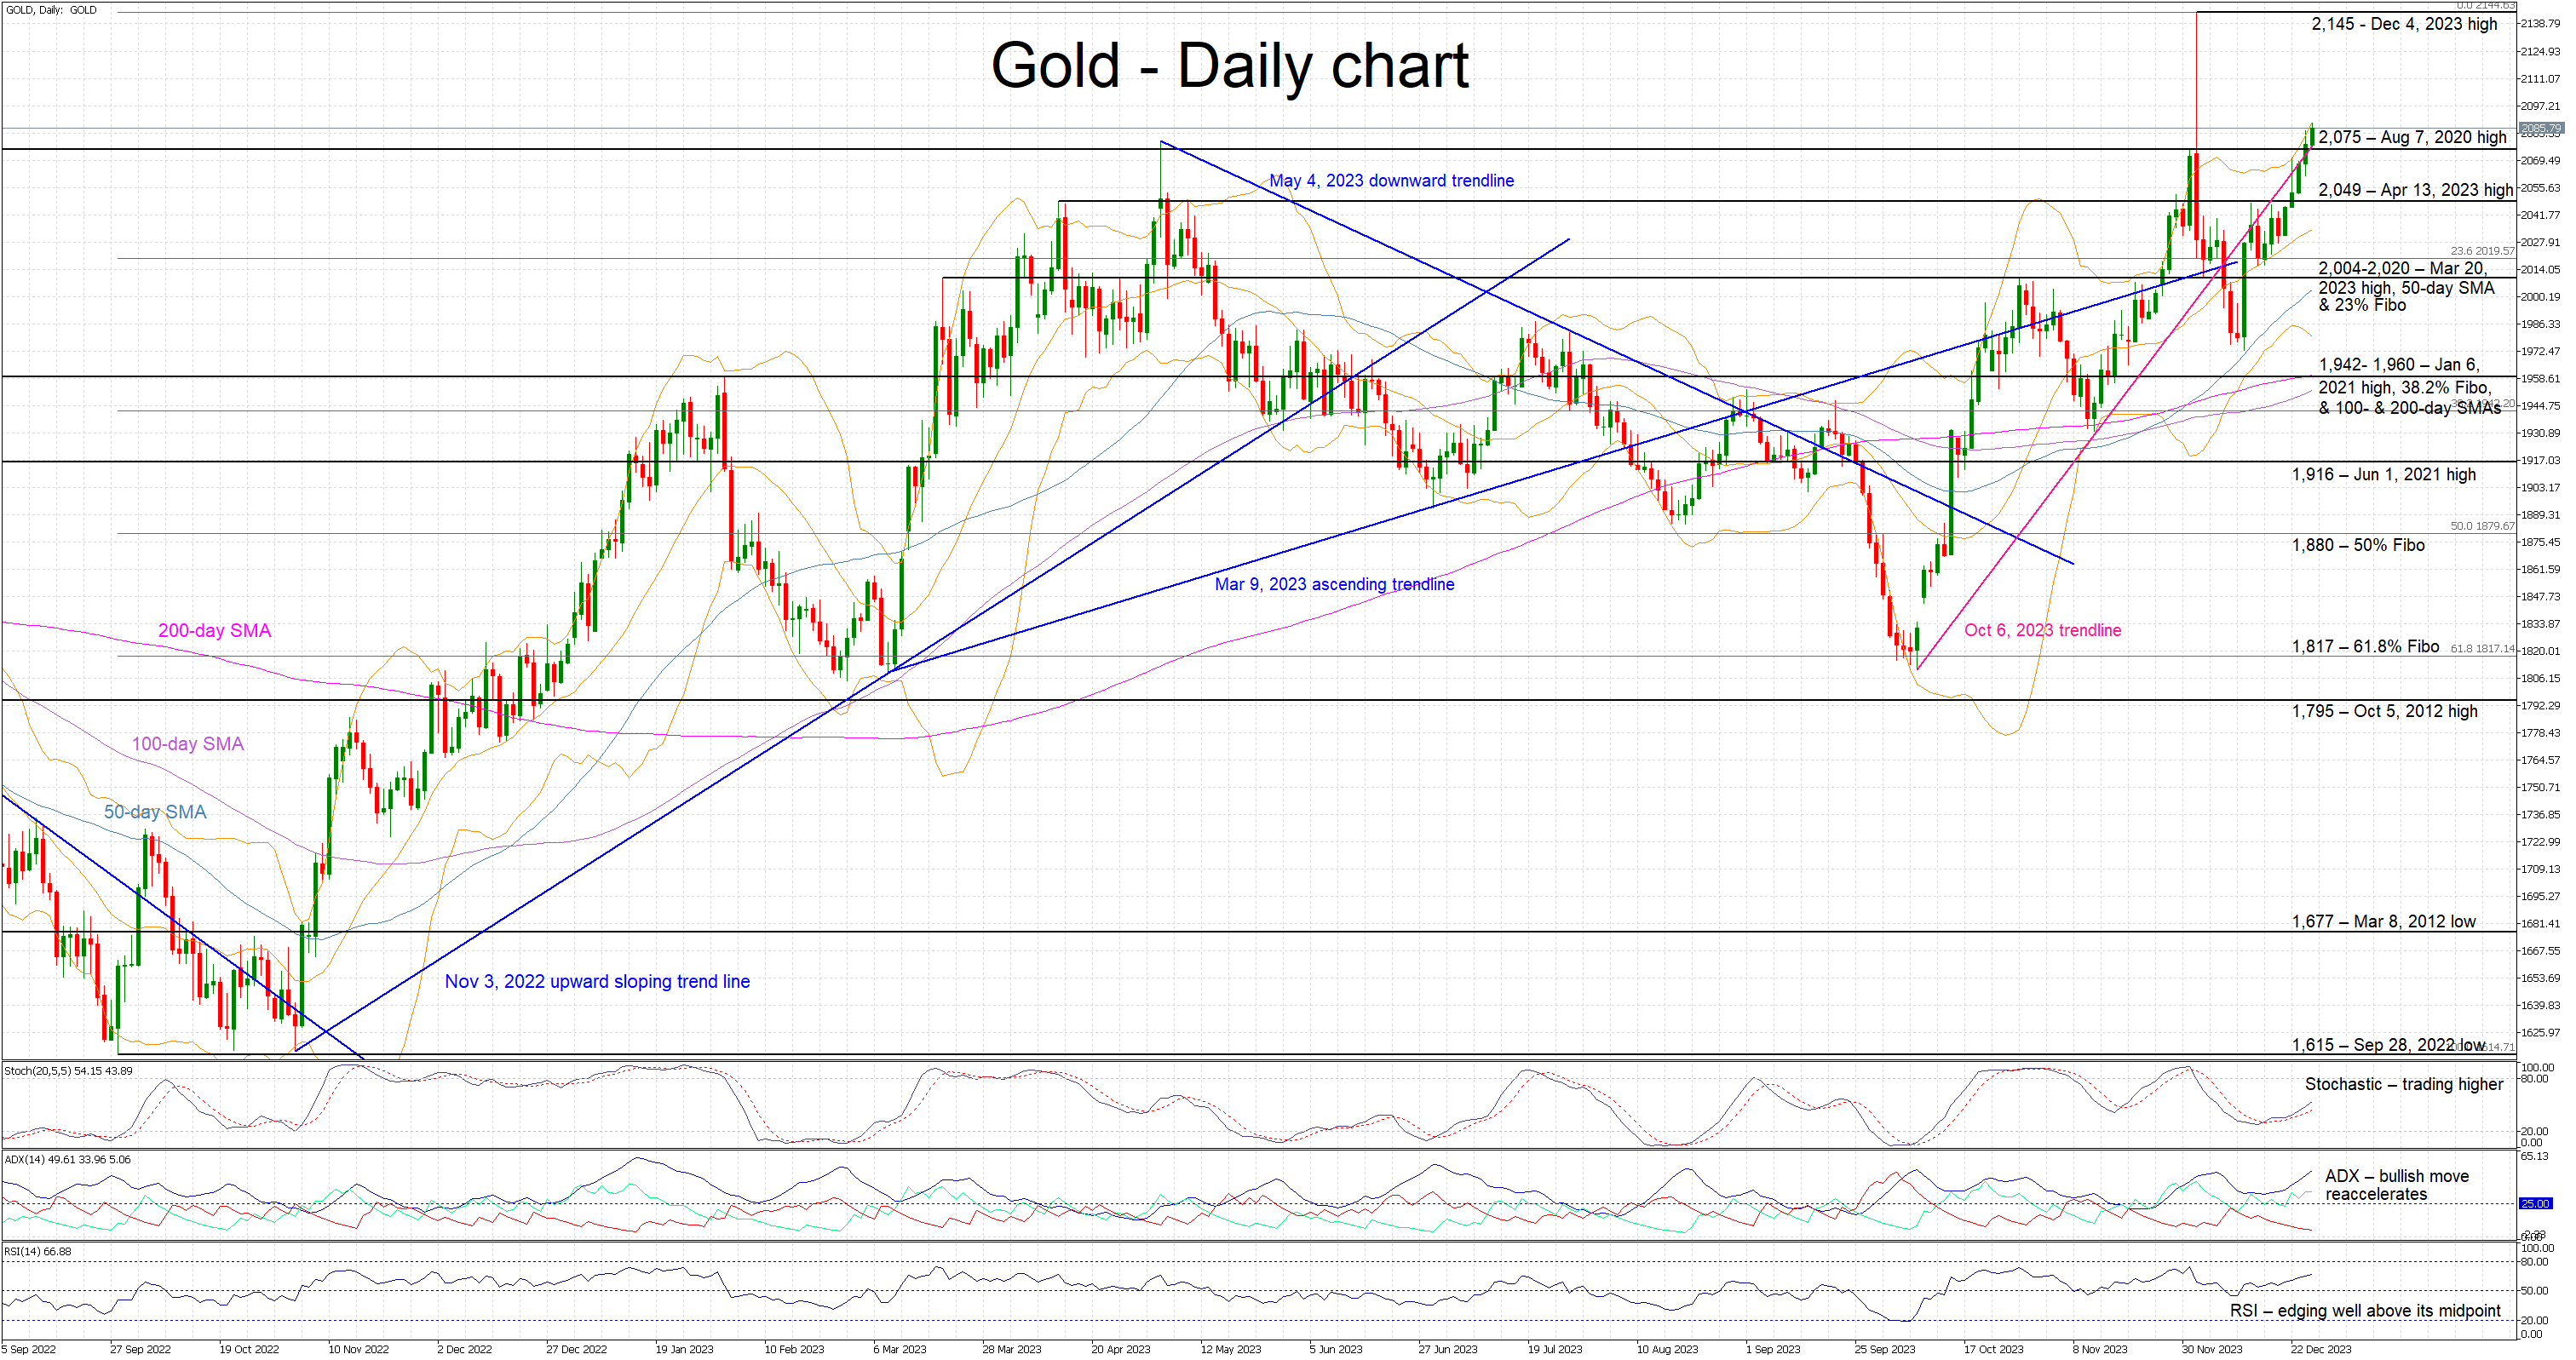
Gold Enjoys Another Rally
- Gold edges higher, surpasses 2,075 level
- Festive period fueling gold rally amidst low liquidity
- Momentum indicators support the current move
Gold is trading higher again today, recording the fifth consecutive green candle, as the low-liquidity festive period appears to be fueling demand for the precious metal. Gold is currently around 6% higher than the December 13 trough as it managed to surpass the 2,075 level and has returned above the October 6, 2023 trendline, after spending almost 20 days below it.
In the meantime, the momentum indicators are endorsing the current move higher. The RSI is rising towards its November highs, signaling an increasing bullish tendency in the market. Similarly, the Average Directional Movement Index (ADX) has made a higher high, confirming the strong bullish trend in gold. More importantly, the stochastic oscillator has crossed above its moving average (MA) and it is moving aggressively towards its overbought territory.
Should the bulls remain hungry, they could try to keep gold above the August 7, 2020 high of 2,075 and they then gradually stage a move, which might not be as straightforward as it sounds, towards the all-time high of 2,145.
On the flip side, the bears are keen to put a stop to the current upleg. They could try to defend the 2,075 level and then have a go at breaking below the April 13, 2023 high at 2,049. If successful, they could then push gold towards the busier 2,004-2,020, which is populated by the March 20, 2023 high, the 50-day simple moving average (SMA) and the 23.6% Fibonacci retracement of September 28, 2022 – December 4, 2023 uptrend.
To sum up, gold bulls remain in control of the market amidst a low liquidity period with the bears appearing unable, up to now, to react to the consecutive green candles.
ETH/USD Analysis: New Record of the Year
Today, the price of Ethereum exceeded the level of 2,440 per token, thereby setting a new high for 2023. It is noteworthy that the price of Bitcoin did not support the bullish sentiment, continuing to fluctuate around the USD 43,000 level for the fifth day.
What is the reason for the growth of ETH/USD from a fundamental point of view? There is no obvious trigger in the media, so we can only make assumptions:
→ market participants considered ETH an undervalued asset against the backdrop of the growth of Bitcoin and Solana;
→ perhaps buyers assume that after the expected approval of applications for the BTC ETF, the ETH ETF story will be next?
→ Santa's rally and the positive sentiment associated with it.
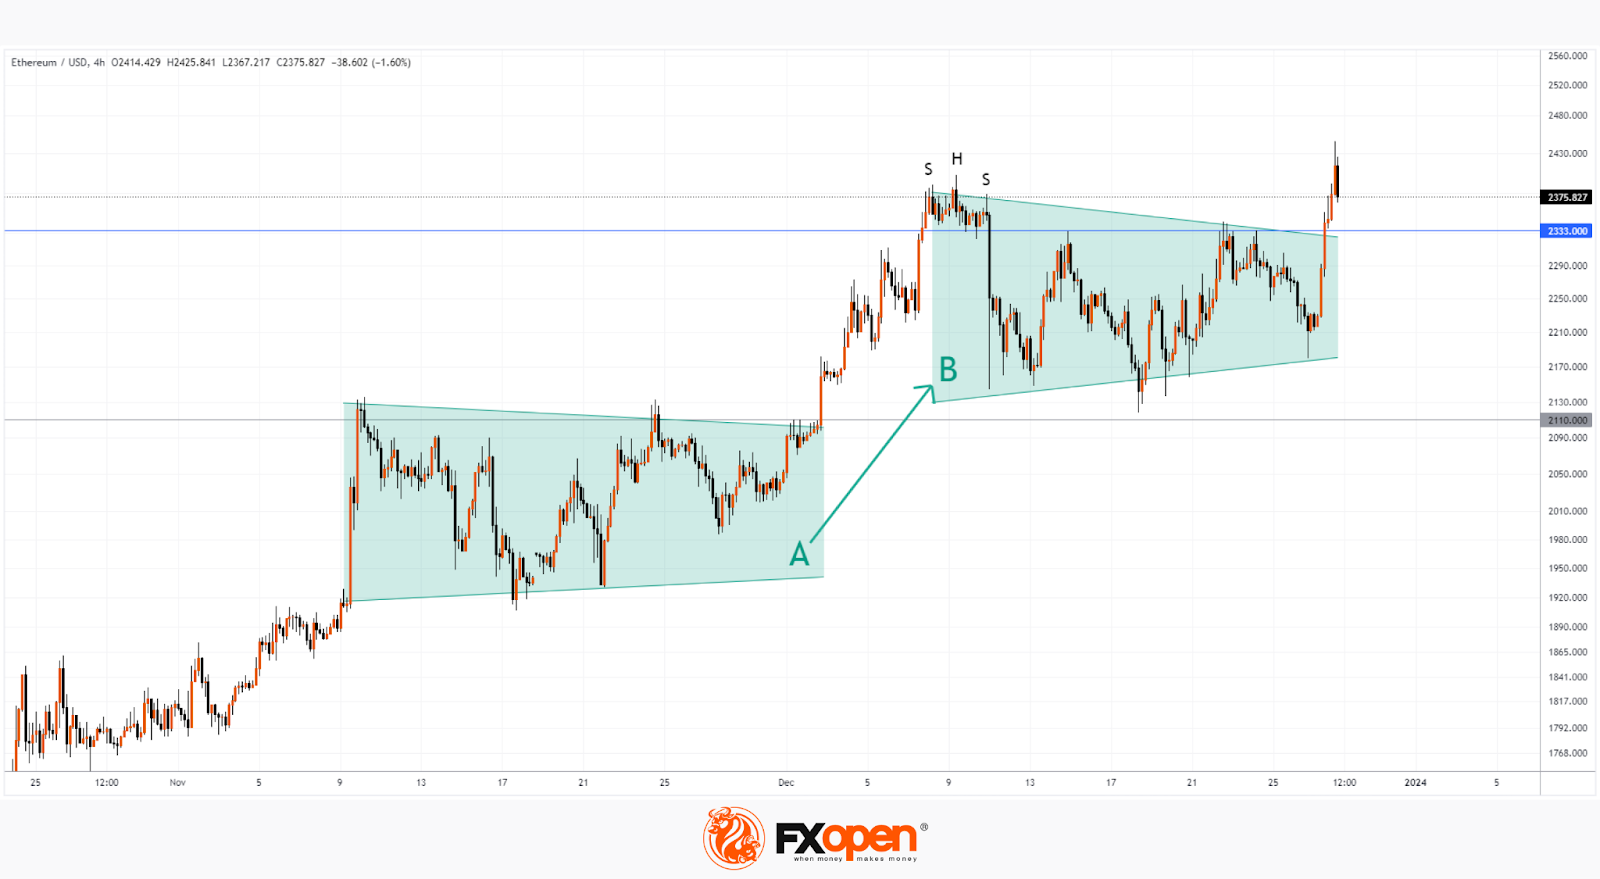
From a technical point of view, the price of ETH/USD moved up beyond the balance period “B”, where the forces of supply and demand were balanced. The bullish momentum was maintained, with upward momentum above the 2,333 level attracting followers and forcing short sellers to take losses. According to on-chain analytical platforms, in just one hour, at the peak of growth, USD 14 million of bearish positions were liquidated on cryptocurrency exchanges—there was a short squeeze in the market to some extent.
What's next? Will the price be able to form a new balance period “C”, which will be above the period “B” (similar to the trend “A” → “B”)?
This morning, on the 4-hour chart, a bearish engulfing pattern is forming, which may result in a false breakout of the previous top on December 9, when the SHS pattern was formed — this is not a very optimistic development of events.
However, as long as the price remains above the level of 2,333, there is reason to believe that the market is on the way to forming a balance “C”, which is above the balance “B” - similar to what happened with the level of 2,110. A bearish breakdown of the level of 2,333 and a return to the zone balance “B” will mean an alarming signal: buyers have lost strength, and therefore the next breakdown of balance “B” may occur in a downward direction.
This article represents the opinion of the Companies operating under the FXOpen brand only. It is not to be construed as an offer, solicitation, or recommendation with respect to products and services provided by the Companies operating under the FXOpen brand, nor is it to be considered financial advice.
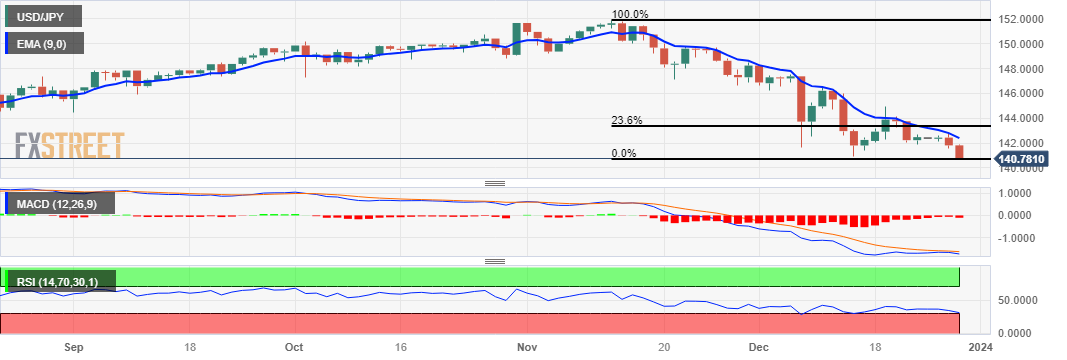
USD/JPY Price Analysis: Declines to five-month low, trades near 140.80
- USD/JPY moves below the 141.00 psychological level on the back of the subdued US Dollar.
- A firm break above the 142.00 level could lead the pair to reach a nine-day EMA at 142.41.
- Technical indicators suggest a bearish sentiment to test the major support at 140.50.
USD/JPY extends its losses as the US Dollar (USD) weakens on the back of the dovish Federal Reserve’s (Fed) outlook in the first quarter of 2024. The USD/JPY pair trades lower around 140.80 during the early European session on Thursday. The 141.00 psychological level emerges as the immediate resistance following the next barrier at the 142.00 level.
if there is a breakthrough above the psychological level, it may support the USD/JPY pair to reach the nine-day Exponential Moving Average (EMA) at 142.41, following the psychological resistance at the 143.00 level. If the pair successfully surpasses this level, the next barrier would be the 23.6% Fibonacci retracement level at 143.35.
The 14-day Relative Strength Index (RSI) below the 50 level indicates a weaker sentiment for the USD/JPY pair. Additionally, the Moving Average Convergence Divergence (MACD) line is positioned below the centerline and the signal line, signaling a bearish momentum in the market for the USD/JPY pair.
The bearish sentiment could potentially lead the USD/JPY pair towards the major support region around 140.50. If there is a decisive break below this level, it may open the door for the pair to test the psychological level at 140.00.
USD/JPY: Daily Chart
Pound Sterling Rallies on Improved Risk Appetite
- Pound Sterling advances above 1.2800 against the US Dollar on upbeat market sentiment.
- High inflation and recession fears in the UK may complicate the idea of BoE remaining a laggard in cutting rates.
- The economic calendar is light due to the festive season.
The Pound Sterling (GBP) prints a fresh four-month high as investors hope that the Bank of England (BoE) will maintain a restrictive monetary policy stance for a longer period than other Group of Seven economies. The GBP/USD pair has continued its four-day winning streak as the market mood is quite cheerful due to early rate cut expectations from the Federal Reserve (Fed).
BoE policymakers are expected to face enormous difficulties as price pressures in the United Kingdom are high and the economy is on the verge of a technical recession due to deteriorating demand in domestic and overseas markets. The BoE could be forced to turn dovish due to economic shrinkage.
Daily Digest Market Movers: Pound Sterling jumps higher while US Dollar tumbles
- Pound Sterling refreshes four-month high as the risk-appetite of the market participants continues to surge.
- The overall market mood remains upbeat as investors lean towards expectations of early rate cuts by the Federal Reserve.
- The Fed is expected to start lowering borrowing costs from March as price pressures in the United States economy are clearly in a downtrend.
- Action in the FX domain clearly indicates that markets are confident about early rate cuts by the Fed. The US Dollar continues to face pressure despite thin trading volume and empty economic docket.
- The Pound Sterling continues to enjoy higher demand as the Bank of England is expected to be laggard in the adaptation of a rate-cut mindset.
- The underlying inflation in the UK economy is highest in comparison with other Group of Seven economies, which would force BoE policymakers to remain leaned towards restrictive monetary policy stance.
- The UK core Consumer Price Index (CPI) has softened to 5.1% but is still more than double the required rate of 2% due to robust wage growth.
- This would allow BoE policymakers to stick with a restrictive monetary policy stance for a longer period.
- Meanwhile, expectations of a technical recession in the UK economy have deepened after the Office for National Statistics (ONS) revised in a slight contraction in Q3 Gross Domestic Product (GDP) by 0.1%, escalating the need for early rate cut discussions.
- Chances for unwinding of BoE’s tight monetary policy stance would escalate if the UK economy shrinks in the last quarter of 2024.
- The BoE reported in its latest projections that the economy would remain stagnant in the last quarter.
- UK Finance Minister Jeremy Hunt said last week there is a reasonable chance that if we stick to the course, the administration would be able to bring inflation down and the central bank would start cutting interest rates.
- This week, the economic calendar is light. Therefore, investors will focus on the weekly Initial Jobless Claims data for the week ending December 22, which will be published at 13:30 GMT.
- As per the consensus, individuals claiming jobless benefits are forecast to be higher at 210K from the former reading of 205K.
Technical Analysis: Pound Sterling aims for stability above 1.2800
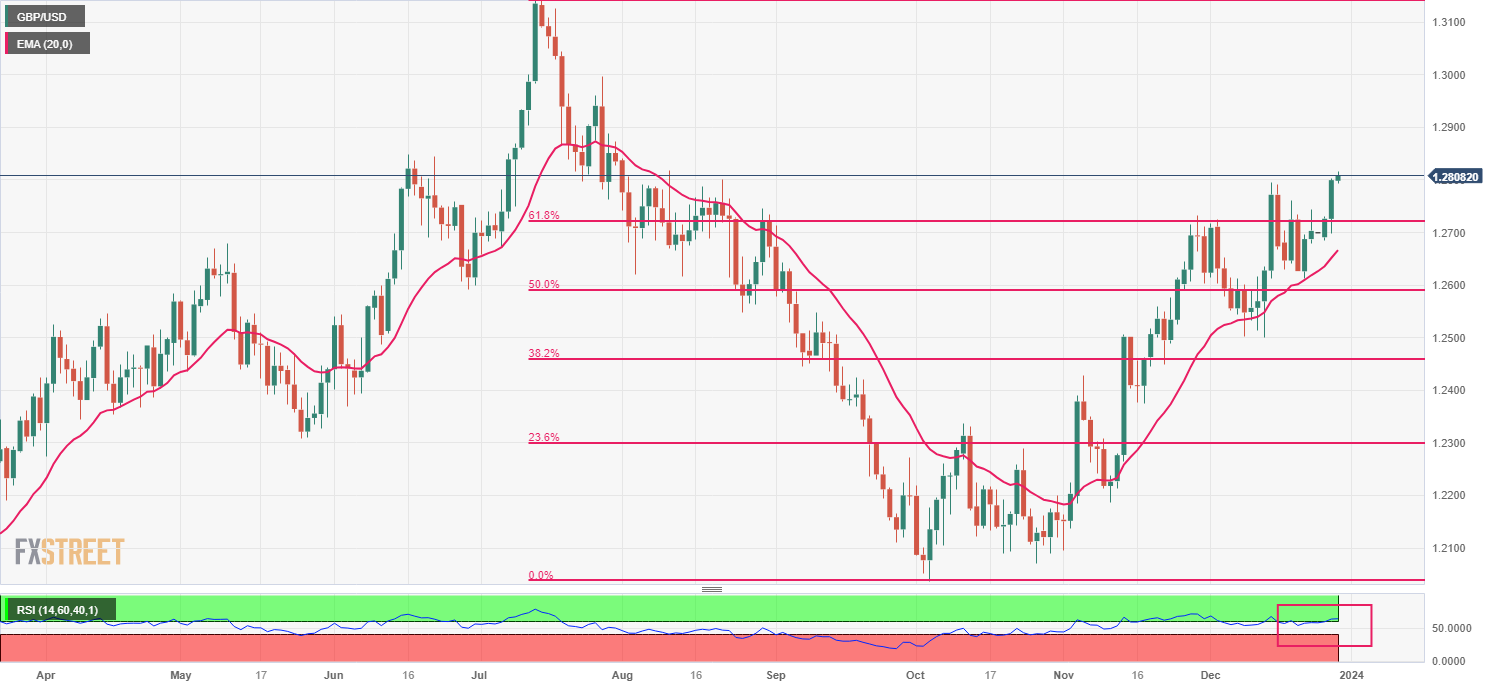
Pound Sterling climbs slightly above the round-level resistance of 1.2800, being supported by cheerful market mood. The Cable aims stability above the 61.8% Fibonacci retracement (plotted from July 14 high at 1.3142 to October 4 low at 1.2037) at 1.2740. The upward-sloping 20-day Exponential Moving Average (EMA) at 1.2670 continues to support the Pound Sterling bulls.
The Relative Strength Index (RSI) (14) has climbed above 60. Sustainability above aforementioned levels would trigger a bullish momentum.
Rally in Stocks and the Selloff in US Dollar Looks Overstretched
The US bond and stocks extended their rally on the back of soft US economic data and another strong US bond auction. The US dollar fell sharply against most majors, allowing the euro, sterling, and the yen to extend gains into the year end. The rally in the sovereign space looks overdone, hence the rally in stocks and the selloff in US dollar looks overstretched; there is a rising risk of a wild correction when the euphoria comes to an end.
The stock and bond rally continues
Wednesday was yet another day of joy and euphoria for the Federal Reserve (Fed) doves, and another day of selloff for the US dollar. This week’s economic calendar is not heavy, but the little data feeds the Fed doves successfully, I should admit. Released yesterday, the Richmond Manufacturing index came in much softer than expected – hinting at a significantly faster slowdown in economic activity in December, shipments also contracted significantly compared to a year ago. The slowing activity fueled the Fed doves along with another strong US bond auction on Wednesday that followed other strong bond auctions the day before. The US 5-year paper saw a bumper demand, as investors continued to pile in to secure good deals at the current yields based on the expectation that the yields will further crumble when the Fed starts chopping the rates. As such, the US 5-year yields fell to 3.80%,the 2-year yield sank to 4.23%, and the 10-year yield tipped a toe below the 3.80% level. Isn’t it marvelous? Well, yes, it is, especially for the rate-sensitive technology stocks. The Nasdaq 100 renewed record yesterday, whereas the S&P500 was trading just 0.3% below its own ATH level, yet couldn’t yet declare a fresh record – I am confident that it will come.
In the FX, the US dollar was hit hard by the accelerated fall in the sovereign yields. The dollar index sank below 101 on the back of yet another sharp fall in the US yields. The broad-based selloff in the USD propelled the EURUSD past the 1.11 mark. Cable jumped above the 1.28 level, the USDJPY eased to 141.
Overdone
The US has recorded the biggest two-month easing in financial conditions in its history because of the impressive US sovereign rally on rising Fed rate cut expectations. It appears that the latest easing in the US financial conditions has been more powerful than the ones observed following the announcements of the Quantitative Easing programs from the Fed. And the rapidly loosening financial conditions are hardly compatible with a sustainably low inflation… even less so as the geopolitical tensions started to disrupt global trade ways in a way that could be inflationary.
One good news is oil’s inability to ensure a sustained price rise. The barrel of US crude snapped back below the $74pb after testing the $76pb on rising Red Sea tensions.
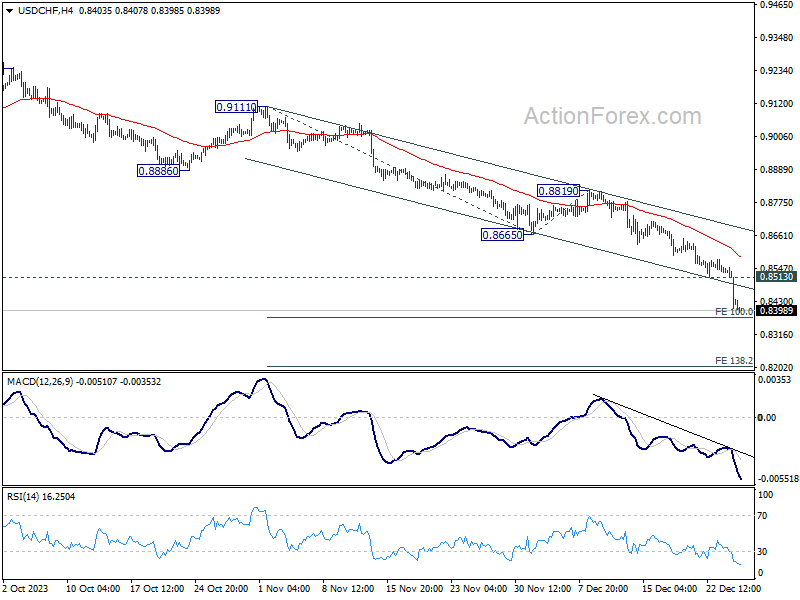
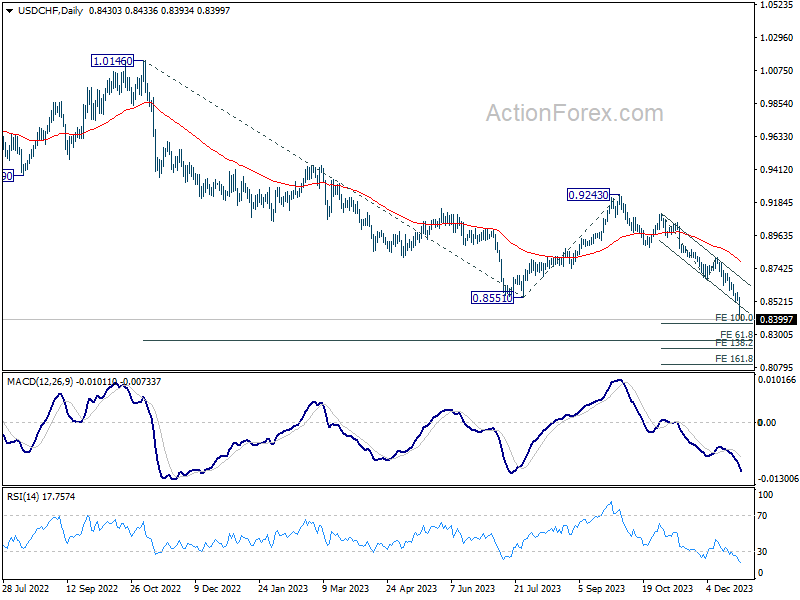
USD/CHF Daily Outlook
Daily Pivots: (S1) 0.8377; (P) 0.8463; (R1) 0.8517; More....
USD/CHF's decline accelerates lower and intraday bias stays on the downside. Sustained break of 100% projection of 0.9111 to 0.8665 from 0.8819 at 0.8373 will pave the way to 138.2% projection at 0.8203. On the upside, above 0.8513 minor resistance will turn intraday bias neutral first. But outlook will stay bearish as long as 0.8665 support turned resistance holds, in case of recovery.
In the bigger picture, break of 0.8551 support indicates resumption of whole decline from 1.0146 (2022 high). Next target is 61.8% retracement of 1.0146 to 0.8551 from 0.9243 at 0.8257. Sustained break there could prompt downside acceleration to 100% projection at 0.7648. This will now remain the favored case as long as 0.8819 resistance holds.
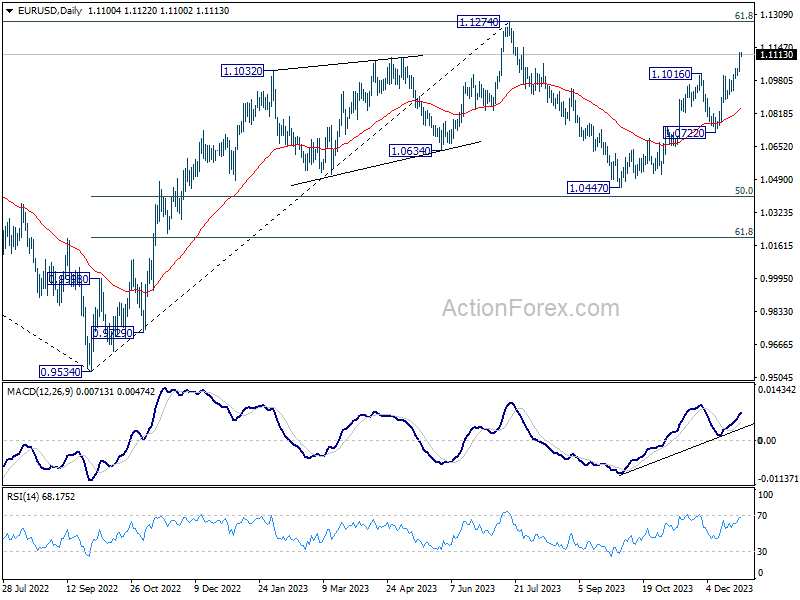
EUR/USD Daily Outlook
Daily Pivots: (S1) 1.1050; (P) 1.1086; (R1) 1.1144; More...
Intraday bias in EUR/USD remains on the upside at this point. Current rally from 1.0447 is in progress for retesting 1.1274 high. Strong resistance should be seen from there to limit upside, at least on first attempt. On the downside, below 1.1027 minor support will turn intraday bias neutral first. But further rally will remain in favor as long as 1.0722 support holds, in case of retreat.
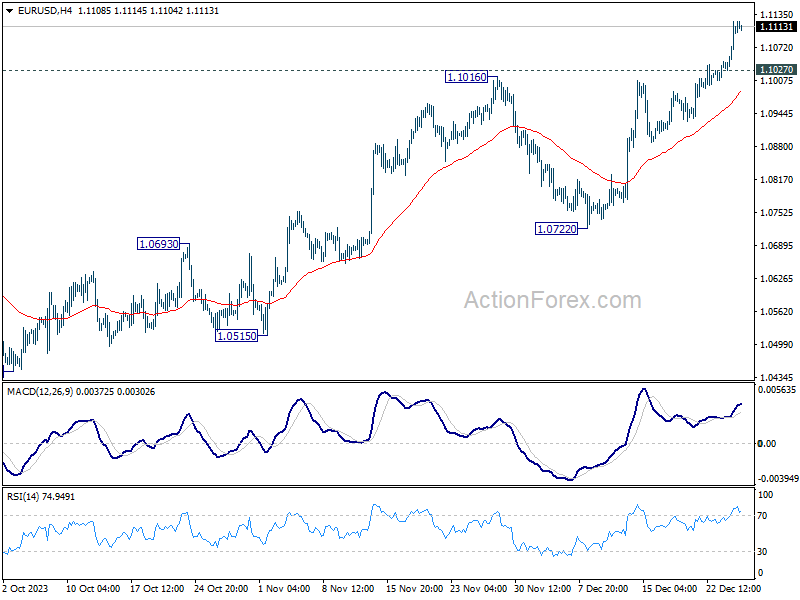
In the bigger picture, price actions from 1.1274 are viewed as a corrective pattern to rise from 0.9534 (2022 low). Rise from 1.0447 is seen as the second leg. While further rally could cannot be ruled out, upside should be limited by 1.1274 to bring the third leg of the pattern. Meanwhile, sustained break of 1.0722 support will argue that the third leg has already started for 1.0447 and below.
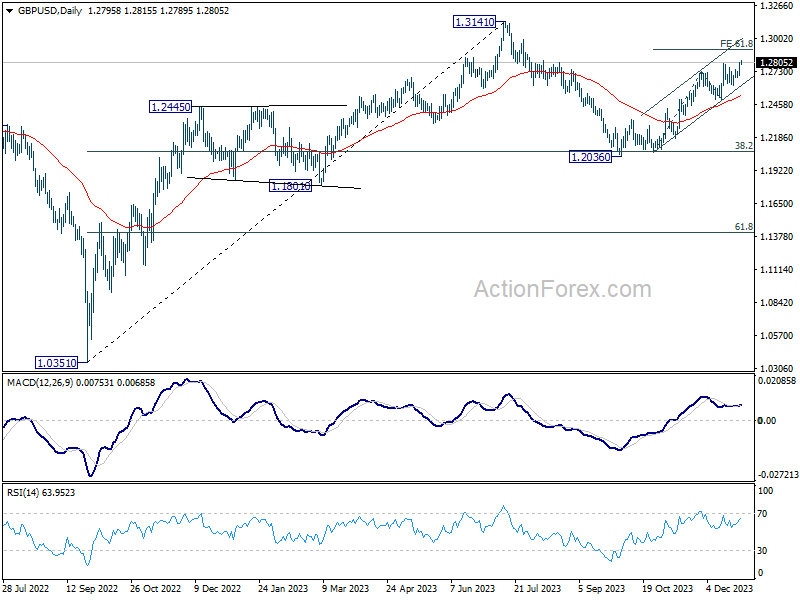
GBP/USD Daily Outlook
Daily Pivots: (S1) 1.2731; (P) 1.2767; (R1) 1.2835; More...
GBP/USD's rally from 1.2036 resumed by breaking through 1.2793 resistance. Intraday bias is back on the upside. Next target is 61.8% projection of 1.2068 to 1.2731 from 1.2499 at 1.2909. On the downside, below 1.2698 minor support will turn intraday bias neutral again. But further rally will remain in favor as long as 1.2499 support holds, in case of retreat.
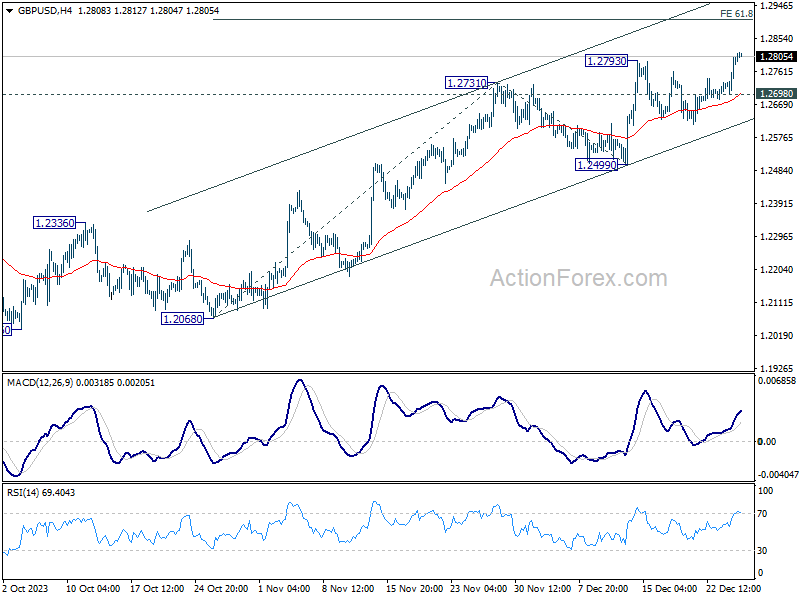
In the bigger picture, price actions from 1.3141 medium term top are seen as a corrective pattern to rise from 1.0351 (2022 low). Rise from 1.2036 is seen as the second leg that's in progress. Upside should be limited by 1.3141 to bring the third leg of the pattern. Meanwhile, break of 1.2499 support will argue that the third leg has already started for 38.2% retracement of 1.0351 (2022 low) to 1.3141 at 1.2075 again.
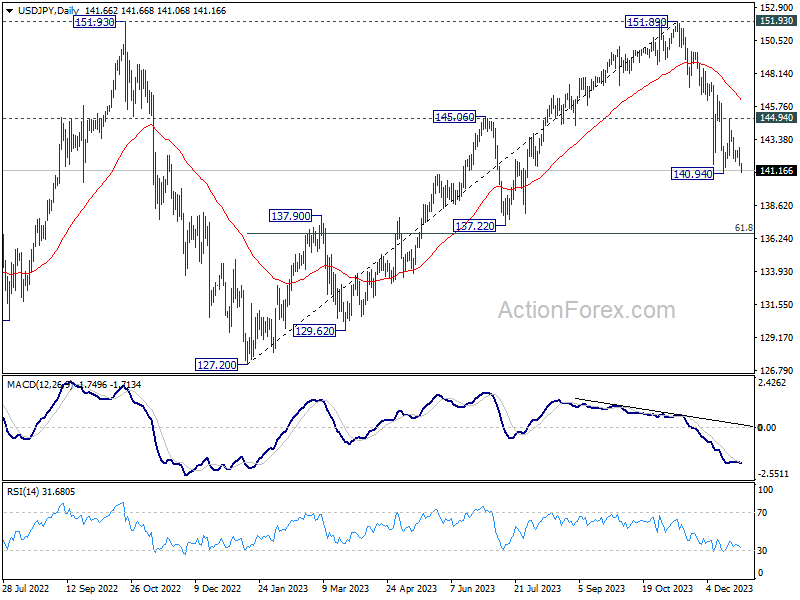
USD/JPY Daily Outlook
Daily Pivots: (S1) 141.31; (P) 142.08; (R1) 142.61; More...
Intraday bias in USD/JPY remains neutral despite today's decline. Sideway trading could still continue in range above 140.94. But in case of another recovery, upside should be limited by 144.94 resistance. On the downside, firm break of 140.94 will resume the whole fall from 151.89. Next target will be next fibonacci level at 136.63.
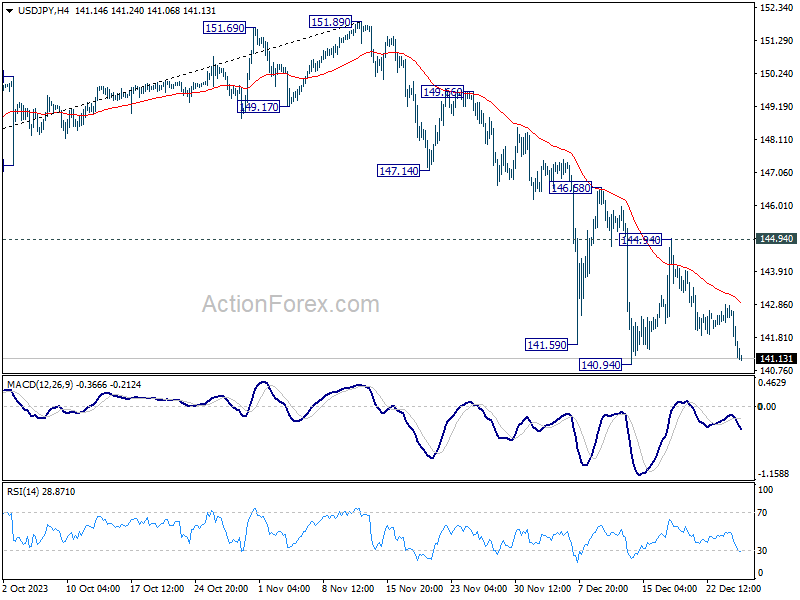
In the bigger picture, fall from 151.89 is seen as the third leg of the corrective pattern from 151.93 (2022 high). Deeper decline would be seen to 61.8% retracement of 127.20 to 151.89 at 136.63, sustained break there will pave the way to 127.20 support (2022 low). This will now remain the favored as long as 146.58 resistance holds.