Sample Category Title
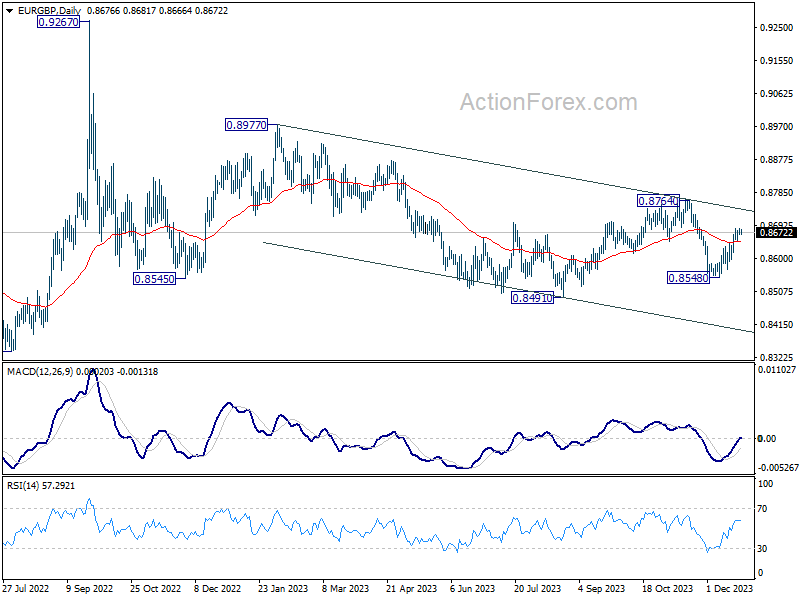
EUR/GBP Daily Outlook
Daily Pivots: (S1) 0.8668; (P) 0.8677; (R1) 0.8687; More...
Intraday bias in EUR/GBP stays on the upside despite some loss of upside momentum. Current rebound from 0.8548 would target 0.8764 key resistance next. EUR/GBP's rebound from 0.8548 is still in progress and intraday bias remains on the upside. Further rise should be seen to 0.8764 key resistance next. On the downside, however, break of 0.8649 minor support will turn bias back to the downside for 0.8548 support instead.
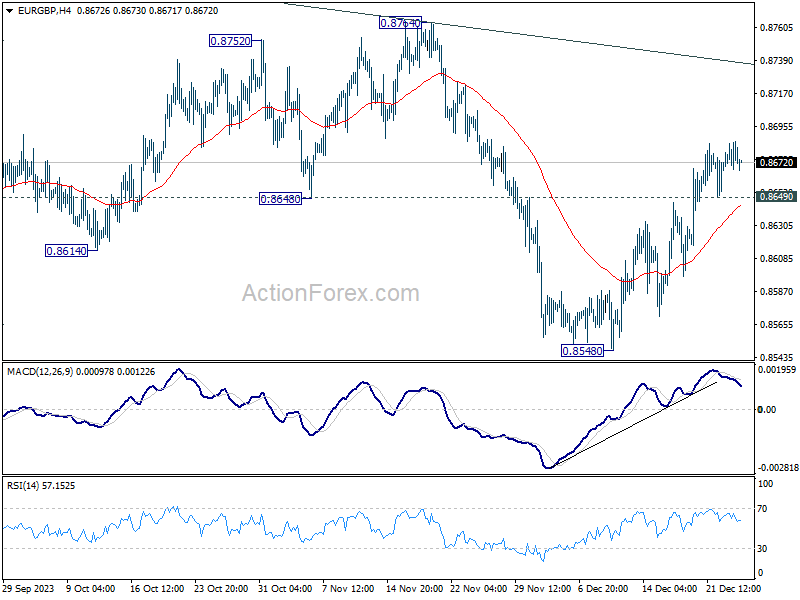
In the bigger picture, current development suggests that down trend from 0.9267 (2022 high) is still in progress. This decline is seen as the third leg of the pattern from 0.9499 (2020 high). Break of 0.8201 will target 100% projection of 0.9499 to 0.8201 from 0.9267 at 0.7969. In any case, outlook will stay bearish as long as 0.8764 resistance holds.
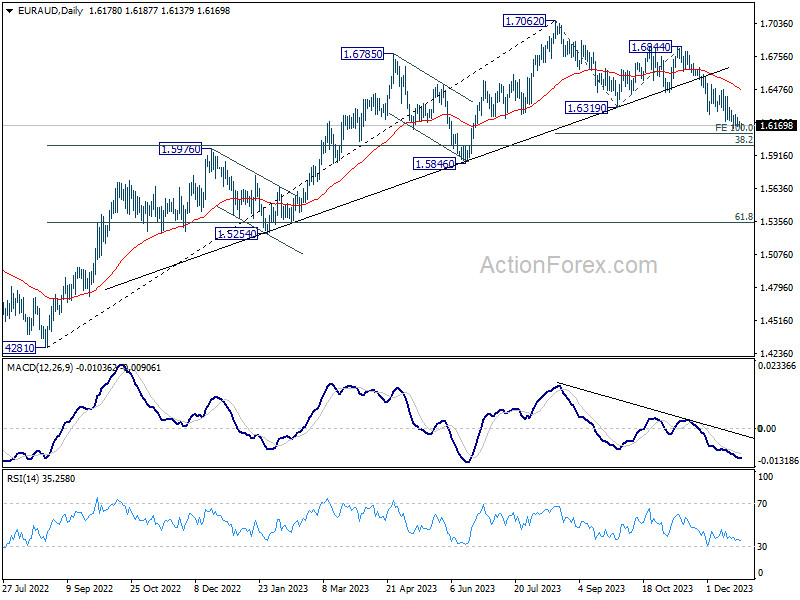
EUR/AUD Daily Outlook
Daily Pivots: (S1) 1.6153; (P) 1.6184; (R1) 1.6210; More...
Intraday bias in EUR/AUD is back on the downside with breach of 1.6148 temporary low. Current fall from 1.6844 should target 100% projection of 1.7062 to 1.6319 from 1.6844 at 1.6106. Meanwhile, considering bullish convergence condition in 4H MACD, firm break of 1.6265 resistance should indicate short term bottoming, and turn bias back to the upside for 1.6478 resistance instead.
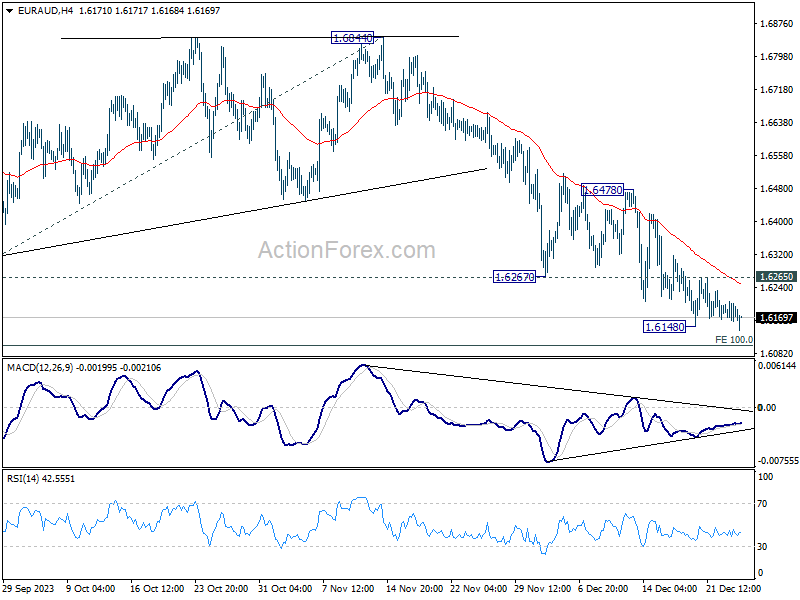
In the bigger picture, fall from 1.7062 medium term top is seen as correcting the whole up trend from 1.4281 (2022 low). Deeper decline would be seen to 38.2% retracement of 1.4281 to 1.7062 at 1.6000. Strong support could be seen there to bring rebound on first attempt. But risk will stay on the downside as long as 1.6844 resistance holds. Sustained break of 1.6000 would bring further fall to 61.8% retracement at 1.5343.
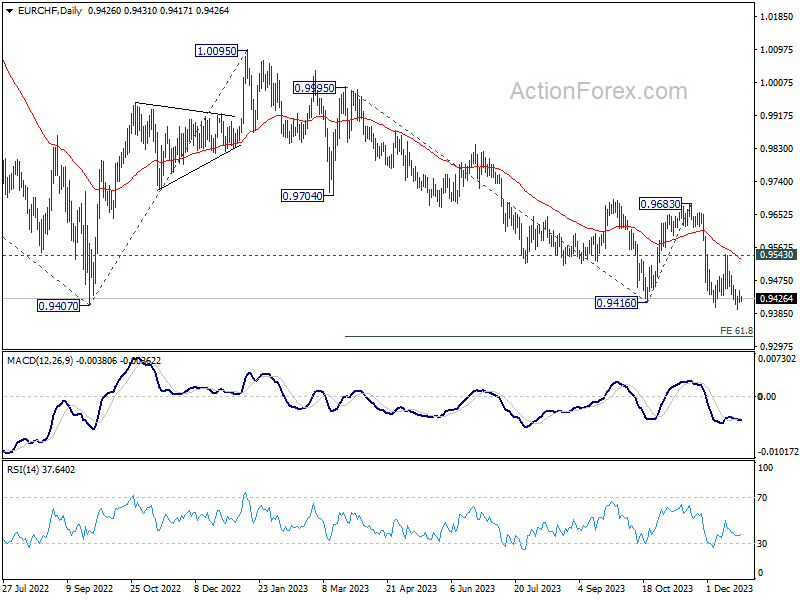
EUR/CHF Daily Outlook
Daily Pivots: (S1) 0.9412; (P) 0.9430; (R1) 0.9444; More...
EUR/CHF recovered after dipping to 0.9395 and intraday bias stays neutral first. Still, with 0.9543 resistance intact, deeper decline is expected. On the downside, firm break of 0.9407 key support will confirm larger down trend resumption. Next target is 61.8% projection of 0.9995 to 0.9416 from 0.9683 at 0.9325. However, sustained break of 0.9543 will bring further rally back to 0.9683 resistance instead.
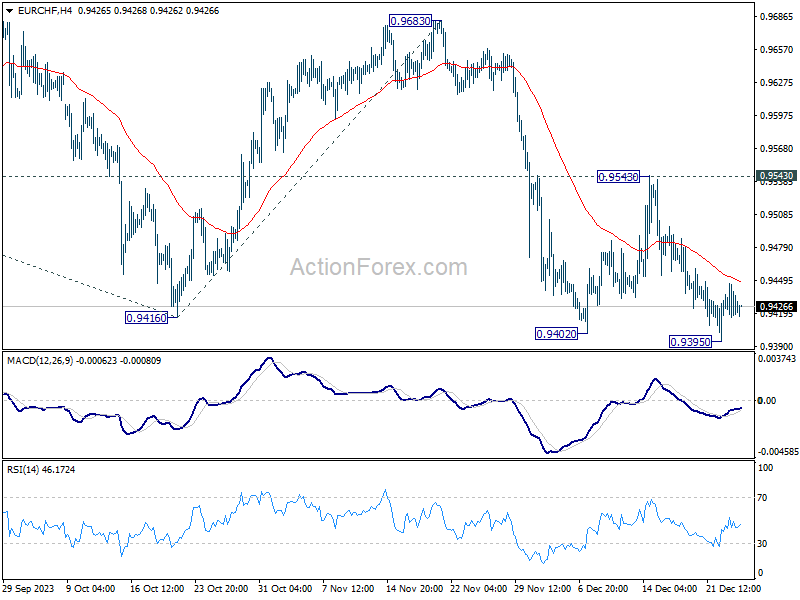
In the bigger picture, medium term outlook remains bearish as long as 0.9683 resistance holds. Firm break of 0.9407 (2022 low) will resume long term down trend. Next target will be 61.8% projection of 1.1149 (2020 high) to 0.9407 from 1.0095 at 0.9018.
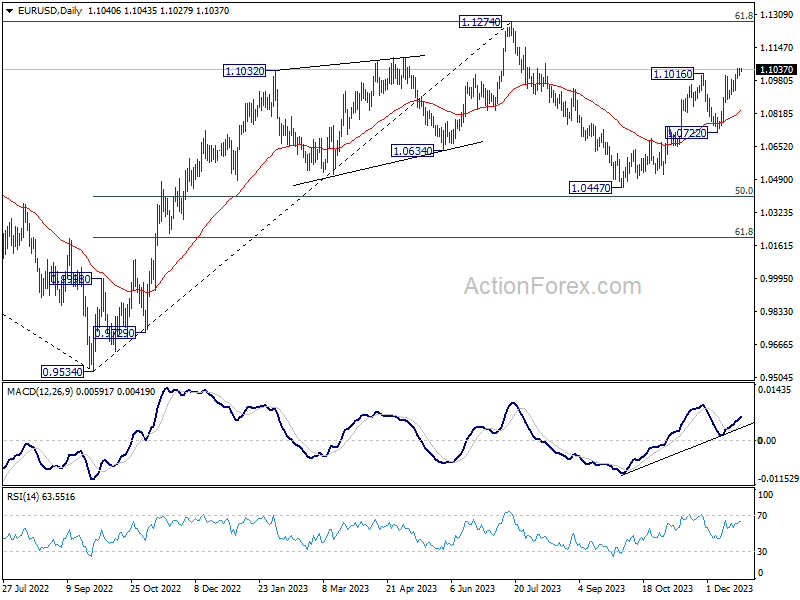
EUR/USD Daily Outlook
Daily Pivots: (S1) 1.1020; (P) 1.1032; (R1) 1.1056; More...
Intraday bias in EUR/USD remains on the upside at this point. Current rise from 1.0447 should target a retest on 1.1274 high. Strong resistance should be seen from there to limit upside, at least on first attempt. On the downside, below 1.0993 minor support will turn intraday bias neutral first. But further rally will remain in favor as long as 1.0722 support holds, in case of retreat.
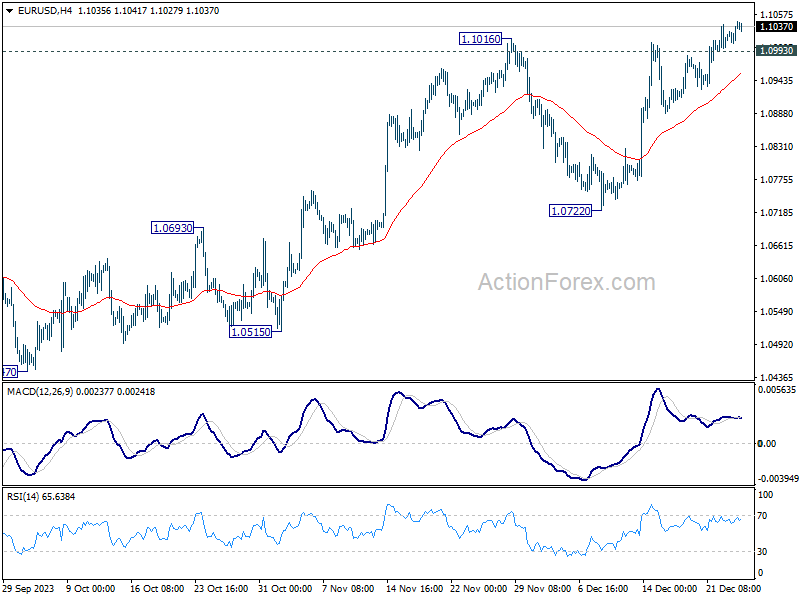
In the bigger picture, price actions from 1.1274 are viewed as a corrective pattern to rise from 0.9534 (2022 low). Rise from 1.0447 is seen as the second leg. While further rally could cannot be ruled out, upside should be limited by 1.1274 to bring the third leg of the pattern. Meanwhile, sustained break of 1.0722 support will argue that the third leg has already started for 1.0447 and below.
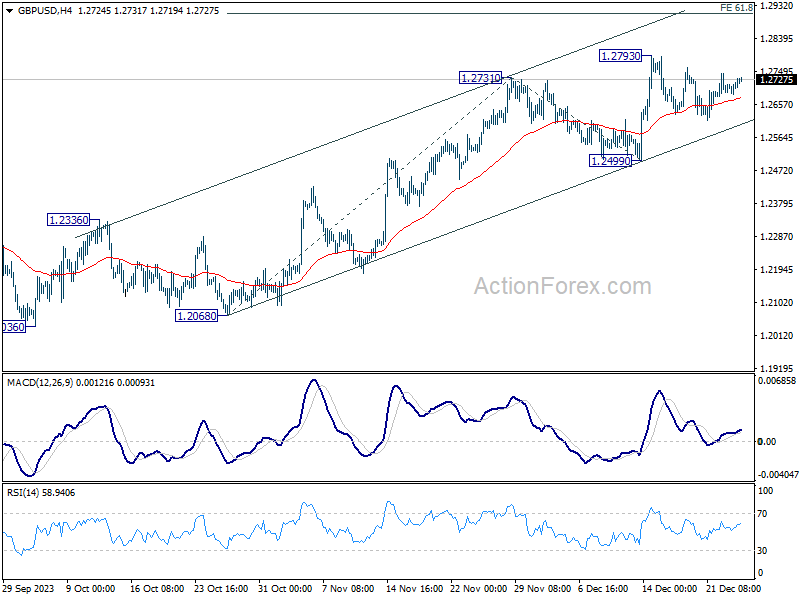
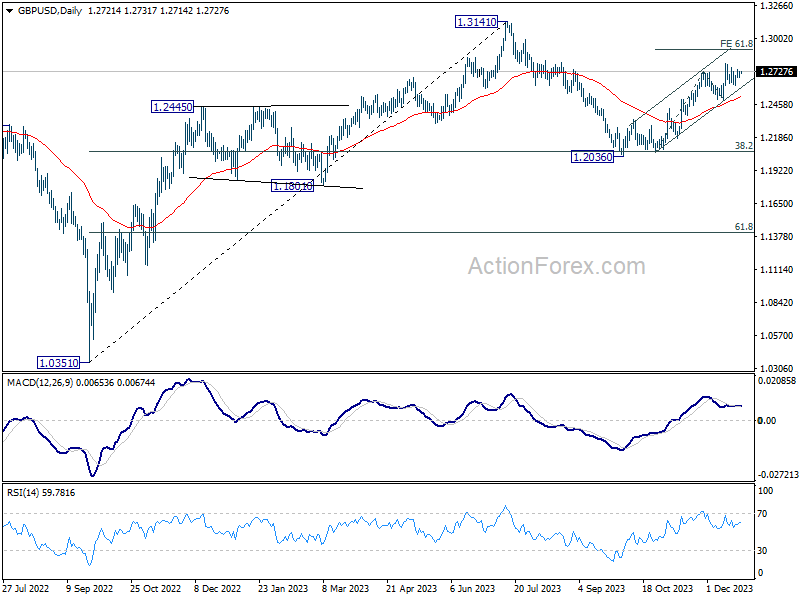
GBP/USD Daily Outlook
Daily Pivots: (S1) 1.2697; (P) 1.2714; (R1) 1.2742; More...
Intraday bias in GBP/USD remains neutral as consolidation from 1.2793 is extending. As long as 1.2499 support holds, near term outlook will stay bullish and further rally is expected. On the upside, firm break of 1.2793 will resume the rally from 1.2036. Next target is 61.8% projection of 1.2068 to 1.2731 from 1.2499 at 1.2909.
In the bigger picture, price actions from 1.3141 medium term top are seen as a corrective pattern to rise from 1.0351 (2022 low). Rise from 1.2036 is seen as the second leg that's in progress. Upside should be limited by 1.3141 to bring the third leg of the pattern. Meanwhile, break of 1.2499 support will argue that the third leg has already started for 38.2% retracement of 1.0351 (2022 low) to 1.3141 at 1.2075 again.
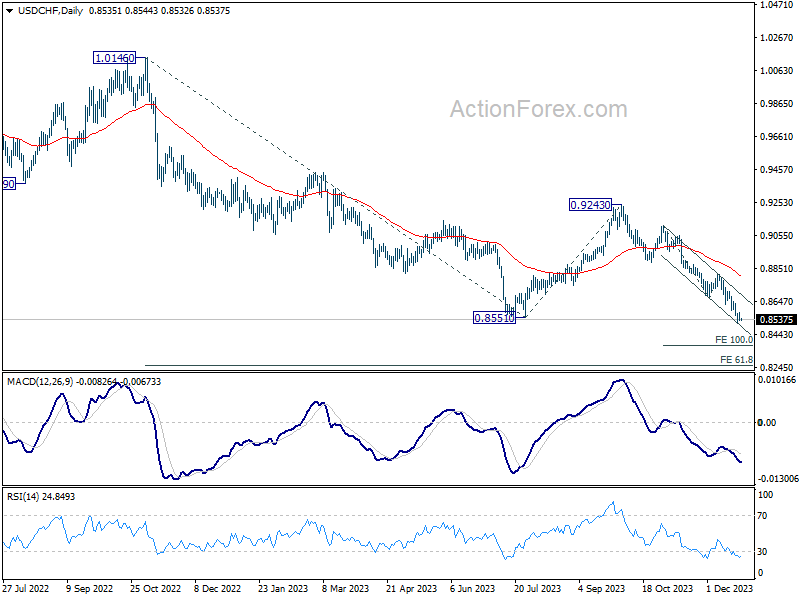
USD/CHF Daily Outlook
Daily Pivots: (S1) 0.8518; (P) 0.8550; (R1) 0.8569; More....
Intraday bias in USD/CHF is turned neutral with current recovery, and some consolidations should be seen first. But outlook will stay bearish as long as 0.8665 support turned resistance holds. Below 0.8513 will resume larger down trend to 100% projection of 0.9111 to 0.8665 from 0.8819 at 0.8373 next.
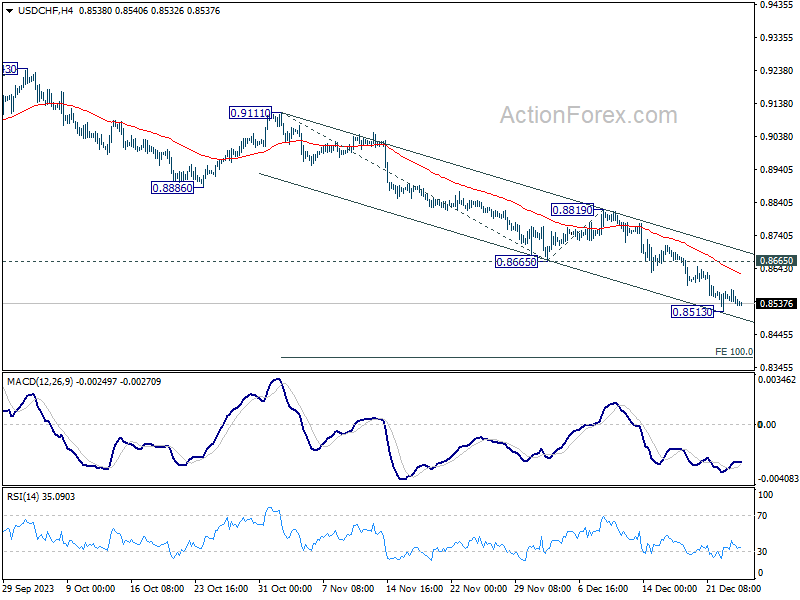
In the bigger picture, break of 0.8551 support indicates resumption of whole decline from 1.0146 (2022 high). Next target is 61.8% retracement of 1.0146 to 0.8551 from 0.9243 at 0.8257. Sustained break there could prompt downside acceleration to 100% projection at 0.7648. This will now remain the favored case as long as 0.8819 resistance holds.
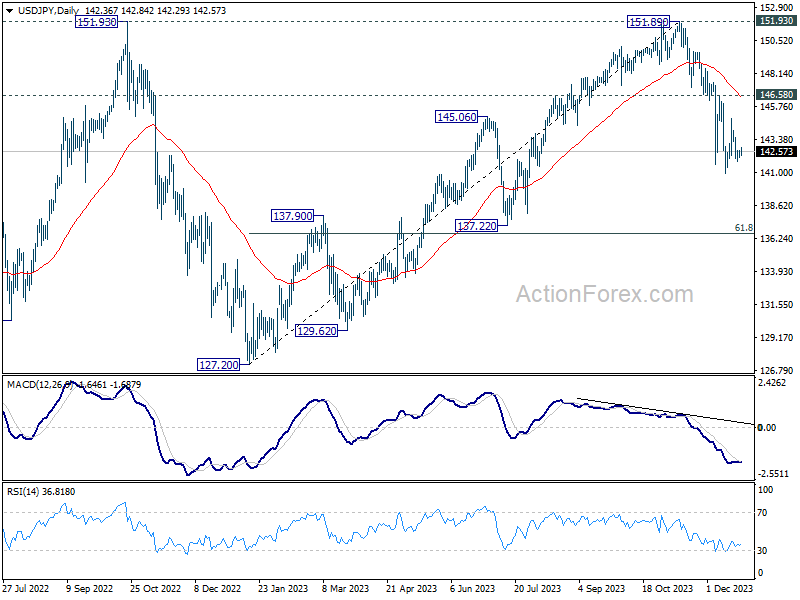
USD/JPY Daily Outlook
Daily Pivots: (S1) 142.11; (P) 142.37; (R1) 142.64; More...
Intraday bias in USD/JPY remains neutral at this point as sideway consolidations continue above 140.94. In case of stronger recovery, upside should be limited below 146.58 resistance. On the downside, firm break of 140.94 will resume the whole fall from 151.89. Next target will be next fibonacci level at 136.63.
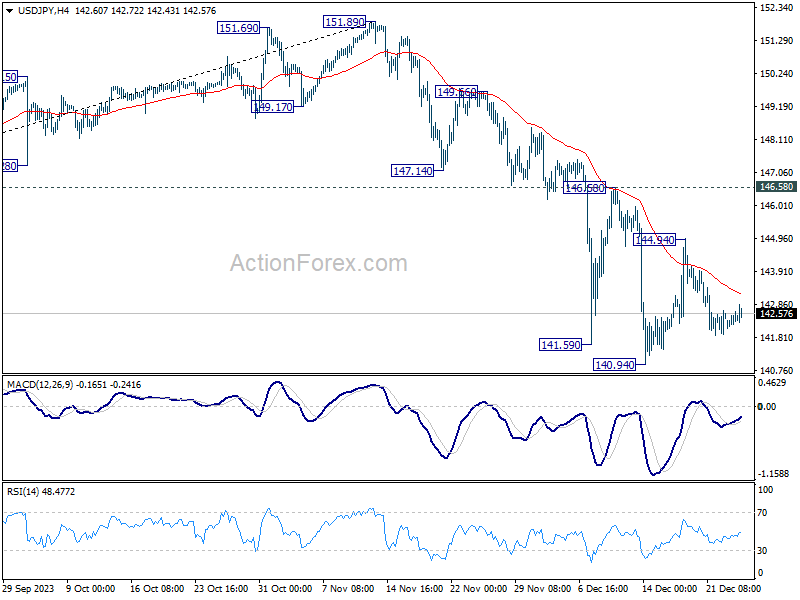
In the bigger picture, fall from 151.89 is seen as the third leg of the corrective pattern from 151.93 (2022 high). Deeper decline would be seen to 61.8% retracement of 127.20 to 151.89 at 136.63, sustained break there will pave the way to 127.20 support (2022 low). This will now remain the favored as long as 146.58 resistance holds.
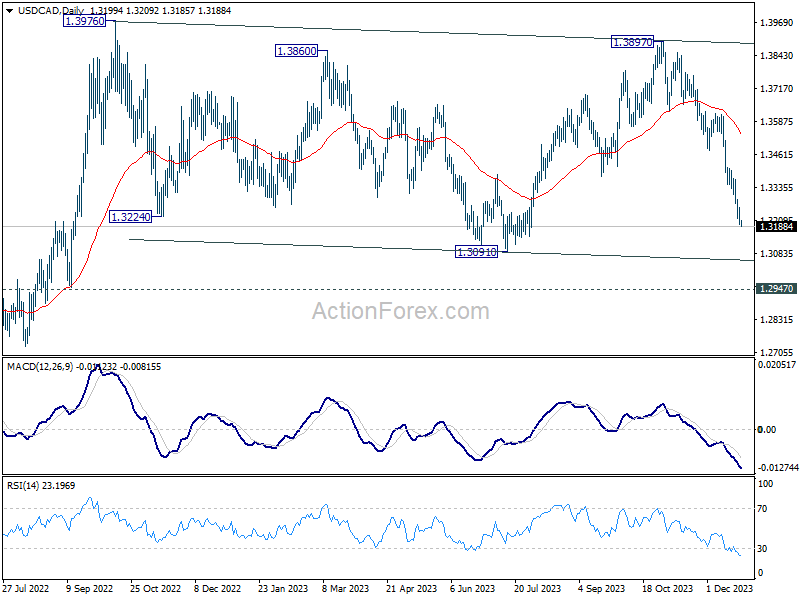
USD/CAD Daily Outlook
Daily Pivots: (S1) 1.3172; (P) 1.3219; (R1) 1.3242; More...
USD/CAD's fall form 1.3897 continues today and intraday bias stays on the downside. Current decline should target 1.3091 support and possibly below. On the upside, above 1.3284 minor resistance will turn intraday bias neutral and bring consolidations. But another fall will remain in favor as long as 1.3479 support turned resistance holds.
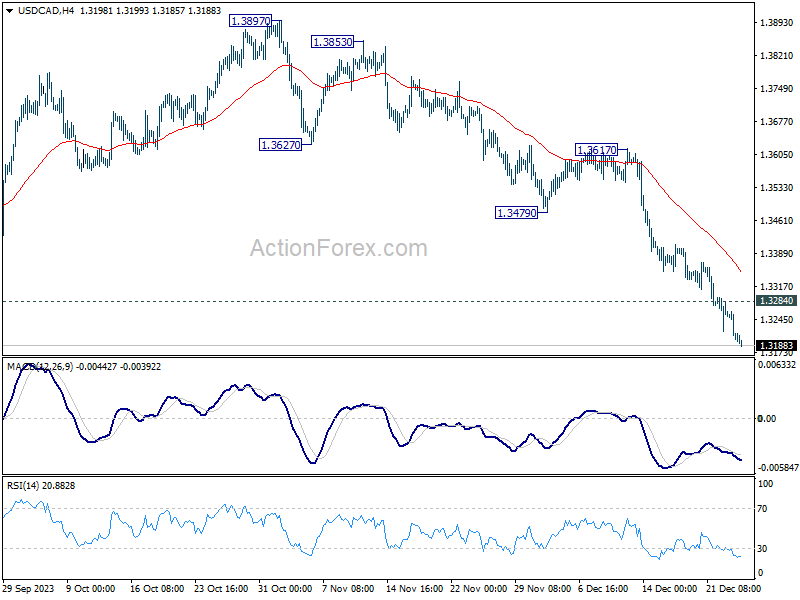
In the bigger picture, outlook is mixed up by deeper then expected fall from 1.3897. But after all, price actions from 1.3976 (2022 high) are viewed as a corrective pattern that's in progress. Larger up trend from 1.2005 (2021 low) is still expected to resume at a later stage as long as 1.2947 resistance turned support holds.
Yen Dips on Dovish BoJ, Aussie Gains on China Optimism
Yen falls broadly in Asian session today, influenced by the dovish sentiments expressed BoJ's Summary of Opinions of December meeting. The document indicated a lack of urgency among board members to tighten monetary policy, with a particular emphasis on the minimal risk associated with delaying the exit from negative interest rates. Conversely, the board expressed concerns about the potential risks of tightening too early. This cautious stance reflects the board's ongoing focus on the establishment of a "virtuous" cycle between wages and prices, a key prerequisite for any consideration of a rate hike. The spring wage negotiations are set to be a pivotal moment for the BoJ to evaluate the emergence of this cycle. Despite this dovish outlook, Yen's retreat in the forex market was notably restrained.
Conversely, Australian Dollar is having a robust bounce, buoyed by risk-on sentiment prevalent in major Asian stock markets. This upbeat mood was partly driven by encouraging economic data from China, where industrial profits saw a substantial year-on-year jump of 29.5% in November, a significant acceleration from the modest October's 2.7% growth. This data indicates a notable recovery in industrial earnings, even though the cumulative profits for the first 11 months of the year show a contraction of -4.4% compared to the previous year. This decrease, however, is less severe than the -7.8% decline reported for the first ten months. Despite this positive data, concerns remain about the sustainability of this growth momentum, particularly in the face of weak external demand. Nevertheless, for the moment, the upbeat sentiment is lifting both Asian equities and Australian Dollar.
Elsewhere in the currency markets, New Zealand Dollar and Canadian Dollar are trailing Aussie as the next strongest currencies. In contrast, Euro and US Dollar are weaker, closely following Yen. Sterling and Swiss Franc are showing mixed performances, positioned in the middle of the currency spectrum.
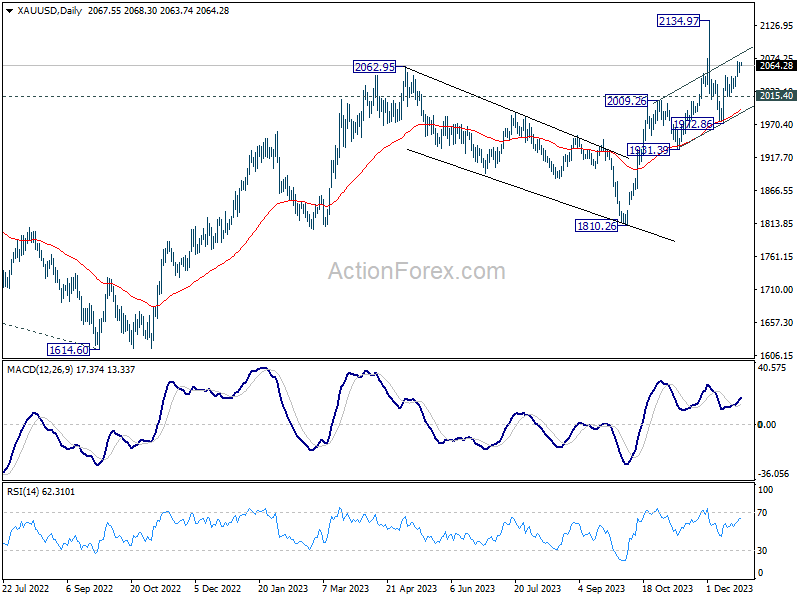
Technically, Gold's rebound from 1972.86 is still in progress. The strong support from from rising 55 D EMA is a bullish sign, and further rally is expected as long as 2015.40 support holds. If the spike higher to 2134.97 record high is neglected due to low liquidity during that day, the key hurdle for Gold is now on channel resistance (now at 2082). Sustained break there should trigger upside acceleration through 2134.97 easily to resume the long term up trend.
In Asia, at the time of writing, Nikkei is up 1.13%. Hong Kong HSI is up 1.53%. China Shanghai SSE is up 0.44%. Singapore Strait Times is up 0.41%. Japan 10-year JGB yield is down -0.0203 at 0.613.
BoJ's Ueda: Policy adjustment possible with strengthened wage-price relationship
BoJ Governor Kazuo Ueda, in a speech yesterday, acknowledged that while the probability of achieving the central bank's price target is gradually increasing, it is still not high enough to justify a change in the current monetary policy.
Ueda highlighted, "The likelihood of Japan's economy getting out of the low-inflation environment and achieving our price target is gradually rising, though the likelihood is still not sufficiently high at this point."
The Governor pointed out the significant uncertainties surrounding economic and price conditions both domestically and internationally. He emphasized the importance of observing how firms' wage- and price-setting behaviors evolve in response to these conditions.
Ueda also mentioned that "we will likely considering changing policy," if there is significant strengthening of the virtuous cycle between wages and prices, leading to a sustainable and stable likelihood of achieving BoJ's price target.
BoJ's Dec meeting highlights lack of urgency in tightening
Summary of Opinions of BoJ's December 18-19 meeting revealed a prevailing view among the board members on a lack of urgency in tightening monetary policy. The consensus was that delaying the decision to tighten poses minimal risk. This general sentiment indicates BoJ's preference for a measured approach, prioritizing stability and sufficient data before considering changes.
The summary acknowledged that the sustainable and stable achievement of price stability target, set at 2%, is not yet certain. In considering whether to end the negative interest rate policy and yield curve control framework, the board stressed the importance of confirming a virtuous cycle between wages and prices.
To reach the 2% inflation target sustainably, one member noted that "growth momentum in nominal wages needs to strengthen further". It's also noted that wage growth has not kept pace with inflation. And, even with potentially higher wage hikes in the spring, the risk of inflation significantly surpassing 2% remains "low". Current policy approach does not risk "falling behind the curve" in response to inflation dynamics.
The summary also noted that acknowledged that the need to "rapidly tighten monetary policy is small". At the same time, "the cost incurred if this risk materializes would be significant."
Looking ahead
The economic calendar is light today, with Swiss Credit Suisse economic expectations featured in European session.
AUD/USD Daily Report
Daily Pivots: (S1) 0.6801; (P) 0.6815; (R1) 0.6837; More...
AUD/USD's rally from 0.6269 continues today and hits as high as 0.6839 so far. Intraday bias remains on the upside for 0.6894 resistance first. Sustained break there will target 0.7156 next. On the downside, below 0.6772 minor support will turn intraday bias neutral first. But outlook will remain bullish as long as 0.6689 resistance turned support holds, in case of retreat.
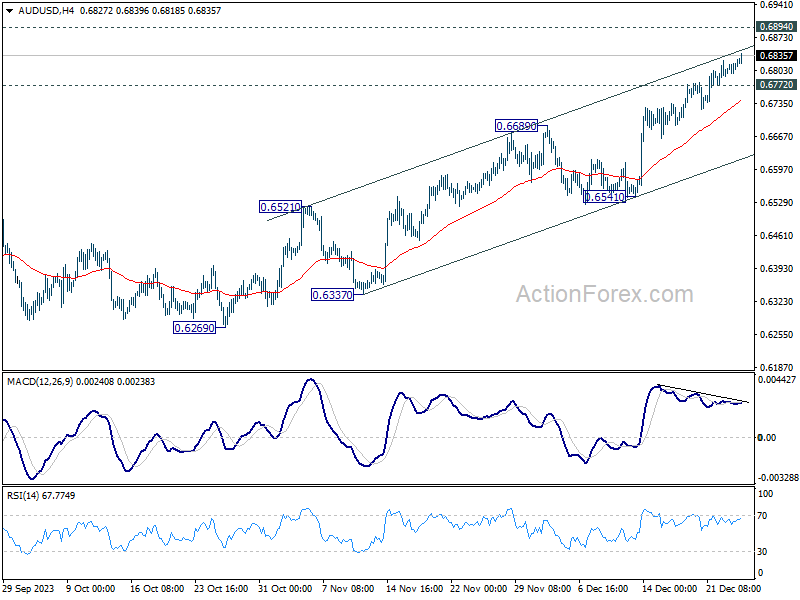
In the bigger picture, there is no confirmation that down trend from 0.8006 (2021 high) has completed. Price actions from 0.6169 (2022 low) could be just a medium term corrective pattern. Rise from 0.6269 is seen as the third leg of the pattern. For now, range trading should be seen between 0.6169 and 0.7156 (2023 high), until further developments.
Economic Indicators Update
| GMT | Ccy | Events | Actual | Forecast | Previous | Revised |
|---|---|---|---|---|---|---|
| 23:50 | JPY | BoJ Summary of Opinions | ||||
| 05:00 | JPY | Housing Starts Y/Y Nov | -8.50% | -4.30% | -6.30% | |
| 09:00 | CHF | Credit Suisse Economic Expectations Dec | -29.6 |
Technical Outlook and Review
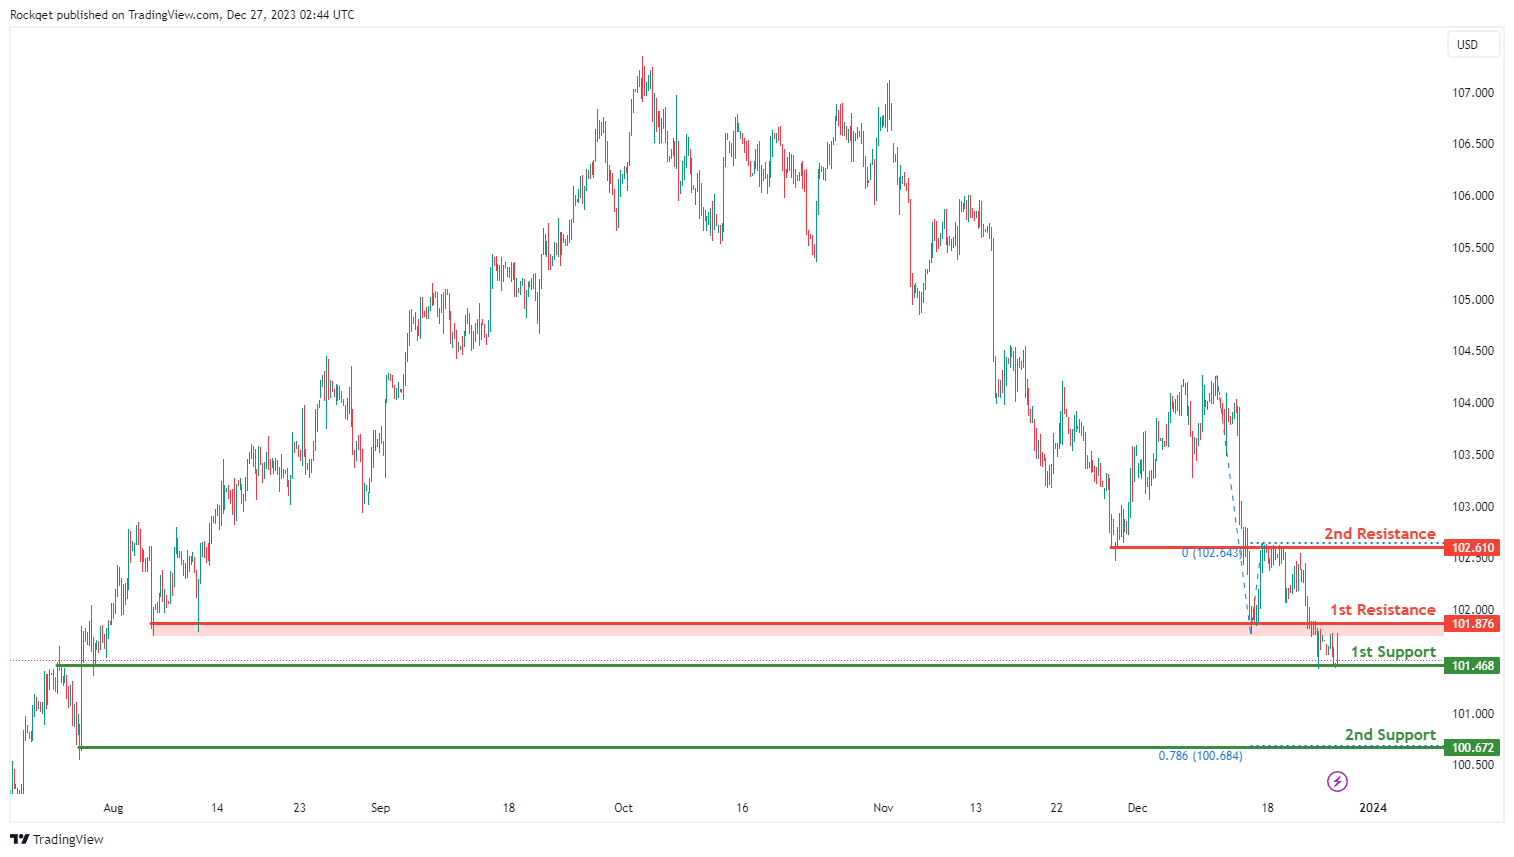
DXY:
The DXY (US Dollar Index) chart currently shows an overall bearish momentum, indicating a potential for price to make a bearish continuation towards the 1st support.
The 1st support level at 101.46 is identified as an overlap support. Further below, the 2nd support level at 100.67 is noted as a swing-low support that aligns with the 78.60% Fibonacci projection level, further reinforcing its importance as a potential key support level.
To the upside, the 1st resistance level at 101.87 is identified as an overlap resistance. Higher up, the 2nd resistance level at 102.61 is also marked as an overlap resistance, suggesting a potential barrier for further upside movement.
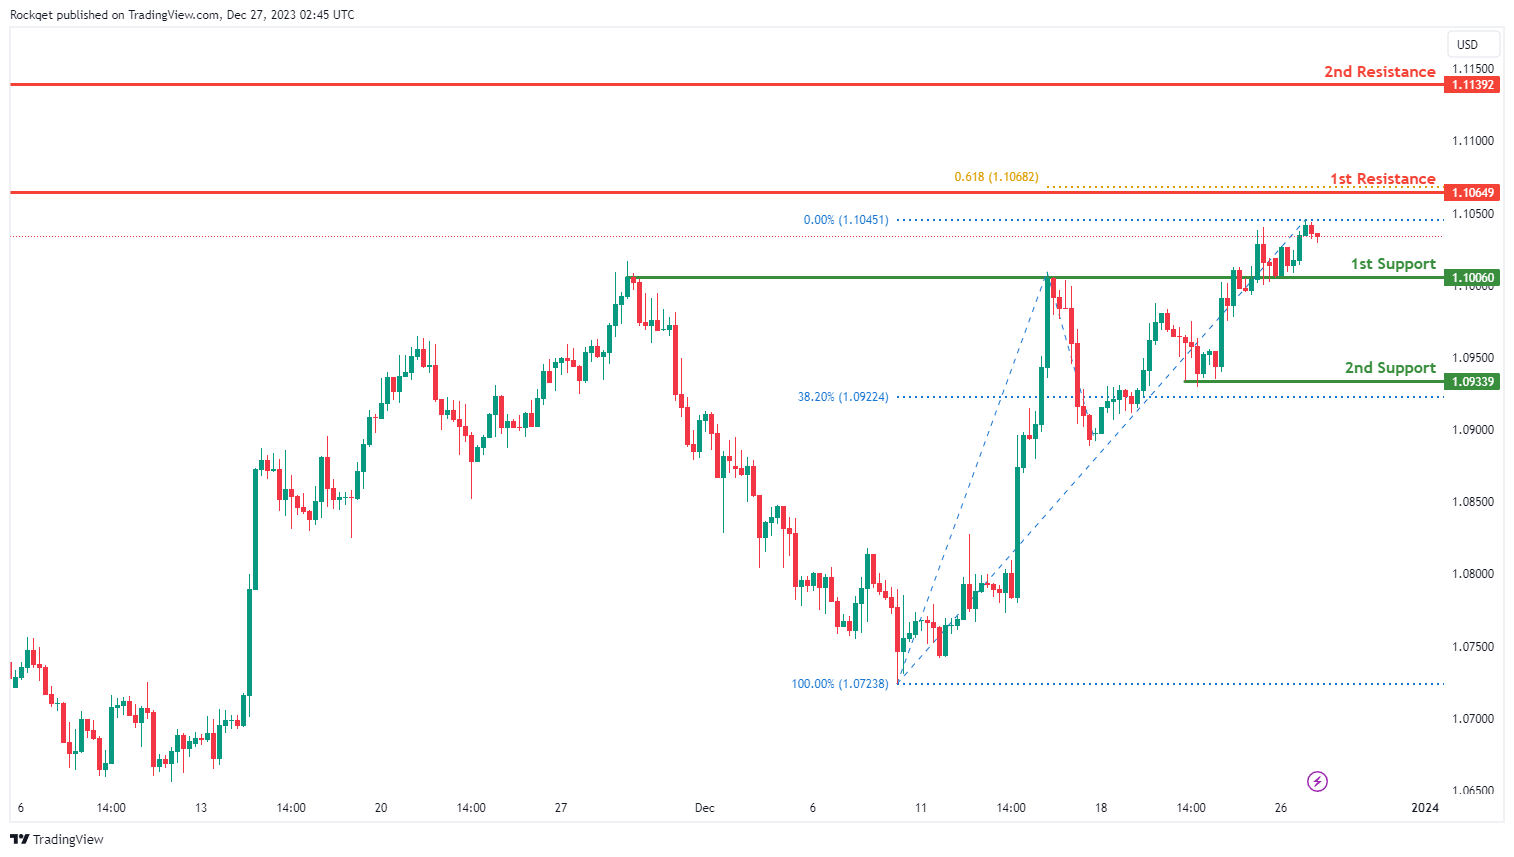
EUR/USD:
The EUR/USD chart currently exhibits an overall bullish momentum. In this context, there is a potential scenario for price to make a bullish continuation towards the 1st resistance.
The 1st resistance level at 1.1064 is identified as a swing-high resistance that aligns with the 61.80% Fibonacci projection level. Higher up, the 2nd resistance level at 1.1139 is also noted as a swing-high resistance, suggesting a potential barrier for further upside movement.
To the downside, the 1st support level at 1.1006 is identified as an overlap support. Further below, the 2nd support level at 1.0933 is marked as a pullback support, further reinforcing its importance as a potential key support level.
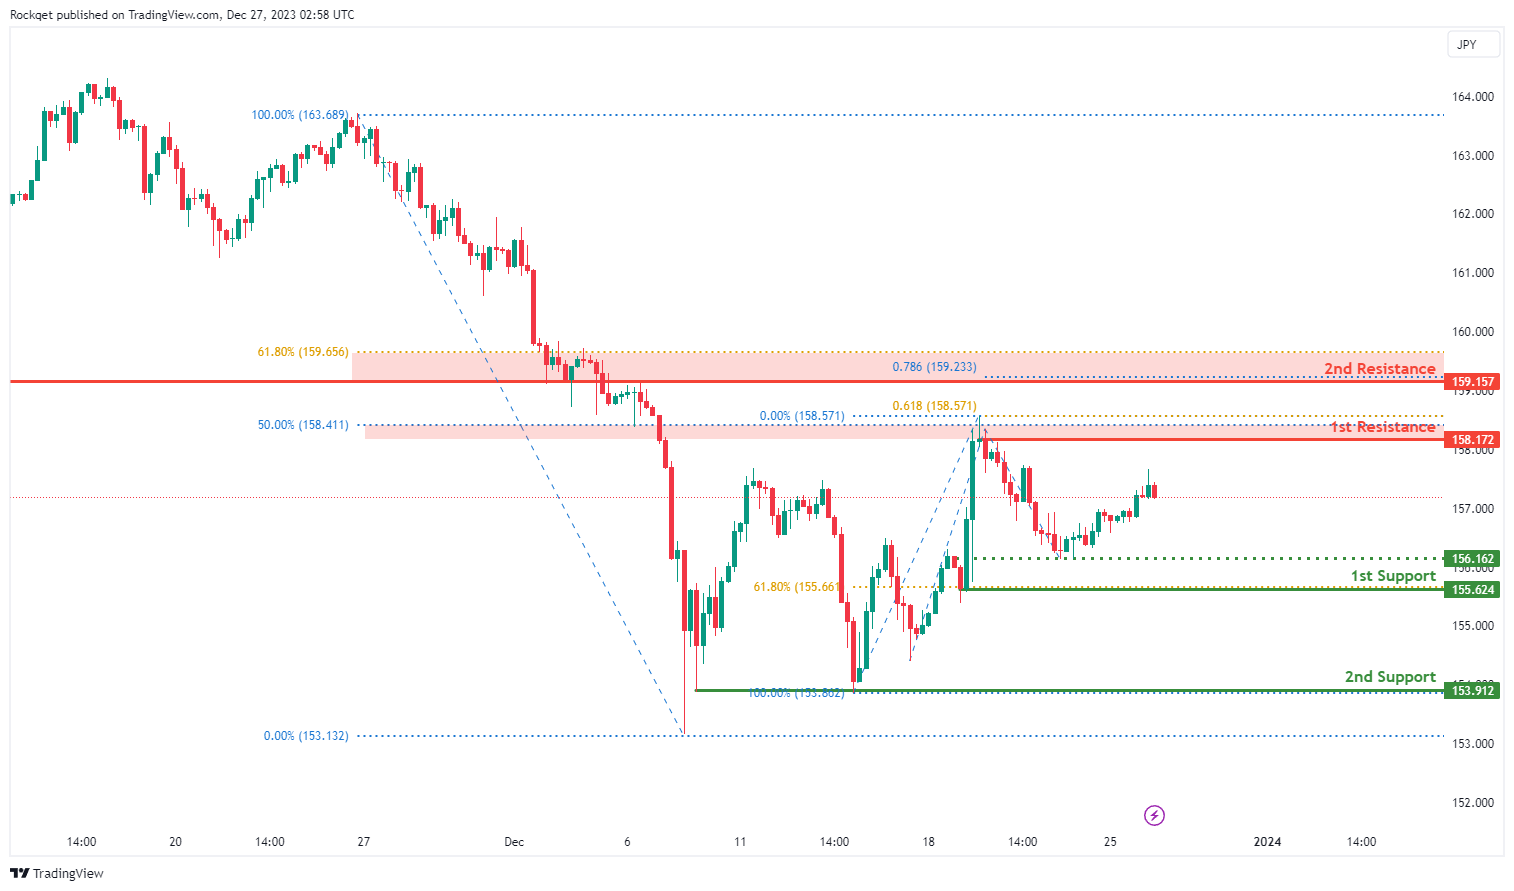
EUR/JPY:
The EUR/JPY chart currently exhibits a neutral overall momentum, suggesting a potential scenario for price fluctuation between the 1st resistance and 1st support levels.
The 1st support at 155.62 is identified as a pullback support, representing a historical area where buying interest has been present. This support level also aligns with the 61.80% Fibonacci Retracement, providing added significance to the support zone.
Additionally, the 2nd support at 153.91 is recognized as a multi-swing low support, contributing to the potential strength of the support area.
On the resistance side, the 1st resistance at 158.17 is linked to a swing high resistance and the 61.80% Fibonacci Projection, indicating a level where selling interest may intensify, potentially causing a temporary pause or reversal in the price movement.
Furthermore, the 2nd resistance at 159.16 is an overlap resistance and is associated with the 61.80% Fibonacci Retracement and the 78.60% Fibonacci Projection, providing formidable challenges for the price to overcome.
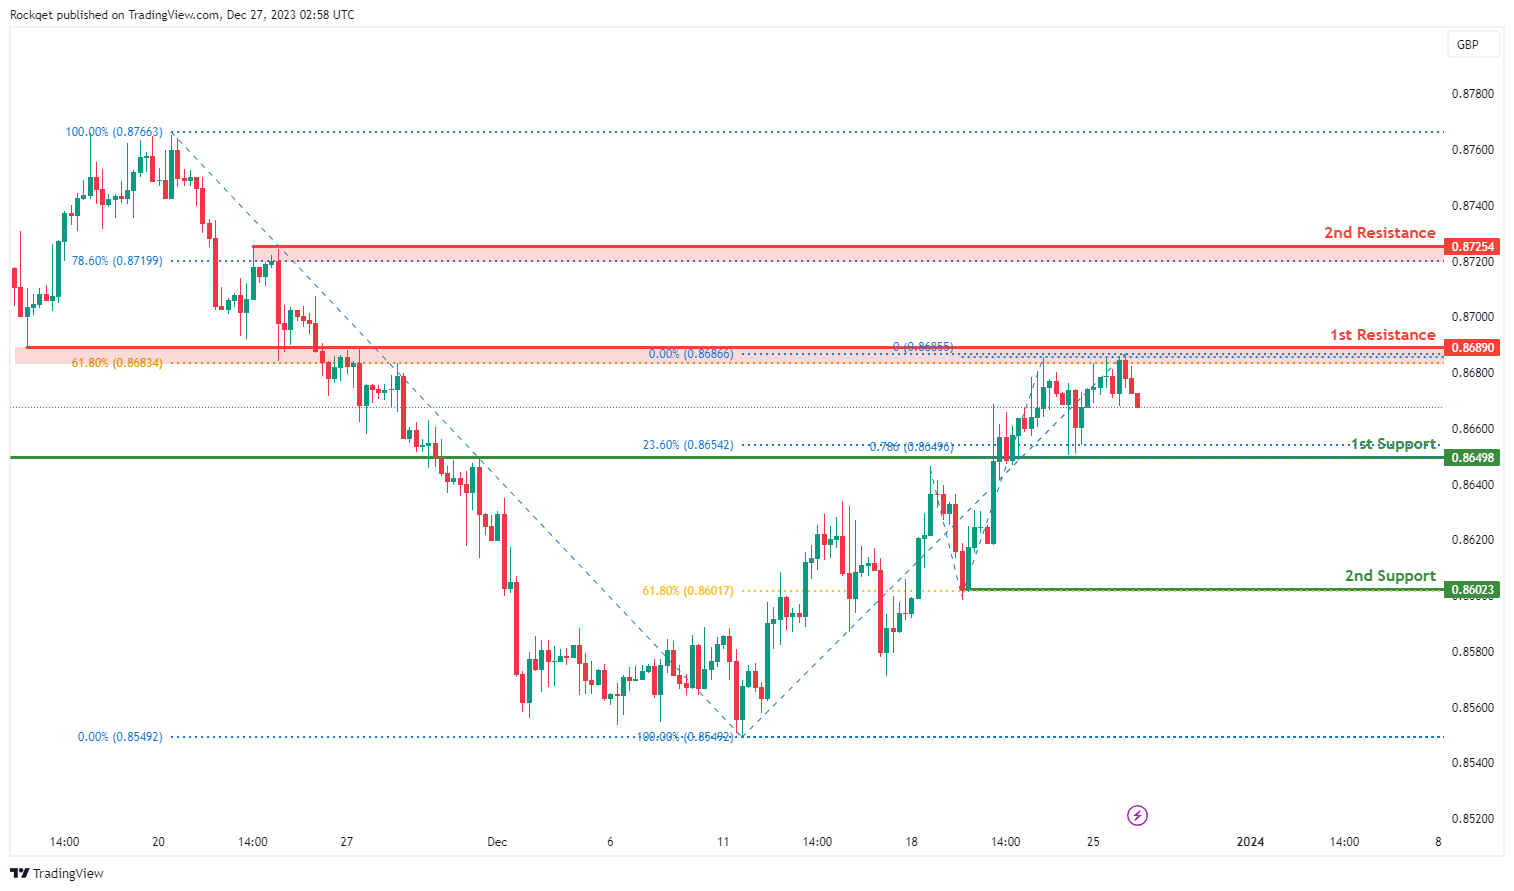
EUR/GBP:
The EUR/GBP chart currently indicates a bearish overall momentum, suggesting a potential scenario for a bearish continuation towards the 1st support.
The 1st support at 0.8650 is considered significant as it represents an overlap support and aligns with the 23.60% Fibonacci Retracement, indicating a historical area where buying interest has been present.
Additionally, the 2nd support at 0.8602 is identified as a pullback support and is associated with the 61.80% Fibonacci Retracement, providing an additional layer of potential support for the currency pair.
On the resistance side, the 1st resistance at 0.8689 is linked to an overlap resistance and the 61.80% Fibonacci Retracement, indicating a level where selling interest may intensify, potentially causing a temporary pause or reversal in the price movement.
Furthermore, the 2nd resistance at 0.8725 is a pullback resistance and is associated with the 78.60% Fibonacci Retracement, providing formidable challenges for the price to overcome.
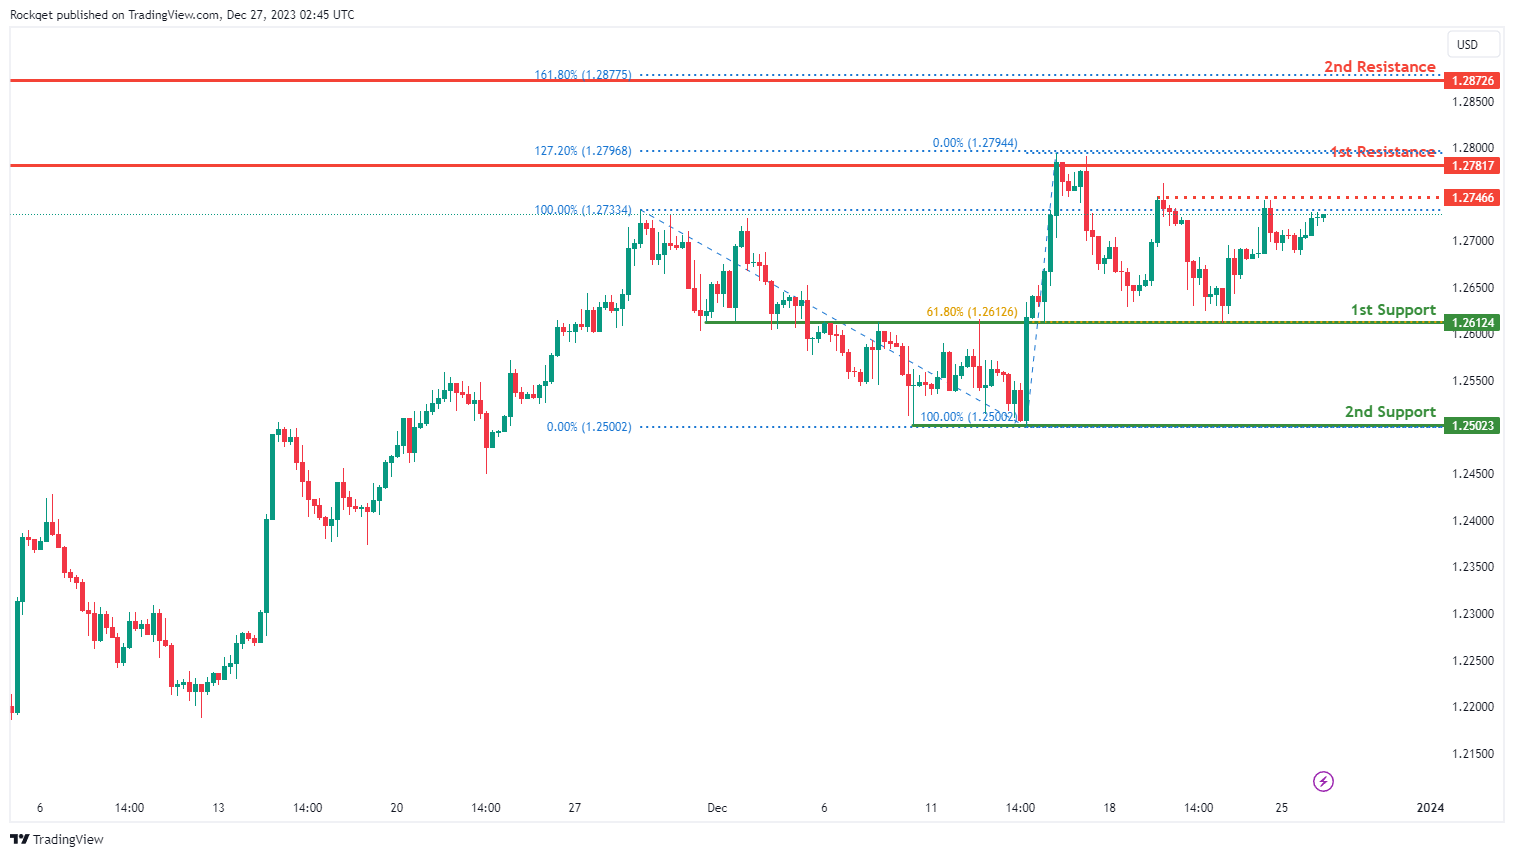
GBP/USD:
The GBP/USD chart currently exhibits a neutral bias. In this context, there is a potential scenario for price to fluctuate between the 1st support and the 1st resistance.
The 1st support level at 1.2612 is identified as an overlap support that aligns with the 61.80% Fibonacci retracement level. Further below, the 2nd support level at 1.2502 is marked as a swing-low support, further reinforcing its importance as a potential key support level.
To the upside, the intermediate resistance at 1.2746 is identified as a pullback support while the 1st resistance level at 1.2781 is identified as a multi-swing-high resistance that aligns with the 127.20% Fibonacci extension level. Higher up, the 2nd resistance level at 1.2872 is noted as a pullback resistance that aligns with the 161.80% Fibonacci extension level, suggesting a potential barrier for further upside movement.
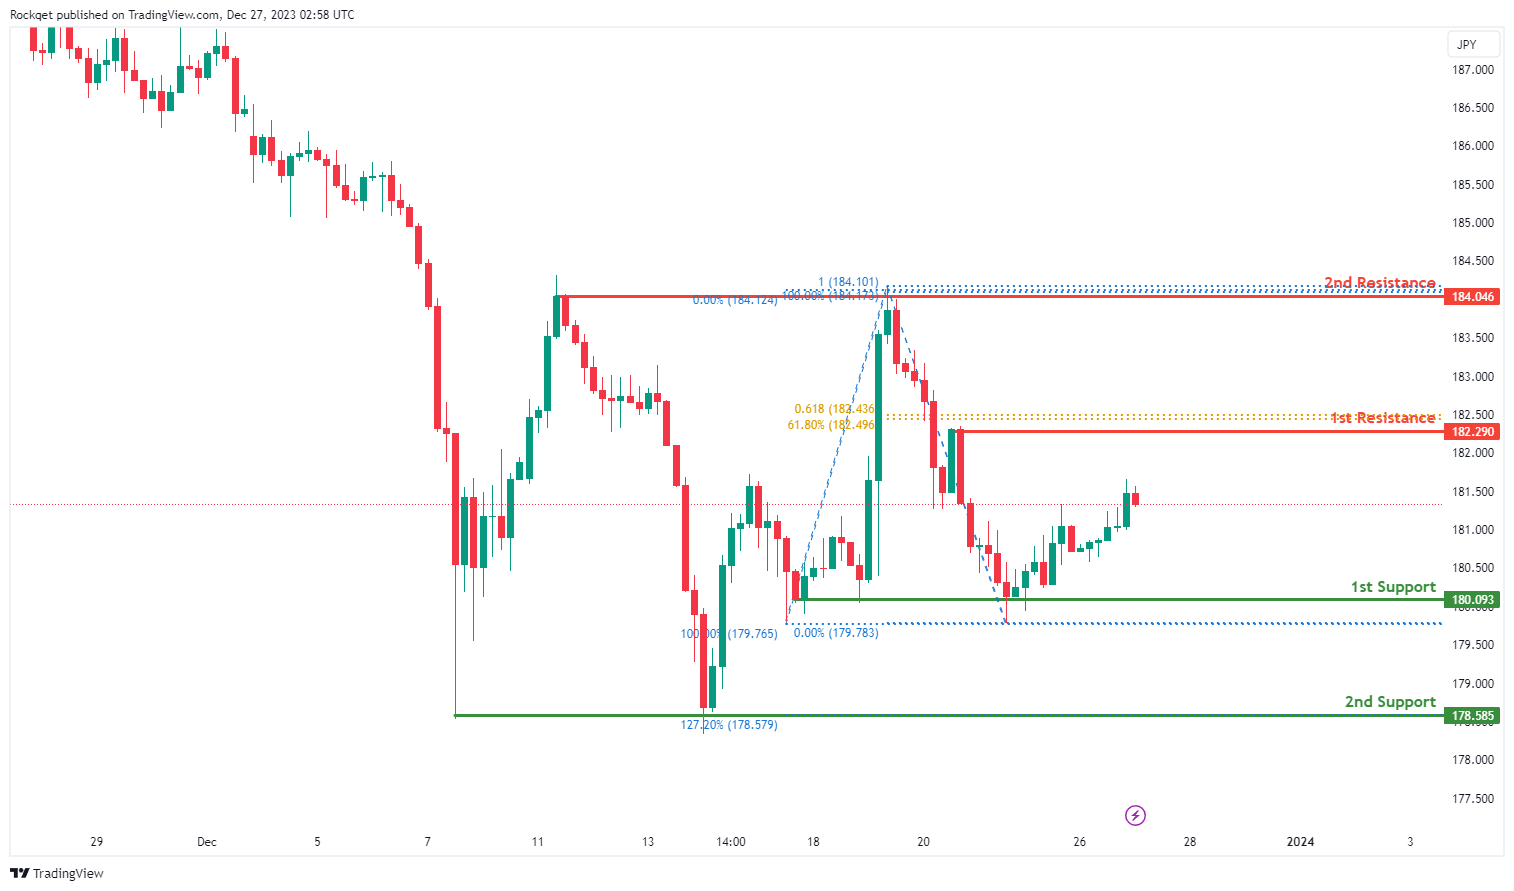
GBP/JPY:
The GBP/JPY chart currently shows a bullish overall momentum, indicating a potential scenario for a bullish continuation towards the 1st resistance.
The 1st support at 180.09 is considered significant as it represents a multi-swing low support, aligning with a Fibonacci projection. This level indicates a historical area where buying interest has been prominent.
Additionally, the 2nd support at 178.59 is identified as another multi-swing low support and is associated with the 127.20% Fibonacci Extension, providing an additional layer of potential support for the currency pair.
On the resistance side, the 1st resistance at 182.29 is linked to a pullback resistance and the 61.80% Fibonacci Projection and Retracement. This suggests a level where selling interest may intensify, potentially causing a temporary pause or reversal in the price movement.
Furthermore, the 2nd resistance at 184.05 represents a multi-swing high resistance, adding further challenges for the price to overcome in its bullish trajectory.
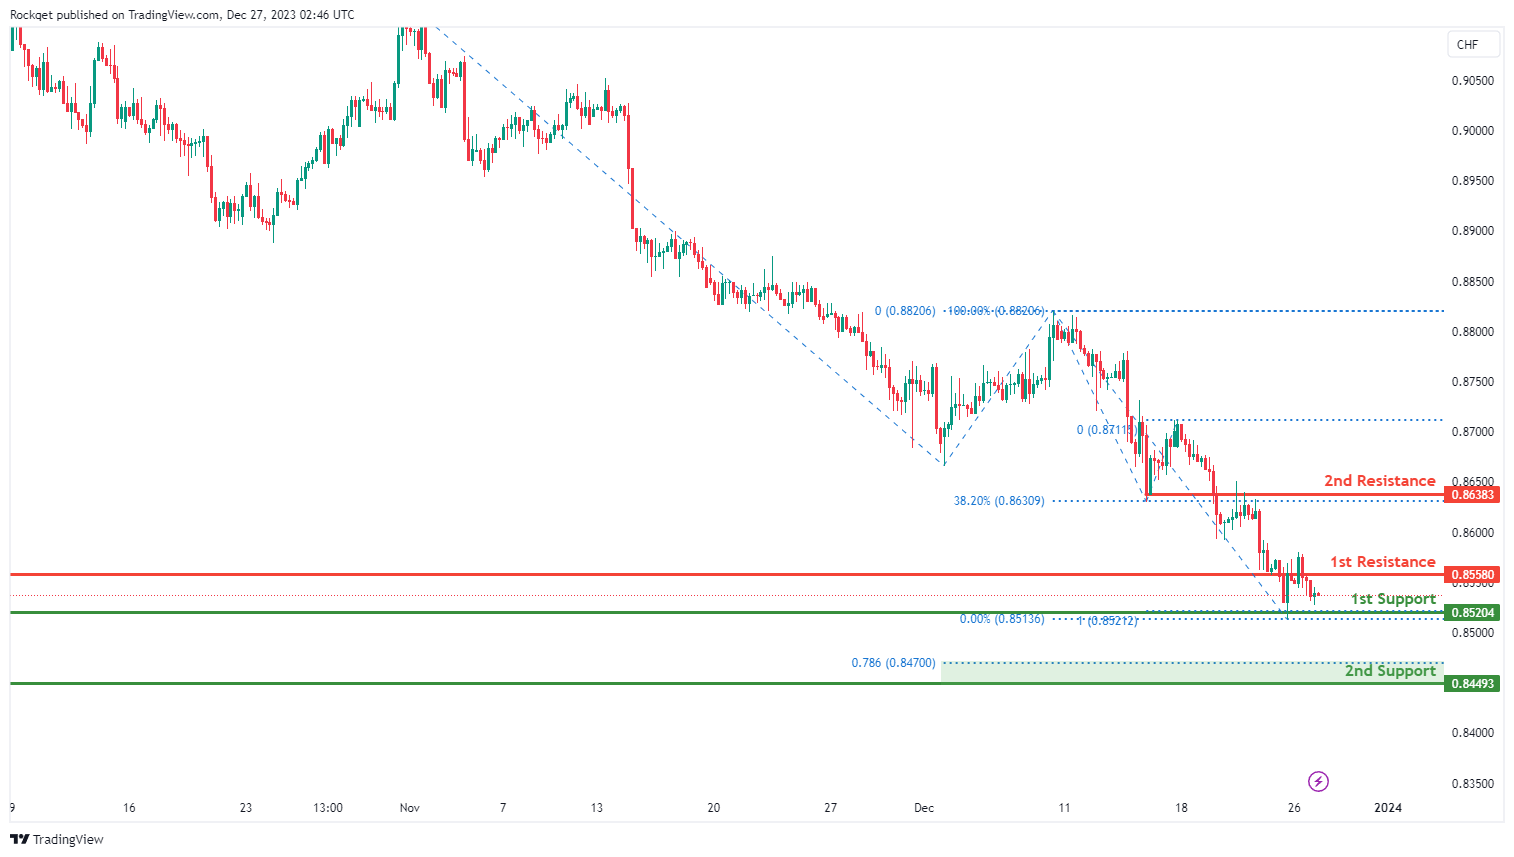
USD/CHF:
The USD/CHF chart currently exhibits an overall bearish momentum. In this context, there is a potential scenario for price to make a bearish continuation towards the 1st support.
The 1st support level at 0.8520 is identified as a multi-swing-low support that aligns with the 100.00% Fibonacci projection level. Further below, the 2nd support level at 0.8449 is noted as a swing-low support that aligns close to the 78.60% Fibonacci projection level, further reinforcing its importance as a key support level.
To the upside, the 1st resistance level at 0.8558 is identified as an overlap resistance. Higher up, the 2nd resistance level at 0.8638 is also marked as an overlap resistance that aligns with the 38.20% Fibonacci retracement level, suggesting a potential barrier for further upside movement.
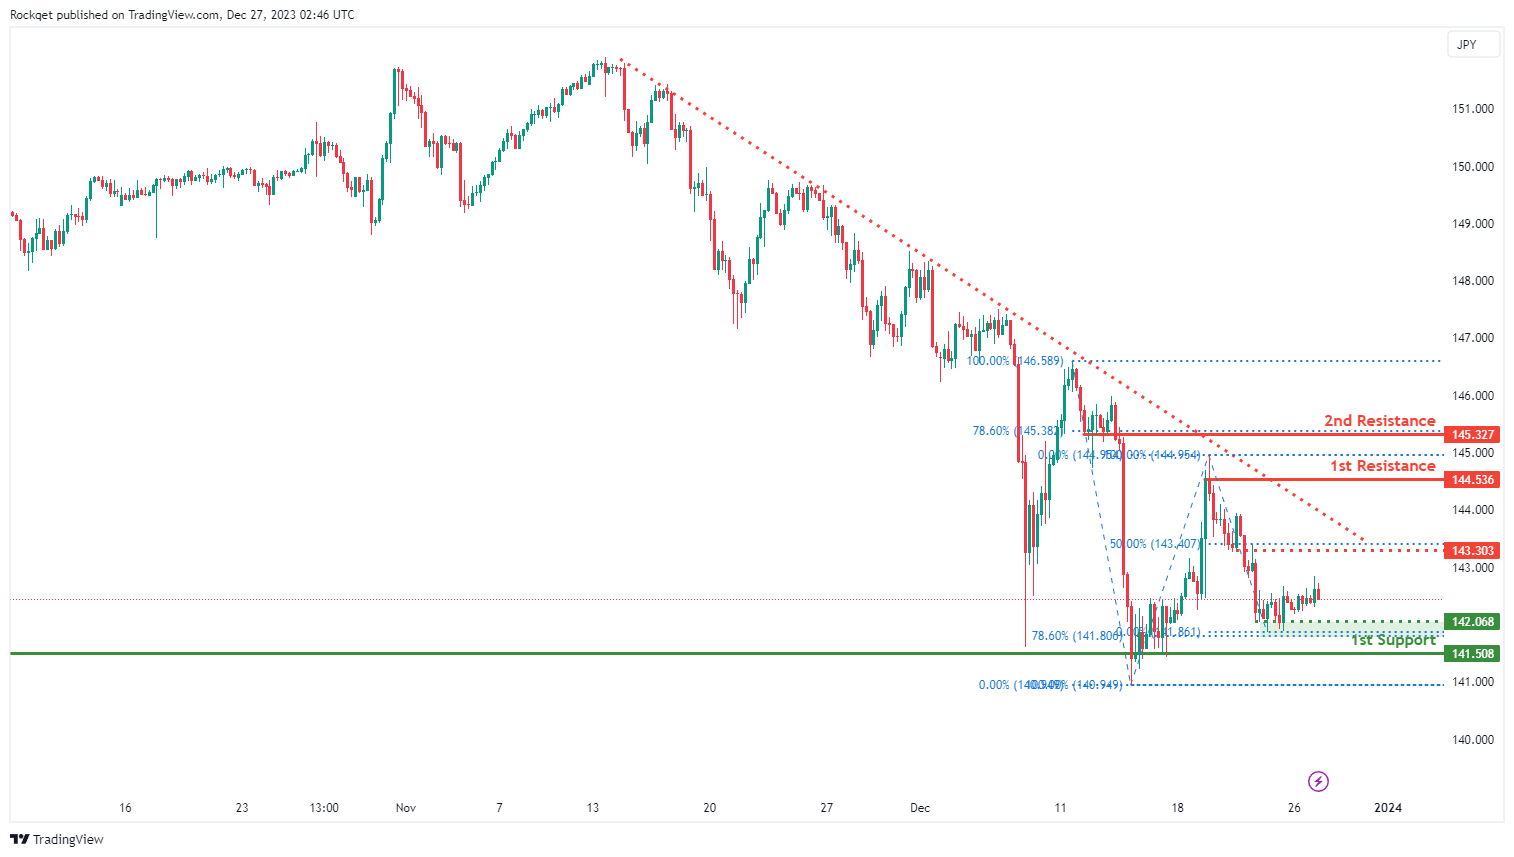
USD/JPY:
The USD/JPY chart currently exhibits an overall bearish momentum. In this context, there is a potential for price to break under the intermediate support and drop towards the 1st support.
The intermediate support level at 142.06 is identified as a pullback support that aligns close to the 78.60% Fibonacci retracement level. Further below, the 1st support level at 141.50 is noted as a multi-swing-low support, further reinforcing its importance as a key support level.
To the upside, the intermediate resistance level at 143.30 is identified as a pullback resistance that aligns with the 50.00% Fibonacci retracement level while the 1st resistance level at 144.53 is noted as a swing-high resistance. Higher up, the 2nd resistance level at 145.32 is marked as a pullback resistance that aligns with the 78.60% Fibonacci retracement level, suggesting a potential barrier for further upside movement.
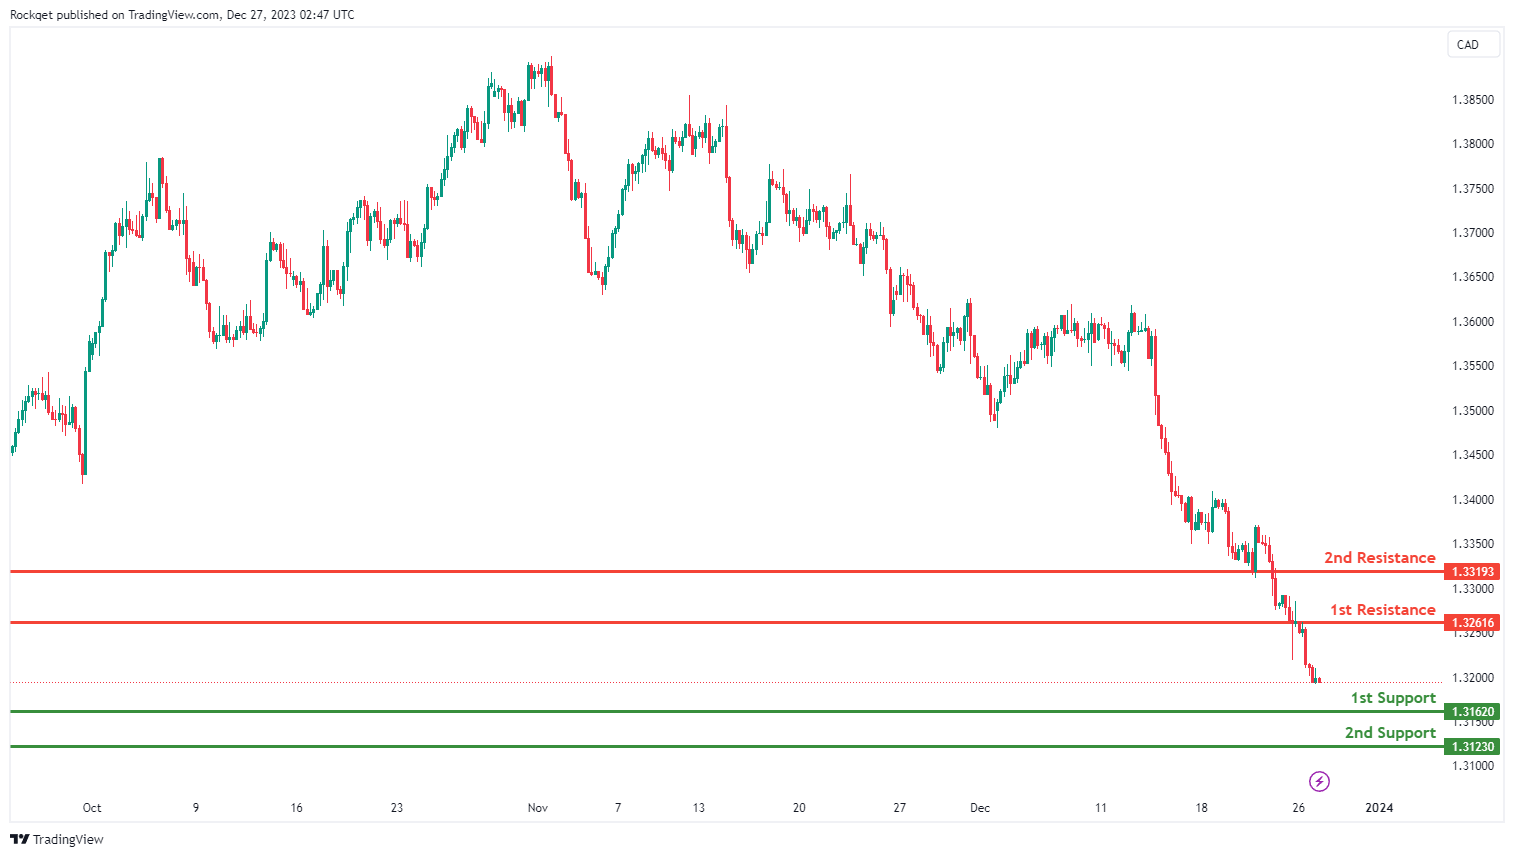
USD/CAD:
The USD/CAD chart currently exhibits an overall bearish momentum. In this context, there is a potential scenario for price to make a bearish continuation towards the 1st support.
The 1st support level at 1.3162 is identified as a multi-swing-low support. Further below, the 2nd support level at 1.3123 is noted as a swing-low support, further reinforcing its importance as a key support level.
To the upside, the 1st resistance level at 1.3261 is identified as an overlap resistance. Higher up, the 2nd resistance level at 1.3319 is marked as a pullback resistance, suggesting a potential barrier for further upside movement.
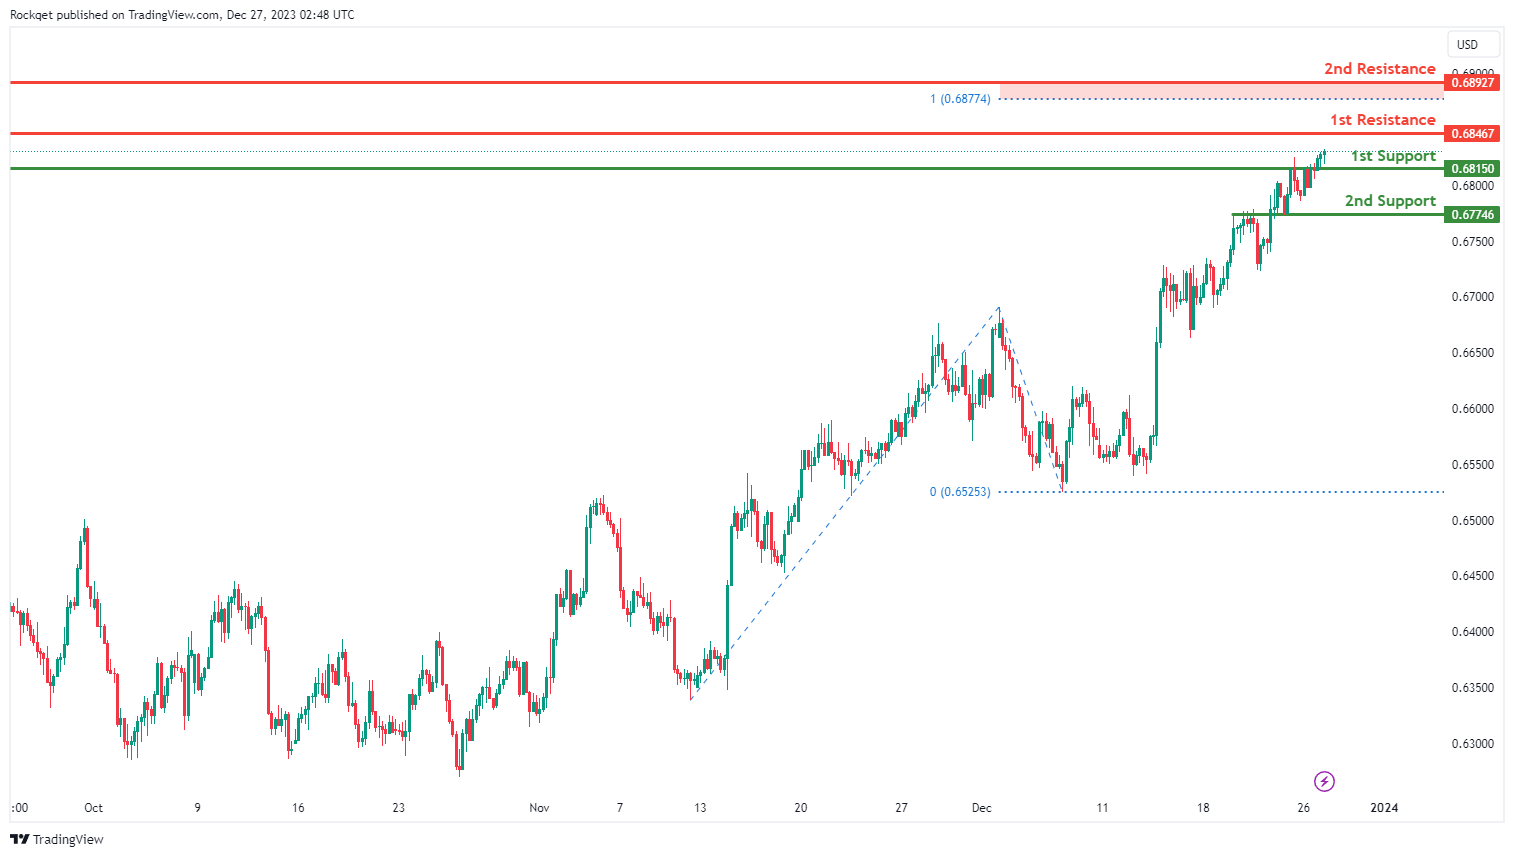
AUD/USD:
The AUD/USD chart currently exhibits an overall bullish momentum. In this context, there is a potential scenario for price to make a bullish continuation towards the 1st resistance.
The 1st resistance level at 0.6846 is identified as a swing-high resistance. Higher up, the 2nd resistance level at 0.6892 is noted as a multi-swing-high resistance that aligns close to the 100.00% Fibonacci projection level, indicating its potential significance as a barrier for further upward movement.
To the downside, the 1st support level at 0.6815 is identified as an overlap support. Further below, the 2nd support level at 0.6774 is also marked as an overlap support, further reinforcing its importance as a key support level.
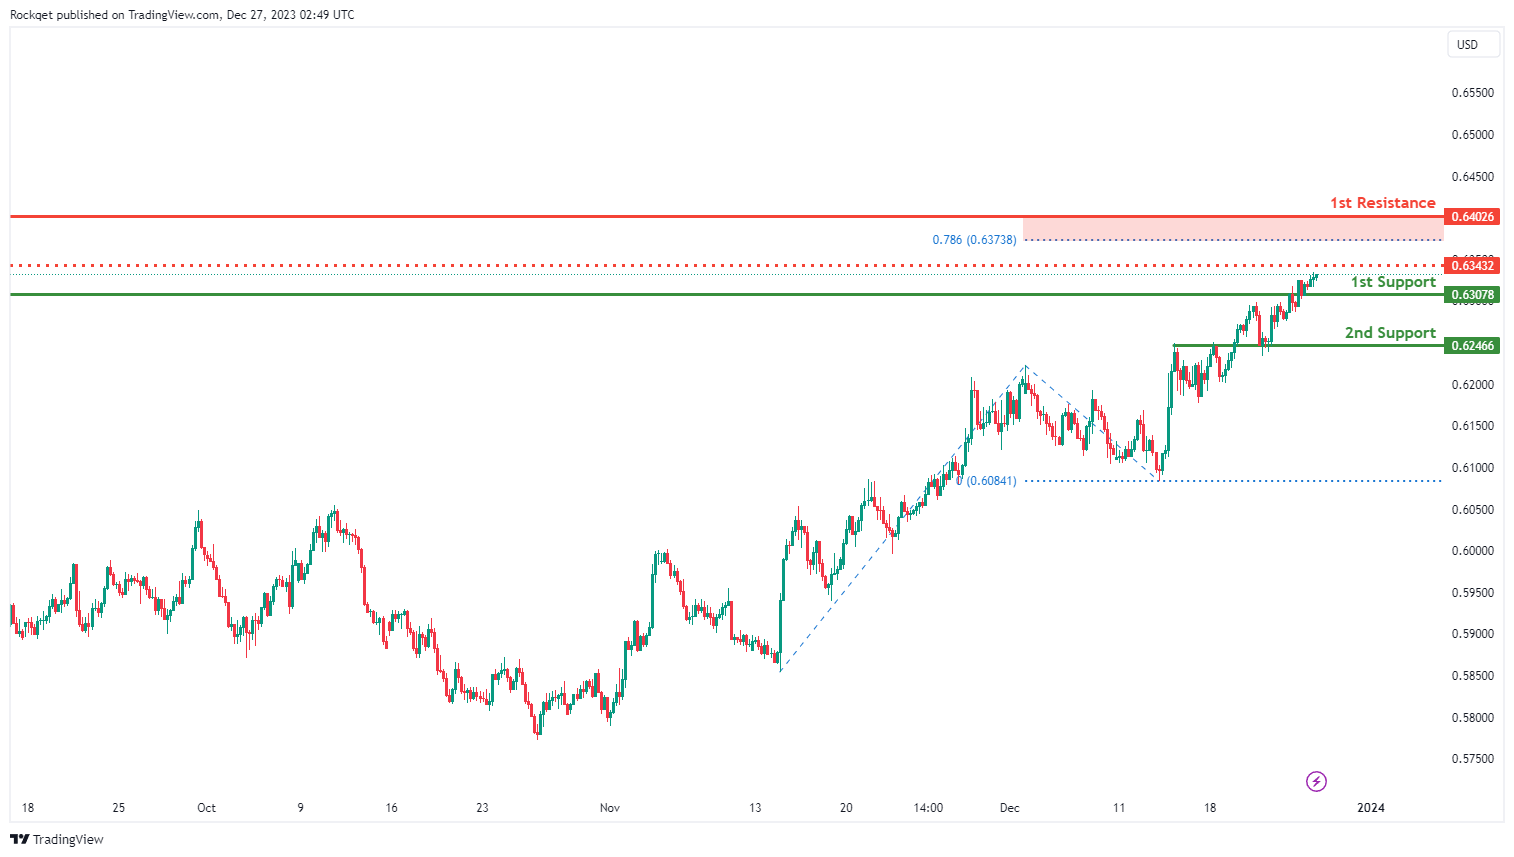
NZD/USD
The NZD/USD chart currently exhibits an overall bullish momentum. In this context, there is a potential scenario for price to make a bullish continuation towards the 1st resistance.
The intermediate resistance level at 0.6343 is identified as a pullback resistance. Higher up, the 1st resistance level at 0.6402 is marked as a swing-high resistance that aligns close to the 78.60% Fibonacci projection level, indicating its potential significance as a barrier for further upward movement.
To the downside, the 1st support level at 0.6307 is identified as an overlap support. Further below, the 2nd support level at 0.6246 is also noted as an overlap support, further reinforcing its importance as a key support level.
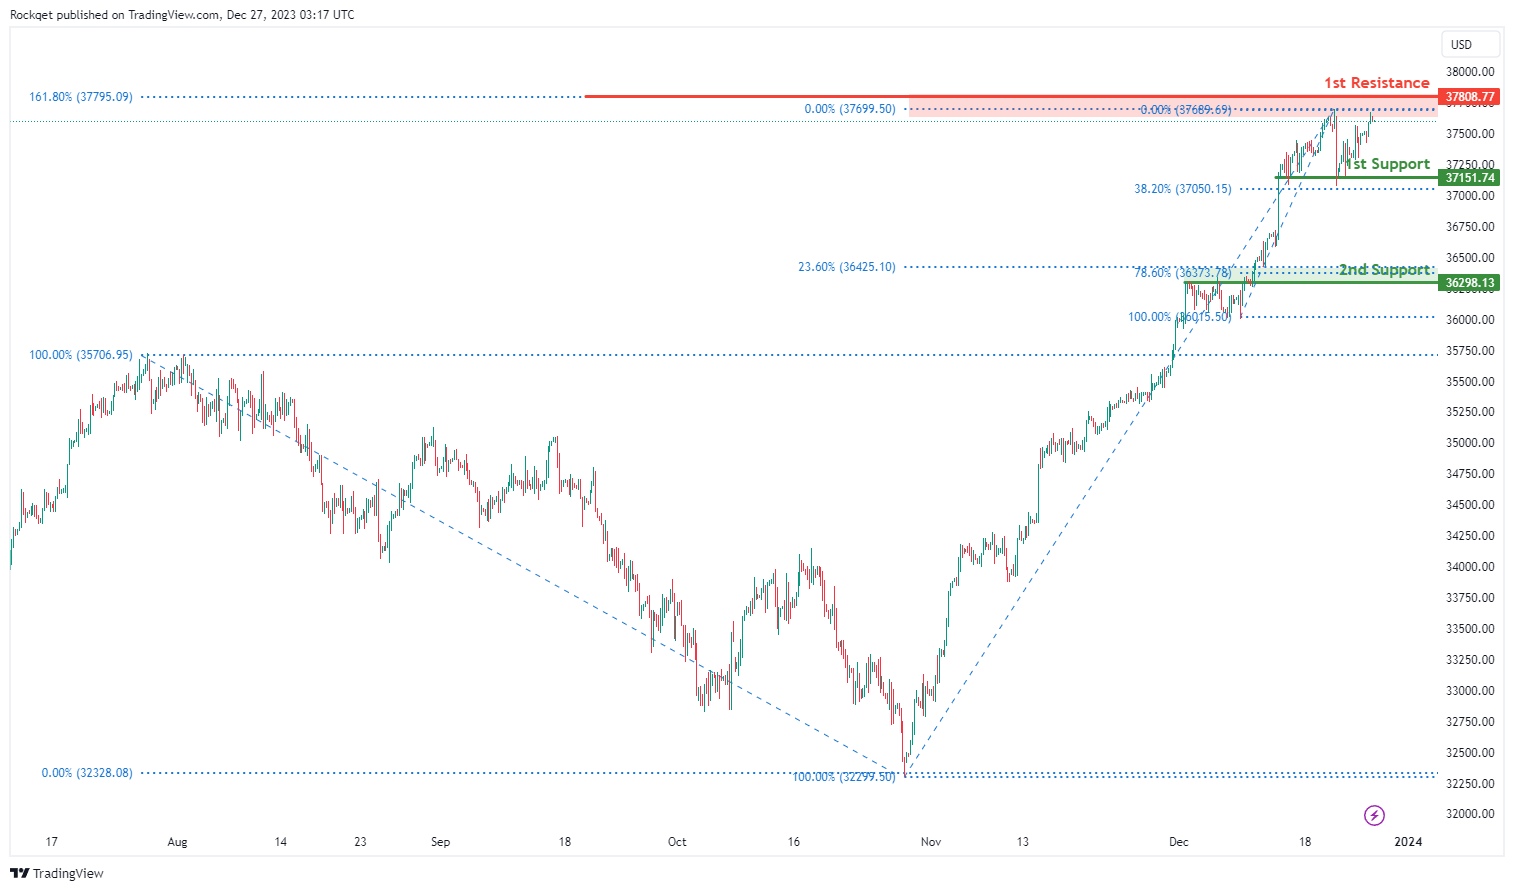
DJ30:
The DJ30 chart currently exhibits a bullish overall momentum, suggesting a potential scenario for a bullish continuation towards the 1st resistance.
The 1st support at 37151.74 is considered significant as it represents an overlap support and is associated with the 38.20% Fibonacci Retracement. This level indicates a historical area where buying interest has been present and adds a layer of potential support to the chart.
Additionally, the 2nd support at 36298.13 is identified as another overlap support and is associated with the 23.60% Fibonacci Retracement and the 78.60% Fibonacci Retracement, providing additional layers of potential support for the index.
On the resistance side, the 1st resistance at 37808.77 is linked to the 161.80% Fibonacci Extension, indicating a level where selling interest could intensify. This level represents a potential target for traders expecting a bullish continuation.
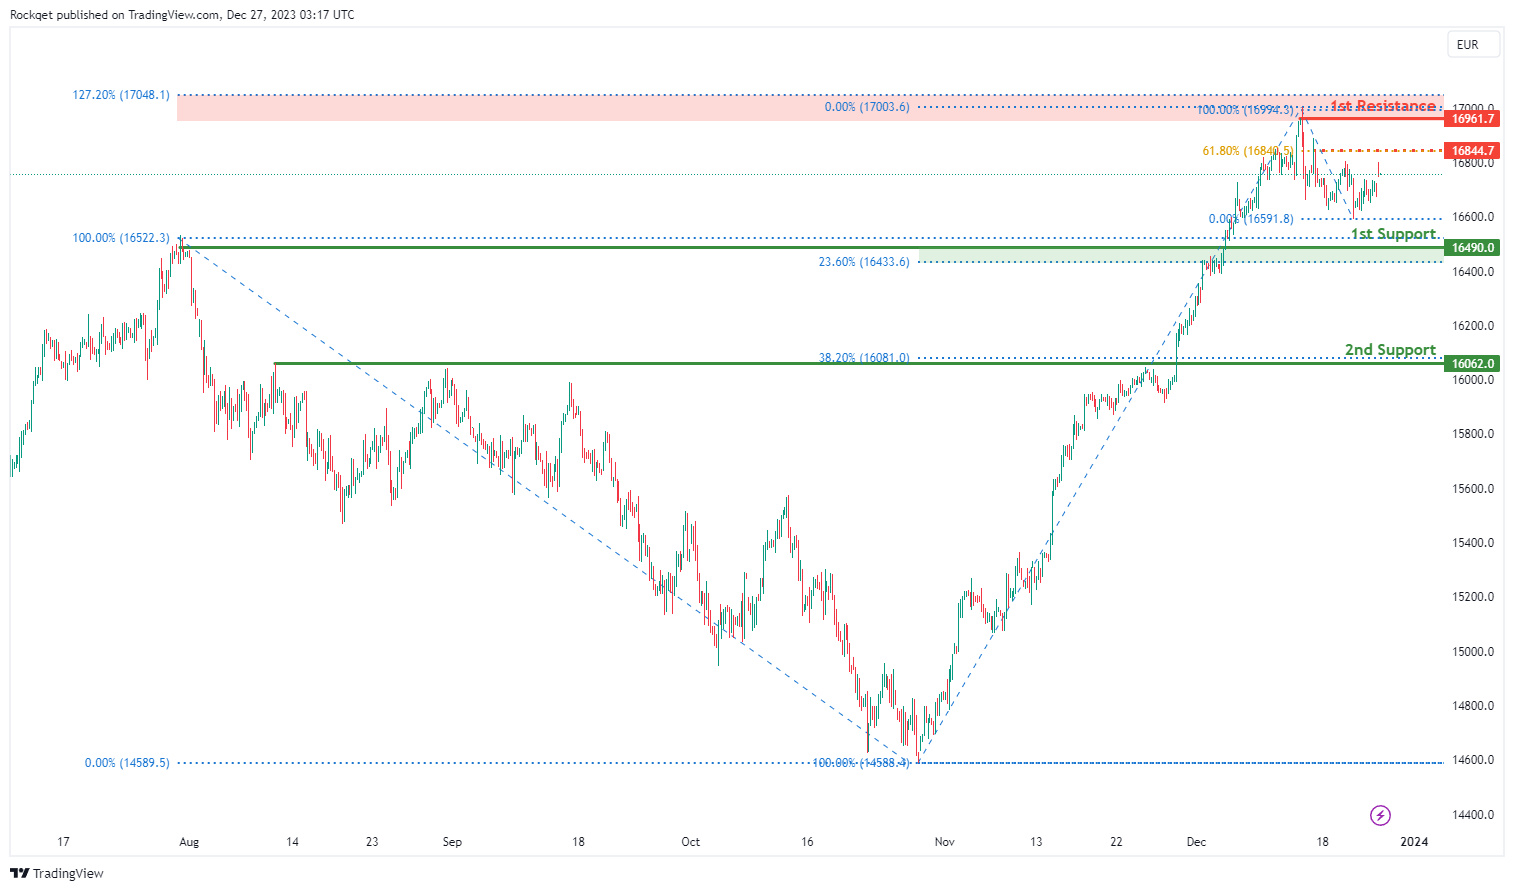
GER40:
The GER40 chart currently exhibits a weak bullish overall momentum with low confidence, suggesting a potential bullish continuation towards the 1st resistance.
The 1st support at 16490.00 is considered significant as it represents an overlap support and is associated with the 23.60% Fibonacci Retracement, indicating a historical area where buying interest has been present.
Additionally, the 2nd support at 16062.00 is identified as pullback support and is linked to the 38.20% Fibonacci Retracement, providing an additional layer of potential support for the index.
On the resistance side, the intermediate resistance at 16844.70 is associated with pullback resistance and the 61.80% Fibonacci Retracement, possibly acting as a barrier for further upward movement.
The 1st resistance at 16961.70 is marked as a swing high resistance and is correlated with the 127.20% Fibonacci Extension, serving as a potential target for bullish continuation.
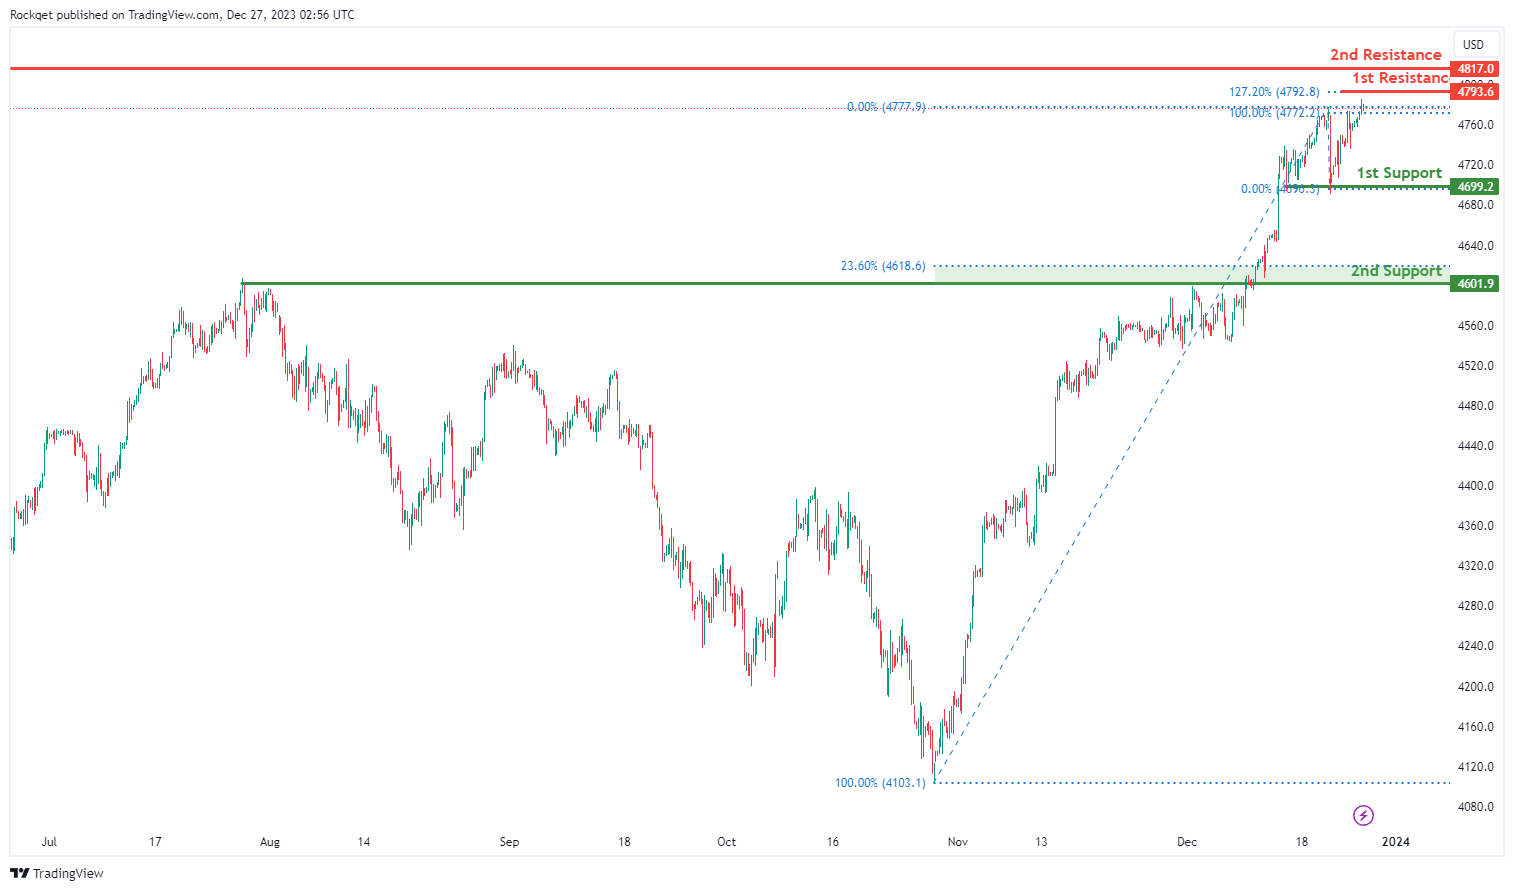
US500:
The US500 chart currently exhibits a bullish overall momentum, indicating a potential scenario for a bullish continuation towards the 1st resistance.
The 1st support at 4699.2 is considered significant as it represents a multi-swing low support, suggesting a historical area where buying interest has been present.
Additionally, the 2nd support at 4601.9 is identified as an overlap support and is associated with the 23.60% Fibonacci Retracement, providing an additional layer of potential support for the index.
On the resistance side, the 1st resistance at 4793.6 is linked to the 127.20% Fibonacci Extension, indicating a level where selling interest could intensify.
Furthermore, the 2nd resistance at 4817.0 is marked as a swing high resistance and is correlated with the 161.80% Fibonacci Extension, serving as a potential target for bullish continuation.
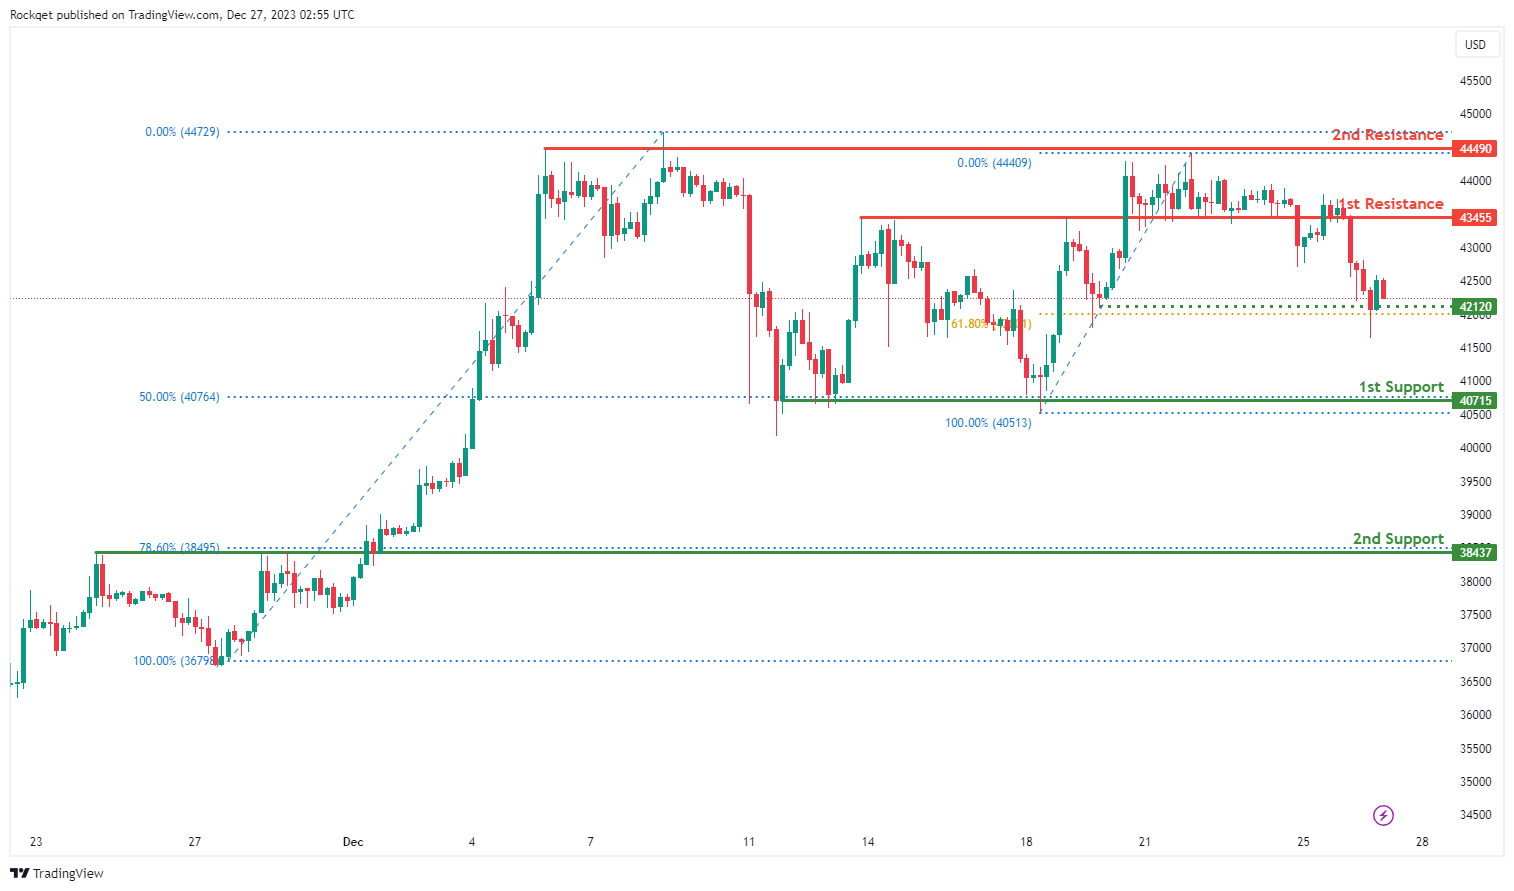
BTC/USD:
The BTC/USD chart currently displays a neutral overall momentum, suggesting a potential scenario for price to fluctuate between the 1st resistance and 1st support levels.
The 1st support at 40715 is considered significant as it represents a swing low support, indicating a historical area where buying interest has been present.
Additionally, the 2nd support at 38437 is identified as an overlap support and is associated with the 78.60% Fibonacci Retracement, providing an additional layer of potential support for the cryptocurrency.
On the resistance side, the 1st resistance at 43455 is marked as an overlap resistance, representing a level where selling interest could emerge.
Furthermore, the 2nd resistance at 44490 is associated with multi-swing high resistance, presenting a potential barrier for upward movement.
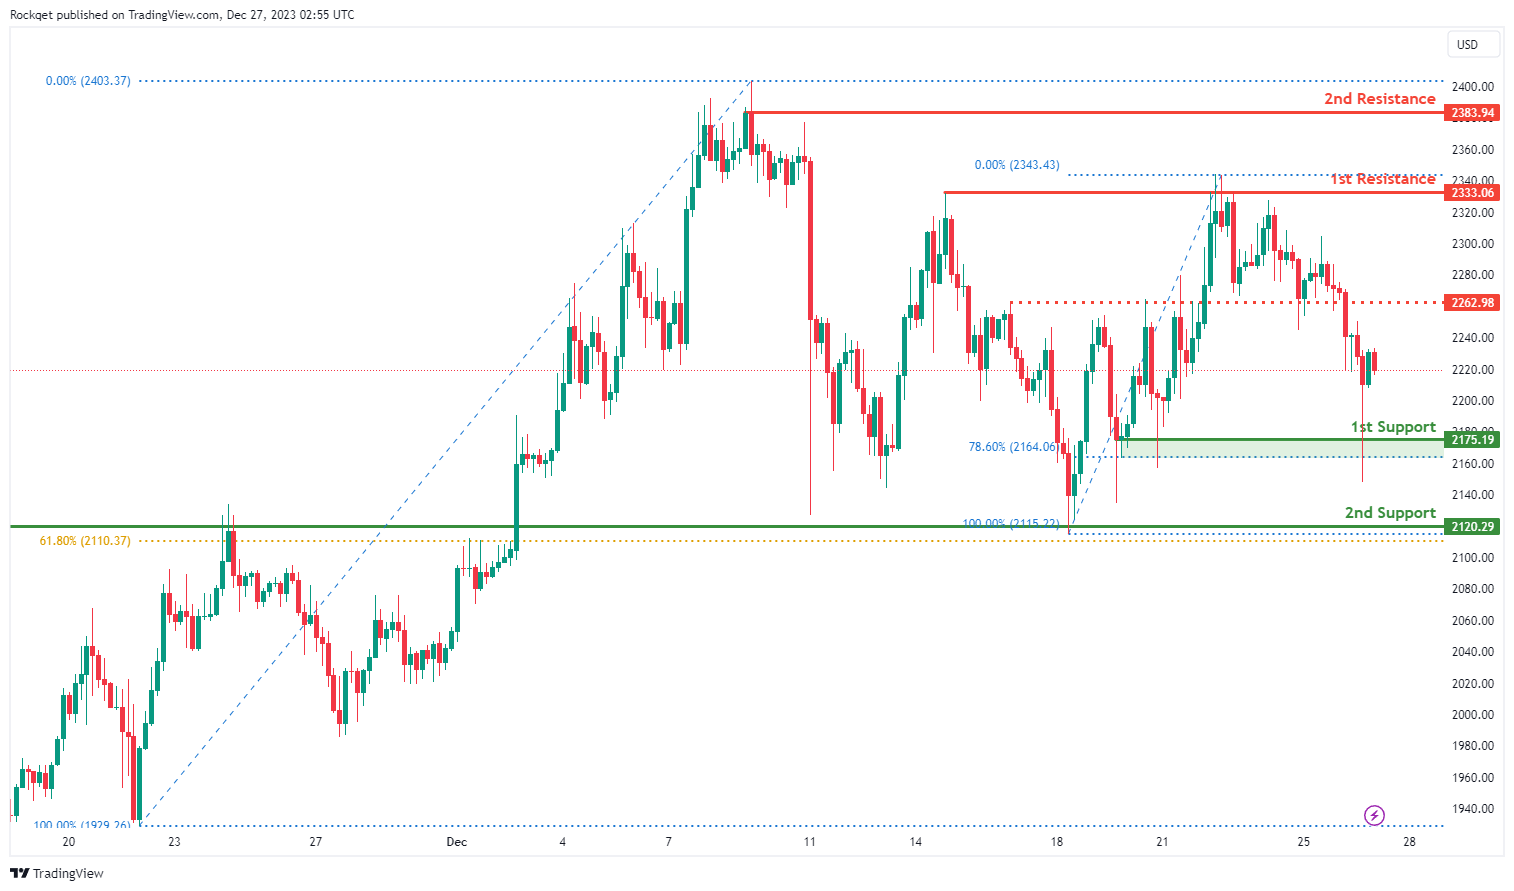
ETH/USD:
The ETH/USD chart currently exhibits a bullish overall momentum, suggesting a potential scenario for a bullish continuation towards the 1st resistance.
The 1st support at 2175.19 is considered significant as it represents a pullback support and is associated with the 78.60% Fibonacci Retracement, indicating a historical area where buying interest has been present.
Additionally, the 2nd support at 2120.29 is identified as a swing low support and is associated with the 61.80% Fibonacci Retracement, providing an additional layer of potential support for the cryptocurrency.
On the resistance side, the 1st resistance at 2333.06 is marked as a swing high resistance, representing a level where selling interest could intensify.
Furthermore, the 2nd resistance at 2383.94 is associated with another swing high resistance, presenting a potential barrier for upward movement. The intermediate resistance at 2262.98 is identified as an overlap resistance, further contributing to the potential bullish scenario.
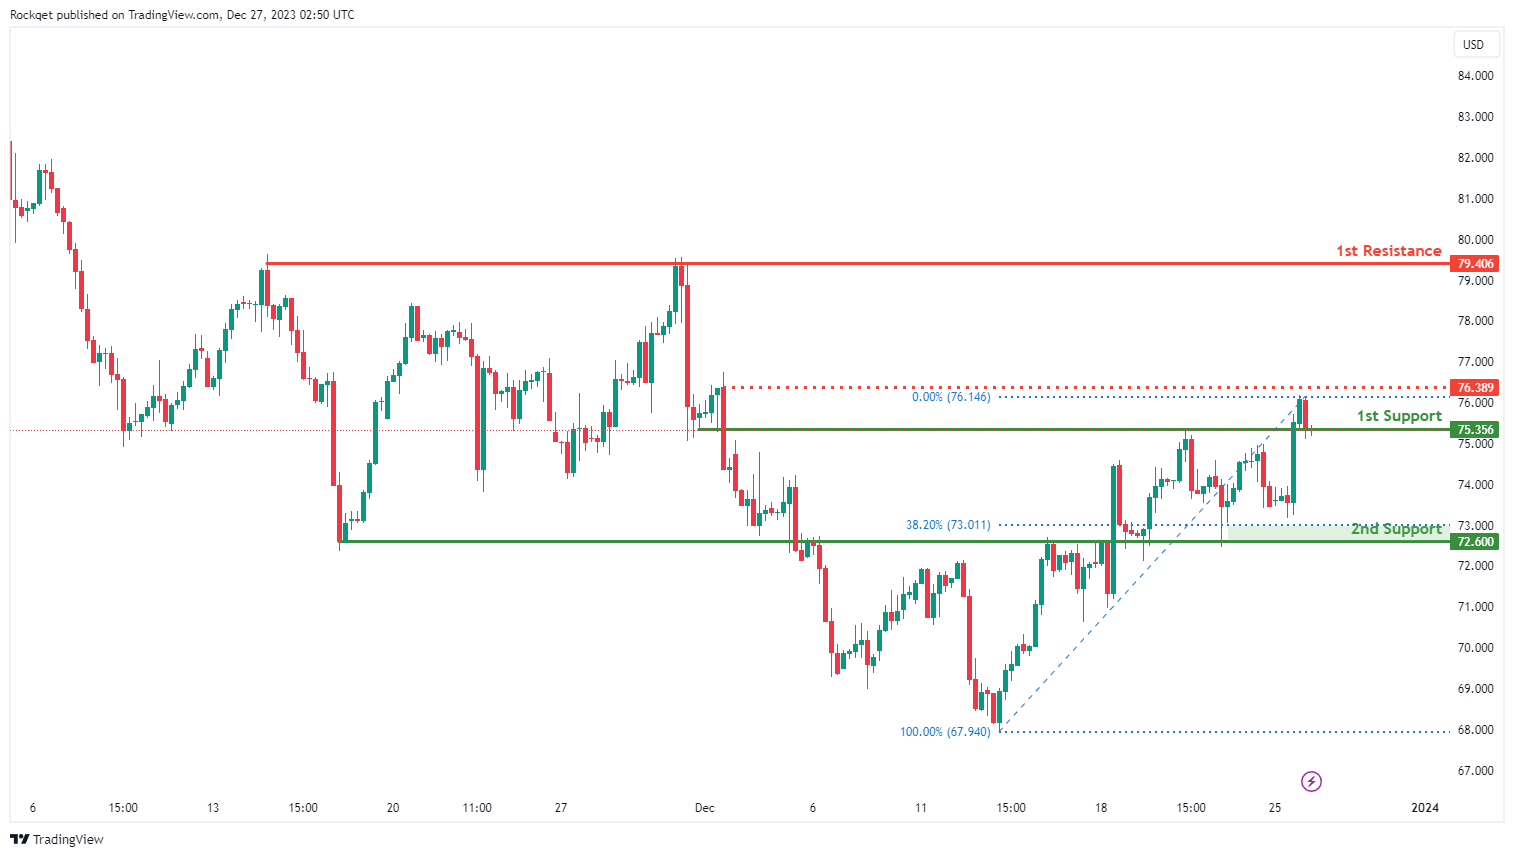
WTI/USD:
The WTI chart currently exhibits an overall bullish momentum, suggesting a prevailing uptrend. However, there is a potential scenario for price to fall towards the 1st support before resuming the uptrend.
The 1st support level at 75.35 is identified as an overlap support. Further below, the 2nd support level at 72.60 is also marked as an overlap support that aligns close to the 38.20% Fibonacci retracement level, reinforcing its importance as a key support level.
To the upside, the intermediate resistance level at 76.38 is identified as a pullback resistance. Higher up, the 1st resistance level at 79.40 is noted as a multi-swing-high resistance, further indicating its potential significance as a barrier for further upward movement.
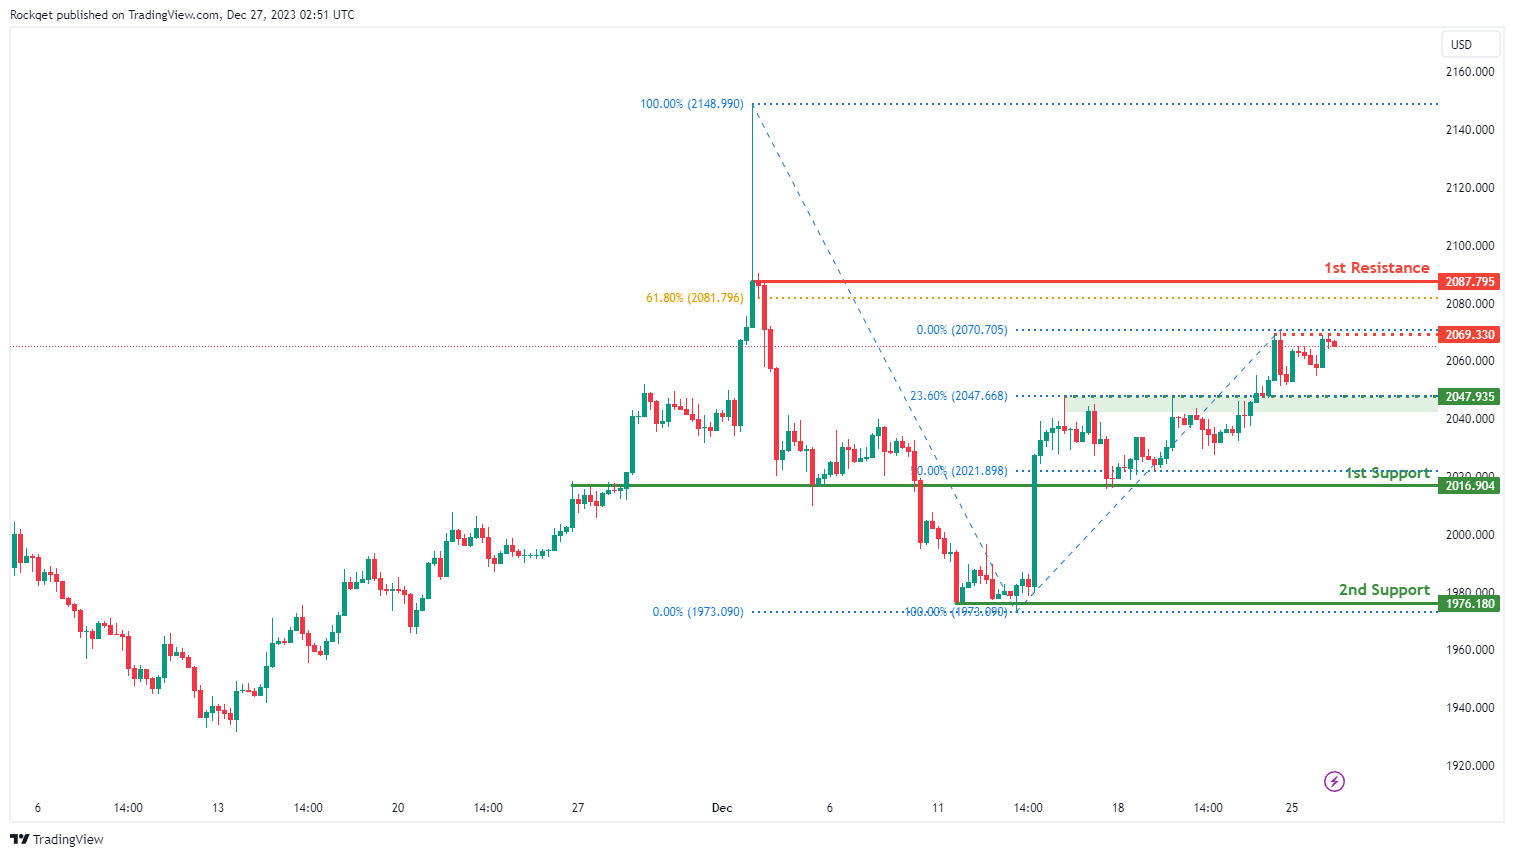
XAU/USD (GOLD):
The XAU/USD chart currently demonstrates a bullish momentum, indicating a potential for price to break above the intermediate resistance and make a bullish continuation towards the 1st resistance.
The intermediate resistance level at 2,069.33 is identified as a pullback resistance. Higher up, the 1st resistance level at 2,087.79 is also marked as a pullback resistance that aligns close to the 61.80% Fibonacci retracement level, further indicating its potential significance as a barrier for further upward movement.
To the downside, the intermediate support level at 2,047.93 is identified as a pullback support that aligns with the 23.60% Fibonacci retracement level while the 1st support level at 2,016.90 is marked as an overlap support that aligns close to the 50.00% Fibonacci retracement level. Further below, the 2nd support level at 1,976.18 is noted as a pullback support, reinforcing its importance as a key support level.