
Sample Category Title
Technical Outlook and Review
DXY:
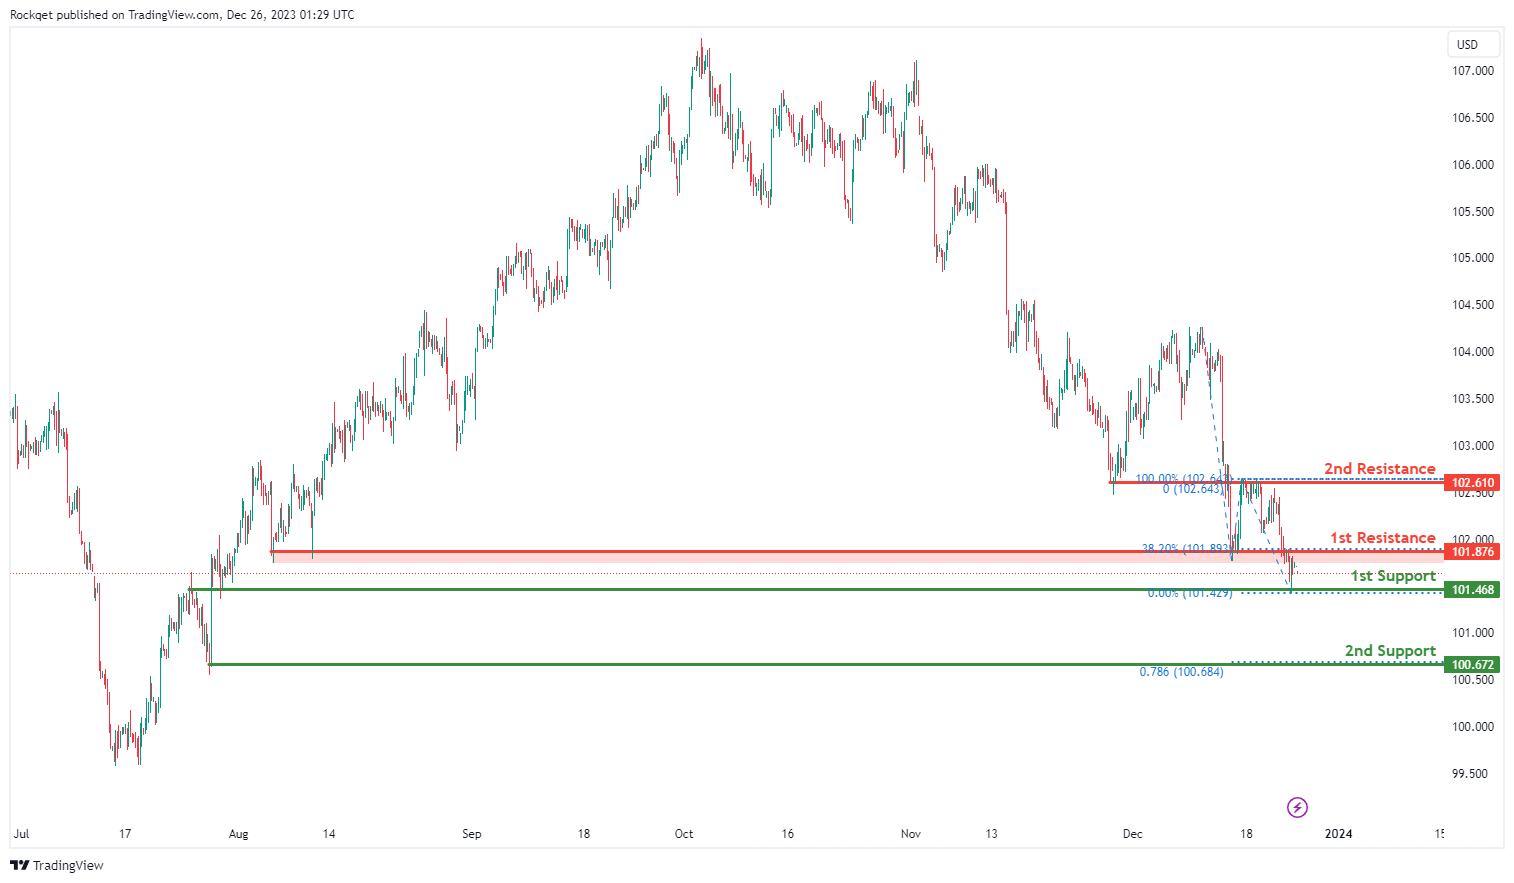
The DXY (US Dollar Index) chart currently shows an overall bearish momentum, indicating a potential for price to make a bearish continuation towards the 1st support.
The 1st support level at 101.46 is identified as an overlap support. Further below, the 2nd support level at 100.67 is noted as a swing-low support that aligns with the 78.60% Fibonacci projection level, further reinforcing its importance as a potential key support level.
To the upside, the 1st resistance level at 101.87 is identified as an overlap resistance that aligns with the 38.20% Fibonacci retracement level. Higher up, the 2nd resistance level at 102.61 is also marked as an overlap resistance, suggesting a potential barrier for further upside movement.
EUR/USD:
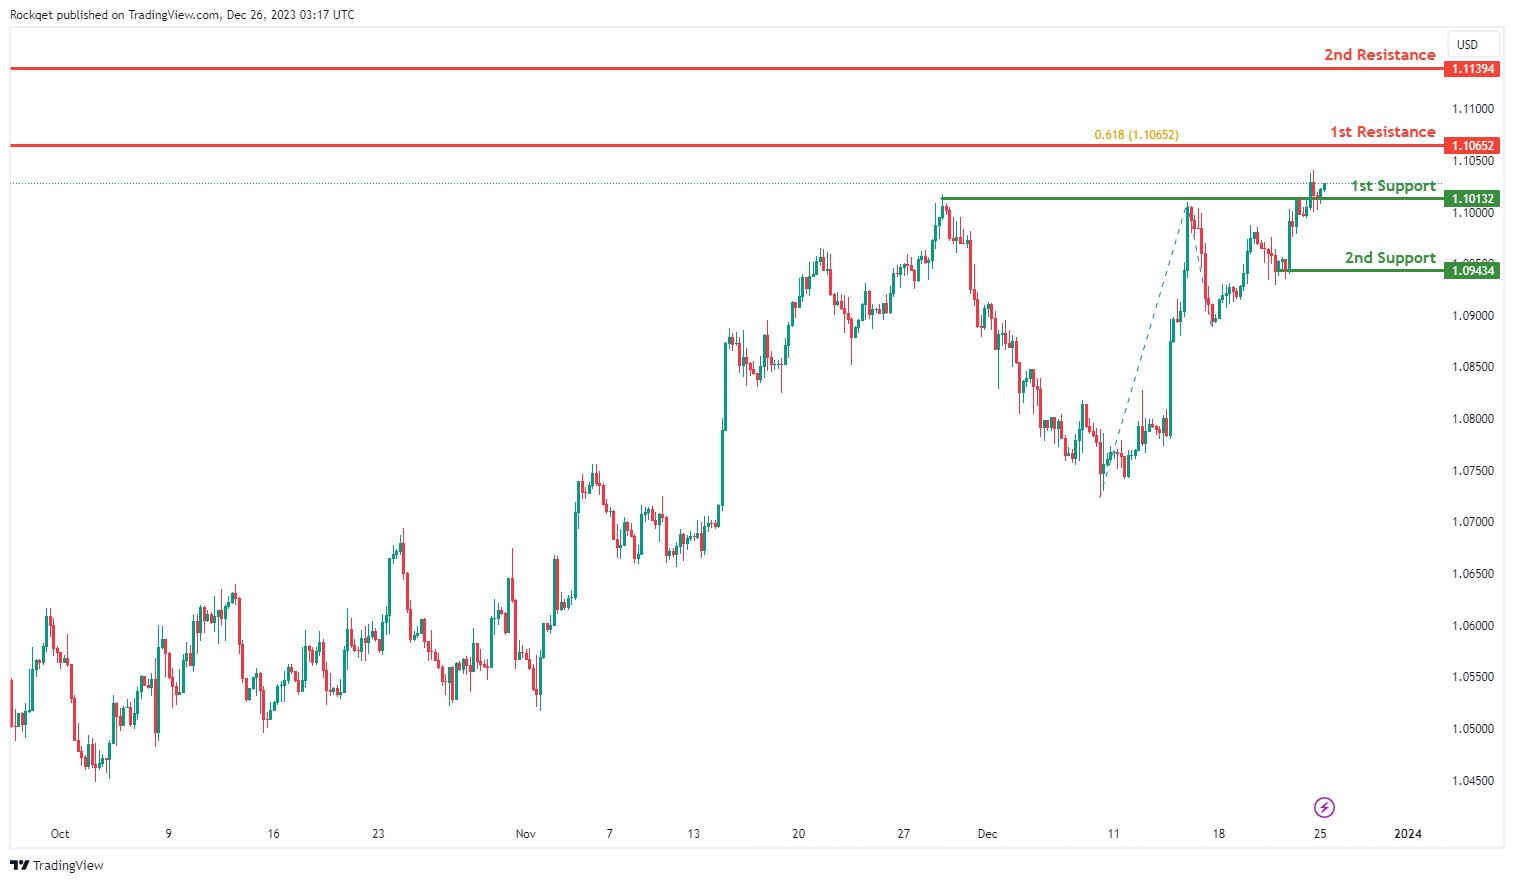
The EUR/USD chart currently exhibits an overall bullish momentum. In this context, there is a potential scenario for price to make a bullish continuation towards the 1st resistance.
The 1st resistance level at 1.1065 is identified as a swing-high resistance that aligns with the 61.80% Fibonacci projection level. Higher up, the 2nd resistance level at 1.1139 is also noted as a swing-high resistance, suggesting a potential barrier for further upside movement.
To the downside, the 1st support level at 1.1013 is identified as an overlap support. Further below, the 2nd support level at 1.0943 is marked as a pullback support, further reinforcing its importance as a potential key support level.
EUR/JPY:
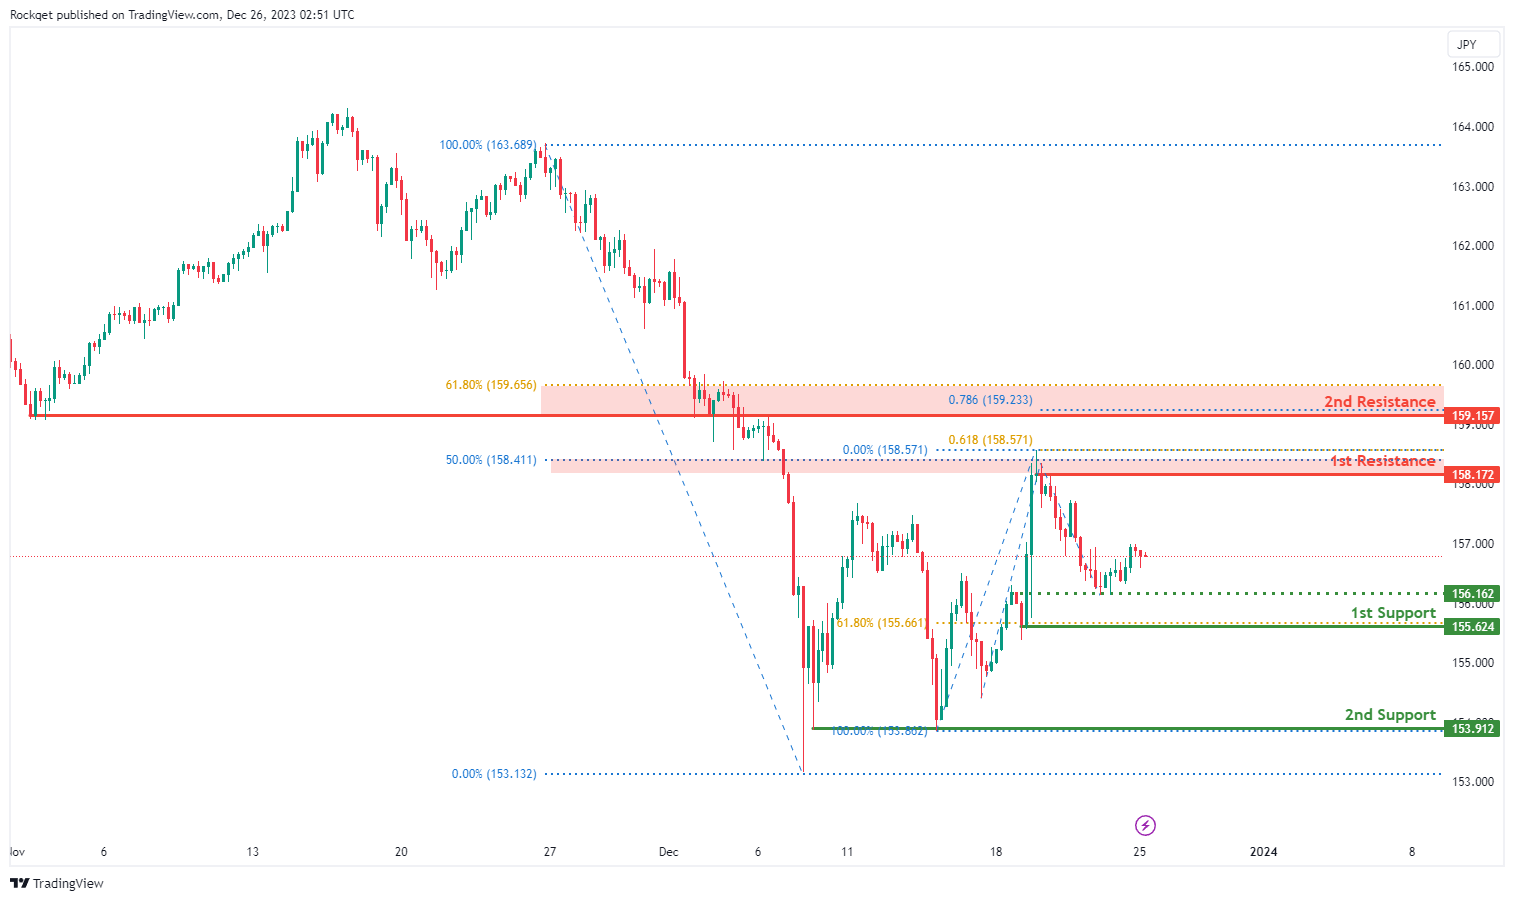
The EUR/JPY chart currently exhibits a bearish overall momentum, suggesting a potential scenario for a bearish continuation towards the 1st support.
The 1st support at 155.62 is identified as a pullback support and coincides with the 61.80% Fibonacci Retracement, indicating a historical area where buying interest has been present.
Additionally, the 2nd support at 153.91 is considered a multi-swing low support, providing an additional layer of potential support for the ongoing bearish trend.
On the resistance side, the 1st resistance at 158.17 is associated with a pullback resistance and aligns with the 61.80% Fibonacci Projection, highlighting a potential barrier where selling interest could intensify.
Furthermore, the 2nd resistance at 159.16 is linked to an overlap resistance and the 61.80% Fibonacci Retracement, adding extra layers of potential resistance for the price.
An intermediate support level at 156.62 is also identified, corresponding to an overlap support. This level may act as a potential area where buying interest could provide support for the price.
EUR/GBP:
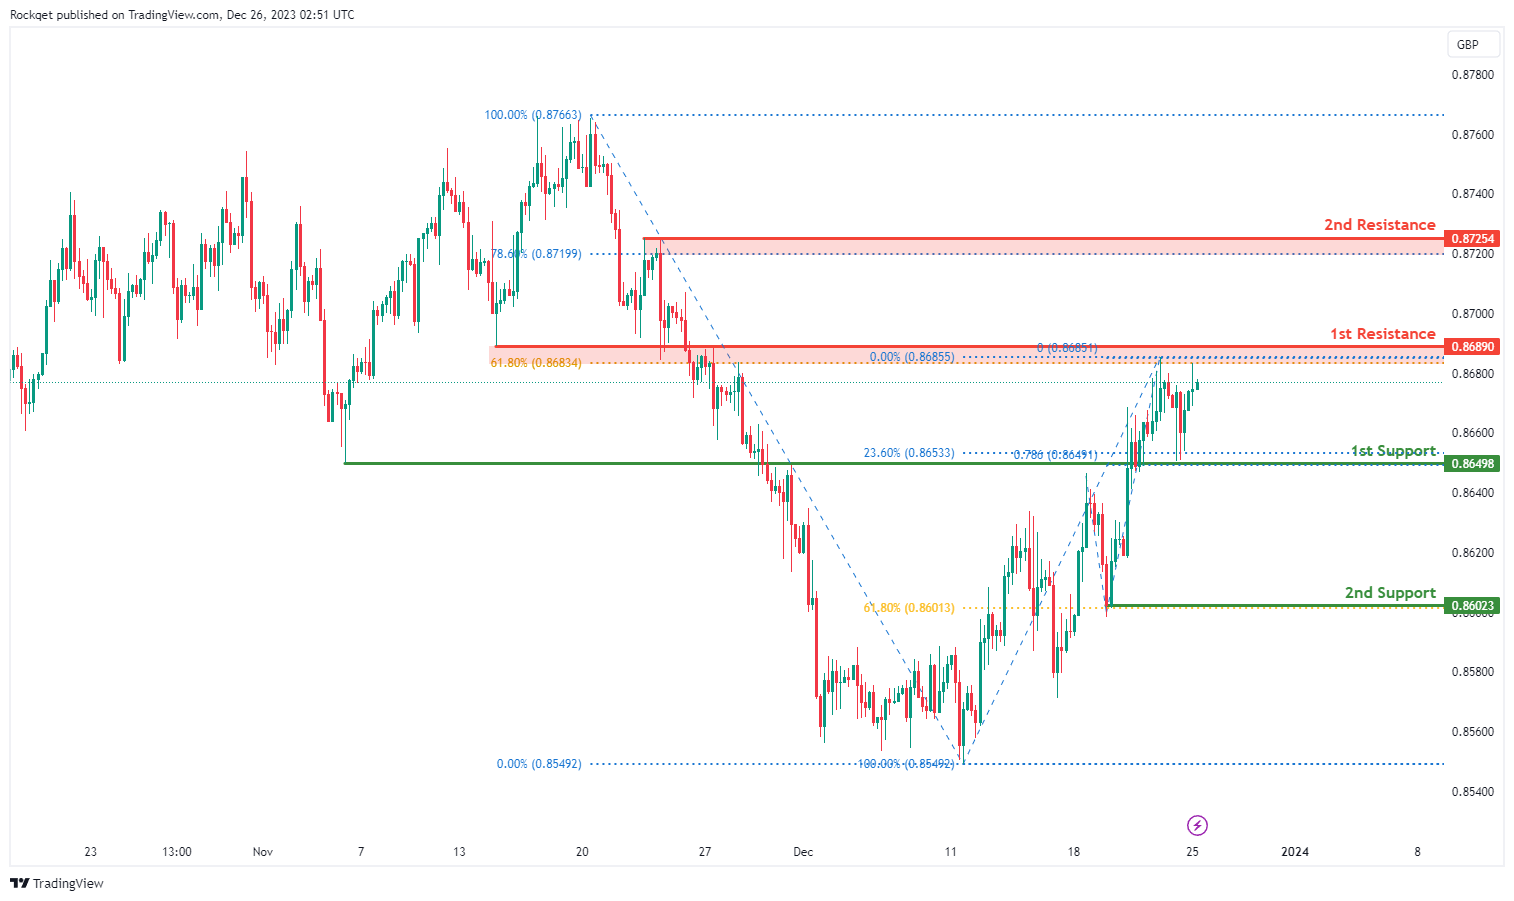
The EUR/GBP chart currently exhibits a bullish overall momentum, suggesting a potential scenario for a bullish continuation towards the 1st resistance.
The 1st support at 0.8650 is identified as an overlap support and coincides with the 23.60% Fibonacci Retracement, indicating a historical area where buying interest has been present.
Additionally, the 2nd support at 0.8602 is considered a pullback support, providing an additional layer of potential support for the ongoing bullish trend.
On the resistance side, the 1st resistance at 0.8689 is associated with an overlap resistance and the 61.80% Fibonacci Retracement, highlighting a potential area where selling interest could intensify.
Furthermore, the 2nd resistance at 0.8725 is linked to a pullback resistance and the 78.60% Fibonacci Retracement, adding extra layers of potential resistance for the price.
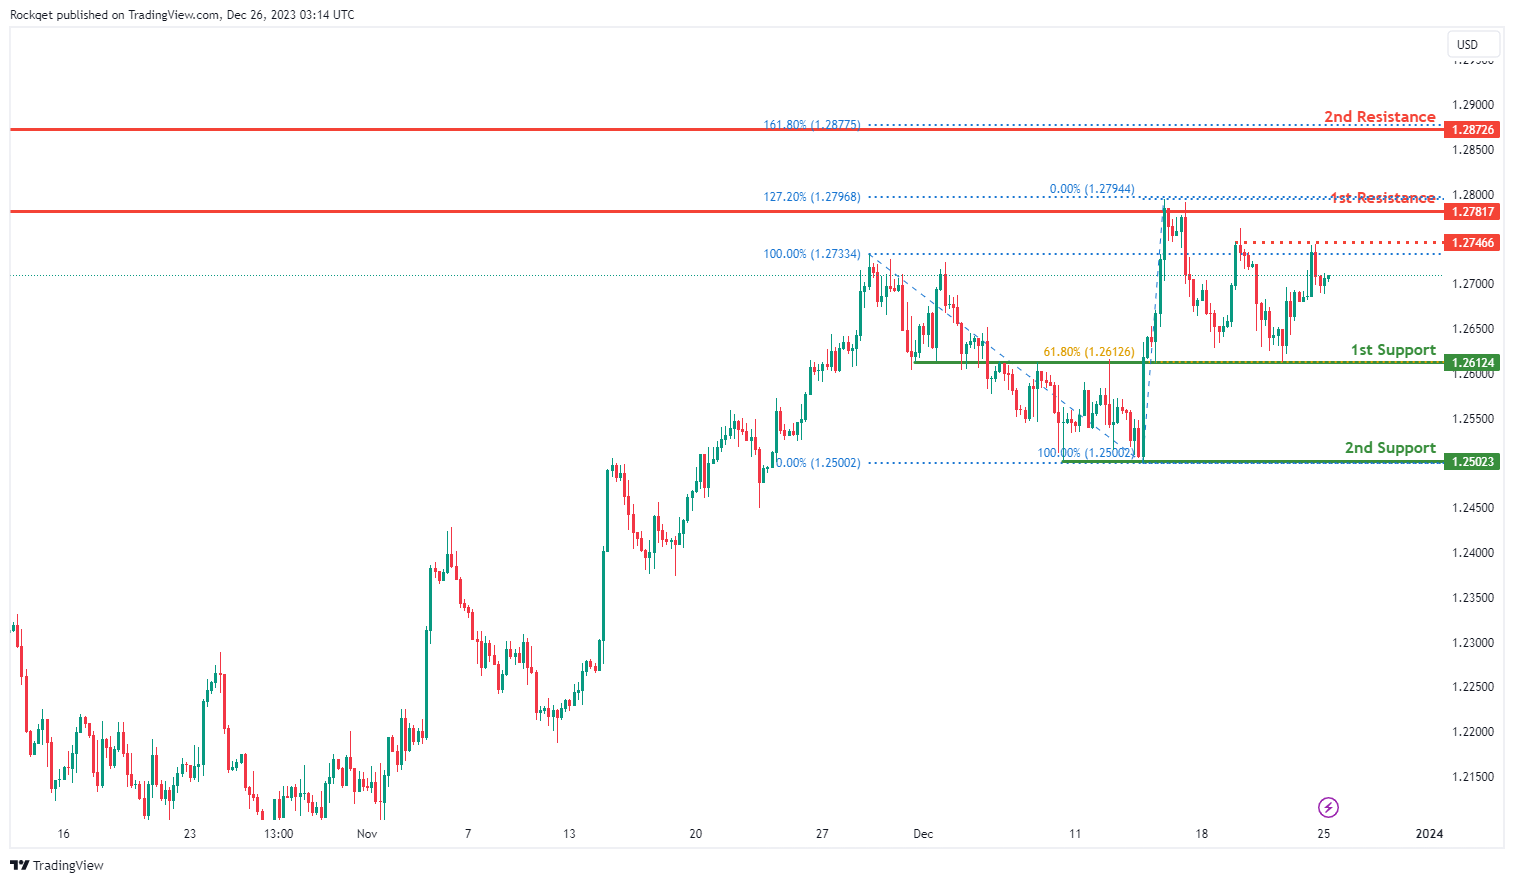
GBP/USD:
The GBP/USD chart currently exhibits a neutral bias. In this context, there is a potential scenario for price to fluctuate between the 1st support and the 1st resistance.
The 1st support level at 1.2612 is identified as an overlap support that aligns with the 61.80% Fibonacci retracement level. Further below, the 2nd support level at 1.2502 is marked as a swing-low support, further reinforcing its importance as a potential key support level.
To the upside, the intermediate resistance at 1.2746 is identified as a pullback support while the 1st resistance level at 1.2781 is identified as a multi-swing-high resistance that aligns with the 127.20% Fibonacci extension level. Higher up, the 2nd resistance level at 1.2872 is noted as a pullback resistance that aligns with the 161.80% Fibonacci extension level, suggesting a potential barrier for further upside movement.
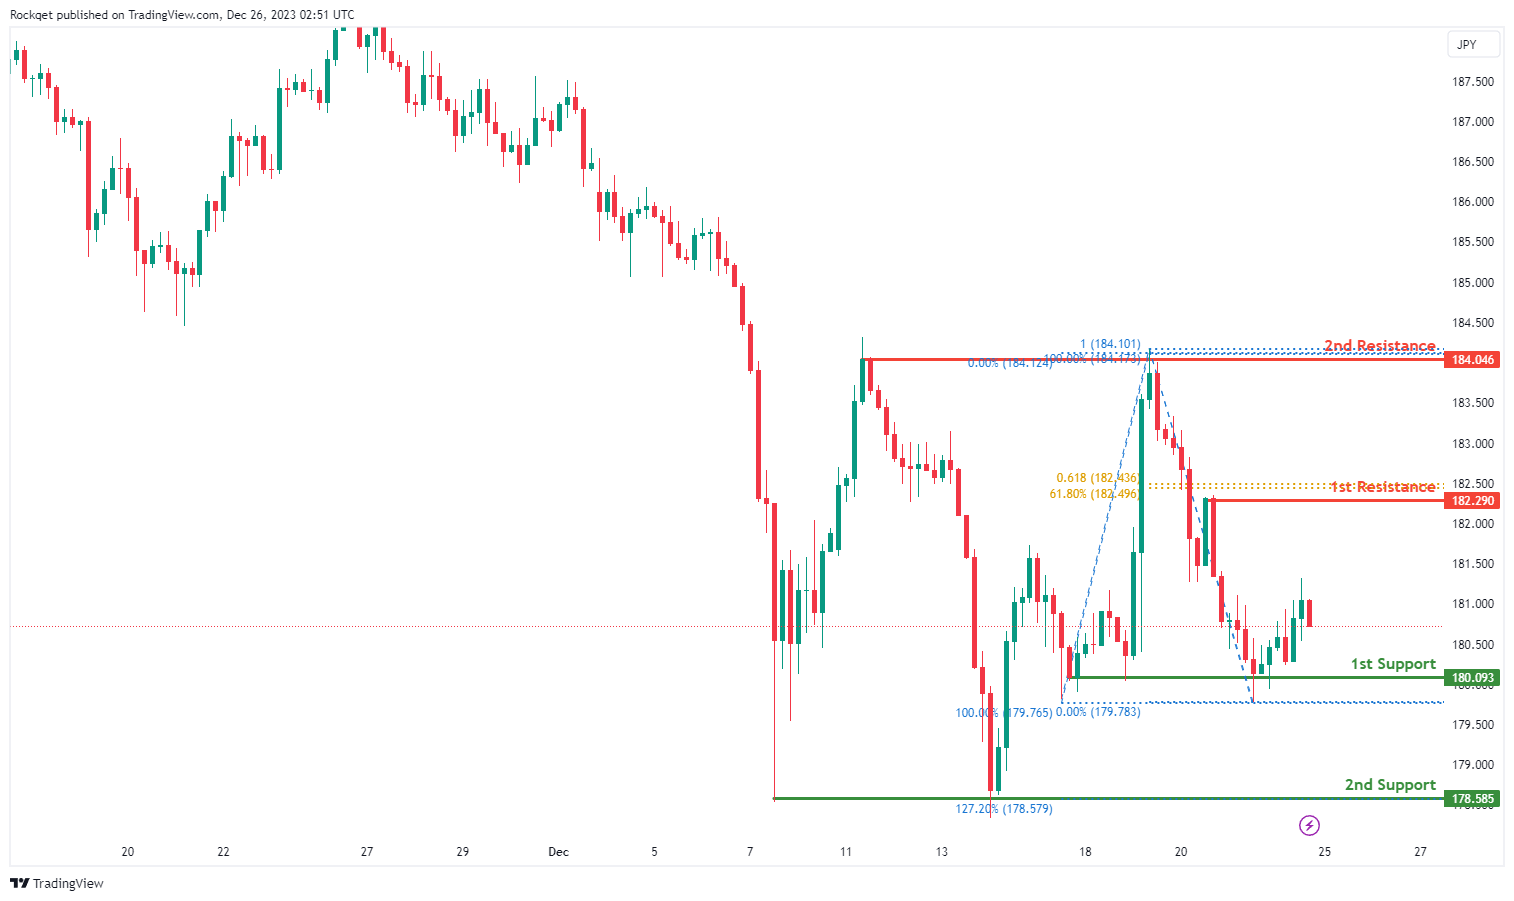
GBP/JPY:
The GBP/JPY chart currently displays a bearish overall momentum, indicating a potential scenario for a bearish continuation towards the 1st support.
The 1st support at 180.09 is considered significant as it represents a multi-swing low support and aligns with a Fibonacci projection, indicating a historical area where buying interest has been present.
Additionally, the 2nd support at 178.59 is identified as another multi-swing low support and coincides with the 127.20% Fibonacci Extension, providing an additional layer of potential support for the ongoing bearish trend.
On the resistance side, the 1st resistance at 182.29 is associated with a pullback resistance, the 61.80% Fibonacci Projection, and the 61.80% Fibonacci Retracement, highlighting a potential area where selling interest could intensify.
Furthermore, the 2nd resistance at 184.05 is linked to a multi-swing high resistance, adding an extra layer of potential resistance for the price.
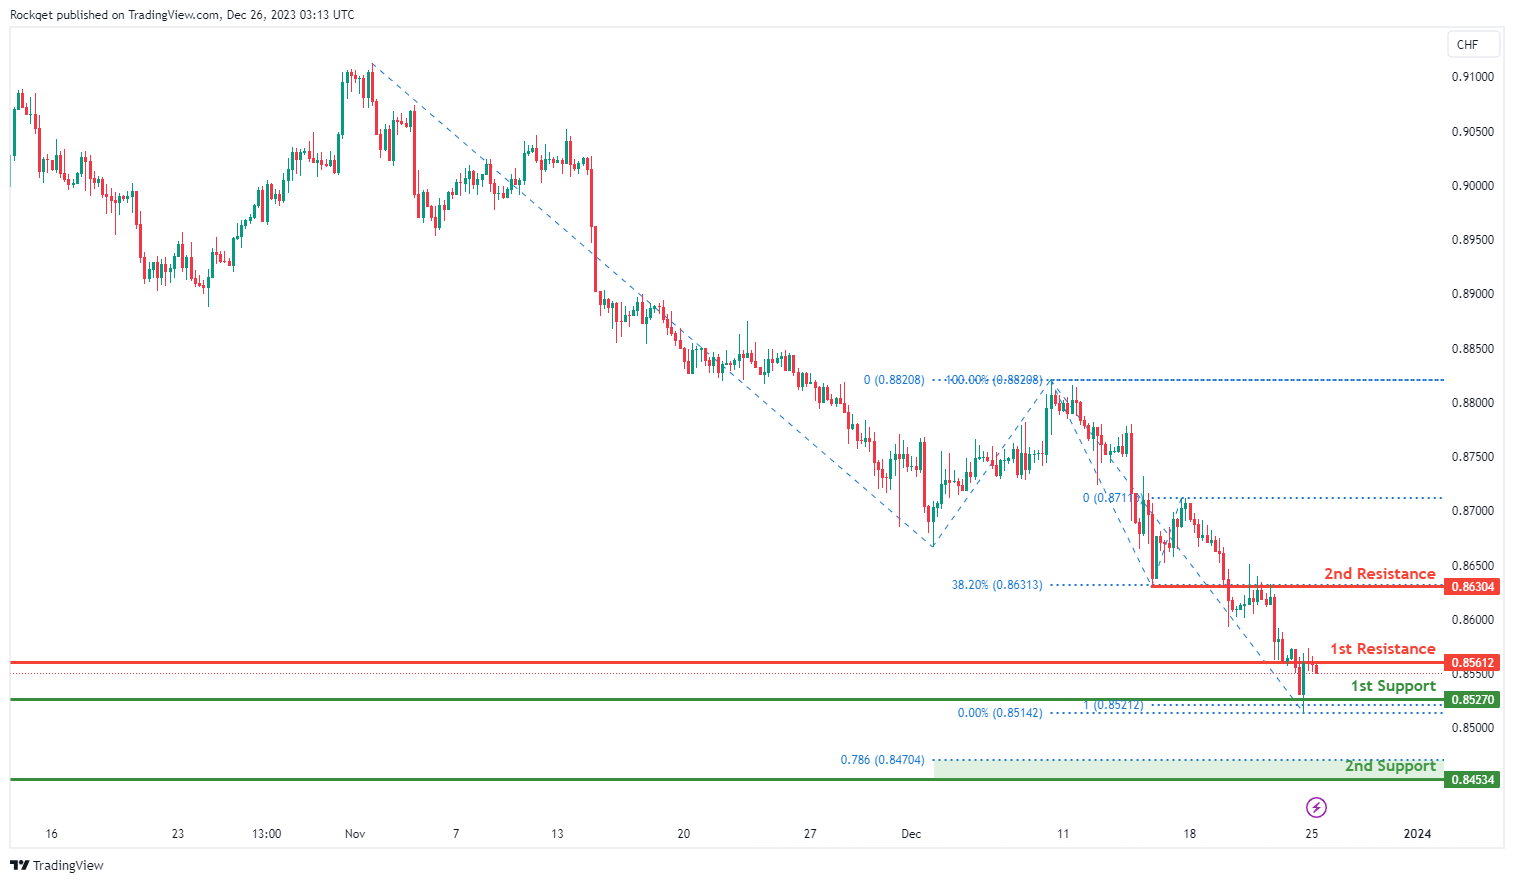
USD/CHF:
The USD/CHF chart currently exhibits an overall bearish momentum. In this context, there is a potential scenario for price to make a bearish continuation towards the 1st support.
The 1st support level at 0.8527 is marked as a multi-swing-low support that aligns with the 100.00% Fibonacci projection level. Further below, the 2nd support level at 0.8453 is noted as a swing-low support that aligns close to the 78.60% Fibonacci projection level, further reinforcing its importance as a key support level.
To the upside, the 1st resistance level at 0.8561 is identified as an overlap resistance. Higher up, the 2nd resistance level at 0.8630 is also marked as an overlap resistance that aligns with the 38.20% Fibonacci retracement level, suggesting a potential barrier for further upside movement.
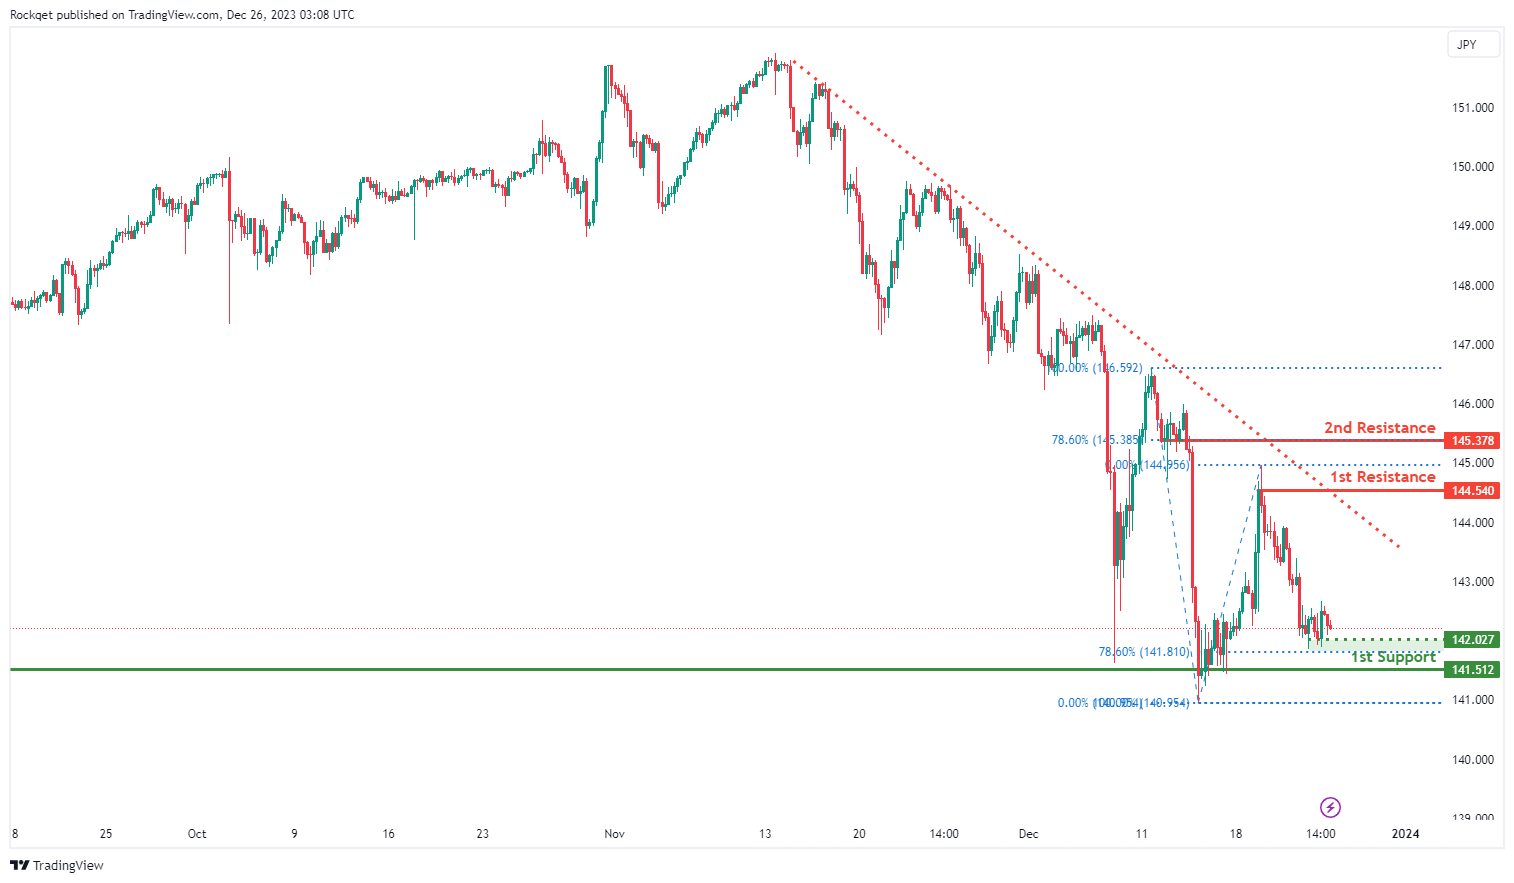
USD/JPY:
The USD/JPY chart currently exhibits an overall bearish momentum. In this context, there is a potential for price to break under the intermediate support and drop towards the 1st support.
The intermediate support level at 142.02 is identified as a pullback support that aligns close to the 78.60% Fibonacci retracement level. Further below, the 1st support level at 141.51 is noted as a multi-swing-low support, further reinforcing its importance as a key support level.
To the upside, the 1st resistance level at 144.54 is noted as a swing-high resistance. Higher up, the 2nd resistance level at 145.37 is marked as a pullback resistance that aligns with the 78.60% Fibonacci retracement level, suggesting a potential barrier for further upside movement.
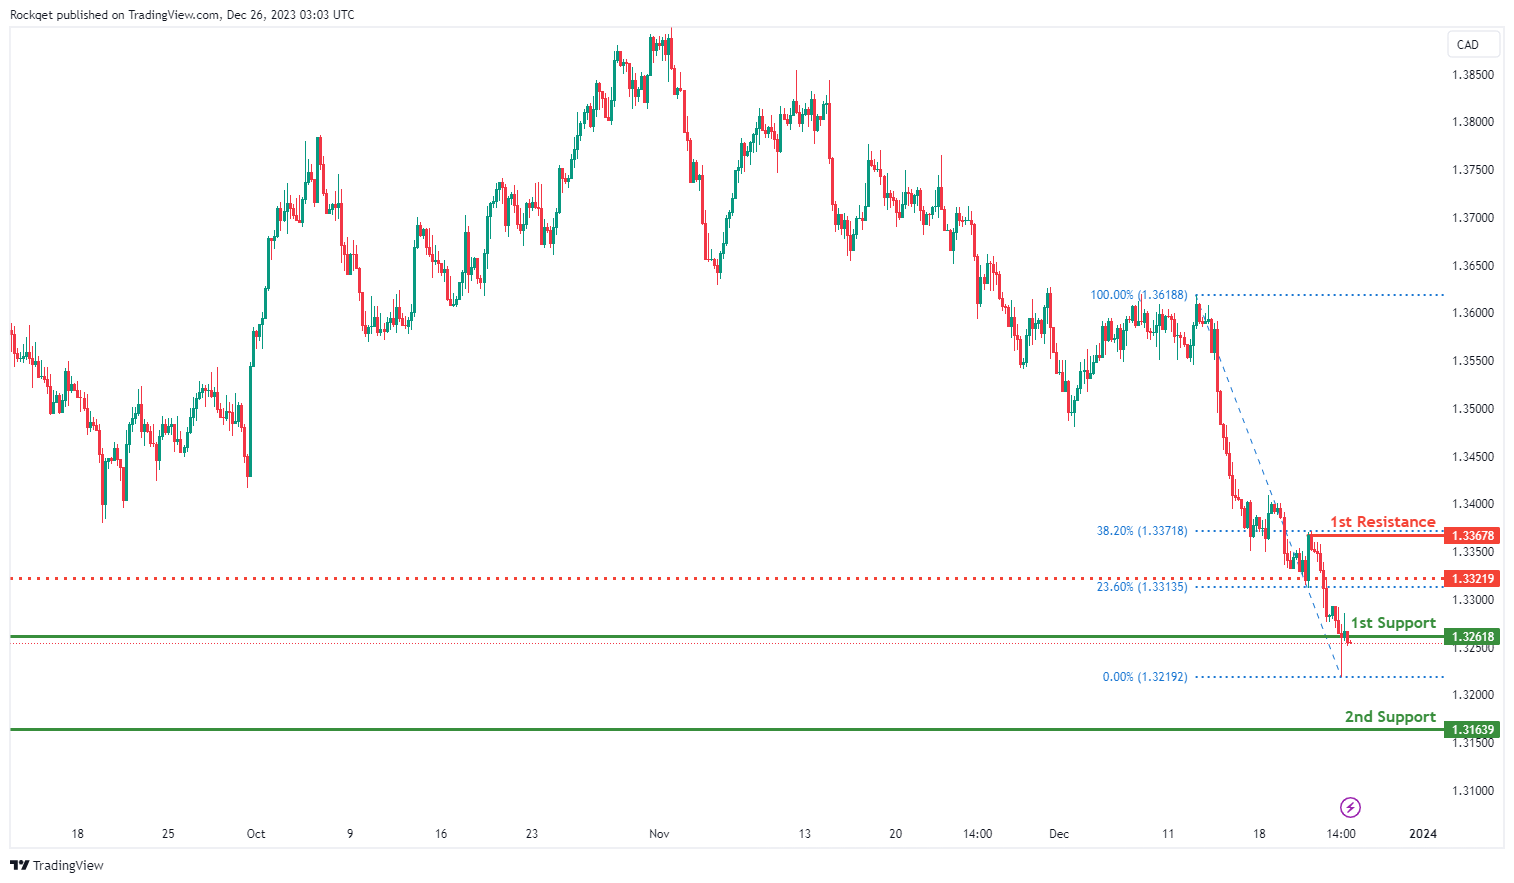
USD/CAD:
The USD/CAD chart currently exhibits an overall bearish momentum, indicating a potential for a break under the 1st support and drop towards the 2nd support.
The 1st support level at 1.3261 is identified as an overlap support. Further below, the 2nd support level at 1.3163 is noted as a multi-swing-low support, further reinforcing its importance as a key support level.
To the upside, the intermediate resistance level at 1.3321 is identified as a pullback resistance that aligns with the 23.60% Fibonacci retracement level. Higher up, the 1st resistance level at 1.3367 is also marked as a pullback resistance that aligns with the 38.20% Fibonacci retracement level, suggesting a potential barrier for further upside movement.
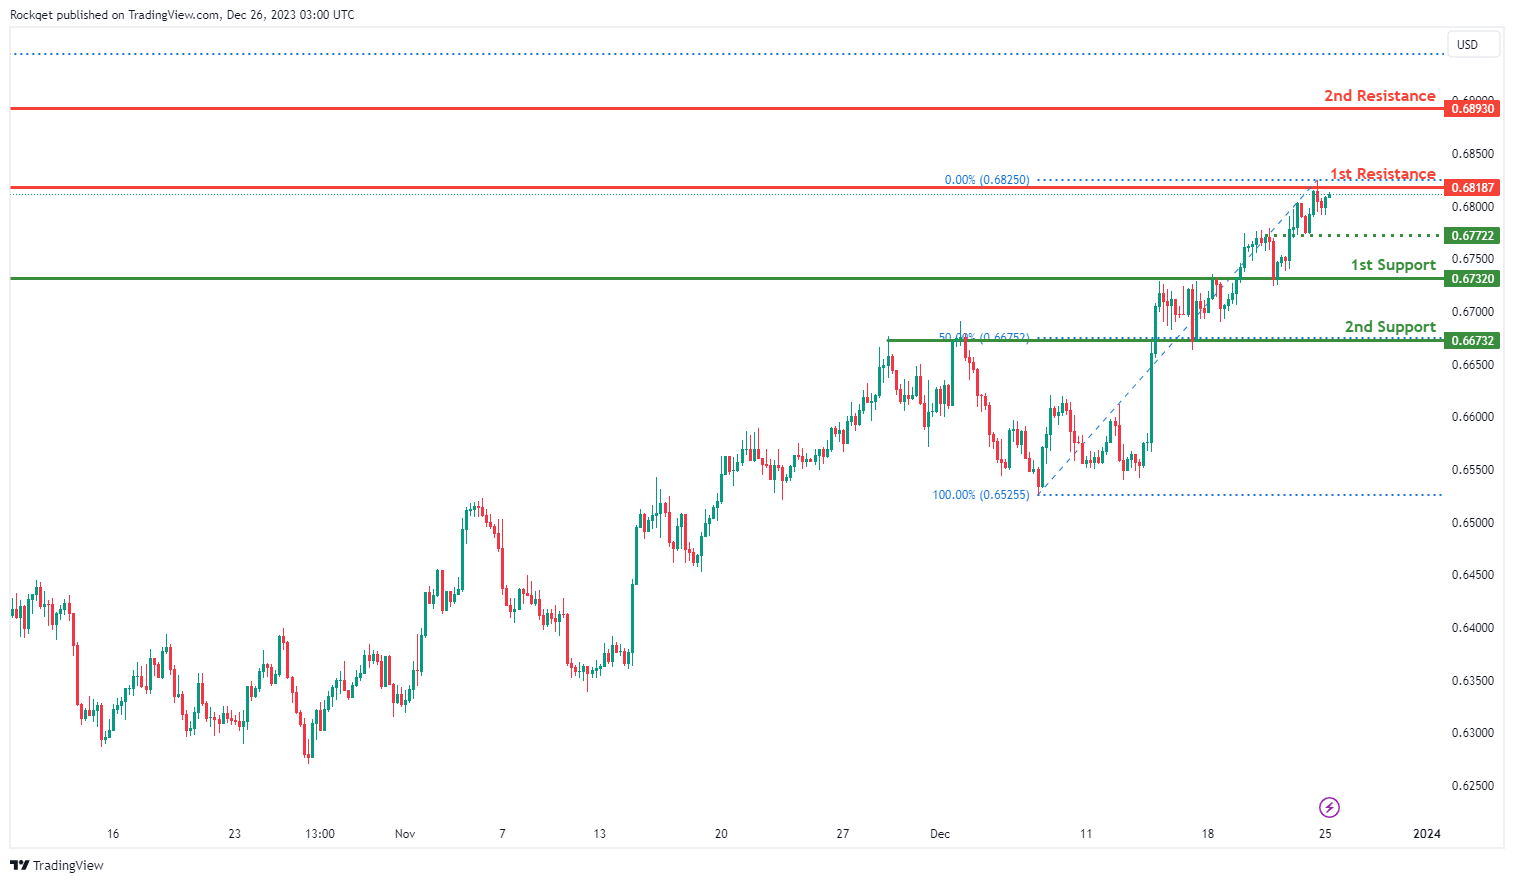
AUD/USD:
The AUD/USD chart currently exhibits an overall bullish momentum. However, there is a potential scenario for price to make a bearish reaction off the 1st resistance and drop towards the 1st support, especially if price breaks below the intermediate support.
The 1st resistance level at 0.6818 is identified as a swing-high resistance. Higher up, the 2nd resistance level at 0.6893 is noted as a multi-swing-high resistance, indicating its potential significance as a barrier for further upward movement.
To the downside, the intermediate support level at 0.6776 is identified as an overlap support while the 1st support level at 0.6732 is also noted as an overlap support. Further below, the 2nd support level at 0.6673 is also marked as an overlap support that aligns with the 50.00% Fibonacci retracement level, further reinforcing its importance as a key support level.
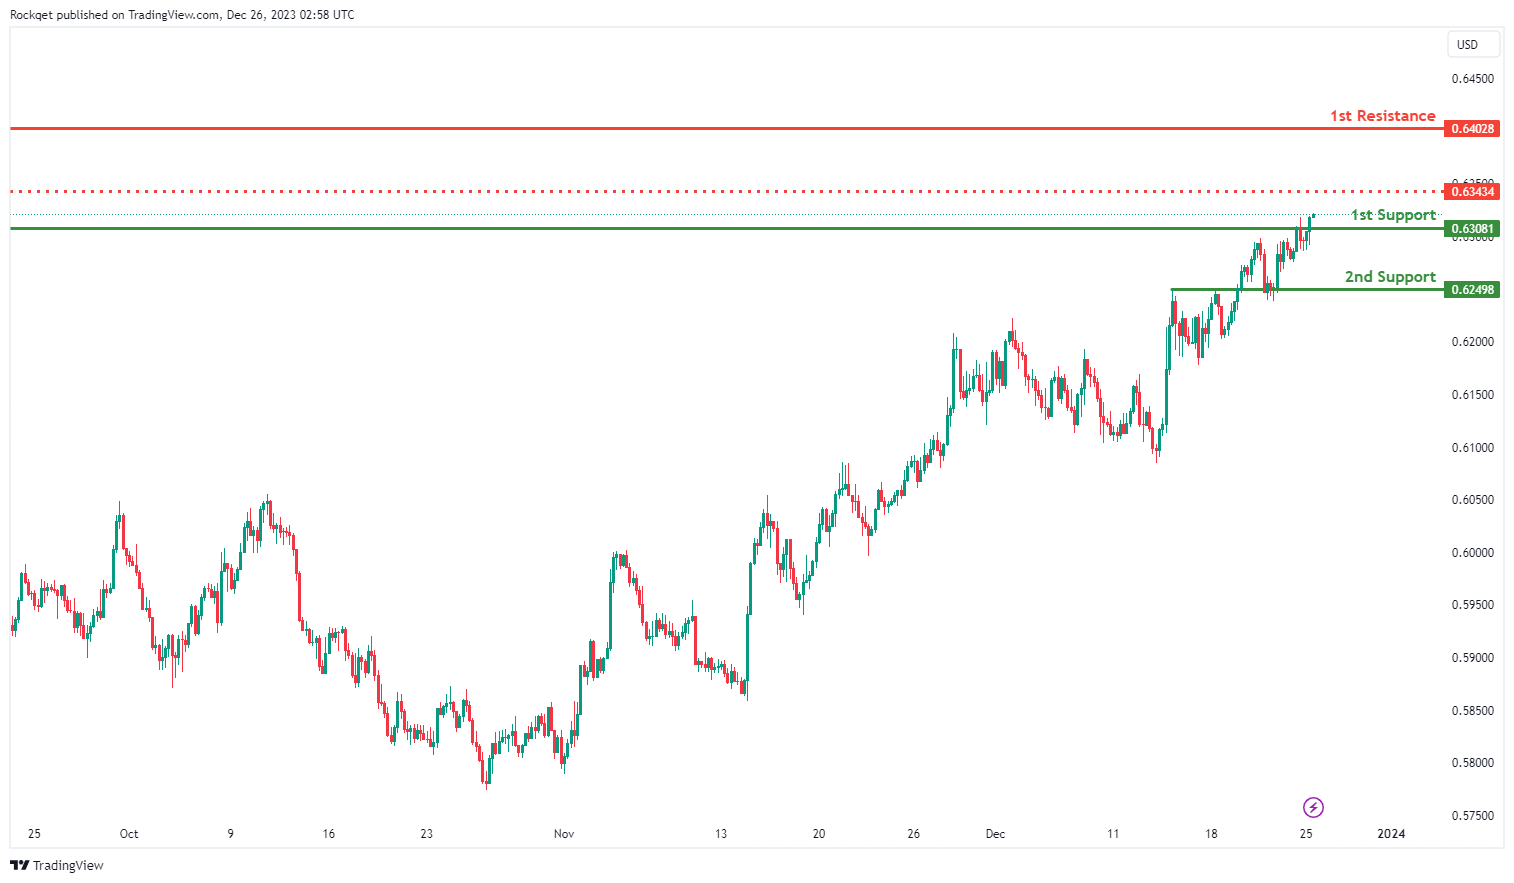
NZD/USD
The NZD/USD chart currently exhibits an overall bullish momentum. In this context, there is a potential scenario for price to make a bullish continuation towards the 1st resistance.
The intermediate resistance level at 0.6343 is identified as a pullback resistance. Higher up, the 1st resistance level at 0.6402 is also marked as a swing-high resistance, indicating its potential significance as a barrier for further upward movement.
To the downside, the 1st support level at 0.6308 is identified as an overlap support. Further below, the 2nd support level at 0.6249 is also noted as an overlap support, further reinforcing its importance as a key support level.
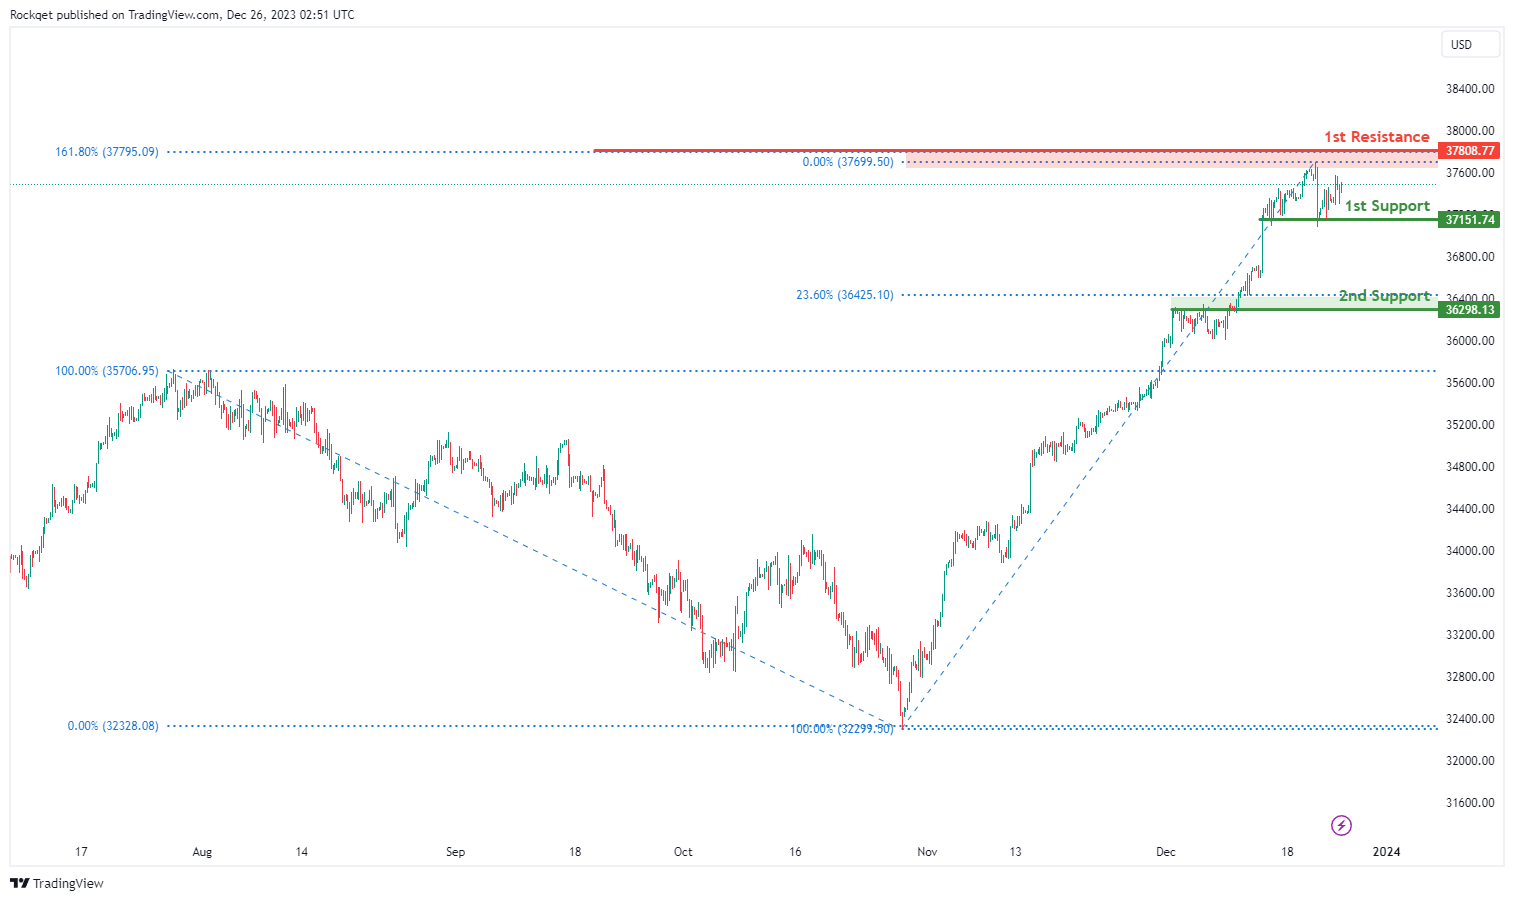
DJ30:
The DJ30 chart currently displays a bullish overall momentum, suggesting a potential scenario for a bullish continuation towards the 1st resistance.
The 1st support at 37151.74 is considered significant as it represents an overlap support, indicating a historical area where buying interest has been present.
Additionally, the 2nd support at 36298.13 is identified as another overlap support and is associated with the 23.60% Fibonacci Retracement, providing an additional layer of potential support for the ongoing bullish trend.
On the resistance side, the 1st resistance at 37808.77 is linked to the 161.80% Fibonacci Extension, indicating a level where buying interest could intensify. This level suggests a potential target for the bullish continuation.
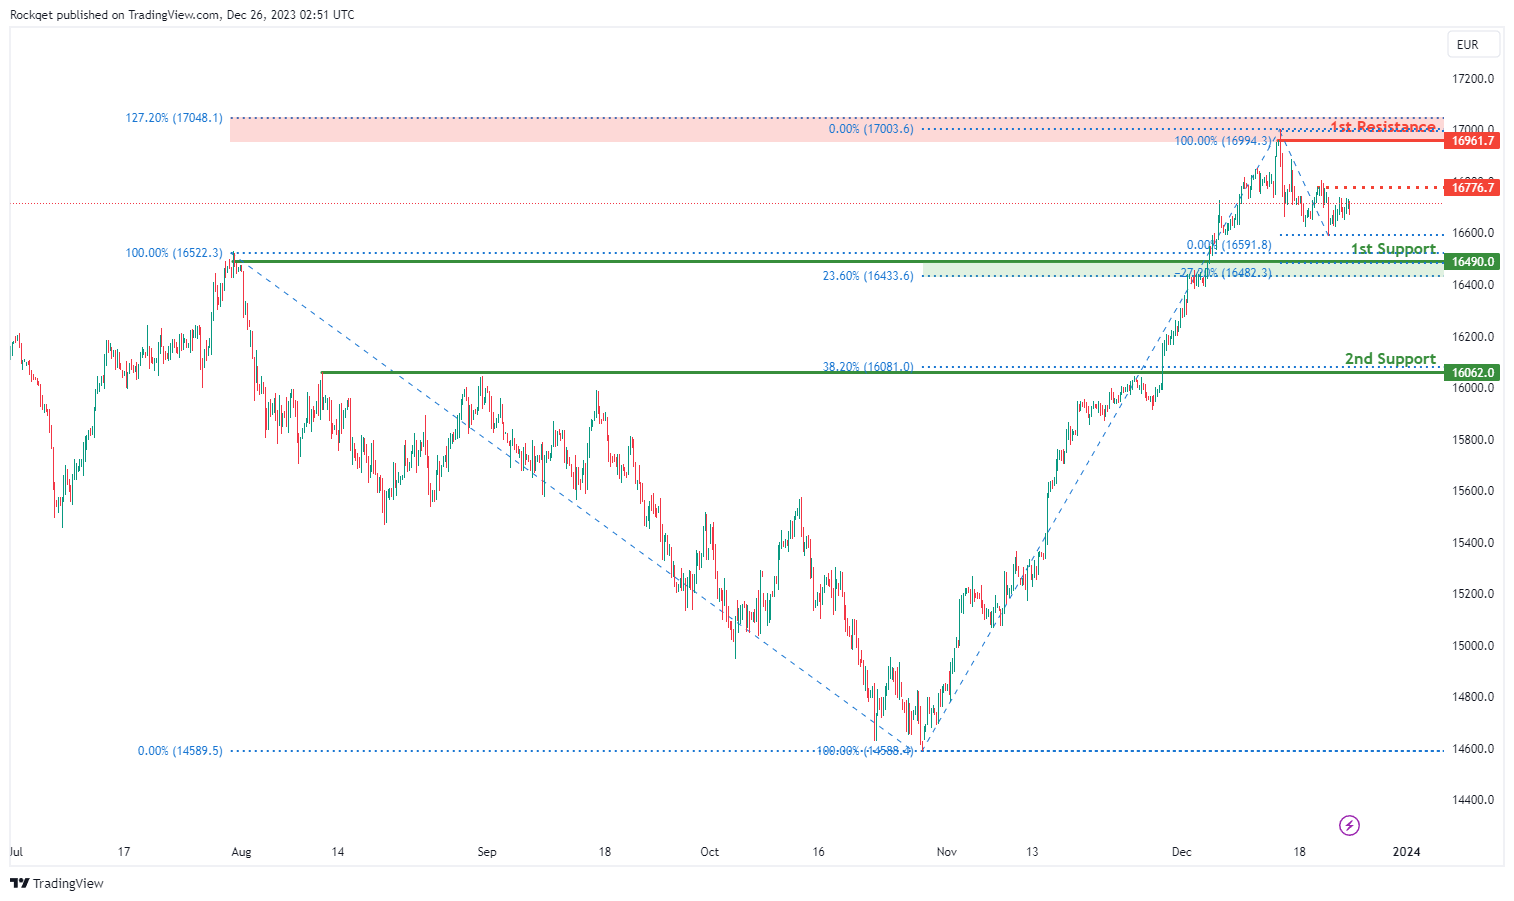
GER40:
The GER40 chart currently exhibits a weak bearish momentum with low confidence, suggesting a potential scenario for a bearish continuation towards the 1st support.
The 1st support at 16490.00 is considered significant as it represents an overlap support, indicating a historical area where buying interest has been present.
Additionally, this support level coincides with the 23.60% Fibonacci Retracement and the -27% Fibonacci Expansion, providing multiple layers of potential support for the ongoing bearish trend.
The 2nd support at 16062.00 is identified as a pullback support and is associated with the 38.20% Fibonacci Retracement, adding an extra layer of potential support for the anticipated bearish movement.
On the resistance side, the 1st resistance at 16961.70 is linked to the swing high resistance and the 127.20% Fibonacci Extension, indicating a level where selling interest could intensify and potentially halt or reverse the bearish trend.
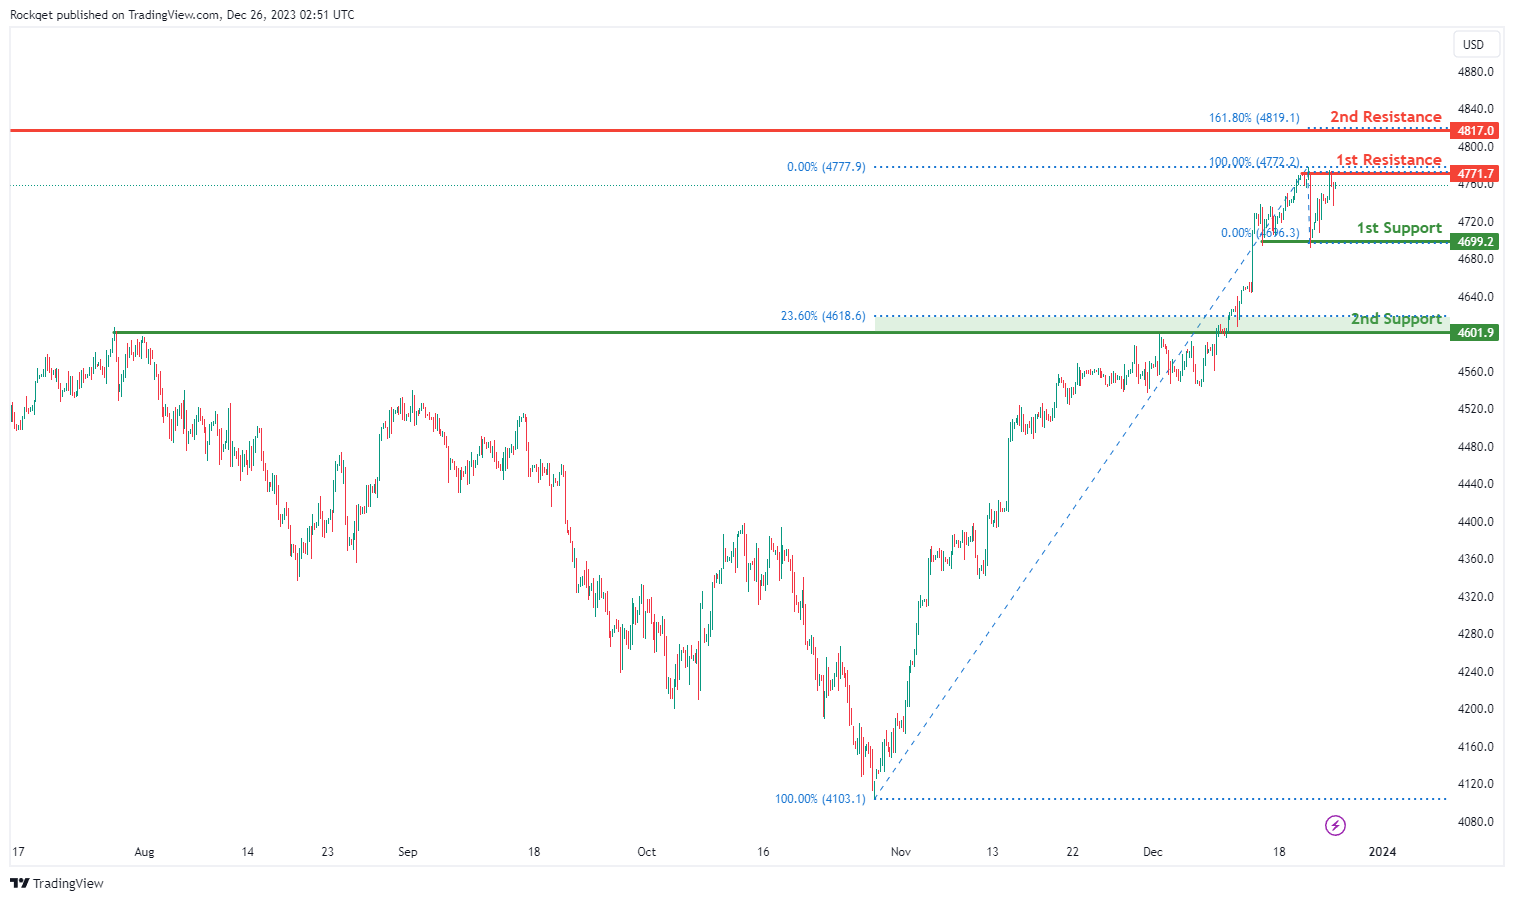
US500:
The US500 chart currently demonstrates a bullish overall momentum, supported by various factors contributing to the upward movement.The price could potentially continue its bullish trend towards the 1st resistance.
The 1st support at 4699.2 is considered strong, representing a multi-swing low support level.
Additionally, the 2nd support at 4601.9 is identified as an overlap support, coinciding with the 23.60% Fibonacci Retracement, providing a solid foundation for potential price bounces.
On the resistance side, the 1st resistance at 4771.7 is associated with a swing high resistance, indicating a level where selling interest might increase, potentially causing a temporary pause or reversal in the bullish trend.
Furthermore, the 2nd resistance at 4817.0 is linked to a swing high resistance and the 161.80% Fibonacci Extension, highlighting a potential challenge for the price to surpass these levels.
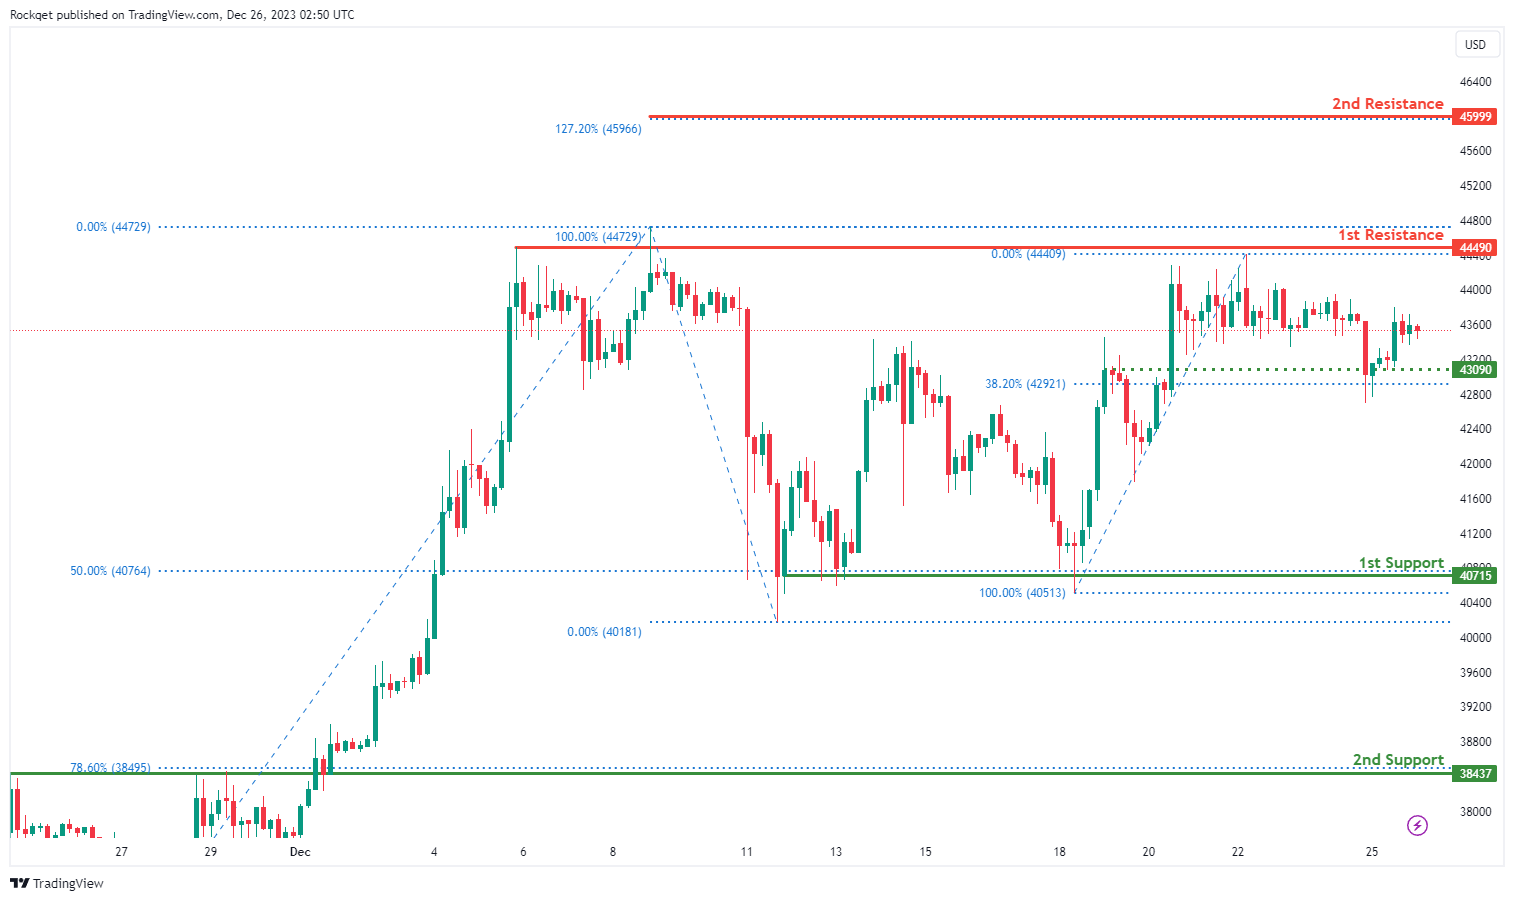
BTC/USD:
The BTC/USD chart currently reflects a neutral overall momentum, suggesting a potential scenario for price fluctuation between the 1st resistance and 1st support levels.
The 1st support at 40715 is identified as a swing low support and coincides with the 50% Fibonacci Retracement, making it a significant level where historical buying interest has been present.
Additionally, the 2nd support at 38437 is considered an overlap support, providing an extra layer of potential support for the cryptocurrency. This level aligns with the 78.60% Fibonacci Retracement, adding further significance to this support zone.
In terms of intermediate support, the level at 43090 is identified as an overlap support and coincides with the 38.20% Fibonacci Retracement, providing an additional layer of potential support during price fluctuations.
On the resistance side, the 1st resistance at 44490 is associated with a swing high resistance and marks a level where selling interest may intensify, potentially causing a temporary halt or reversal in price.
Furthermore, the 2nd resistance at 45999 is linked to the 127.20% Fibonacci Extension, presenting a formidable challenge for the price to surpass.
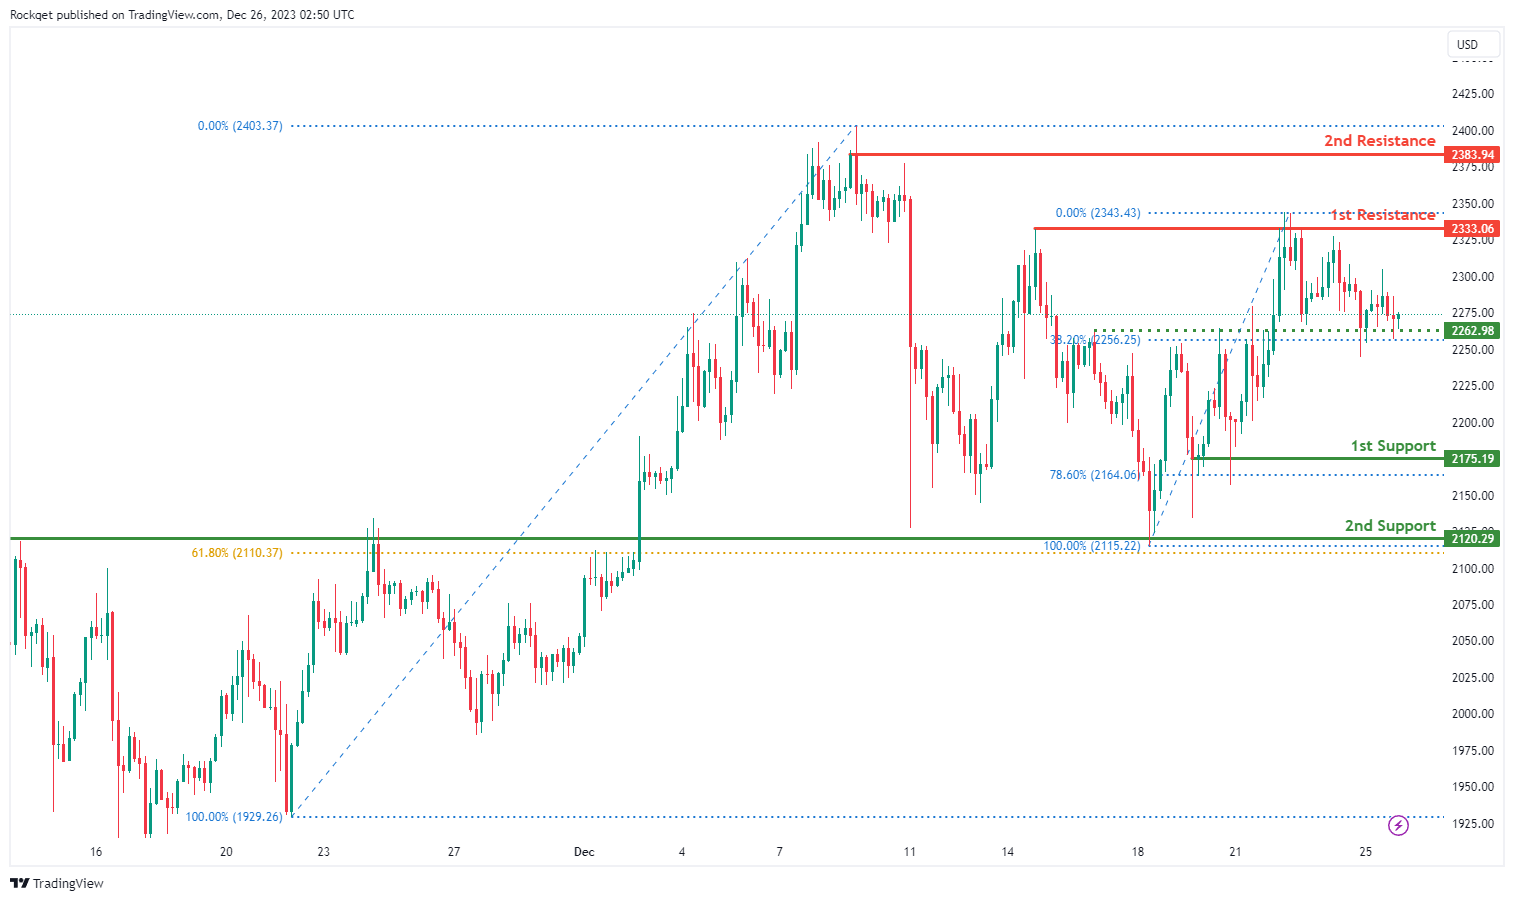
ETH/USD:
The ETH/USD chart currently demonstrates a bullish overall momentum, suggesting a potential scenario for a bullish continuation towards the 1st resistance.
The 1st support at 2175.19 is identified as a pullback support, representing a historical area where buying interest has been present. This level also coincides with the 78.60% Fibonacci Retracement, adding significance to the support zone.
Additionally, the 2nd support at 2120.29 is recognized as a swing low support and is associated with the 61.80% Fibonacci Retracement, providing an extra layer of potential support for the cryptocurrency.
In terms of intermediate support, the level at 2262.98 is considered an overlap support and aligns with the 38.20% Fibonacci Retracement, providing an additional layer of potential support during price fluctuations.
On the resistance side, the 1st resistance at 2333.06 is linked to a swing high resistance, indicating a level where selling interest may intensify, potentially causing a temporary pause or reversal in the bullish trend.
Furthermore, the 2nd resistance at 2383.94 is another swing high resistance, presenting a formidable challenge for the price to overcome.
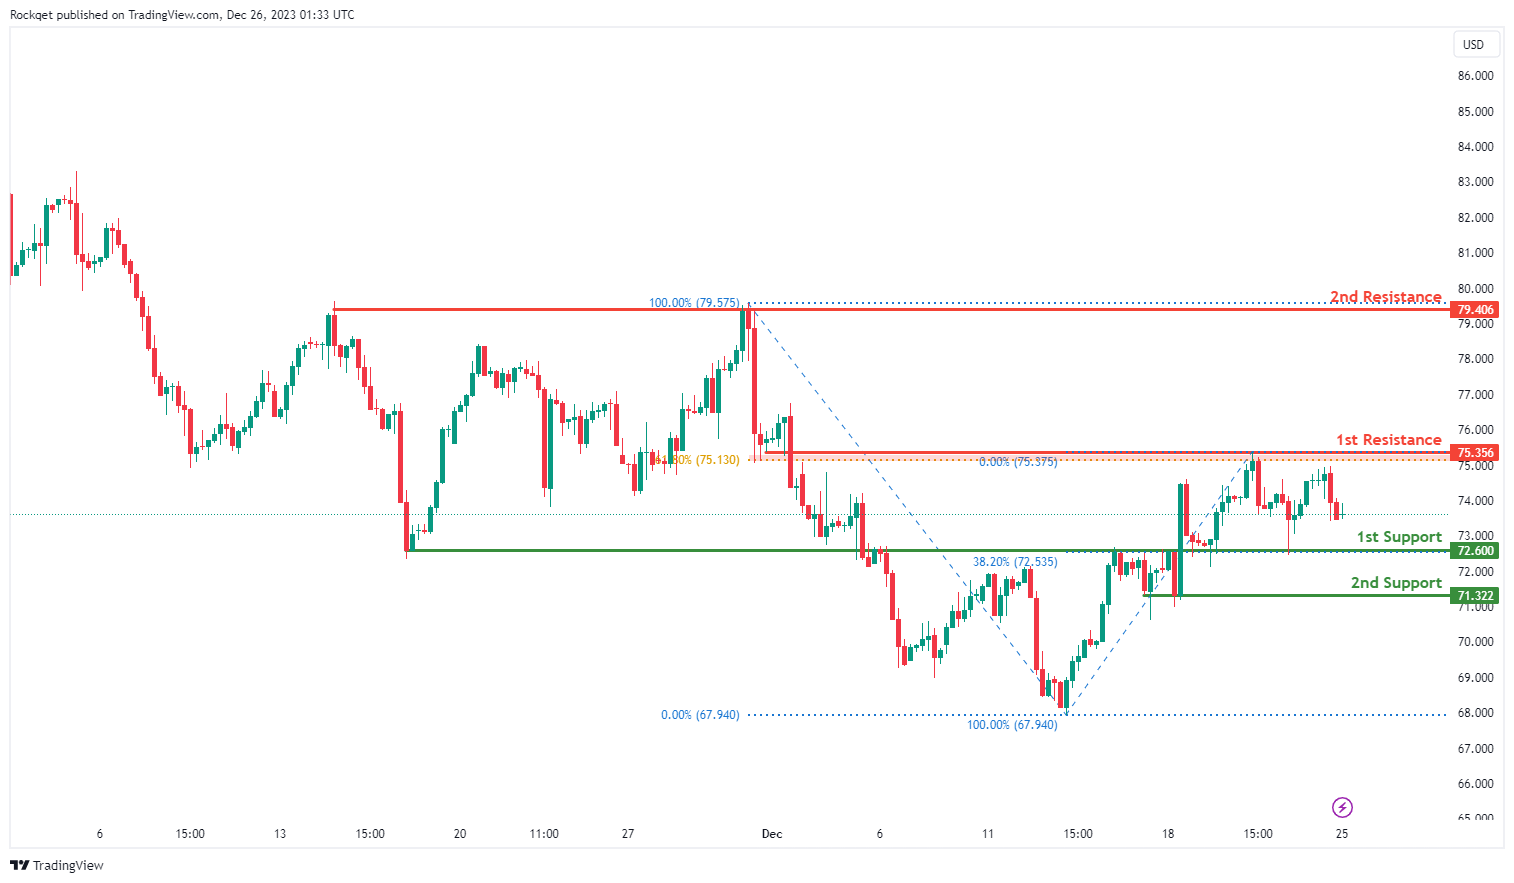
WTI/USD:
The WTI chart currently exhibits an overall bullish momentum, suggesting a prevailing uptrend. However, there is a potential scenario for price to fall towards the 1st support.
The 1st support level at 72.60 is identified as an overlap support that aligns with the 38.20% Fibonacci retracement level. Further below, the 2nd support level at 71.32 is marked as a pullback support, reinforcing its importance as a key support level.
To the upside, the 1st resistance level at 75.35 is identified as an overlap resistance that aligns close to the 61.80% Fibonacci retracement level. Higher up, the 2nd resistance level at 79.40 is noted as a multi-swing-high resistance, further indicating its potential significance as a barrier for further upward movement.
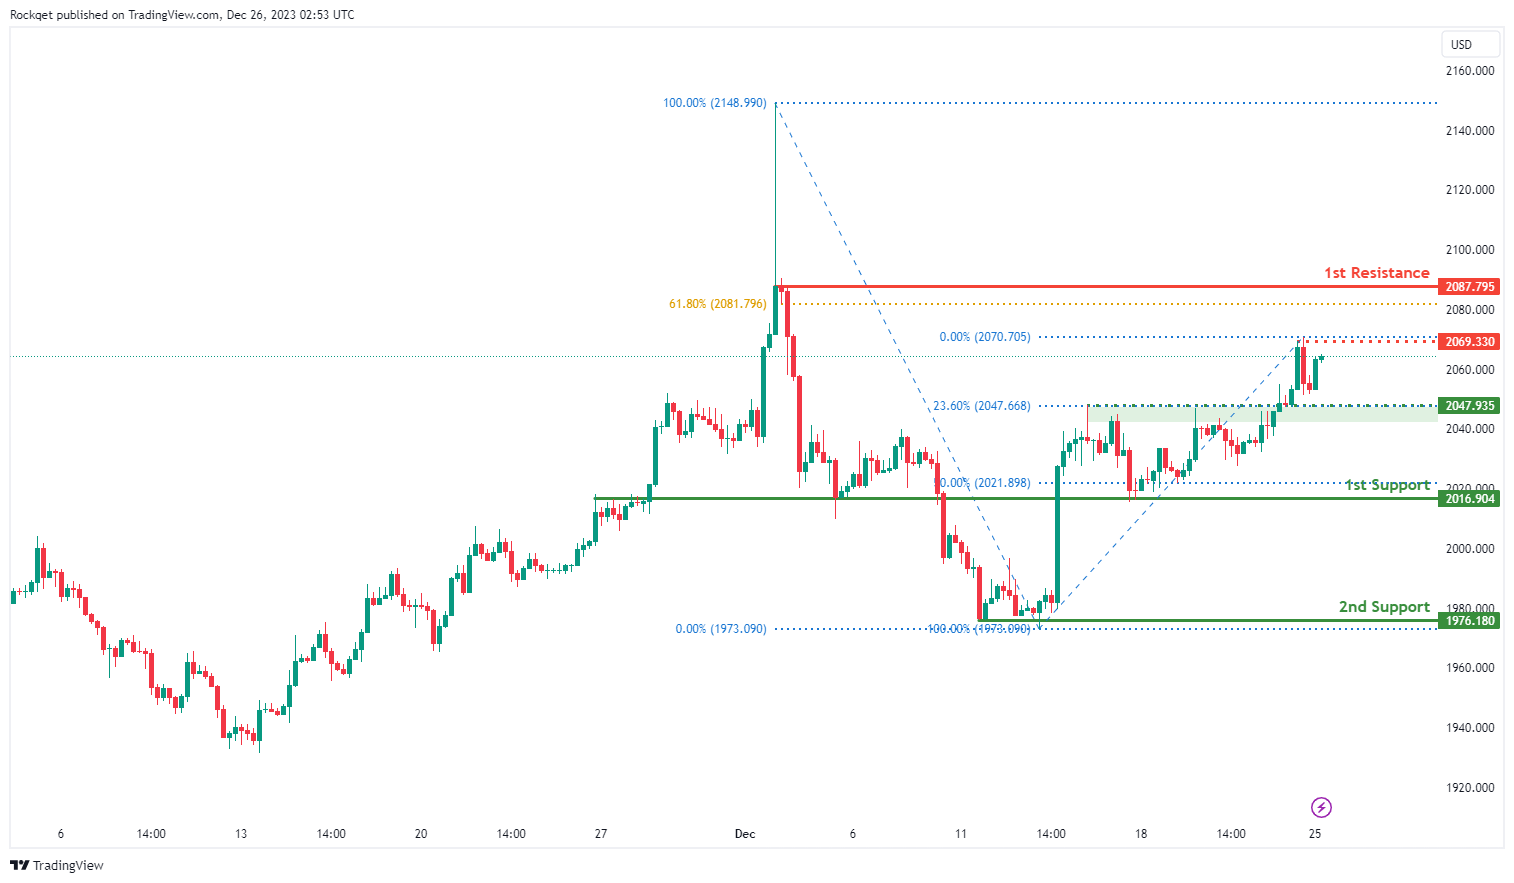
XAU/USD (GOLD):
The XAU/USD chart currently demonstrates a bullish momentum, indicating a potential for price to break above the intermediate resistance and make a bullish continuation towards the 1st resistance.
The intermediate resistance level at 2,069.33 is identified as a pullback resistance. Higher up, the 1st resistance level at 2,087.79 is also marked as a pullback resistance that aligns close to the 61.80% Fibonacci retracement level, further indicating its potential significance as a barrier for further upward movement.
To the downside, the intermediate support level at 2,047.93 is identified as a pullback support that aligns with the 23.60% Fibonacci retracement level while the 1st support level at 2,016.90 is marked as an overlap support that aligns close to the 50.00% Fibonacci retracement level. Further below, the 2nd support level at 1,976.18 is noted as a pullback support, reinforcing its importance as a key support level.
EUR/USD Eyes More Upsides Amid The Holiday Season
Key Highlights
- EUR/USD is holding gains above the 1.0980 level.
- A key bullish trend line is forming with support near 1.0980 on the 4-hour chart.
- GBP/USD is also consolidating gains near the 1.2700 level.
- Gold prices are accelerating higher toward the $2,080 level.
EUR/USD Technical Analysis
The Euro remained well-bid above the 1.0840 level against the US Dollar. EUR/USD climbed higher above the 1.0920 level to move into a positive zone.
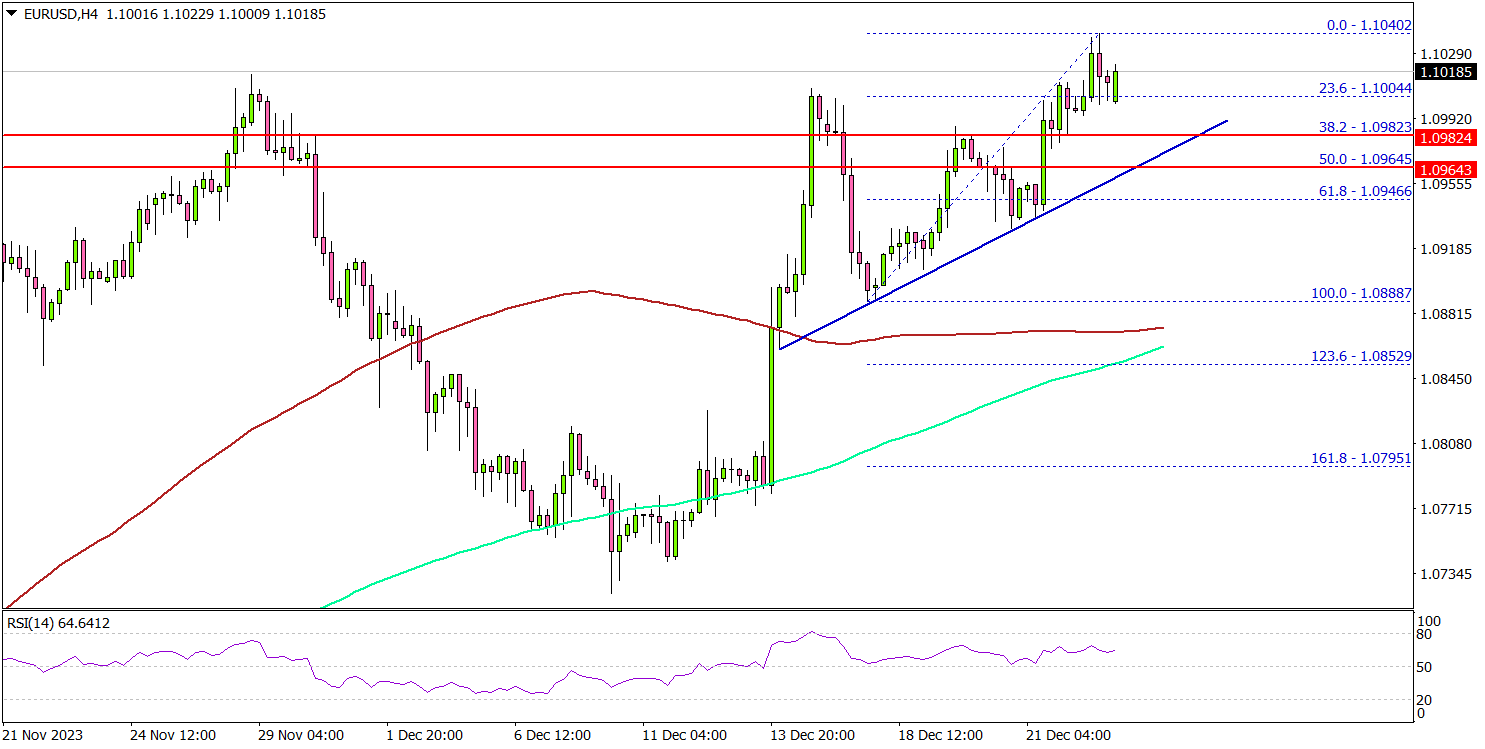
Looking at the 4-hour chart, the pair settled above the 1.0950 level, the 100 simple moving average (red, 4 hours), and the 200 simple moving average (green, 4 hours).
Finally, the pair spiked above the 1.1000 level. A high was formed near 1.1040 and the pair is now consolidating gains. It is trading near the 1.1000 zone. On the downside, the first key support is near the 1.0980 level.
There is also a key bullish trend line forming with support near 1.0980 on the same chart. The next major support is 1.0945, below which the pair might decline and test 1.0920. Any more losses might send the pair toward the 1.0840 support.
On the upside, immediate resistance is near the 1.1040 level. The next key resistance is near the 1.1120 level. A close above the 1.1120 zone could open the doors for more upsides. The next stop for the bulls might be 1.1200.
Looking at GBP/USD, the pair remained in a positive zone and the bulls seem to be aiming for a move toward the 1.2850 level.
Economic Releases
- US Housing Price Index for Oct 2023 (MoM) - Forecast +0.5%, versus +0.6% previous.
Forecast: What to Expect from the Euro and Dollar in 2024
Traditionally, we publish currency forecasts from leading global financial institutions at the turn of the outgoing and incoming years. Having maintained this practice for several years, it enables us to not only peer into the future but also to reflect on past predictions by experts and evaluate their accuracy.
2022: The Beginning
Just as the world had adapted to living under coronavirus-induced quarantine conditions, war entered the planet's life. Russia's armed invasion of Ukraine in February 2022 and the ensuing anti-Russian sanctions exacerbated economic problems and spurred inflation growth in many countries, even those far from this region.
The proximity of EU countries to the conflict zone, their strong dependence on Russian natural energy resources, the nuclear threat, and the risks of the conflict spreading to their territories dealt a serious blow to the Eurozone economy. In such circumstances, the European Central Bank (ECB) had to act with utmost caution to avoid a complete collapse. The United States found itself in a significantly more advantageous position, which allowed the Federal Reserve, aiming to reduce inflationary pressure, to begin a cycle of interest rate hikes on March 16. This acted as a catalyst for the strengthening of the dollar, and on July 14, EUR/USD fell below the parity line of 1.0000 for the first time in 20 years, reaching a low of 0.9535 on September 28. In mid-July, the European Central Bank also began to gradually increase the euro rate. As a result, EUR/USD entered the new year, 2023, at a level of 1.0700.
2023: Whose Forecasts Proved More Accurate
The coronavirus pandemic began to subside, and on May 5, the WHO declared that COVID-19 was no longer a global emergency. Gradually, various countries started to relax quarantine restrictions. The military actions in Ukraine turned into a prolonged conflict. The fight against inflation slowly started showing signs of success, and the economy managed to adapt to rising interest rates and high energy prices. A global catastrophe was averted, and voices predicting a soft landing, especially for the U.S. economy and possibly the Eurozone, grew louder.
In 2022, the maximum range of fluctuations for EUR/USD exceeded 1,700 points, but in 2023, this figure was halved to 828 points. The pair reached its peak on July 18, climbing to 1.1275. It found its bottom at 1.0447 on October 3 and is ending December in the 1.0900-1.1000 range (as of the writing of this review), not far from the January values.
So, what forecasts did experts give for 2023? The furthest from reality was the forecast by Internationale Nederlanden Groep. ING was confident that all the pressure factors of 2022 would persist into 2023. High energy prices would continue to heavily burden the European economy. Additional pressure would come if the U.S. Federal Reserve halted its printing press before the ECB. According to analysts from this major Dutch banking group, a rate of 0.9500 euros per dollar was expected in Q1 2023, which could then rise, reaching parity at 1.0000 in Q4.
The Agency for Economic Forecasting's experts were accurate regarding the EUR/USD dynamics in Q1: they predicted a rise to 1.1160 (in reality, it rose to 1.1033). However, they expected the pair to then undergo a steady decline, reaching 1.0050 by the end of Q3 and finishing the year at 0.9790. Here, they were significantly mistaken.
But it wasn't just the bears who were wrong; the bulls on the euro/dollar pair also erred. For example, the French financial conglomerate Societe Generale voted for a weakening dollar and a rising pair. However, their forecast of a climb above 1.1500 by the end of Q1 was too radical. Strategists at Deutsche Bank allowed for fluctuations in the 1.0800-1.1500 range. However, in their view, the pair's rise to the upper limit was only possible if the Fed began to ease its monetary policy in the second half of 2023. (We now know that no easing occurred, but the rate was frozen at 5.50% from July onwards).
The most accurate predictions came from Bank of America and the German Commerzbank. According to Bank of America's base scenario, the U.S. dollar was expected to remain strong in early 2023 and then start to gradually weaken, leading the EUR/USD pair to rise to 1.1000 after the Fed's pause. Commerzbank supported this scenario, stating, "Considering the expected change in the Fed's interest rate and assuming that the ECB refrains from lowering interest rates [...], our target price for EUR/USD for 2023 is 1.1000," was the verdict of strategists from this banking conglomerate.
2024: What to Expect in the New Year
What awaits the euro and dollar in the upcoming year of 2024? It's important to note that forecasts vary significantly due to the numerous "surprises" life has presented recently and the many unresolved issues it has left for the future. Questions remain about the geopolitical situation, the direction and pace of the monetary policies of the Federal Reserve (Fed) and the European Central Bank (ECB), the state of the economy and labour markets, the extent to which inflation and energy prices can be controlled, who will be elected President of the United States in November, the outcomes of Russia's war in Ukraine and the ongoing conflict between Israel and Hamas, and the balance of power in the U.S.-China rivalry. The answers to these and other questions are yet to be discovered. With many factors of uncertainty, experts have not reached a consensus.
Recent dovish remarks by Fed Chair Jerome Powell and moderately hawkish statements by ECB President Christine Lagarde have led markets to believe that the Fed will lead in easing monetary policy and lowering interest rates in 2024. If the market does not receive a countersignal, the U.S. dollar will remain under pressure. Societe Generale believes the Dollar Index (DXY) could drop from the current 102.50 to below 100, possibly as low as 97 points. A Reuters poll of analysts also indicates that the U.S. dollar should weaken in the coming year. An Investing.com review suggests that EUR/USD could potentially reach 1.1500, subject to various geopolitical and macroeconomic conditions.
According to the base scenario outlined by UBS Wealth Management, a slowdown in U.S. economic growth, falling inflation, and expectations of lower interest rates should support stocks and bonds. Regarding the EUR/USD pair, UBS sees it at a level of 1.1200. German Commerzbank's forecasts also include a peak of 1.1200. Analysts there expect a temporary strengthening of the euro against the dollar before a subsequent weakening. They anticipate the rate will rise to 1.1200 by June 2024, then decrease to 1.0800 by March 2025.
ING economists calculate that in the second half of 2024, the EUR/USD rate will still be rising towards 1.1800. However, they caution that this forecast is based solely on the possible trajectory of Fed and ECB policies. They note, "The rate differential is not the only factor determining the EUR/USD course." Low growth rates in the Eurozone and political uncertainty regarding the reintroduction of the Stability and Growth Pact suggest that EUR/USD will end this year close to 1.0600, with its peak levels in 2024 closer to 1.1500 than to 1.1800.
Fidelity International, JPMorgan, and HSBC economists do not rule out a scenario where other regulators, such as the ECB and the Bank of England, might take the lead in easing ahead of the Fed.
Goldman Sachs strategists believe that while the dollar's prospects may worsen in 2024, the strong and stable U.S. economy will limit the fall of the currency. They write that the dollar is still highly valued, and investors lean towards it, which will remain "strong for a long time," and any decline will be insignificant. The U.S. economy is too strong to cause a rate cut of a full 150 basis points in 2024.
Danske Bank, Westpac, and HSBC also believe that by the end of 2024, the dollar will strengthen against the euro and the British pound. ABN Amro's forecast for the end of next year suggests a rate of 1.0500, and the Agency for Economic Forecasting predicts 1.0230.
***
The ancient Chinese military treatise "The Thirty-Six Stratagems" states, "He who tries to foresee everything loses vigilance." Indeed, it is impossible to foresee everything. But one thing can be said for sure: the upcoming twelve months, like the previous ones, will be full of unexpected surprises. So, remain vigilant, and fortune will be on your side.
Happy upcoming New Year 2024! It promises to be very interesting.
The Weekly Bottom Line: A Healthy Dose of Holiday Cheer’
U.S. Highlights
- Lower borrowing costs are showing up in the housing market with existing home sales rising modestly in November for the first time in five months. Housing starts also jumped to a nineteen-month high on the month.
- Personal spending remained solid in November, bolstered by stable income growth, while inflation continued to moderate.
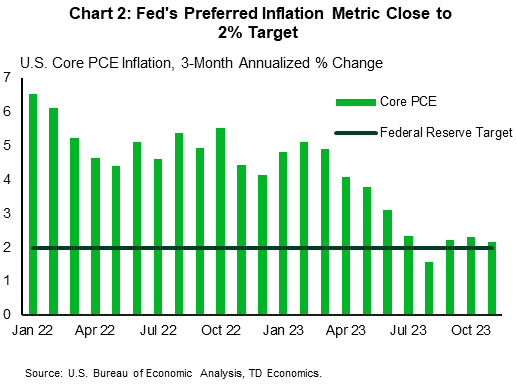
- The Federal Reserve’s preferred inflation metric, core PCE, decelerated in November to 3.2% year-on-year, while Fed officials continued to push back against easing financial conditions that has occurred since last week’s meeting.
Canadian Highlights
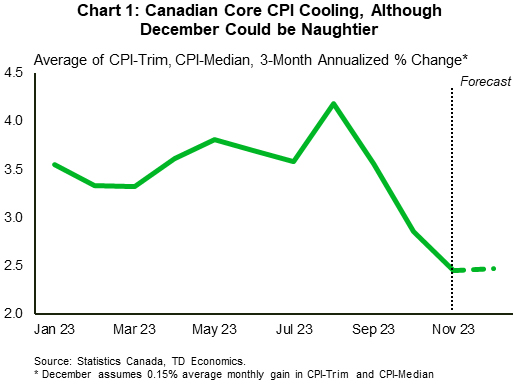
- November’s inflation report was a mixed blessing, showing no progress in headline inflation. However, shorter-term core inflation metrics brought more holiday cheer.
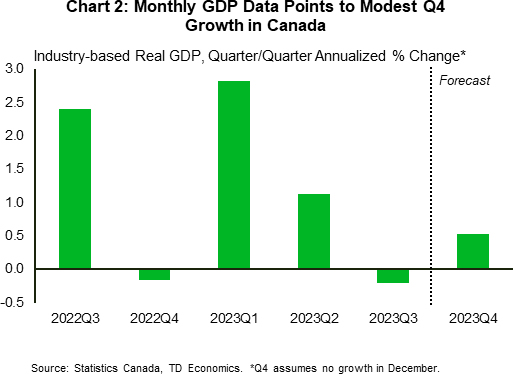
- Retail sales data showed that consumers were in a cheerful mood in October, although weakness elsewhere held GDP flat during the month. Preliminary estimates suggest that the economy grew modestly in November.
- Data this week reinforces the notion that the Bank of Canada will be on hold for some time yet.
U.S. – A Healthy Dose of Holiday Cheer’
Even though this was the darkest week of the year, with yesterday marking the winter solstice, we received several positive reports on the economy showing signs of a thawing housing market, slowing inflation, and resilient consumers. Financial markets picked up where they left off last week, with yields falling and equities rising. At time of writing, the S&P 500 is up 1.0% on the week while the two-year Treasury declined by 14 basis-points (bps) to 4.32%.
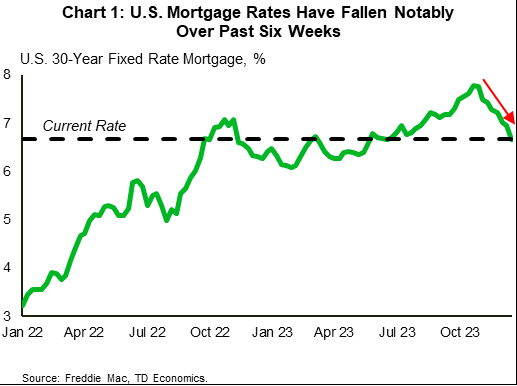
As in many countries around the world, 2023 was a somber year for the U.S. housing market as elevated interest rates restricted supply and demand, pushing sales down to a thirteen year low. November sales data released this week showed the first uptick in five months, however, the level remained low as most of the contracts were signed prior to the decline in rates over the past few months. With mortgages rates back below 7% (Chart 1), it seems likely that sales and listings will trend upward over the coming months. Supply is also likely to receive a boost from the rebound in housing starts seen in November, which hit its highest level since June 2022.
On the spending side, real personal consumption rebounded moderately in November as Americans took advantage of Black Friday deals and worked through their holiday shopping lists. Consumers have also seen a rebound in real income growth over the past two months which has helped to offset inflation headwinds. For its part, PCE inflation continued to decelerate in November, with the Fed’s preferred inflation metric, core PCE, falling to 3.2% year-on-year. On a three-month annualized basis, core PCE has remained moderately above the Fed’s 2% target for the past few months (Chart 2), which has permitted the cessation of further rate hikes, but restricted the Fed from opening the door to rate cuts lest the progress on disinflation thus far become undone.
This is a pertinent concern for the Fed as a concerning divergence between the Federal Reserve and financial markets has grown over the past week. Markets are now pricing in twice as many rate cuts in 2024 as the Federal Reserve dot plot suggests, and this has drawn strong pushback from Fed officials apprehensive of a premature easing in financial conditions. Chicago Fed President Goolsbee noted this week that markets had “got a little ahead of themselves”, while Cleveland Fed President Mester added “they jumped to the end part, which is ‘We’re going to normalise quickly’, and I don’t see that”. Atlanta Fed President Bostic also added that he doesn’t expect an urgency to cut rates in early 2024. We err closer to the Fed’s outlook on interest rates, but still expect rates to be a percentage point lower by the end of 2024, versus the median FOMC member expectation for 75bps.
With the housing market thawing, consumption remaining solid on the back of real income gains, and interest rates falling notably, the Federal Reserve will remain vigilant of upside risks to inflation moving into 2024. The first week of January will include a pulse check on employment trends and whether continued labor market tightness will remain on the long list of Fed concerns moving into the new year.
Canada – A Data Feast Before a Long Winter's Nap
'Twas the week before Christmas, when around computer screens, economists gathered, parsing stats with their teams.
The inflation report was first on the docket, and messaging was mixed. On the one hand, headline inflation came in at 3.1% year-on-year in November, showing no downward progress compared to the prior month. Service prices continued to play the proverbial Grinch, rising a plump 4.6% year-on-year amid strong wage growth and a very weak productivity performance. Inflation in travel services was specifically called out by Statcan, thanks to "events held in destination cities in the U.S." (think Formula 1 racing in Vegas. For those interested, Taylor Swift appears to have been touring elsewhere for much of November).
Shelter price inflation has been top-of-mind for policymakers (given the split between it at the rest of the CPI), and it eased a touch. However, data this week revealed a 3.2% year-on-year surge in Canada's population in Q4 – the fastest such pace since the post-war baby boom. The pressure this trend will place on rents makes it difficult to envision a rapid slowdown for this component of the CPI. Notably, populations are swelling across Canada, and this will remain a theme for provinces in 2024. Please see for our latest provincial forecast, released this week.
Core inflation's slow sleigh ride down to the Bank of Canada's 2% target seemingly hit a bump last month, as CPI-trim and CPI-median remained unchanged in year-on-year terms. However, joyful and triumphant spirits were regained when we looked at shorter-term metrics. In 3-month annualized terms, the Bank's core measures averaged 2.4% - the chilliest pace since early 2021 and likely offering some comfort to central bank policymakers. Caution is warranted, however, as it wouldn’t take much of a monthly gain to see this measure push higher in December (Chart 1).
Like inflation, indicators of economic activity were mixed this week. It's generally been a tough year for retailers, so October's 0.7% month-on-month gain (which was even better in volume terms) must have felt like a blessing. It also sets up for a solid Q4 print for goods spending overall. However, stealing some sunshine from the report was Statcan's advance estimate, which pointed to no growth in spending during November. This suggests that sales volumes dropped during the month, given a rise in goods prices.
Ending out the week, October's GDP report showed that growth was flat during the month. The details were arguably even more lacking, as the print was weaker than Statcan's preliminary estimate heading into the report, and growth was propped up by gains in public sector industries. The advance estimate for November flagged a 0.1% monthly gain in GDP, suggesting that growth will be modest in the fourth quarter (Chart 2), in line with our latest Canadian forecast. All told, the mixed reading on inflation coupled with some degree of resilience in this week's economic data should give the Bank leeway to ho, ho, hold the line on rates for some time yet.
Summary 12/25 – 12/29
Monday, Dec 25, 2023
| GMT | Ccy | Events | Consensus | Previous |
|---|---|---|---|---|
| 23:30 | JPY | Unemployment Rate Nov | 2.50% | 2.50% |
| 23:50 | JPY | Corporate Service Price Index Y/Y Nov | 2.40% | 2.30% |
| GMT | Ccy | Events | |
|---|---|---|---|
| 23:30 | JPY | Unemployment Rate Nov | |
| Forecast: 2.50% | Previous: 2.50% | ||
| 23:50 | JPY | Corporate Service Price Index Y/Y Nov | |
| Forecast: 2.40% | Previous: 2.30% | ||
Tuesday, Dec 26, 2023
| GMT | Ccy | Events | Consensus | Previous |
|---|---|---|---|---|
| 14:00 | USD | S&P/CS Composite-20 HPI Y/Y Oct | 4.90% | 3.90% |
| 14:00 | USD | Housing Price Index M/M Oct | 0.50% | 0.60% |
| 23:50 | JPY | BoJ Summary of Opinions |
| GMT | Ccy | Events | |
|---|---|---|---|
| 14:00 | USD | S&P/CS Composite-20 HPI Y/Y Oct | |
| Forecast: 4.90% | Previous: 3.90% | ||
| 14:00 | USD | Housing Price Index M/M Oct | |
| Forecast: 0.50% | Previous: 0.60% | ||
| 23:50 | JPY | BoJ Summary of Opinions | |
| Forecast: | Previous: | ||
Wednesday, Dec 27, 2023
| GMT | Ccy | Events | Consensus | Previous |
|---|---|---|---|---|
| 05:00 | JPY | Housing Starts Y/Y Nov | -4.30% | -6.30% |
| 09:00 | CHF | Credit Suisse Economic Expectations Dec | -29.6 | |
| 23:50 | JPY | Industrial Production M/M Nov P | -1.60% | 1.30% |
| 23:50 | JPY | Retail Trade Y/Y Nov | 5.00% | 4.20% |
| GMT | Ccy | Events | |
|---|---|---|---|
| 05:00 | JPY | Housing Starts Y/Y Nov | |
| Forecast: -4.30% | Previous: -6.30% | ||
| 09:00 | CHF | Credit Suisse Economic Expectations Dec | |
| Forecast: | Previous: -29.6 | ||
| 23:50 | JPY | Industrial Production M/M Nov P | |
| Forecast: -1.60% | Previous: 1.30% | ||
| 23:50 | JPY | Retail Trade Y/Y Nov | |
| Forecast: 5.00% | Previous: 4.20% | ||
Thursday, Dec 28, 2023
| GMT | Ccy | Events | Consensus | Previous |
|---|---|---|---|---|
| 13:30 | USD | Initial Jobless Claims (Dec 22) | 204K | 205K |
| 13:30 | USD | Goods Trade Balance (USD) Nov P | -89.5B | -89.6B |
| 13:30 | USD | Wholesale Inventories Nov P | -0.20% | -0.40% |
| 15:00 | USD | Pending Home Sales M/M Nov | 1.10% | -1.50% |
| 15:30 | USD | Natural Gas Storage | -87B | |
| 15:30 | USD | Crude Oil Inventories | 2.9M |
| GMT | Ccy | Events | |
|---|---|---|---|
| 13:30 | USD | Initial Jobless Claims (Dec 22) | |
| Forecast: 204K | Previous: 205K | ||
| 13:30 | USD | Goods Trade Balance (USD) Nov P | |
| Forecast: -89.5B | Previous: -89.6B | ||
| 13:30 | USD | Wholesale Inventories Nov P | |
| Forecast: -0.20% | Previous: -0.40% | ||
| 15:00 | USD | Pending Home Sales M/M Nov | |
| Forecast: 1.10% | Previous: -1.50% | ||
| 15:30 | USD | Natural Gas Storage | |
| Forecast: | Previous: -87B | ||
| 15:30 | USD | Crude Oil Inventories | |
| Forecast: | Previous: 2.9M | ||
Friday, Dec 29, 2023
| GMT | Ccy | Events | Consensus | Previous |
|---|---|---|---|---|
| 08:00 | CHF | KOF Economic Barometer Dec | 97.3 | 96.7 |
| 14:45 | USD | Chicago PMI Dec | 50.7 | 55.8 |
| GMT | Ccy | Events | |
|---|---|---|---|
| 08:00 | CHF | KOF Economic Barometer Dec | |
| Forecast: 97.3 | Previous: 96.7 | ||
| 14:45 | USD | Chicago PMI Dec | |
| Forecast: 50.7 | Previous: 55.8 | ||
Week Ahead – Markets Wind Down for Holidays, Mind the Liquidity Gap
- Quiet week ahead as FX markets enter holiday season
- Spotlight will fall mostly on some Japanese releases
- Most importantly, liquidity will be in short supply
Yen awaits Bank of Japan signals
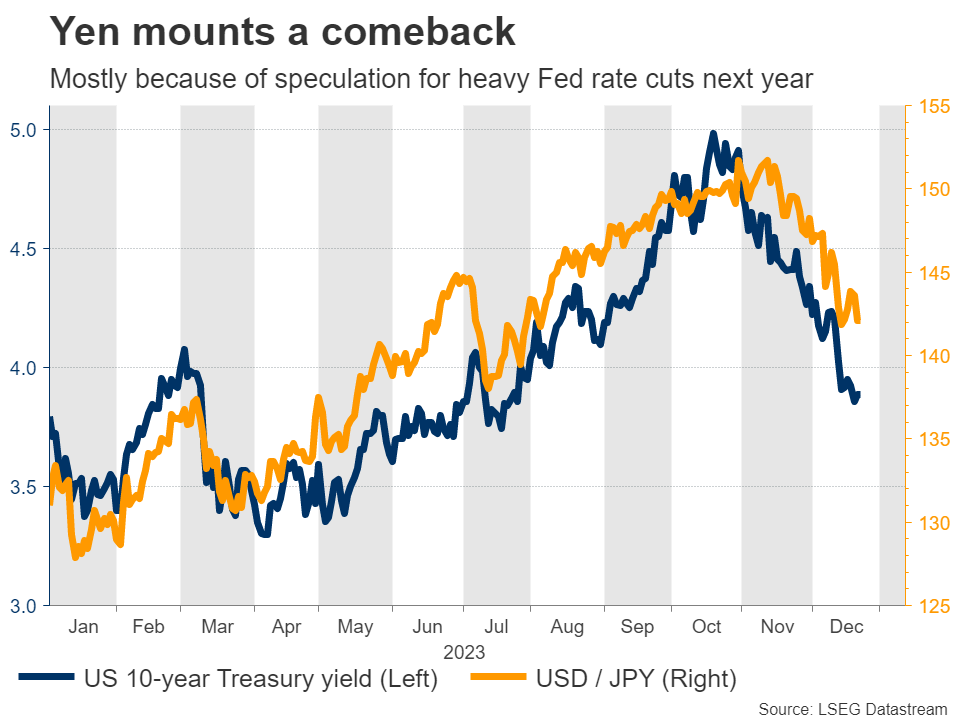
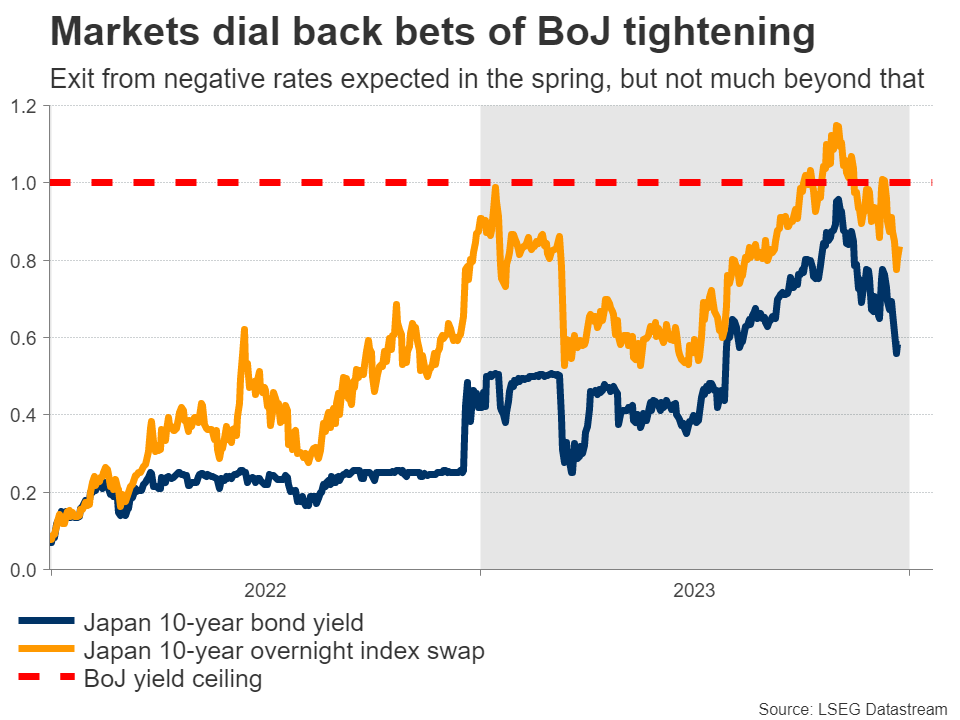
Another devastating year for the Japanese currency is coming to an end. Despite mounting a comeback in recent months, the yen is still on track to close the year with losses of around 8% against the US dollar, mostly because of the Bank of Japan’s refusal to raise interest rates.
Indeed, the latest recovery in the yen has been driven mostly by speculation that foreign central banks in the United States and Europe will slash interest rates aggressively next year. Hence, currencies like the dollar and the euro have lost some of their interest rate advantage over the yen.
Despite a streak of high inflation readings, the Bank of Japan is still reluctant to raise rates because it is not yet confident that this inflation impulse will be sustained. For that to happen, BoJ officials need to see an acceleration in wage growth. This puts extra emphasis on the spring wage negotiations between big businesses and big labor unions.
Markets currently assign an 80% probability for the BoJ to exit negative interest rates in April, which is when the wage negotiations will conclude. Next week’s events will help shape this pricing, and drive the yen accordingly.
The show will get started on Monday with a speech by BoJ Governor Ueda. Then on Tuesday, the nation’s employment data for November will hit the markets. But the main event will probably be on Wednesday, when the summary of opinions from the latest BoJ meeting is released.
This was the meeting when the BoJ kept policy unchanged and pushed back against the notion that it will begin tightening soon. Governor Ueda stressed that they won’t rush into anything and will take a measured approach overall, crushing the hopes of yen bulls.
Investors will be hoping to get some more clarity from the summary of opinions. Specifically, was this view shared by all BoJ officials, or are some of them leaning in the direction of tightening policy next year?
Speaking of next year, the stage appears set for the yen to perform better. The world economy is losing momentum and markets anticipate a global rate-cutting cycle to begin in the spring, right as the Bank of Japan might finally raise its own rates. Hence, interest rate differentials are set to compress in the yen’s favor, which could provide some relief to the bruised currency.
Mind the liquidity risk
Beyond any movements in the yen, the main story next week might be a shortage of liquidity. With many traders away from their desks and several investment managers having closed their books for the year, liquidity will be in short supply.
When liquidity is low, financial markets can move sharply without any real news. And if there are news headlines, their market impact could be greater than usual. In other words, low liquidity conditions can amplify volatility, especially if there is a news catalyst.
Monday will be a public holiday in much of the world, so most stock and bond markets will remain closed. As always though, the FX market will be open for business.
On the data front, there are some second-tier releases in the United States, including regional Fed surveys from Dallas and Richmond on Tuesday and Wednesday, respectively.
For a complete guide into how the major currencies could perform in 2024, please check out our FX Year Ahead report here. Happy holidays!
Forward Guidance: December Jobs Data to Add to Evidence that Interest Rates Are High Enough
Forward Guidance will be on vacation next week, with the next edition to come January 5th, 2024. Happy Holidays!
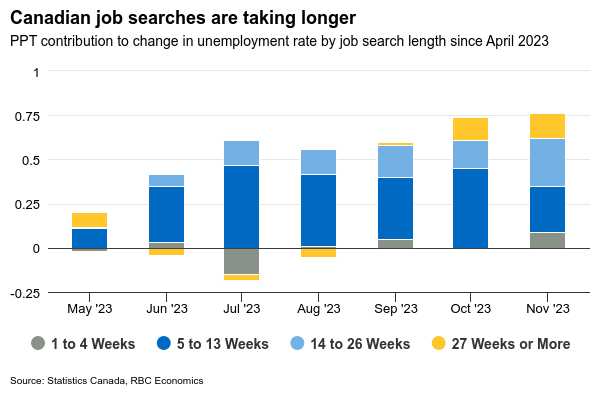
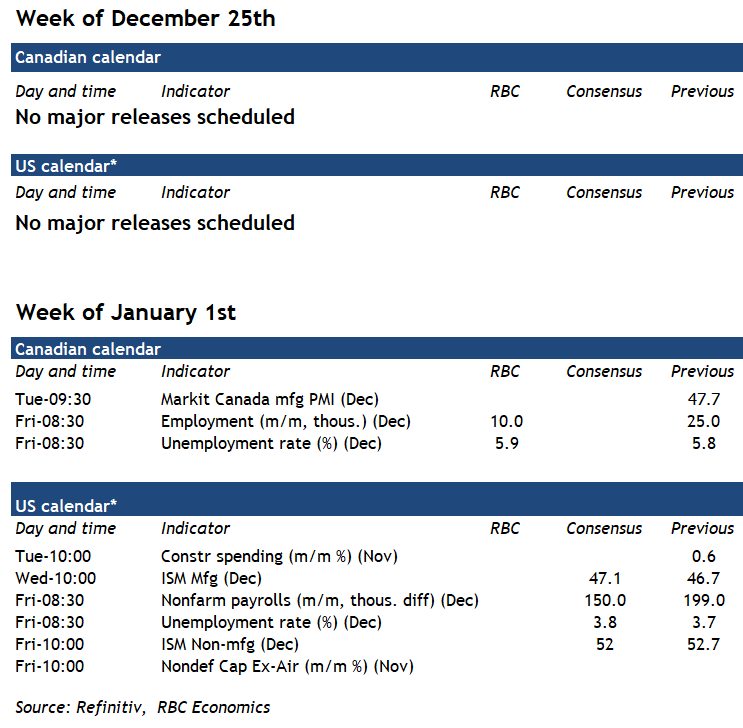
The holiday week ahead is empty of major economic data releases, but the new year will kick off with a fresh set of high profile Canadian and U.S. labour market data. We expect Canadian employment to edge higher again in December (+10k) to add to the 25k November increase. But that gain would (again) not be enough to offset surging growth in the labour force and we look for the unemployment rate to tick up another tenth of a percent to 4.9%. For now, higher unemployment has come from longer job search times rather than a rise in the number of layoffs. The 0.8 ppt rise the unemployment rate since the spring has come mostly from those taking longer to find work. Since April employment is up by 182k, but the labour force has expanded twice that pace (364K.)
Still, employment has been outright declining for some smaller groups within the labour force. Employment has fallen by 50K for those under the age of 25. Most of those declines have come from retail, construction, and finance sectors. New arrivals to Canada appear to have still been finding work relatively quickly compared to ‘normal.’ The unemployment rate for immigrants who landed in Canada less than 5 years ago is still higher than for other groups but was little-changed from the spring by our count. But unemployment has increased more significantly among those who have been in Canada for at least 5 years.
The December jobs report will be the last labour market update before the Bank of Canada’s January 24th announcement. The central bank is highly likely to remain on hold at that meeting, leaving the overnight unchanged. The BoC will remain cautious about declaring victory over inflation, but we expect further softening in the economic backdrop alongside a narrowing breadth of inflation mean the first cut will come by mid-year.
Week ahead data watch
U.S. payrolls will also be released on January 5th. We expect the December data will show a slight uptick of 186K jobs, with the unemployment rate ticking higher to 3.8% from 3.7% in November. November employment data was firmer than expected but against a backdrop of slower job growth. A continued moderation in inflation pressures alongside easing labour market tightness are expected to keep the Fed on the sidelines on January 31st.
U.S. Consumer Spending Up but Inflation Down in November
Personal income grew 0.4% month-on-month (m/m) in November, an acceleration from October's 0.3% gain and in line with market expectations.
Accounting for inflation and taxes, real personal disposable income rose 0.4% m/m, up from 0.3% previously.
Personal consumption expenditures rose 0.2% m/m, an acceleration from the downwardly revised 0.1% gain recorded in October, but in line with market expectations. Spending in real terms also grew by 0.3%, up from 0.1% previously.
Spending on services was up by 0.5% m/m, while goods spending declined by -0.2% m/m. Within services, the largest contributors to the increase were housing and utilities and food services and accommodations. Within goods, the leading contributor to the decrease was gasoline and other energy goods.
Headline personal consumption expenditure (PCE) inflation declined by -0.1% on the month (its first decline since April 2020). On a year-on-year (y/y) basis the measure decelerated to 2.6% from 2.9%. The core PCE price deflator (which is the Fed's preferred measure of inflation) held steady at 0.1% on a monthly basis and decelerated from 3.4% to 3.2% annually.
The personal savings rate ticked up in November to 4.1% from the upwardly revised 4.0% reading in October.
Key Implications
Two months into the final quarter of the year and the U.S. consumer continues to show incredible resilience. Despite sustained headwinds, a rise in income growth has helped to provide a boost to consumer's spending power. The holiday season in particular may have given consumers an extra impetus to spend, thereby contributing thus far to decent spending growth. The lift, however, is likely to fade heading into the New Year. All told, we anticipate that real consumption expenditure for Q4 will clock in at around 2.3% (q/q annualized) – a step-down from the stellar 3.1% growth posted in Q3 and marginally above our most recent forecast (see forecast).
The snapshot of inflation presented in today's report is sure to be welcomed by the Fed. The deceleration in both annual headline and core PCE inflation is good news. The outright decline in the monthly headline figure was even better. Today's report adds support to the central bank's decision to hold rates steady at their final meeting of the year (see FOMC). While markets continue to favor rate cuts as early as March, we don't see the first cut happening until sometime in the summer, as progress on the inflation front is likely to stall over coming months given the imbalances still present in the labor market.
Canada’s Economy Flatlined Again in October, Likely Advanced in November
The Canadian economy registered a third consecutive month of effectively no growth on a month-on-month (m/m) basis in October. This print comes in below Statistics Canada's advanced guidance and market expectations for a 0.2% m/m gain. The flash estimate for November points to a modest gain of 0.1% m/m.
October's reading was mixed, with output expanding in 10 of 20 industries. Goods producing industries showed no growth, while the services side showed a positive 0.1% m/m gain.
On the goods side, durable goods manufacturing (-1.3% m/m) dragged the overall sector down for the fourth time in five months. The construction sector registered a slight 0.1% m/m contraction. Offsetting these declines was a 1.0% m/m gain in the mining, quarrying, and oil & gas sector.
On the services side, retail trade grew by a healthy 1.2% m/m, led by clothing, general merchandise and personal care stores. Accommodation and food services advanced by 0.9% m/m while health care and education notched slight gains of 0.3% m/m and 0.2% m/m, respectively. Wholesale trade (-0.7% m/m) pulled back for a second straight month. The St. Lawrence Seaway strike impacted the transportation sector (-0.2% m/m).
The advanced reading of slight growth in November was driven by increases in manufacturing, transportation, and agriculture. November's retail trade was cited as a headwind.
Key Implications
October's GDP print ended up a little frosty against expectations that the economy would advance at a decent pace. With today's print and guidance for November, fourth-quarter GDP is tracking sub-1.0% quarter-on-quarter annualized. This is roughly in line with our own expectations as well as that of the Bank of Canada (BoC).
It's safe to say that rate hike risk is virtually off of the table with markets now squarely focused on the timing of rate cuts. The BoC has firmly entered into a holding pattern as they receive evidence that growth is evolving in a manner consistent with reaching their 2% inflation target. We expect the BoC to still remain vigilant and not declare victory too early. But all said, the Bank should feel a sense of comfort heading into the new year.