Sample Category Title
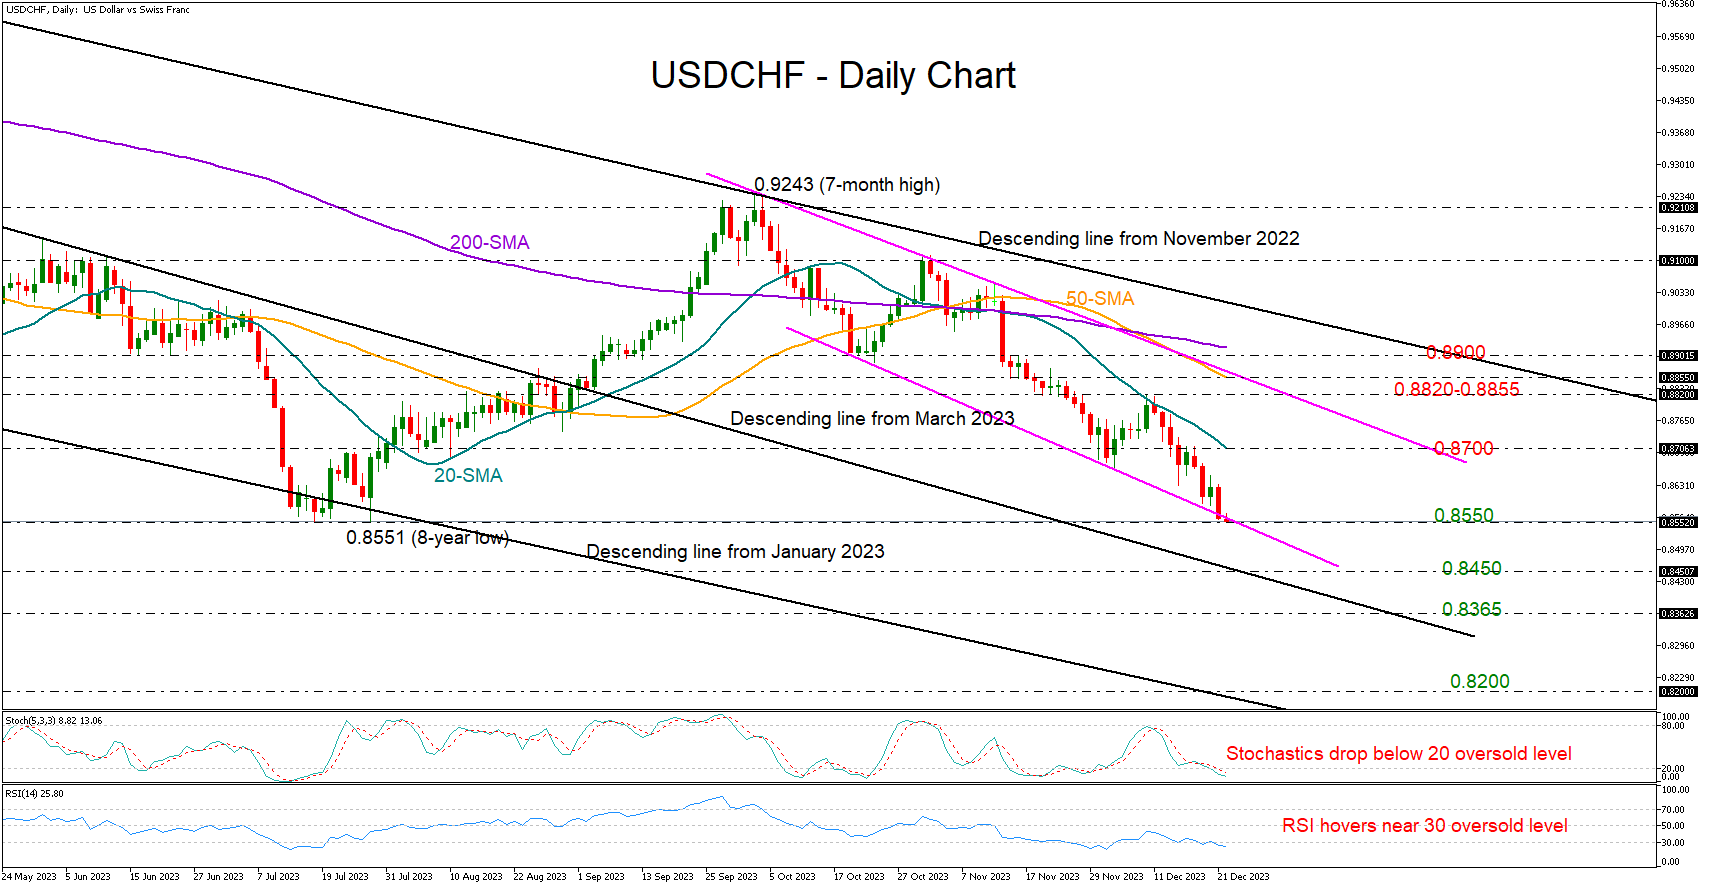
USDCHF Hits 2023 Floor
- USDCHF tests July’s eight-year low
- Sellers might stay in power, but not for long
- Core PCE inflation due at 13:30 GMT
It was another bearish week for USDCHF, with the price fully retracing its July-September upleg to reach July’s eight-year low of 0.8551.
There is potential for an upside reversal around the 2023 floor of 0.8550. However, the RSI and the stochastics have yet to bottom out in the oversold region, suggesting the sellers might stay in play for a bit longer.
The 0.8450 region, where the broken descending trendline from March 2023 is positioned, could generate fresh buying ahead of the important January 2015 support area of 0.8365. If the latter proves fragile, the sell-off could pick up steam to meet the 2015 low of 0.8200 and the falling line from January 2023.
Should the price rotate higher near 0.8550, the spotlight will turn again to the constraining 20-day simple moving average (SMA) at 0.8700, which blocked the way up earlier this month. A successful penetration higher could then retest December’s high of 0.8820 ahead of the 50-day SMA at 0.8855, while a more aggressive bullish wave could challenge the 200-day SMA near 0.8900.
In short, USDCHF keeps facing downside risks near a critical support area, though it is also trading within oversold territory, increasing hopes for a bullish correction.
Solana and Bitcoin Failing to Storm Milestone
Market picture
Crypto market capitalisation was climbing to $1.67 trillion on Friday morning – a new high since May 2022. However, very quickly, the market was hit by another wave of profit-taking, which has become commonplace over the past fortnight.
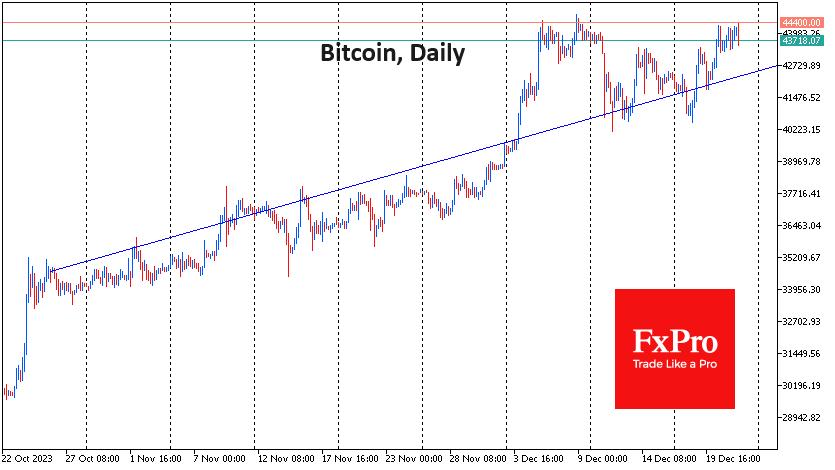
Bitcoin is once again pulling back down after touching the $44.4K level, having retreated to $43.7K by the start of active trading in Europe. Horizontal resistance has been effectively holding back the bulls for the past three weeks. On the other hand, the price dips are getting shallower, keeping the longer-term bullish trend in place.
Solana lost over 6% in a couple of hours, correcting after a failed assault on the $100 mark. But even with the pullback to $94, this altcoin is adding 8% in 24 hours and over 70% in 30 days. Its capitalisation is now only 8% below BNB, which is ranked #4 on CoinMarketCap.
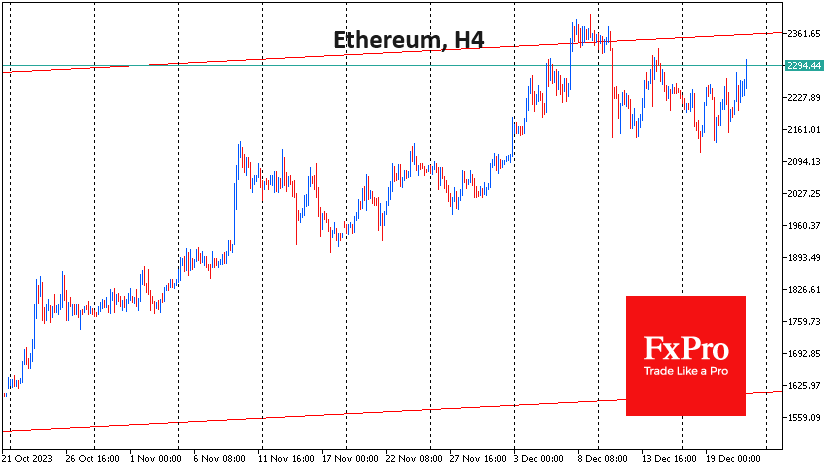
The temporary nature of the BTC and SOL pullback is indirectly indicated by the positive dynamics of ETH, whose growth has accelerated in the last few hours and brought the price to $2300.
News background
A number of catalysts in conjunction with historical patterns could “catapult” Bitcoin to $160K in a bull market in 2024, according to CryptoQuant. In the short term, demand for BTC from several spot ETFs in the US, the upcoming halving and gains in stock markets following the US interest rate cut could lift the asset’s price to at least $54K.
According to CryptoQuant, bitcoin miners reached record total commissions amid increased trading activity in the Bitcoin Ordinals protocol due to increased demand for the blockchain space. The overall increase in transaction fees also impacted mining revenue.
Hardware wallet maker Trezor added support for Solana cryptocurrency (SOL) and SPL tokens. The new options come in the Model T and Safe three devices priced at $179 and $79, respectively. SPL is a Solana blockchain-based token standard similar to ERC-20 for Ethereum.
According to Messari, the average daily number of active addresses on the Solana network increased by 400% in the fourth quarter of 2023. During the same period, the number of Ethereum addresses participating in daily transactions grew by just 3%.
An appeals court in the US has formalised the seizure of 69,370 BTC belonging to the shuttered darknet marketplace Silk Road. The US Department of Justice seized the assets in November 2020.
In 2023, 42 countries around the world have implemented initiatives to regulate digital assets, according to a report by auditing firm PricewaterhouseCoopers (PwC).
Canadian Dollar Powers Higher, GDP Next
Friday’s economic releases:
- Canadian GDP
- US PCE Price Core Index
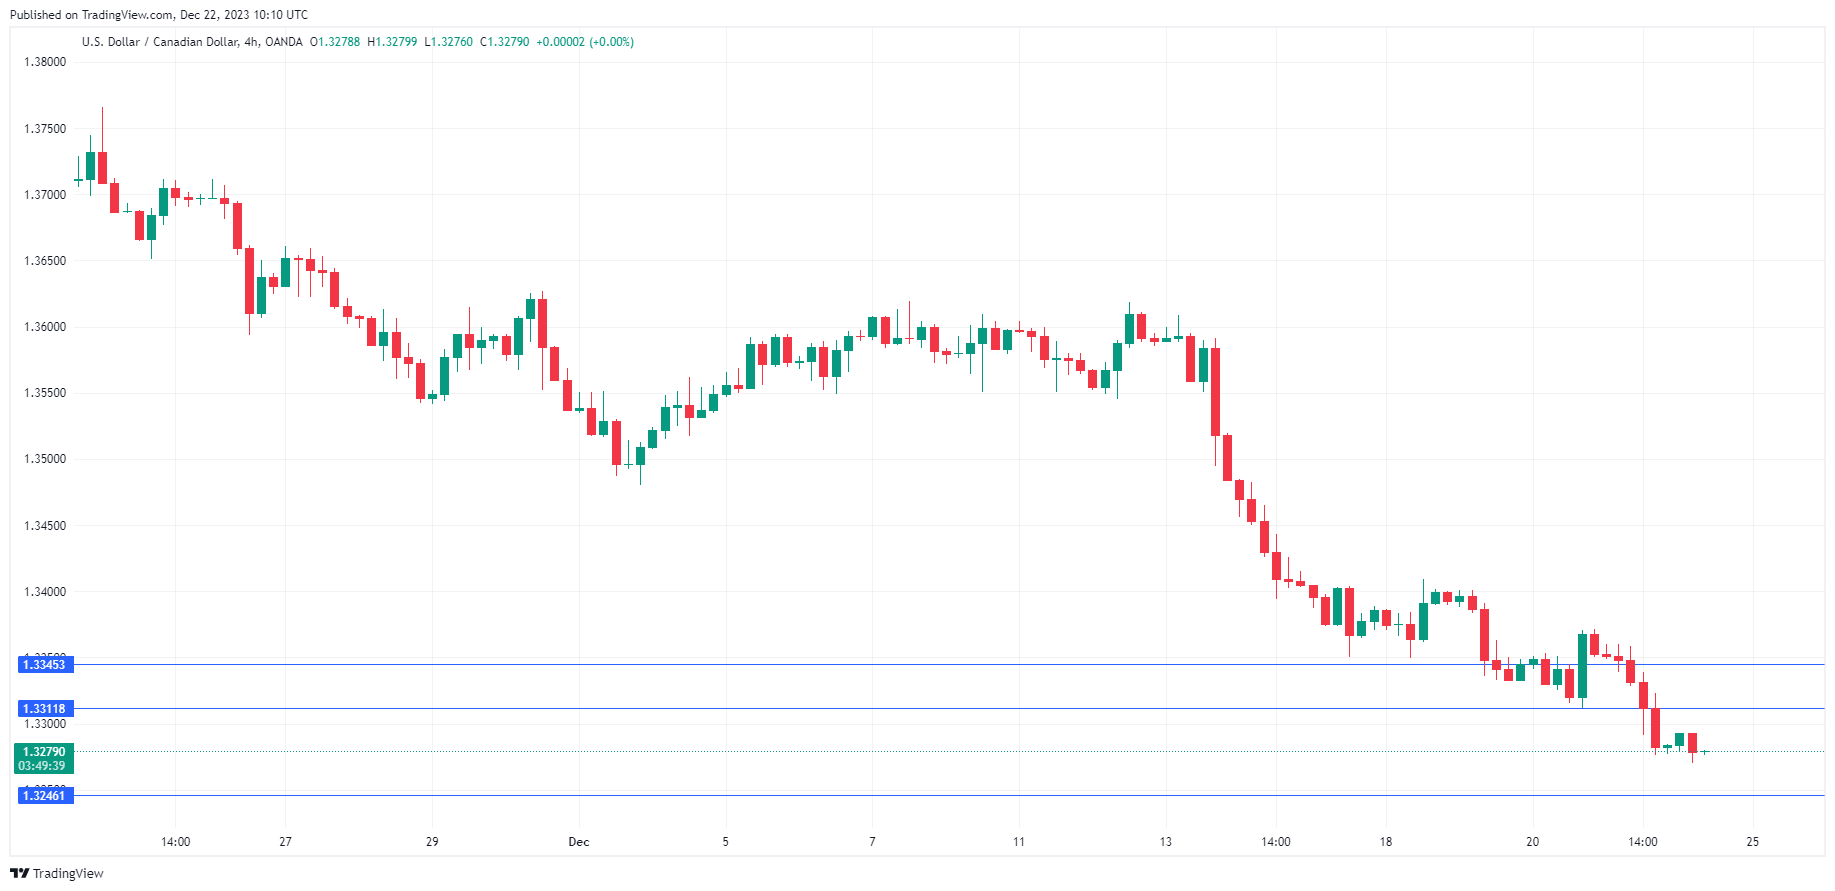
The Canadian dollar is showing limited movement on Friday. In the European session, USD/CAD is trading at 1.3276, down 0.05%. We could see stronger movement in the North American session, with the release of Canada’s GDP and the US PCE Price Index.
The US dollar continues to stumble and Thursday’s disappointing US GDP report helped send the Canadian dollar gain 0.64% against the greenback. The third-estimate GDP for the third quarter was 4.9% q/q, shy of the 5.2% gain in the second estimate. The slowdown was mainly due to weaker consumer spending, which rose 3.1% in the third estimate, compared to 3.6% in the second estimate. Still, this was the fastest pace of growth since Q4 2021 and hopes are high that consumers will have their wallets and purses open wide for the Christmas season.
Canadian retail sales fell shy of expectations on Thursday, but the Canadian dollar still posted strong gains. In October, retail sales rose 0.7% m/m, just below the preliminary estimate of 0.7% and above the downwardly revised 0.5% gain in September. However, November is expected to show a downturn, with a preliminary estimate of 0%.
Canada’s economy has hit a rough patch, although fears of a shallow recession failed to materialize as the economy posted weak growth in the third quarter. September GDP came in at just 0.1% m/m and October is expected to tick up to 0.2%.
In the US, Federal Reserve members have tried to dampen market expectations for rate cuts next year. The markets are expecting the Fed to go on a tear, with up to six cuts in 2024, but Fed members are urging caution. Atlanta Fed President Raphael Bostic said earlier this week that he expected two rate cuts in the second half of 2024. On Friday, the Fed will get a look at the PCE Price Index, the central bank’s preferred inflation indicator. The headline and core readings are expected to remain unchanged in November, at 0.2% and 0%, respectively.
USD/CAD Technical
- 1.3311 and 1.3345 are the next resistance lines
- There is support at 1.3246 and 1.3212
GBP/USD Shrugs After Mixed UK Data
- UK retail sales jump 1.3%, GDP contracts by 0.1%
- US to release PCE Price Index on Friday
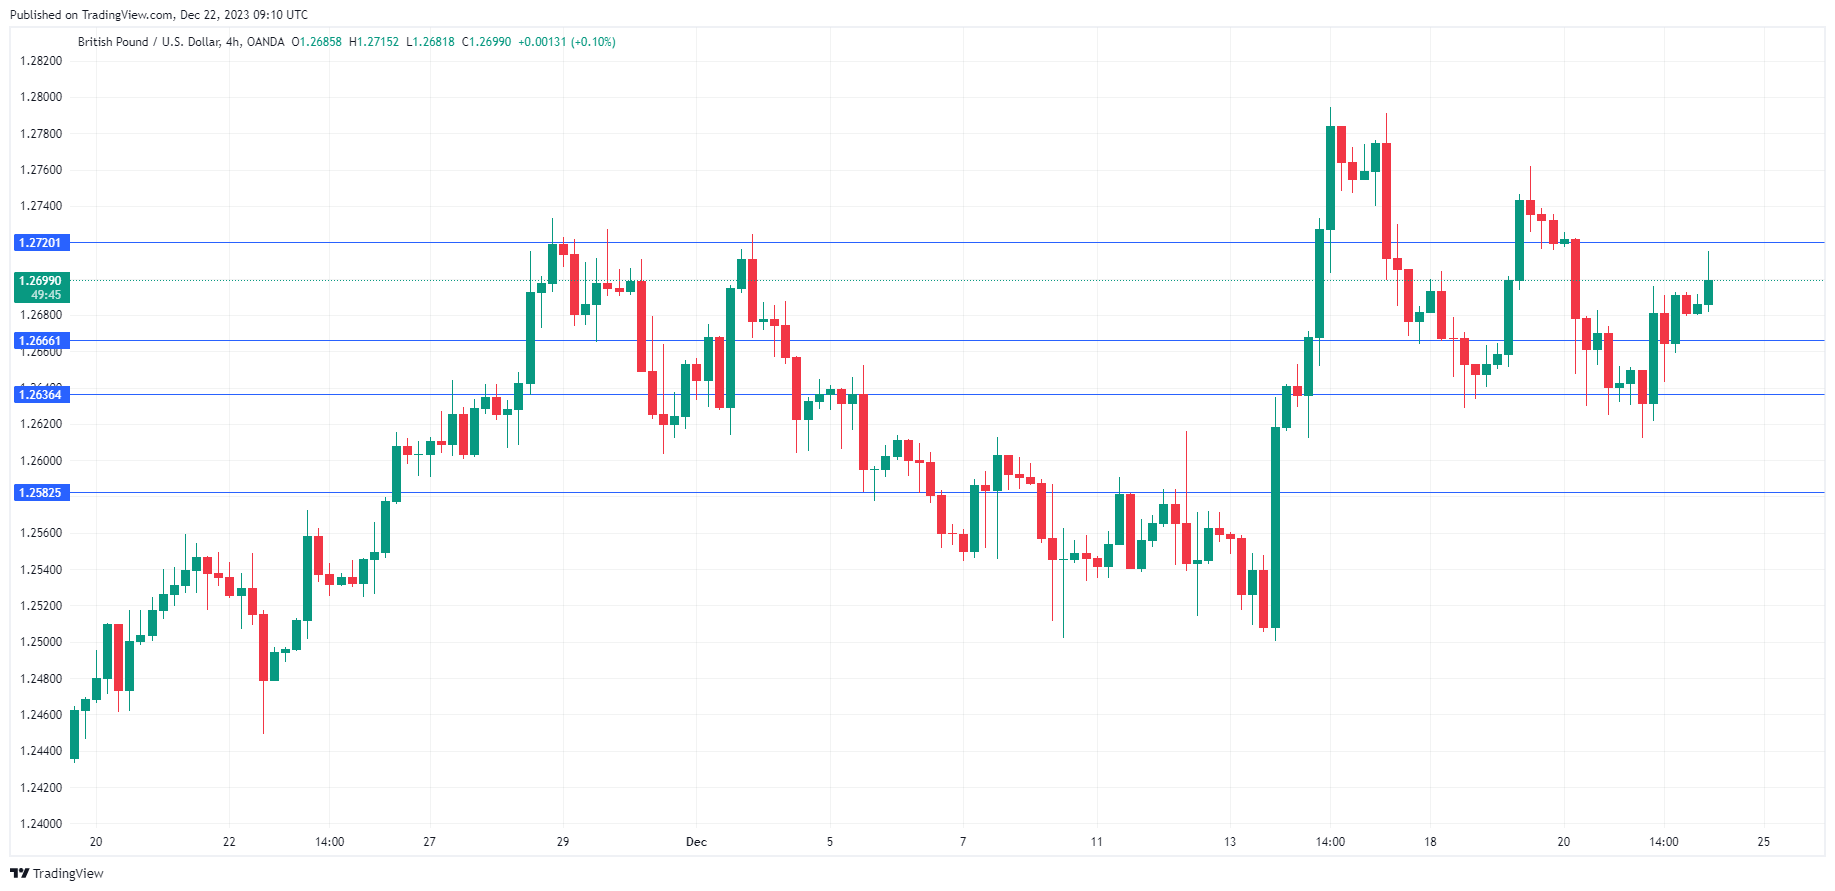
The British pound is drifting on Friday. In the European session, GBP/USD is trading at 1.2701, up 0.08%.
UK retail sales rebound but GDP contracts
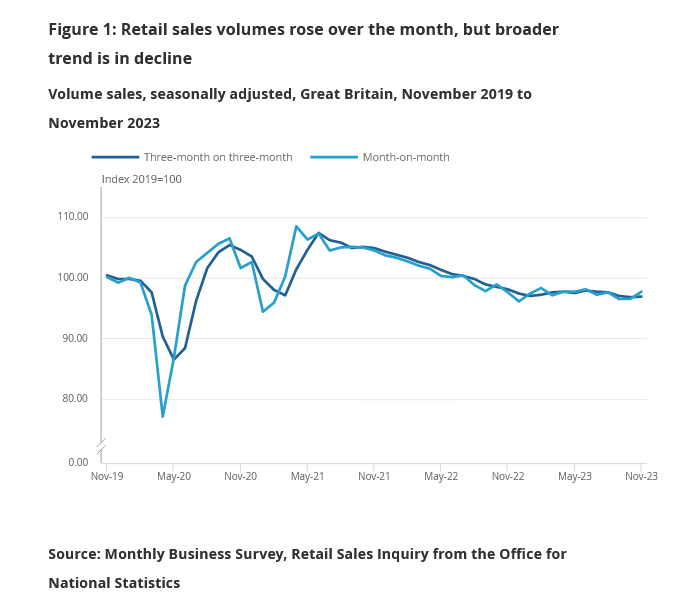
UK retail sales jumped 1.3% in November m/m, bouncing back from 0% in October and beating the consensus estimate of 0.4%. This was the sharpest pace of growth since January and the increase was felt in all sub-sectors. Yearly, retail sales edged up 0.1%, after a downwardly revised decline of 2.5% in October and above the market consensus of -1.3%.
The GDP report was less cheery, as second-estimate GDP for Q3 came in at -0.1%, compared to 0% in the preliminary estimate. This has raised concerns that the weak UK economy could tip into a recession, as negative growth in the fourth quarter would officially be considered a technical recession. GDP for the second quarter was revised downwards to no growth, compared to the initial estimate of 0.2%.
The Bank of England will have to decide what to do with this mixed bag of data. The weak GDP could put pressure on the BoE to cut interest rates, but the sharp rebound in retail sales supports the central bank continuing its ‘higher for longer’ stance. The BoE has maintained the cash rate at 5.25% for three consecutive times.
In the US, Federal Reserve members have been pushing back this week against market expectations for rate cuts next year. The markets have priced in up to six cuts in 2024, but the Fed members have said that the markets are getting ahead of themselves and Atlanta Fed President Raphael Bostic said he expected two rate cuts in the second half of 2024. On Friday, the Fed will get a look at the PCE Price Index, the central bank’s preferred inflation indicator. The headline and core readings are expected to remain unchanged in November, at 0.2% and 0%, respectively.
GBP/USD Technical
- GBP/USD is putting pressure on resistance at 1.2720. The next resistance line is 1.2750
- 1.2636 and 1.2582 are providing support
USDCAD Slips to Almost 5-Month Low
- USDCAD continues the sell-off in short-term
- 20- and 200-day SMAs post death cross
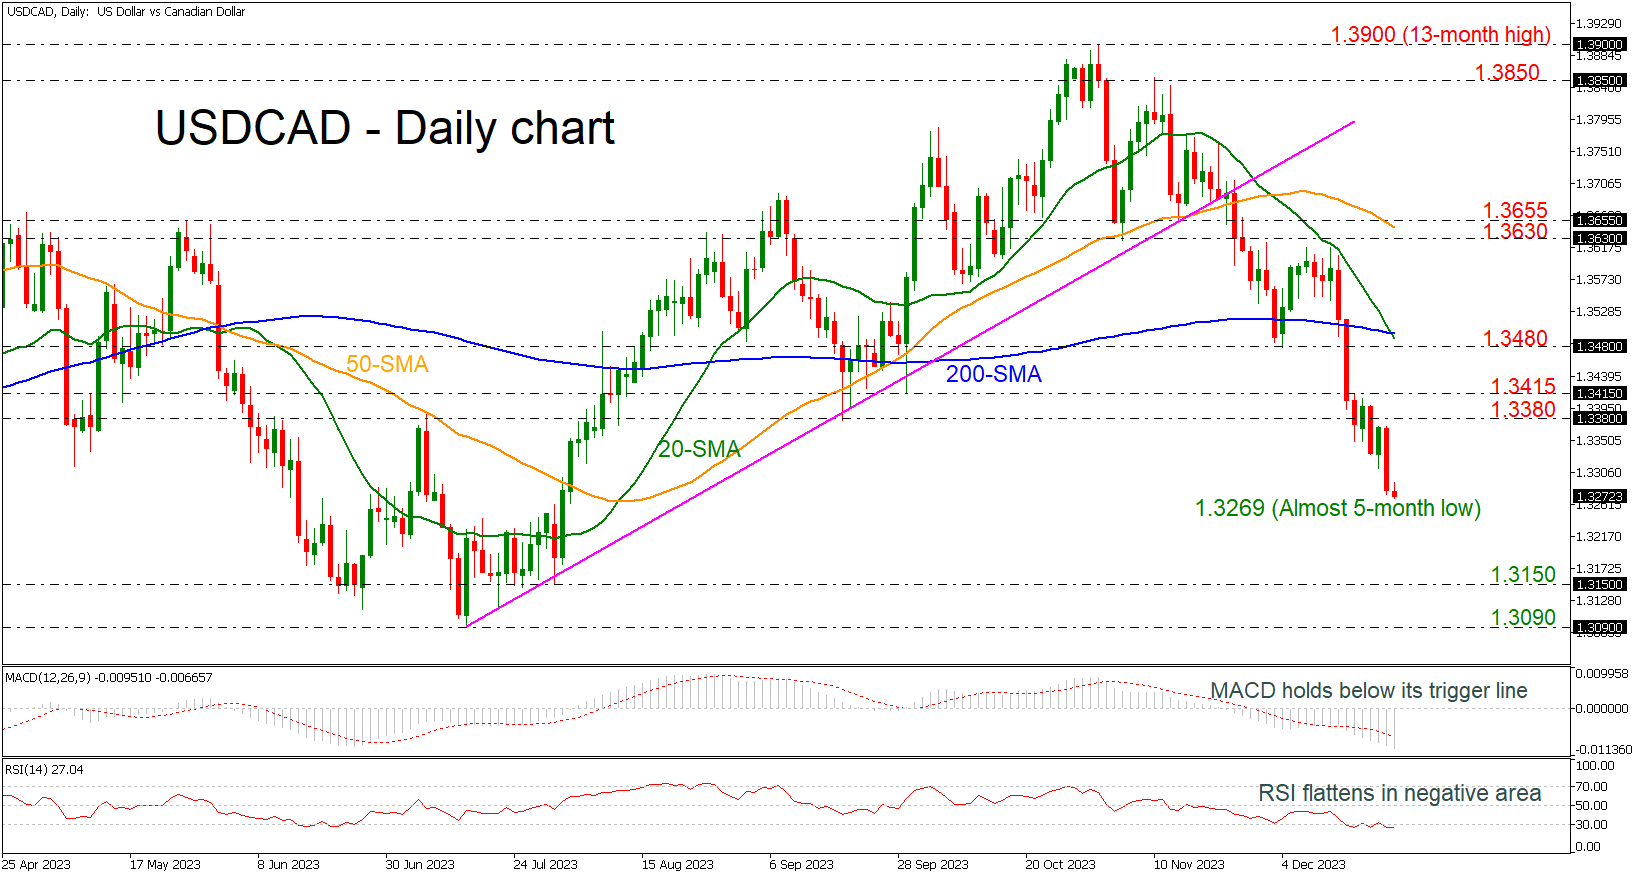
USDCAD plummeted to a fresh almost five-month low earlier today, continuing the sharp selling interest that started from the 13-month high of 1.3900.
Technically, the 20- and the 200-day simple moving averages (SMAs) posted death cross, confirming the latest bearish wave in market. The MACD oscillator is strengthening its negative momentum beneath its trigger and zero lines, while the RSI is flattening in the oversold area.
The pair has key levels underneath for protection against selling forces. The 1.3150 support level, achieved on July 31 is the first obstacle for traders to have in mind ahead of the 1.3090 barricade, taken from the lows on July 14.
In the event of an uptrend resumption above the 1.3380-1.3415 restrictive region, the bulls might take a breather near the bearish cross of the 20- and the 200-day SMAs around the 1.3480 resistance level. More gains could lead the market towards the 1.3630-1.3655 resistance area, which encapsulates the 50-day SMA.
In brief, USDCAD sellers are holding the upper hand, and the market is posting a strong bearish correction in the short-term timeframe. A close above the death cross may show some optimism for a potential upside recovery.
Soft Inflation at the Top of Santa’s Wishlist
Appetite in European stocks waned yesterday, yet the US counterparts recovered Wednesday losses and closed the session more than 1% higher as the latest growth data was revised slightly lower to 4.9%, real consumer spending was revised down from 3.6% to 3.1%, corporate profits from above 4 to 3.7%. Else, jobless claims came in lower than expected and the Philly Fed index printed a sharper contraction in December. All in all, the data pointed at a certain slowdown – except for the jobless claims – but the numbers looked strong in absolute terms: that’s about everything that the soft-lander camp love to hear : a slowing economy that will allow the Federal Reserve (Fed) to loosen its grip on the monetary policy, but an economy that will avoid entering recession if inflation falls and remains low near the Fed’s 2% target. As such the S&P500 closed a few points below 4500 and Nasdaq 100 a few points below an ATH.
Today's inflation print is the Fed puzzle's last crucial piece. If today’s PCE print comes in as soft as expected, or ideally softer-than-expected, we shall see the rally in bonds – and perhaps in stocks – extend the Santa rally. In numbers, core PCE is expected to show no change on a monthly basis. If that’s the case, the core PCE – the Fed’s favourite gauge of inflation – will fall to the Fed’s 2% target over the past 6 months, on an annualized basis. Given the strong positive trend and the market’s optimism, a sufficiently soft inflation figure should be enough to justify a fresh record for the S&P500 after the Dow Jones and Nasdaq renewed record after record over the past week. When the market is high on dovish Fed expectations, the sky is the limit.
Presently, swaps point at six 25bp cut in the US by this time next year. That’s a 150bp cut in total. It means that the US rates are expected to fall to 375/400bp range in a year time. And that leaves the 2-year bond – which currently yields near 4.35% with plenty of room to extend rally. This being said – and I can’t repeat it enough – if the US economy is set for a 150bp cut, it would also be due to something ugly that would’ve triggered that Fed reaction. A 5% growth, combined with robust consumer spending, strong profit expectations and a historically low unemployment rate don’t call for a 150bp cut.
Elsewhere
Today’s inflation data from Japan confirmed an expected fall in inflation to 2.5% from 2.9% printed a month earlier. As such, there is no rush for the Japanese policymakers to move; low rates are sweet for growth if they don’t generate inflation. Plus, the yen appreciation should keep inflation contained in Japan and leave the Bank of Japan (BoJ) in a position to … wait until at least April to exit the negative rates… et encore. Therefore, there is a weakening case for the USDJPY to dip below the 140 level, and there is no issue with buying the Japanese stocks at 33-year high levels when the BoJ remains so supportive.
In Europe, the EURUSD bulls are waiting for the US inflation data in ambush. A sufficiently soft inflation read is expected to boost the Fed doves, back a further USD depreciation and drive the EURUSD above the 1.10 mark to the end of the year. In this configuration, gold will also remain on track for further gains above the $2000 level.
Good bye
American crude is testing the top of the downtrending channel that has been building since the end of September. The $74/75 offers continue to push back the bullish attempts, while trend and momentum indicators are strong and tell that a positive breakout is still possible and could lead the price of a barrel to near 200-DMA – near $78pb.
The latest news from OPEC is not necessarily enchanting. Angola decided to leave OPEC as the country rejected the restricted production quotas that the cartel imposed on them. But note that, Angola won’t be pumping significantly more outside OPEC: once Africa’s biggest producer, the country’s production collapsed by 40% in 8 years due to an unfavourable tax environment and the absence of fresh investments, and the country pumped just above 1.1mbpd, anyway. Therefore, in absolute terms, Angola’s exit won’t change the dynamics for OPEC, but Angola’s walkout is just another reminder that the tensions are mounting at the heart of OPEC, and the cartel – which now has the lowest market share of its history – will hardly maintain an impactful position to influence the oil price if they can’t show unity.
USD Weakness Continues Ahead of Holidays
In focus today
The most important data release today will be the US November Personal Consumption Expenditures (PCE). Consensus expects Core PCE inflation to have remained steady in m/m SA terms at +0.2%. Earlier CPI and retail sales data hinted that private consumption has likely continued growing modestly even in real terms. November durable goods orders and final University of Michigan December consumer survey will also be released for the US.
No key market movers are due for release in Europe, UK November retail sales and French November PPI will be released today.
No ECB or Fed speeches have been scheduled for today.
Danske Morning Mail will be on a holiday break until 2nd of January. We wish all our readers happy holidays!
The 60 second overview
Macro: Overnight, Japan's November inflation cooled in line with expectations, headline CPI ticked down to 2.8% y/y (from 3.3% y/y) while core CPI moderated to 2.5% y/y (from 2.9%). On the other hand, services inflation continued to pick up speed, which could be a sign of more broad-based price pressures. Nevertheless, JPY weakened modestly vis-à-vis both USD and EUR. Yesterday's macro releases lifted markets' hopes of cooling inflation also in the US. While initial jobless claims surprised once again to the downside (205k; from 203k; consensus 215k), Q3 GDP growth was revised down in the final release (4.9%; from 5.2%). Fiscal policy driven structures investments were revised higher, while private consumption accounted for a large share of the downward revision. At the same time, Q3 core PCE inflation was revised lower, even if the Fed likely focuses more on today's more timely release for November.
Geopolitical radar: An increasing number of shipping companies have announced they are avoiding the Red Sea following hostilities by the Yemen's Houthi rebels (see Reuters). While global supply challenges have eased markedly since the pandemic, and we do not expect the situation to have strong implications for the macro outlook, we will continue monitoring the situation. This morning, we published our final Gepolitical Radar - What to look out for in 2024, of the year, taking stock of the wide range of disruptions seen in 2023. We also cover the outlook for upcoming key elections in 2024, not least in the US, Taiwan and the European Parliament.
EU fiscal rules: Yesterday, we published a piece on the new fiscal rules in the EU as well as possible implications for growth and market. Compared to the old rules, the new ones are less stringent, outlines more gradual and country-specific fiscal adjustment paths, and protects certain investments and structural reforms. The implications for the growth outlook and markets are yet to be seen as we ultimately need to see the rules being enforced in practice before making firm conclusions. However, all things equal, we will see a tighter fiscal stance given the old fiscal rules have been suspended since COVID. Moreover, assuming the rules are enforced, which is our baseline, we expect tighter sovereign spreads. See Flash: New EU Fiscal Rules - A realistic compromise , 21 December.
Equities: Global equities bounced back yesterday after the largely unexplained late-day selloff on Wednesday. Most focus on zero-day options as the reason for the Wednesday sell-off and it sounds the most plausible as markets basically reversed yesterday. Gains driven out of the US with a little preference for small caps. The fact that VIX is also coming in slightly support the view of a one-off event Wednesday and not the beginning of a shift in narrative. In US yesterday, Dow +0.9%, S&P 500 +1.0%, Nasdaq +1.3% and Russell 2000 +1.7%. Very mixed performance in Asia this morning with tech stocks dragging down China while Asia ex China is mostly in green. Futures in both Europe and US higher this morning.
FI: European rates ended virtually unchanged on the day with limited market volatility in the 10y point heading into the seasonal slowdown in liquidity and market activity. The 10y point recorded a minor rally on the back of the weaker than expected US data (revisions to Q3 GDP, PCE data), albeit that was later reversed. Overall the curve steepened around the 7-10y point on the curve. Following the funding statements from EA debt offices in recent days and ECB's PEPP announcement last week, we see the net issuance next year, net of ECB bond buying at EUR622bn, which are 20bn higher than this year. Note that this does not include EU (which is projected at EUR150bn net next year.
FX: Broad USD weakness pulled USD/JPY toward 142 and EUR/USD, which has spent this week within 1.09-1.10, toward the upper end of that range. GBP/USD and AUD/USD moved higher while USD/CAD and, in Scandies, especially USD/SEK was under pressure and the latter printed a new year low yesterday. EUR/SEK made a brief visit below 11.10 but ended the US session close to it, while EUR/NOK were relatively stable above 11.30.
Credit: Credit markets were quiet with limited primary and secondary activity. ITraxx Main and iTraxx X-Over were both unchanged compared to the day before. Sydbank raised its guidance for 2023 as loan losses have been lower than expected and market conditions have been slightly better than ecpected. Sydbank is the latest of a number of banks raising 2023 forecasts - underlining the solid earnings momentum in the banking industry currently.
UK retail sales volumes rises 1.3% mom in Nov, sales value up 1.0% mom
UK retail sales volumes (quantity bought) rose 1.3% mom in November, well above expectation of 0.4% mom. Ex-automotive fuel sales values rose 1.3% mom. Over the year, sales volumes rose 0.1% yoy while ex-fuel sales volume rose 0.3% yoy.
Sales value (amount spent) rose 1.0% mom, 3.8% yoy. Ex-fuel sales value rose 1.2% mom, 5.7% yoy.
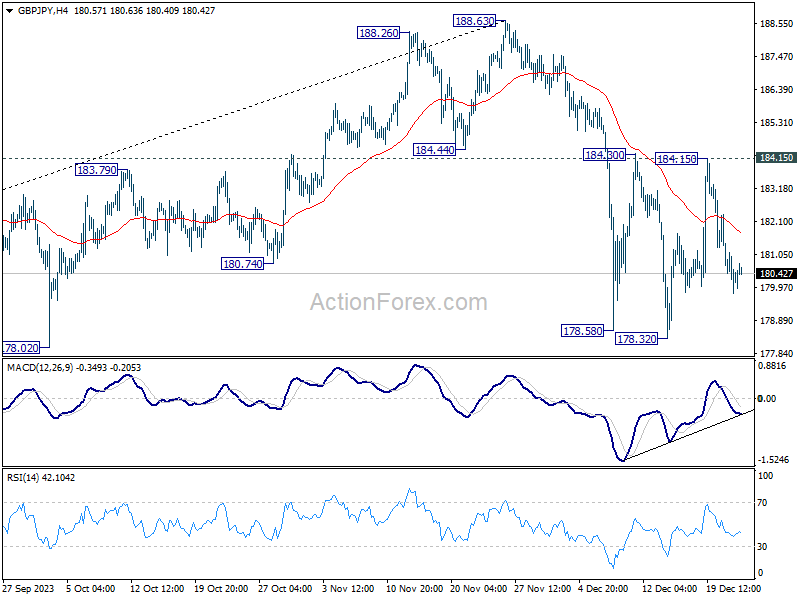
GBP/JPY Daily Outlook
Daily Pivots: (S1) 179.55; (P) 180.56; (R1) 181.32; More...
Intraday bias in GBP/JPY remains neutral as range trading continues. Further decline is expected as long as 184.15 resistance holds. On the downside, break of will resume the decline from 188.63 and target 38.2% retracement of 148.93 to 188.63 at 173.46. However, decisive break of 184.15 will argue that pull back from 188.63 has completed and bring retest of this high.
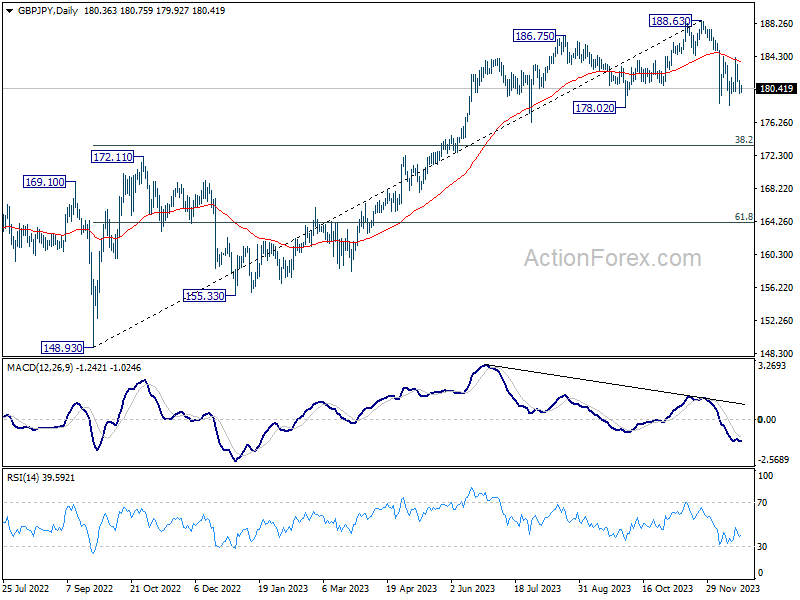
In the bigger picture, price actions from 188.63 medium term top are currently seen as a correction to the up trend from 148.93 (2022 low) only. As long as 172.11 resistance turned support holds, larger up trend from 123.94 (2020 low) is still in favor to resume through 188.63 at a later stage.
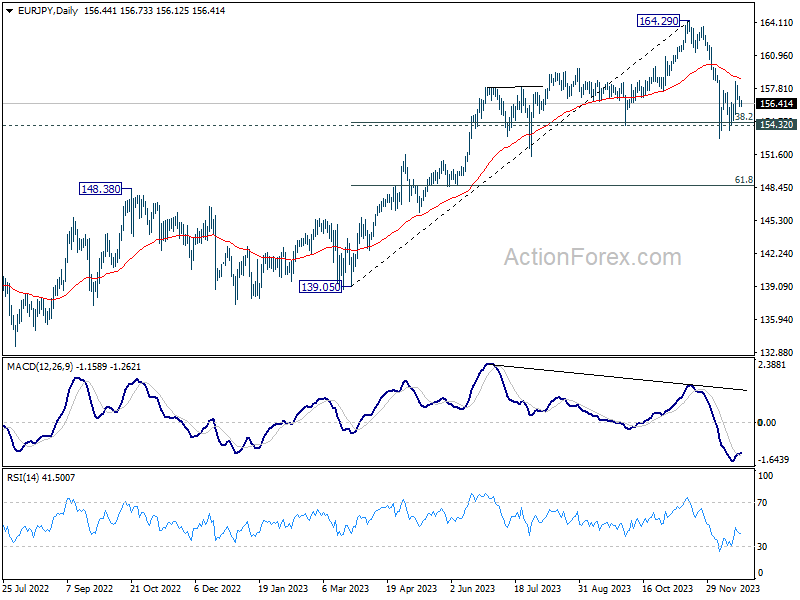
EUR/JPY Daily Outlook
Daily Pivots: (S1) 156.02; (P) 156.57; (R1) 157.01; More..
Intraday bias in EUR/JPY remains neutral at this point. On the upside, above 158.55 will resume the rebound from 153.15 through 55 D EMA (now at 158.82). On the downside, break of 153.15 will resume whole fall from 164.39 to 61.8% retracement of 139.05 to 164.29 at 148.69.
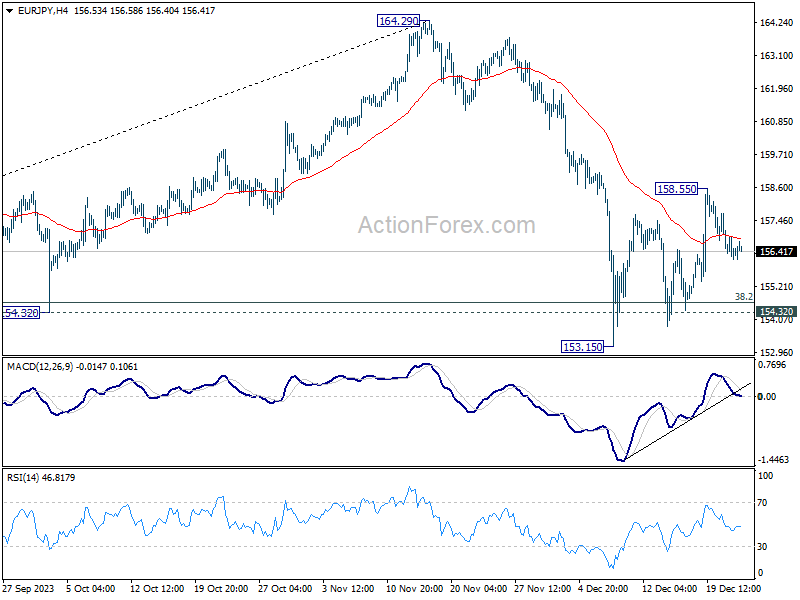
In the bigger picture, price actions from 164.29 medium term top are tentatively seen as a correction to rise from 139.05 for now. As long as 148.48 resistance turned support holds (2022 high), larger up trend from 114.42 (2020 low) could still resume through 164.29 at a later stage.