Sample Category Title
Technical Outlook and Review
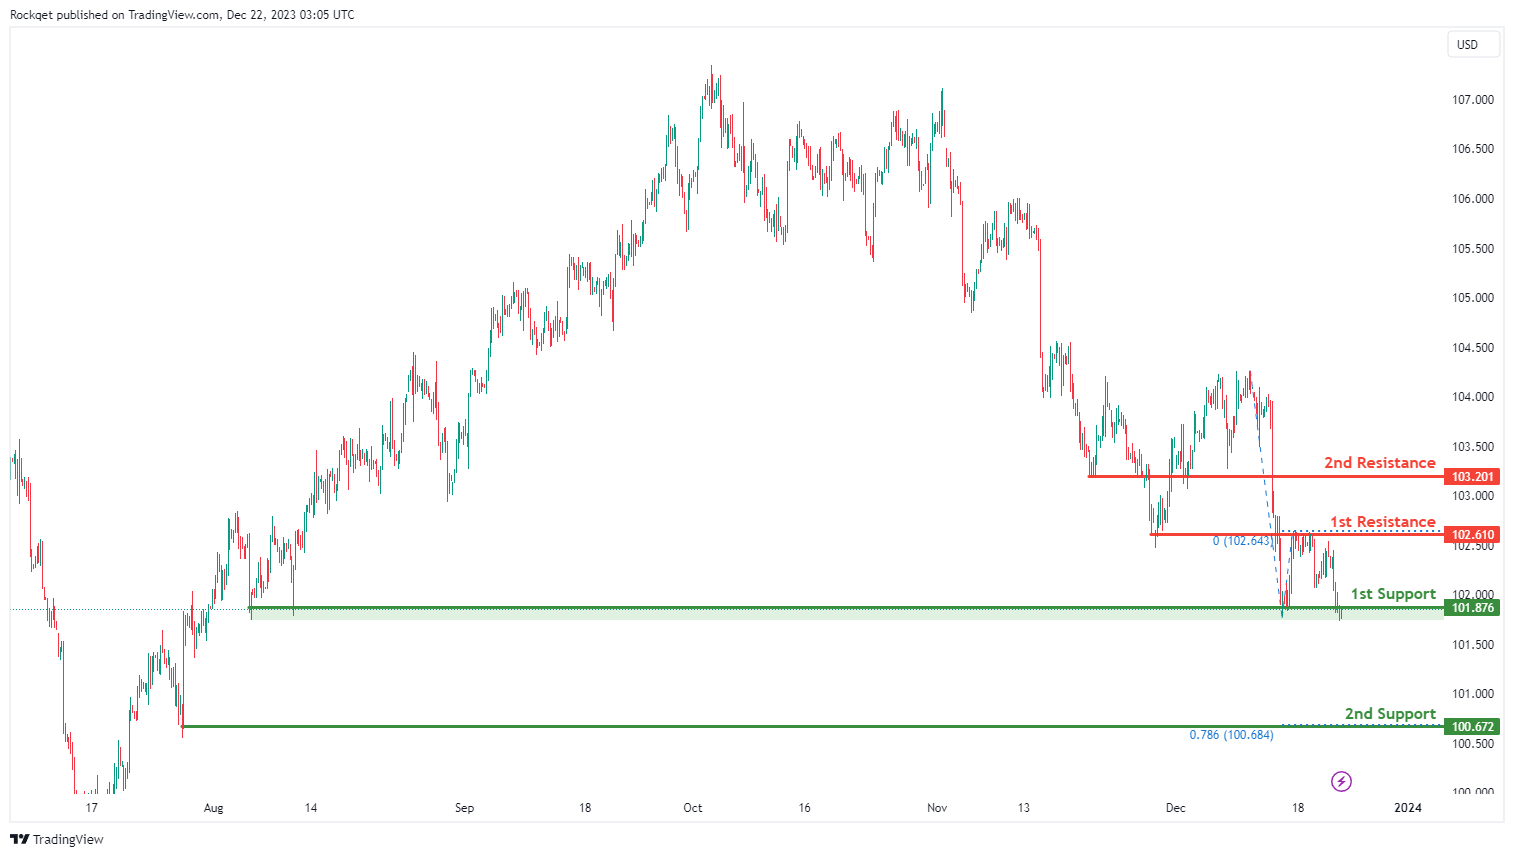
DXY:
The DXY (US Dollar Index) chart currently shows an overall bearish momentum, indicating a potential for price to break under the 1st support and drop towards the 2nd support.
The 1st support level at 101.87 is identified as a multi-swing-low support. Further below, the 2nd support level at 100.67 is noted as a swing-low support that aligns with the 78.60% fibonacci projection level, further reinforcing its importance as a potential key support level.
To the upside, the 1st resistance level at 102.61 is identified as an overlap resistance. Higher up, the 2nd resistance level at 103.20 is also marked as an overlap resistance, suggesting a potential barrier for further upside movement.
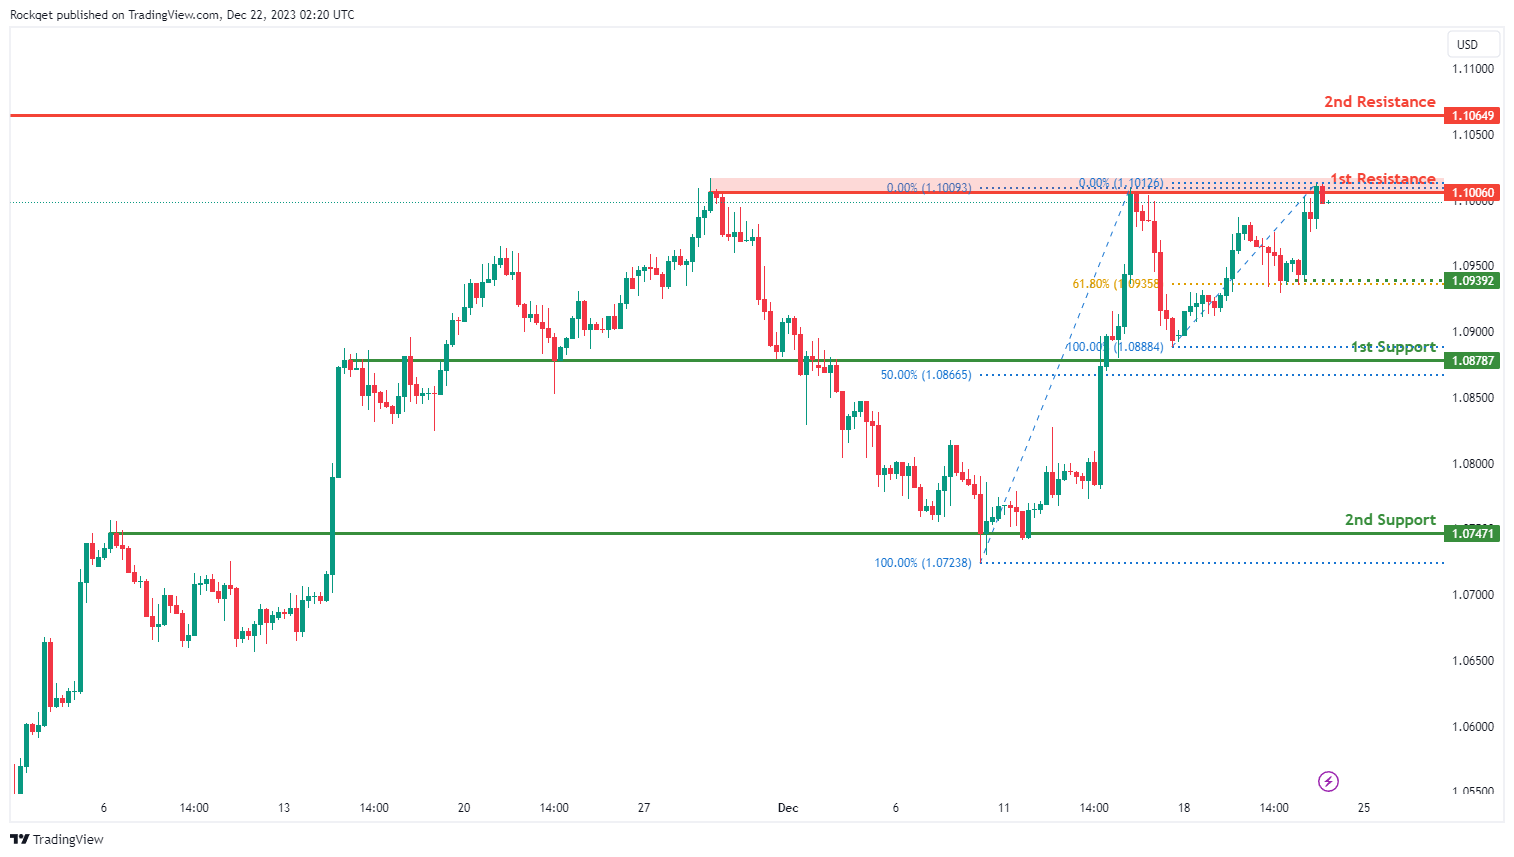
EUR/USD:
The EUR/USD chart currently exhibits an overall bullish momentum. However, there is a potential scenario for price to make a bearish reaction off the 1st resistance and drop towards the 1st support, especially if price breaks below the intermediate support.
The 1st resistance level at 1.1006 is identified as a multi-swing-high resistance. Higher up, the 2nd resistance level at 1.1064 is noted as a swing-high resistance, suggesting a potential barrier for further upside movement.
To the downside, the intermediate support level at 1.0939 is identified as a pullback support that aligns with the 61.80% Fibonacci retracement level while the 1st support level at 1.0878 is noted as an overlap support that aligns close to the 50.00% Fibonacci retracement level. Further below, the 2nd support level at 1.0747 is also marked as an overlap support, further reinforcing its importance as a potential key support level.
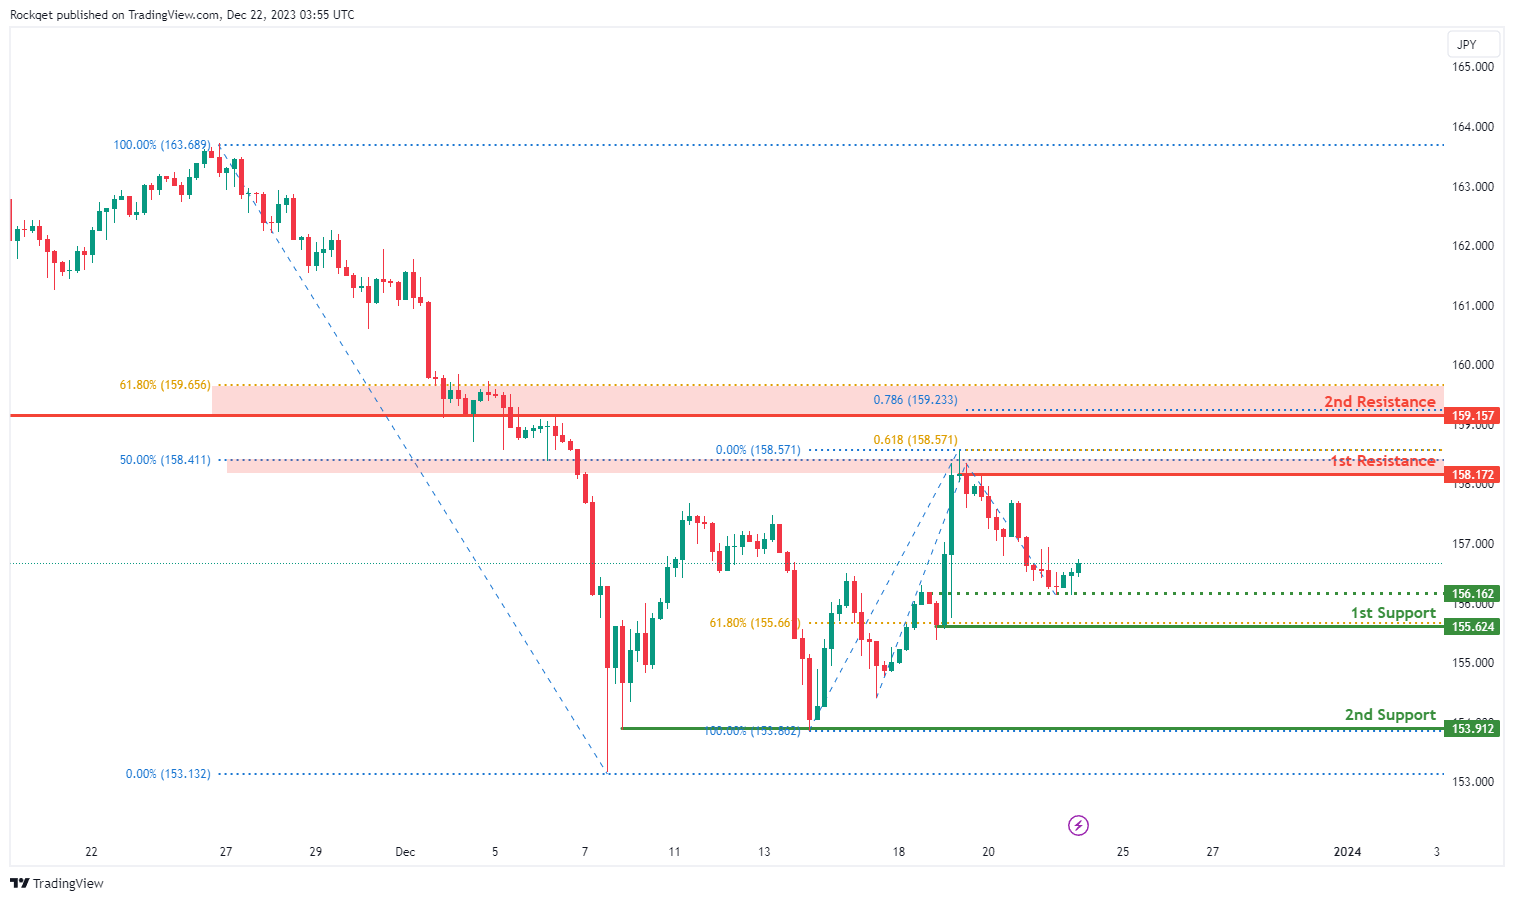
EUR/JPY:
The EUR/JPY chart currently exhibits a weak bullish sentiment with low confidence, suggesting the potential for a tentative bullish continuation towards the 1st resistance.
The 1st support at 155.62 is considered significant as it represents a pullback support and is associated with the 61.80% Fibonacci Retracement. This level indicates a historical area where buying interest has been present, reinforcing its potential as a crucial support zone.
Furthermore, the 2nd support at 153.91 is identified as a multi-swing low support, providing an additional layer of potential support for the currency pair.
On the resistance side, the 1st resistance at 158.17 is linked to a pullback resistance and the 61.8% Fibonacci Projection, indicating a level where selling interest could intensify.
Additionally, the 2nd resistance at 159.16 is associated with an overlap resistance and the 61.80% Fibonacci Retracement, further highlighting potential challenges for the price to surpass these levels.
An intermediate support level at 155.62 is noted, representing an overlap support.
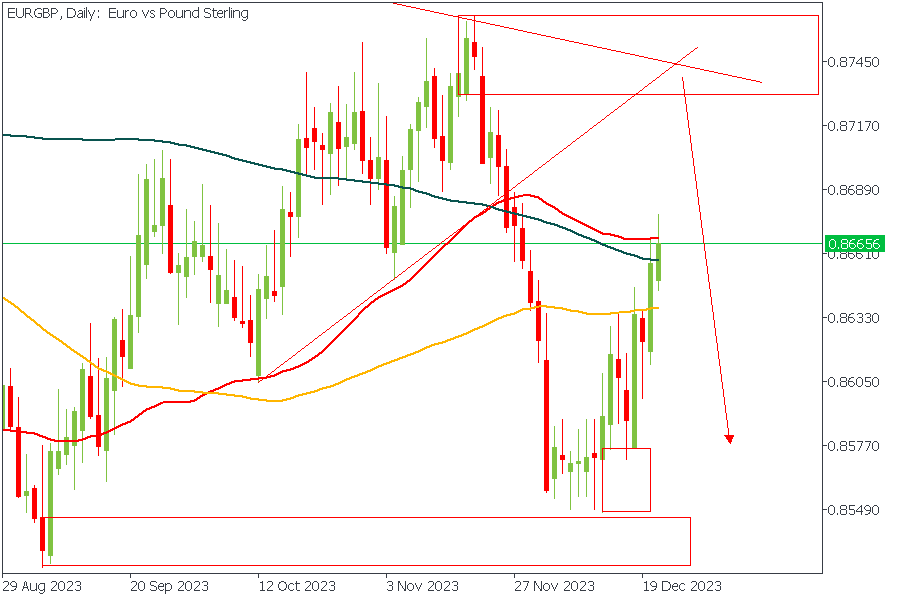
EUR/GBP:
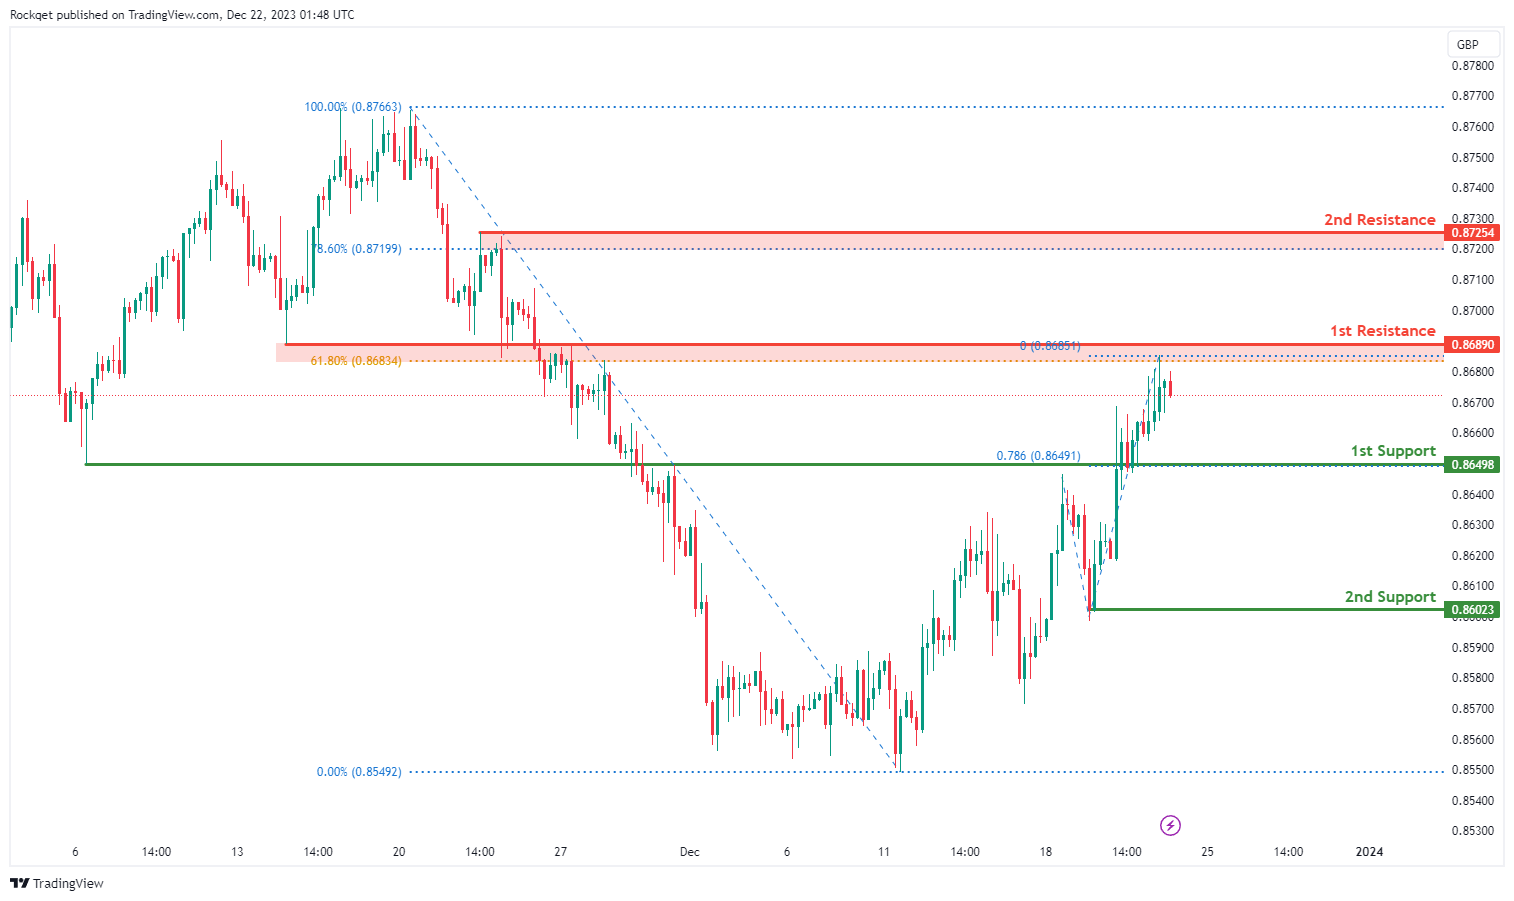
The EUR/GBP chart currently exhibits a bearish overall momentum, indicating the potential for a bearish reaction off the 1st resistance and a subsequent drop to the 1st support.
The 1st support at 0.8650 is considered significant as it represents an overlap support and is associated with the 78.60% Fibonacci Projection. This level indicates a historical area where buying interest has been present, reinforcing its potential as a crucial support zone.
Additionally, the 2nd support at 0.8602 is identified as a pullback support, providing an additional layer of potential support for the currency pair.
On the resistance side, the 1st resistance at 0.8689 is linked to an overlap resistance and the 61.80% Fibonacci Retracement, indicating a level where selling interest could intensify.
Furthermore, the 2nd resistance at 0.8725 is associated with a pullback resistance and the 78.60% Fibonacci Retracement, further highlighting potential challenges for the price to surpass these levels.
GBP/USD:
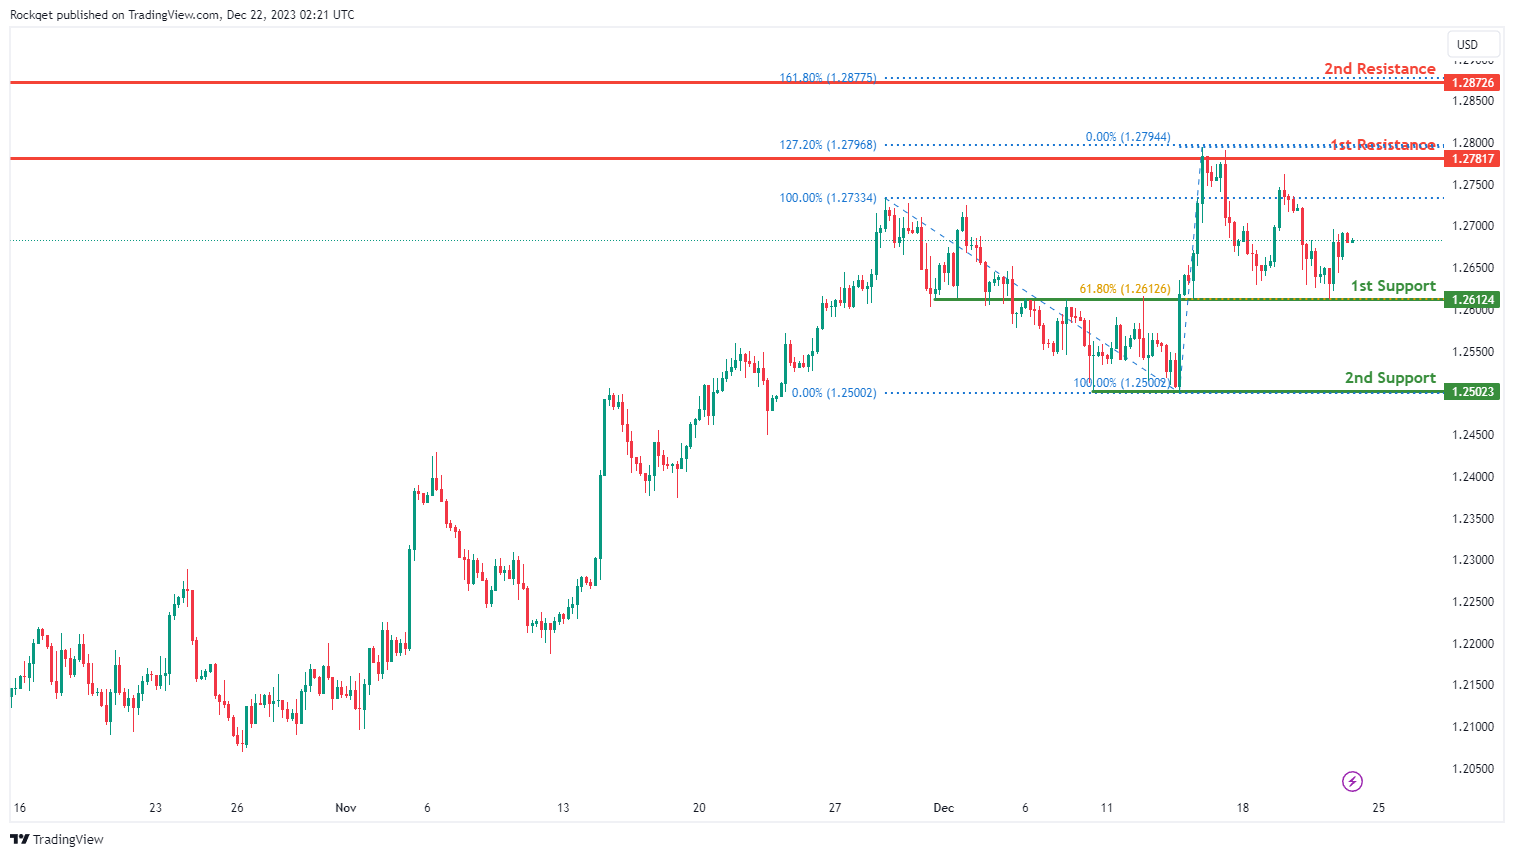
The GBP/USD chart currently exhibits a neutral bias. In this context, there is a potential scenario for price to fluctuate between the 1st support and the 1st resistance.
The 1st support level at 1.2612 is identified as an overlap support that aligns with the 61.80% Fibonacci retracement level. Further below, the 2nd support level at 1.2502 is marked as a swing-low support, further reinforcing its importance as a potential key support level.
To the upside, the 1st resistance level at 1.2781 is identified as a multi-swing-high resistance that aligns with the 127.20% Fibonacci extension level. Higher up, the 2nd resistance level at 1.2872 is noted as a pullback resistance that aligns with the 161.80% Fibonacci extension level, suggesting a potential barrier for further upside movement.
GBP/JPY:
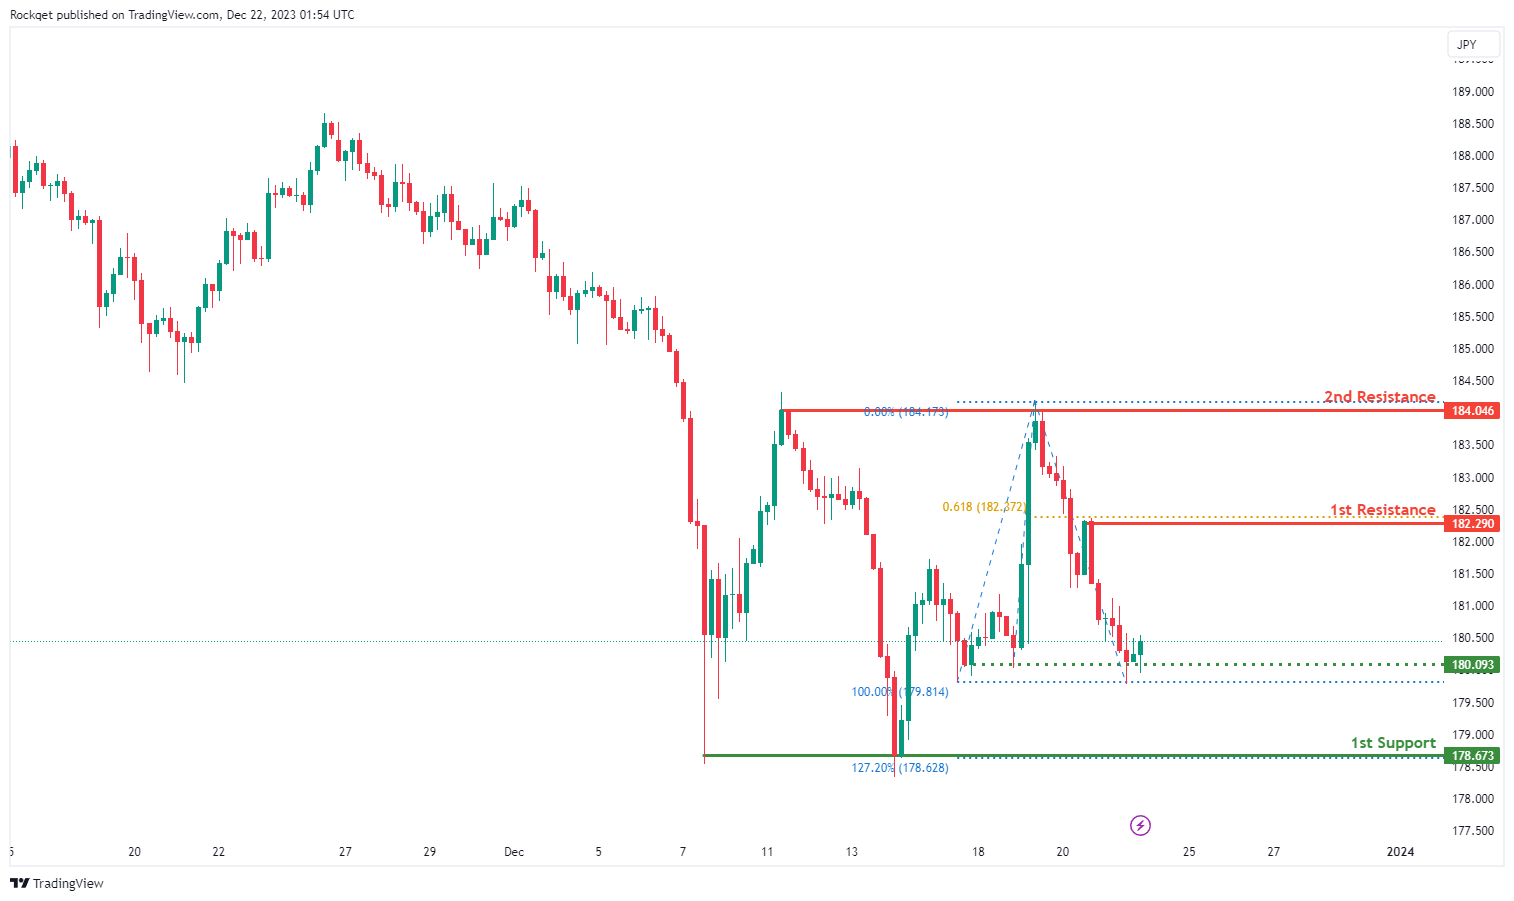
The GBP/JPY chart currently displays a bullish overall momentum, indicating the potential for a bullish continuation towards the 1st resistance.
The intermediate support at 180.09 is considered significant, representing a multi-swing low support. This level indicates a historical area where buying interest has been present, reinforcing its potential as a crucial support zone.
Additionally, the 2nd support at 178.59 is identified as another multi-swing low support and is associated with the 127.20% Fibonacci Extension, providing an additional layer of potential support for the currency pair.
On the resistance side, the 1st resistance at 182.29 is linked to a pullback resistance and the 61.80% Fibonacci Projection, indicating a level where selling interest could intensify.
Furthermore, the 2nd resistance at 184.05 is associated with a multi-swing high resistance, further highlighting potential challenges for the price to surpass these levels.
USD/CHF:
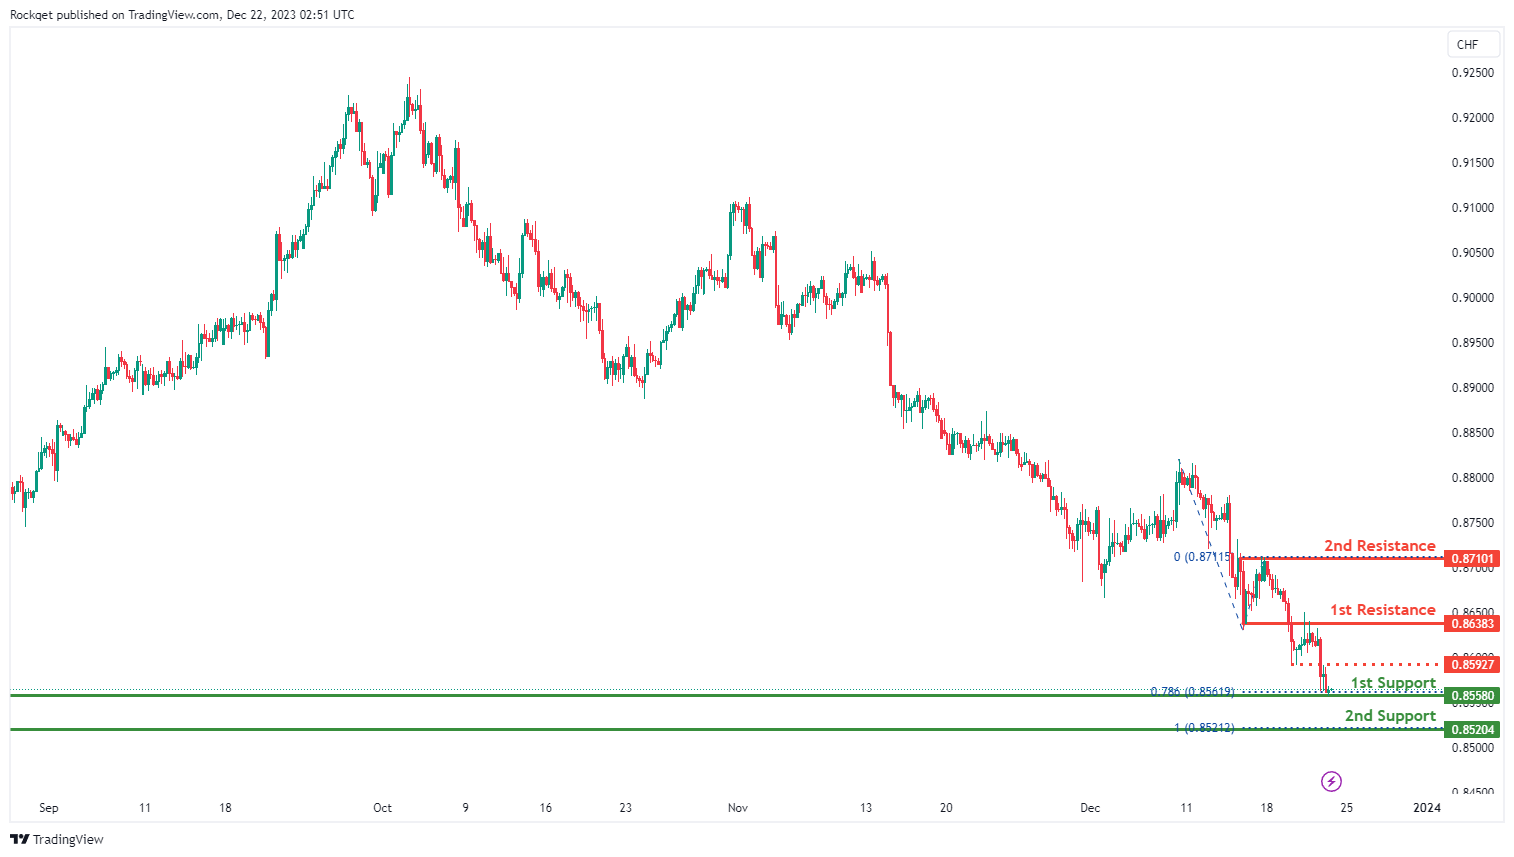
The USD/CHF chart currently exhibits an overall bearish momentum. In this context, there is a potential scenario for price to make a bearish continuation towards the 1st support.
The 1st support level at 0.8558 is marked as a multi-swing-low support that aligns with the 78.60% Fibonacci projection level. Further below, the 2nd support level at 0.8520 is also noted as a multi-swing-low support that aligns with the 100.00% Fibonacci projection level, further reinforcing its importance as a key support level.
To the upside, the intermediate resistance level at 0.8592 is identified as an overlap resistance while the 1st resistance level at 0.8638 is marked as a pullback resistance. Higher up, the 2nd resistance level at 0.8710 is also noted as a pullback resistance, suggesting a potential barrier for further upside movement.
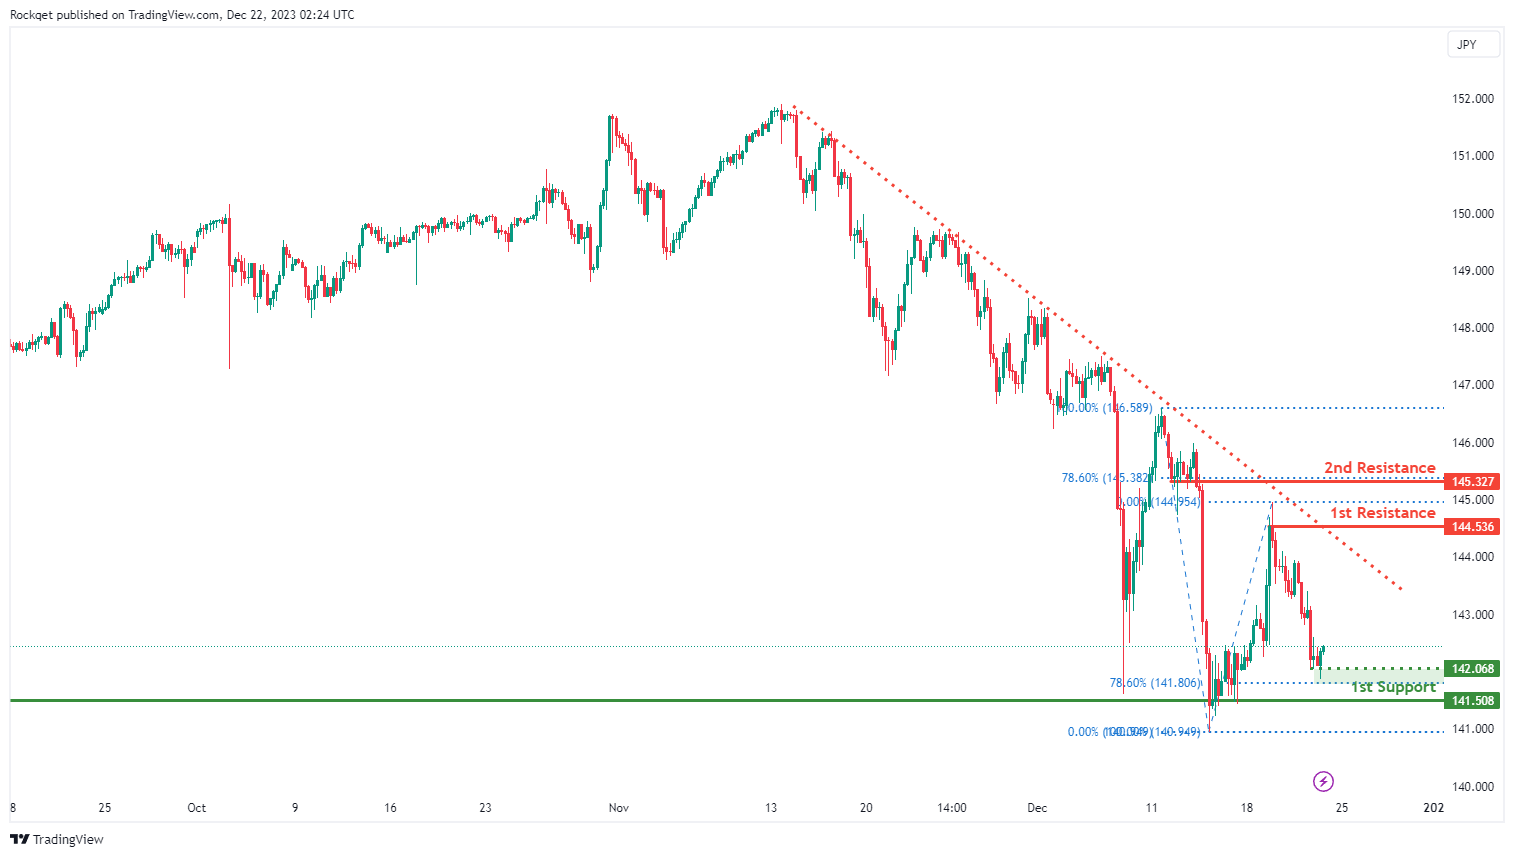
USD/JPY:
The USD/JPY chart currently exhibits an overall bearish momentum. However, there is a potential for price to make a bullish bounce off the intermediate support.
The intermediate support level at 142.06 is identified as a pullback support that aligns close to the 78.60% Fibonacci retracement level. Further below, the 1st support level at 141.50 is noted as a multi-swing-low support, further reinforcing its importance as a key support level.
To the upside, the 1st resistance level at 144.53 is identified as a pullback resistance. Higher up, the 2nd resistance level at 145.32 is also marked as a pullback resistance that aligns with the 78.60% Fibonacci retracement level, suggesting a potential barrier for further upside movement.
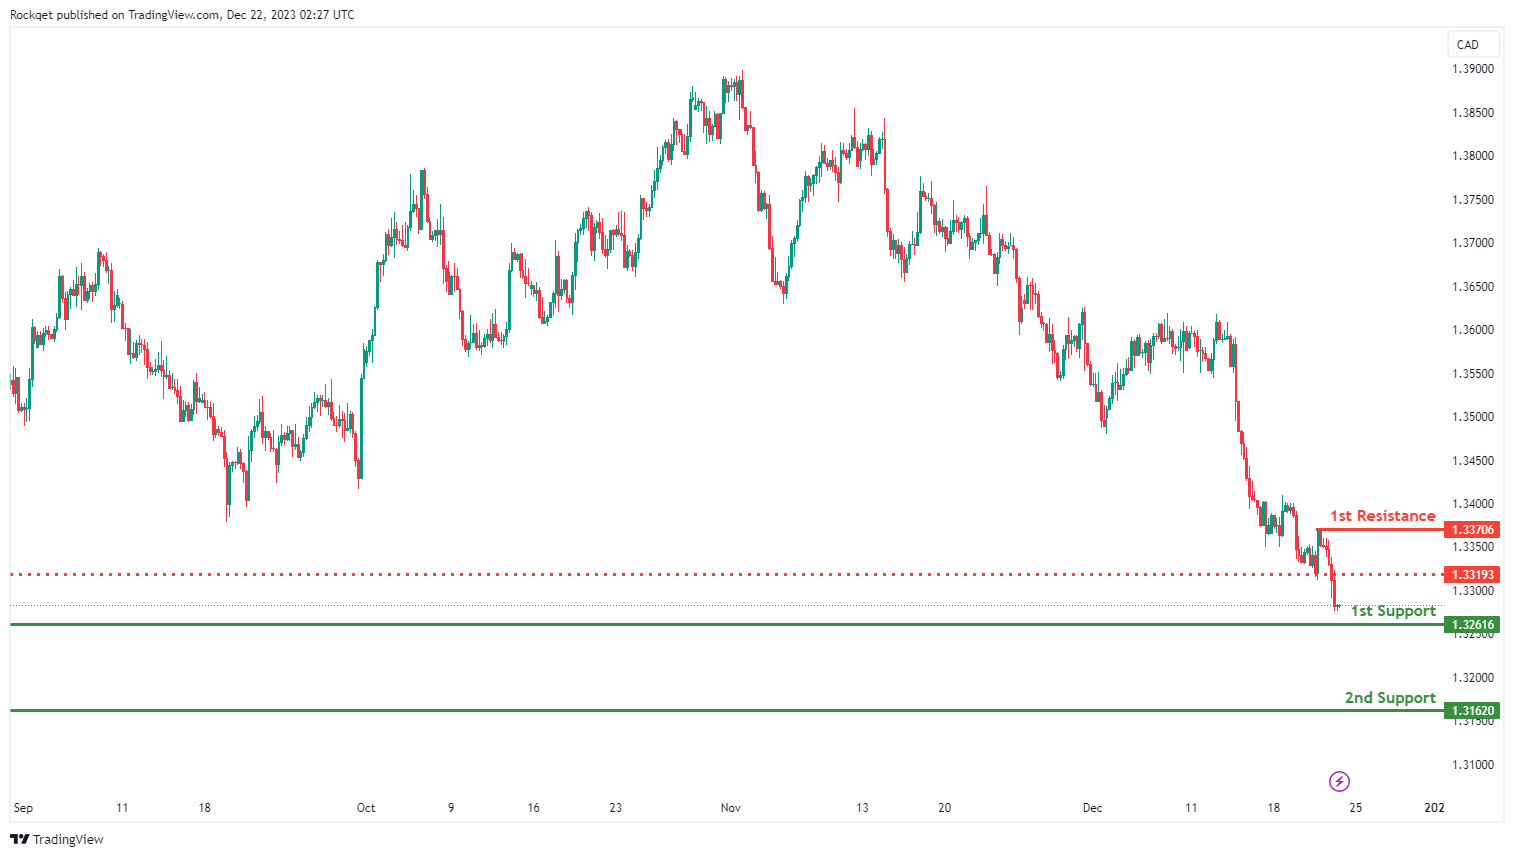
USD/CAD:
The USD/CAD chart currently exhibits an overall bearish momentum, indicating a potential for a drop towards the 1st support.
The 1st support level at 1.3261 is identified as an overlap support. Further below, the 2nd support level at 1.3162 is noted as a multi-swing-low support, further reinforcing its importance as a key support level.
To the upside, the intermediate resistance level at 1.3319 is identified as a pullback resistance. Higher up, the 1st resistance level at 1.3370 is also marked as a pullback resistance, suggesting a potential barrier for further upside movement.
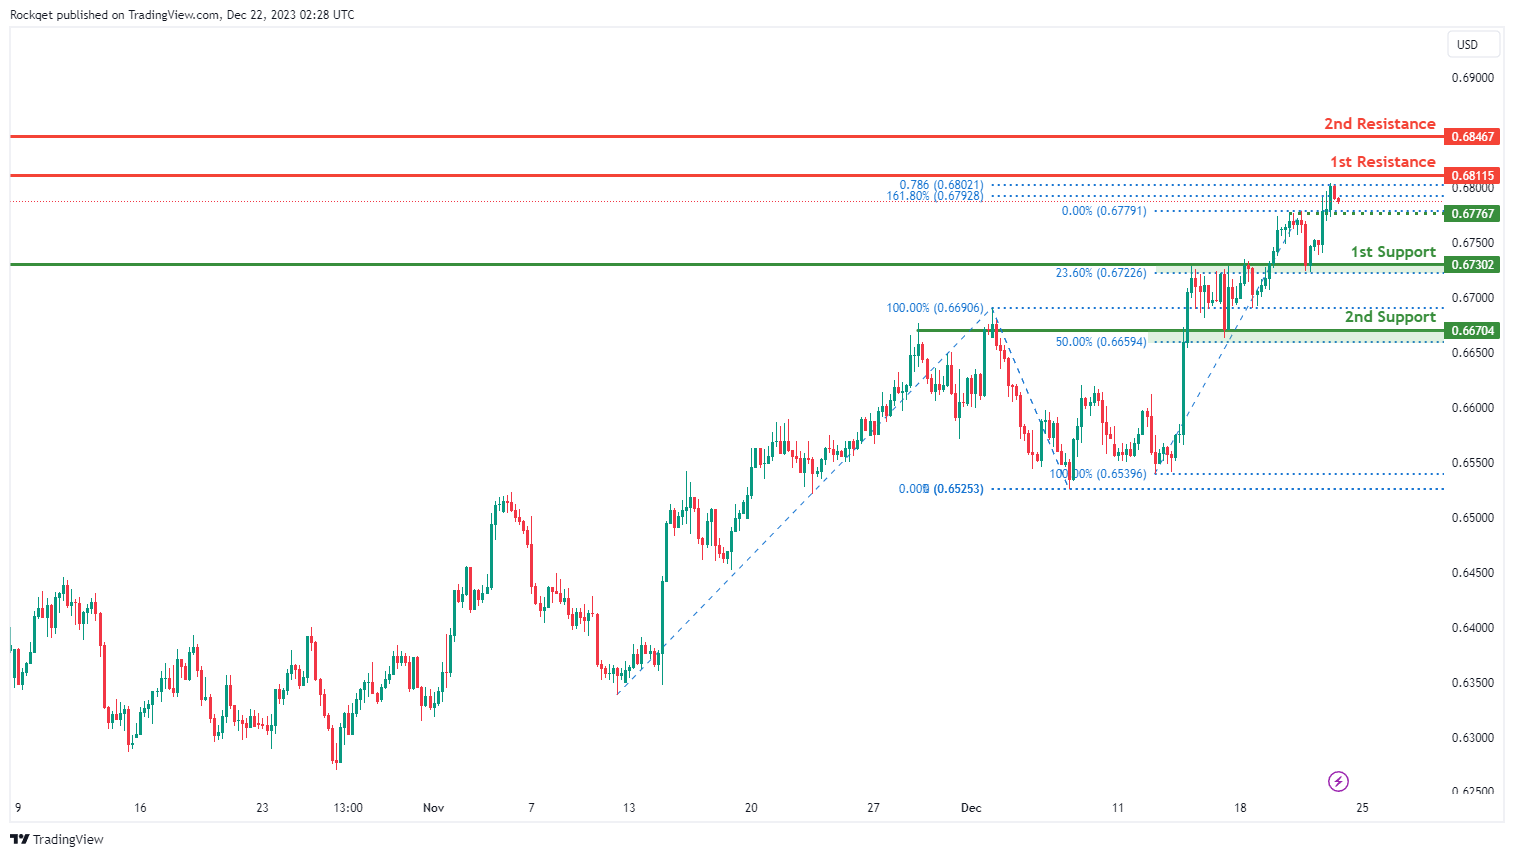
AUD/USD:
The AUD/USD chart currently exhibits an overall bullish momentum. However, there is a potential scenario for price to make a bearish reaction off the 1st resistance and drop towards the 1st support, especially if price breaks below the intermediate support.
The 1st resistance level at 0.6811 is identified as a swing-high resistance that aligns with a confluence of Fibonacci levels i.e. the 161.80% extension and the 78.60% projection levels. Higher up, the 2nd resistance level at 0.6846 is also noted as a swing-high resistance, indicating its potential significance as a barrier for further upward movement.
To the downside, the intermediate support level at 0.6776 is identified as a pullback support while the
1st support level at 0.6730 is noted as an overlap support that aligns with the 23.60% Fibonacci retracement level. Further below, the 2nd support level at 0.6670 is also marked as an overlap support that aligns close to the 50.00% Fibonacci retracement level, further reinforcing its importance as a key support level.
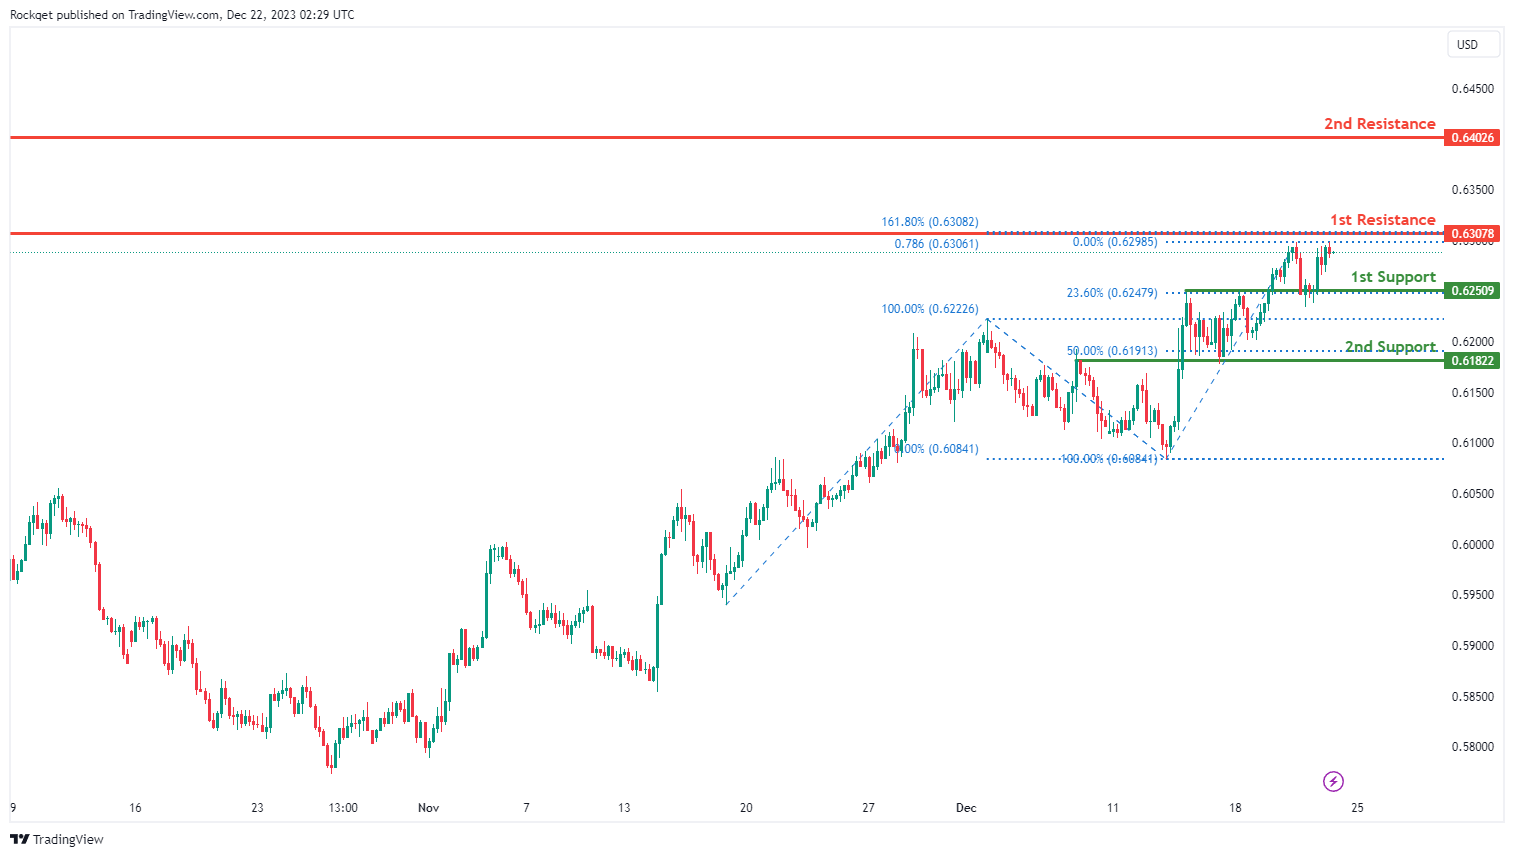
NZD/USD
The NZD/USD chart currently exhibits an overall bullish momentum. However, there is a potential scenario for price to make a bearish reaction off the 1st resistance and drop towards the 1st support.
The 1st resistance level at 0.6307 is identified as a swing-high resistance that aligns with a confluence of Fibonacci levels i.e. the 161.80% extension and the 78.60% projection levels. Higher up, the 2nd resistance level at 0.6402 is also marked as a swing-high resistance, indicating its potential significance as a barrier for further upward movement.
To the downside, the 1st support level at 0.6250 is identified as an overlap support that aligns with the 23.60% Fibonacci retracement level. Further below, the 2nd support level at 0.6182 is also noted as an overlap support that aligns close to the 50.00% Fibonacci retracement level, further reinforcing its importance as a key support level.
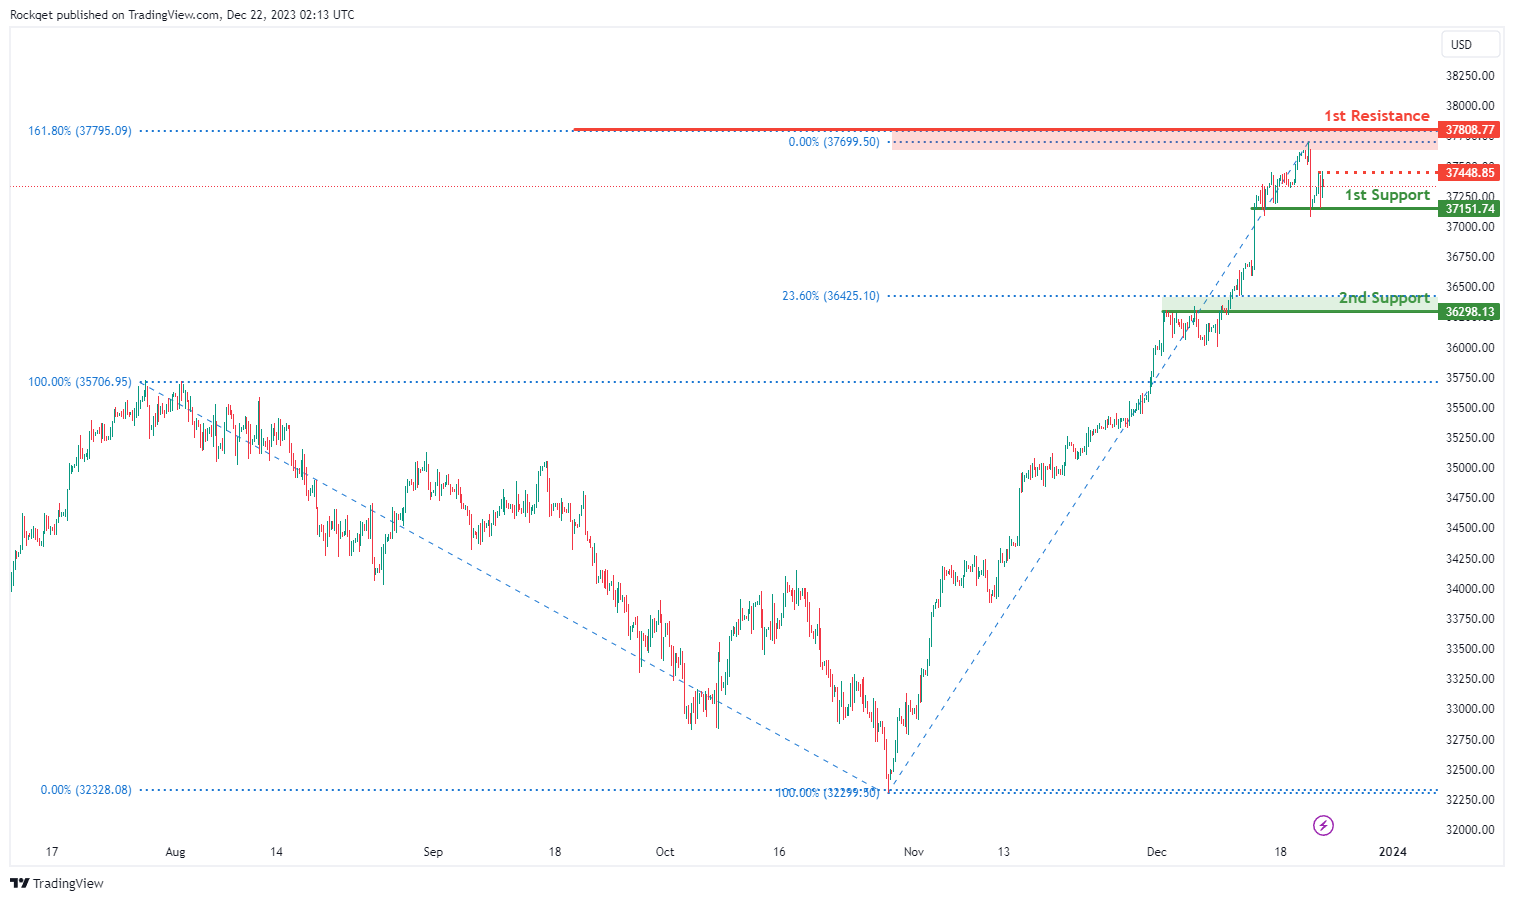
DJ30:
The DJ30 chart currently exhibits a weak bearish overall momentum, suggesting a potential scenario for a bearish continuation towards the 1st support.
The 1st support at 37151.74 is considered significant as it represents an overlap support, indicating a historical area where buying interest has been present.
Additionally, the 2nd support at 36298.13 is identified as another overlap support and is associated with the 23.60% Fibonacci Retracement, providing an additional layer of potential support for the index.
On the resistance side, the 1st resistance at 37808.77 is linked to the 161.80% Fibonacci Extension, indicating a level where selling interest could intensify.
Furthermore, the intermediate resistance at 37448.85 is associated with a pullback resistance, adding an extra layer of potential resistance for the index.
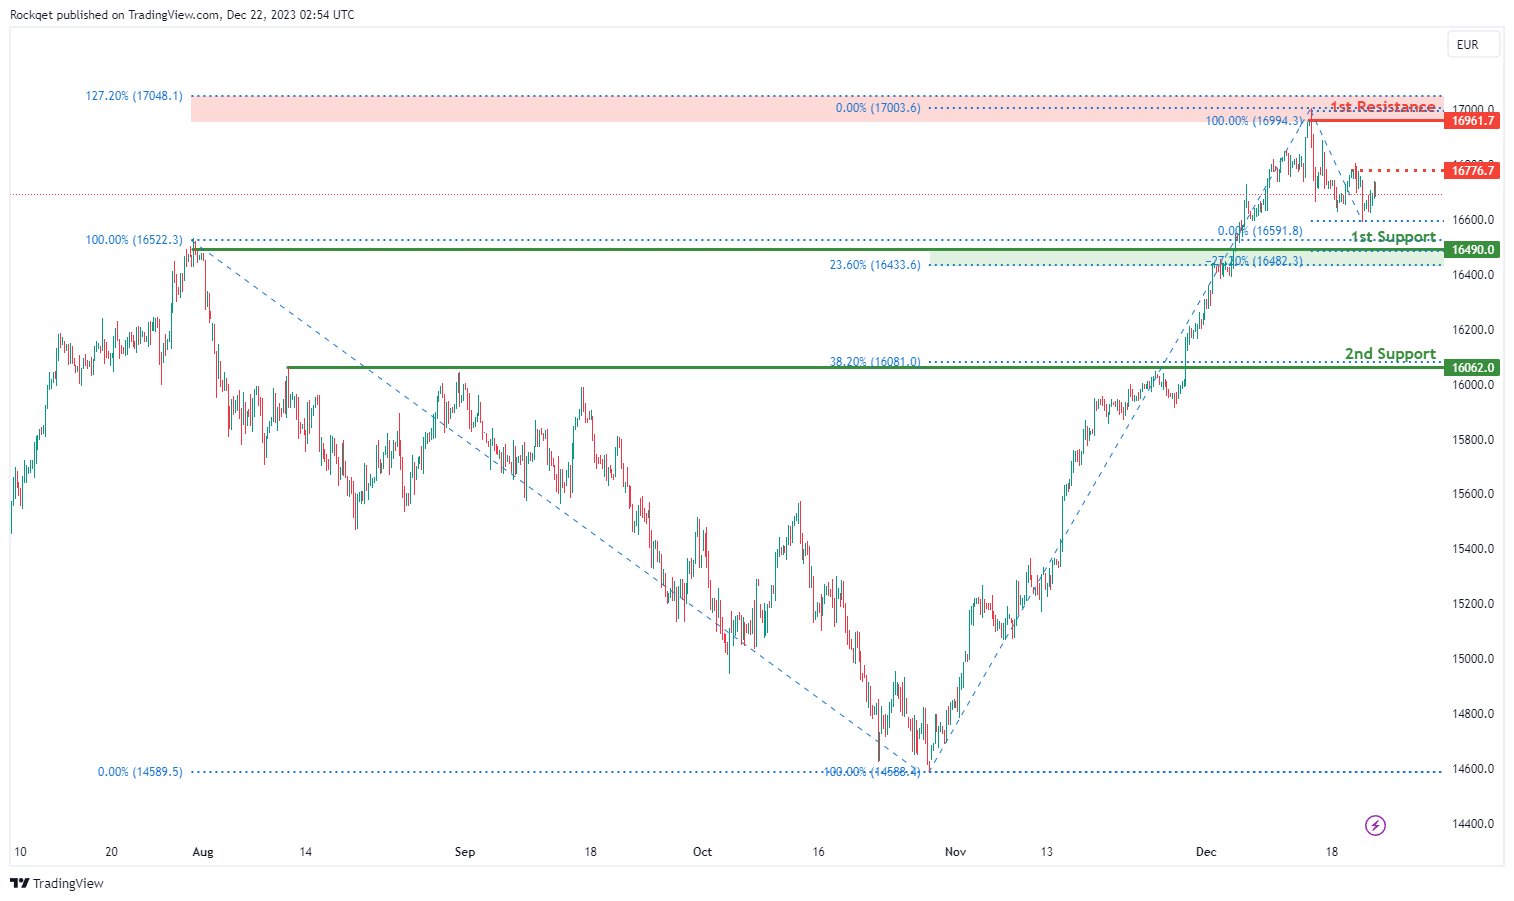
GER40:
The GER40 chart currently reflects a bullish overall momentum, supported by various factors contributing to the upward price movement. The price is potentially poised for a bullish continuation towards the 1st resistance level.
The 1st support at 16490.00 plays a crucial role, marked by its significance as an overlap support and its alignment with the 23.60% Fibonacci Retracement and a -27% Fibonacci Expansion. This confluence of factors makes it a robust historical area with buying interest, reinforcing its potential as a strong support level.
Additionally, the 2nd support at 16062.00 is identified as a pullback support associated with the 38.20% Fibonacci Retracement, providing an additional layer of support for the bullish momentum. The intermediate resistance at 16776.70, acting as a pullback resistance, contributes to the overall bullish narrative.
On the resistance level, the 1st resistance at 16961.70 represents a swing high resistance and is associated with the 127.20% Fibonacci Extension, indicating a potential challenge for the upward price movement.
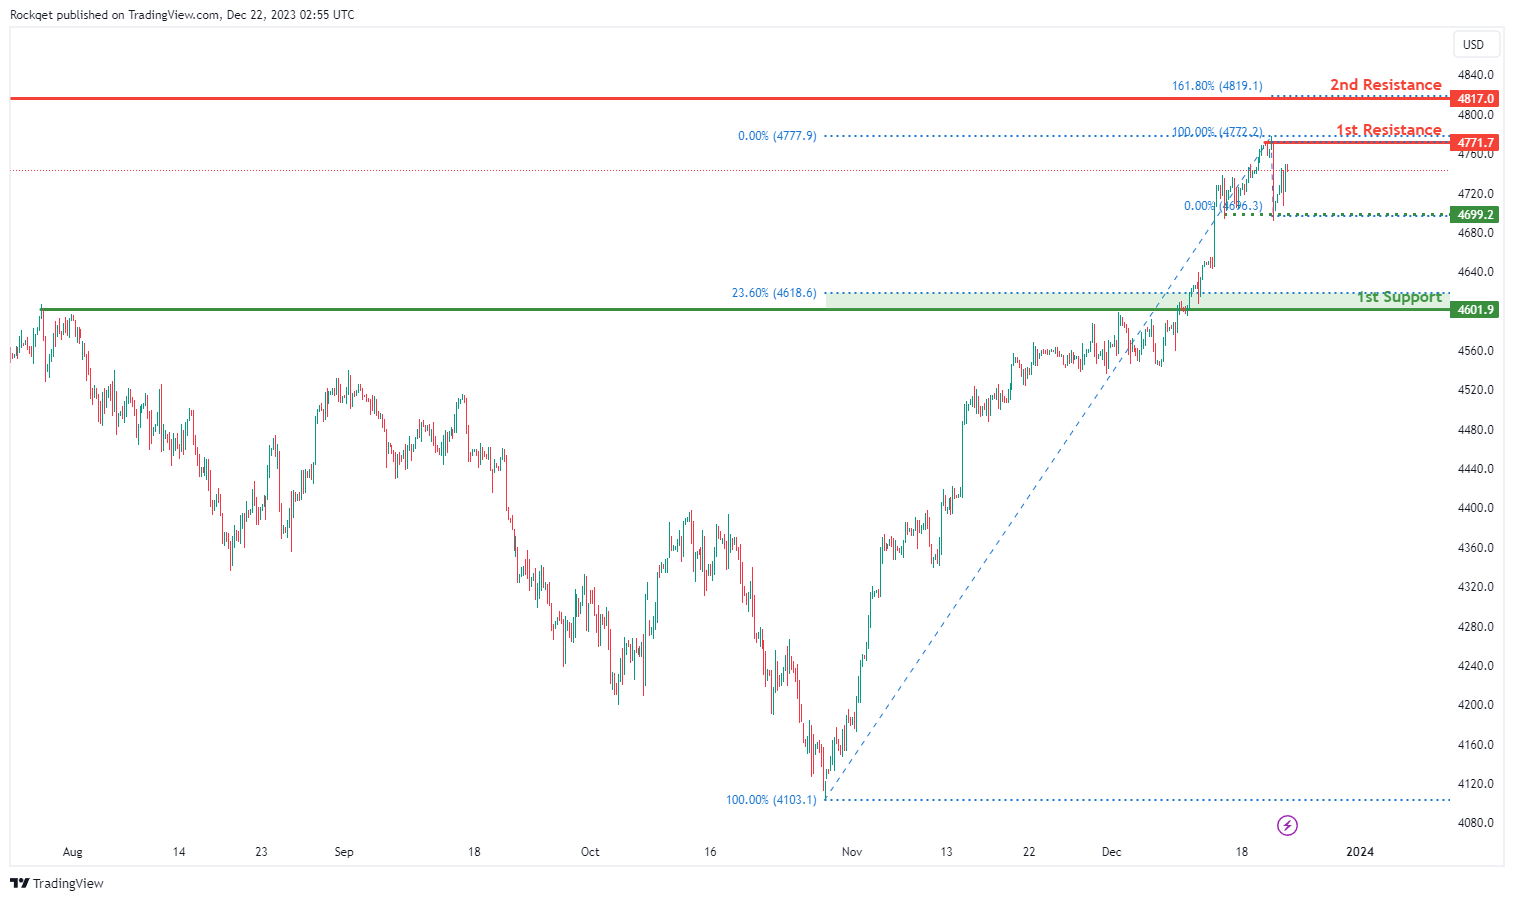
US500:
The US500 chart currently demonstrates a bullish overall momentum, with several factors contributing to the upward price movement. The price is anticipated to potentially continue its bullish trajectory towards the 1st resistance level.
The intermediate support at 4699.2 is considered significant due to its role as a multi-swing low support. This level represents a historical area where buying interest has been notable, adding strength to its potential as a crucial support zone.
Additionally, the 1st support at 4601.9 is identified as an overlap support and is associated with the 23.60% Fibonacci Retracement, providing an additional layer of potential support for the bullish momentum.
On the resistance side, the 1st resistance at 4771.7 is linked to a swing high resistance, indicating a level where selling interest could intensify.
Furthermore, the 2nd resistance at 4817.0 is associated with a swing high resistance and the 161.80% Fibonacci Extension, suggesting a potential barrier for the upward price movement.
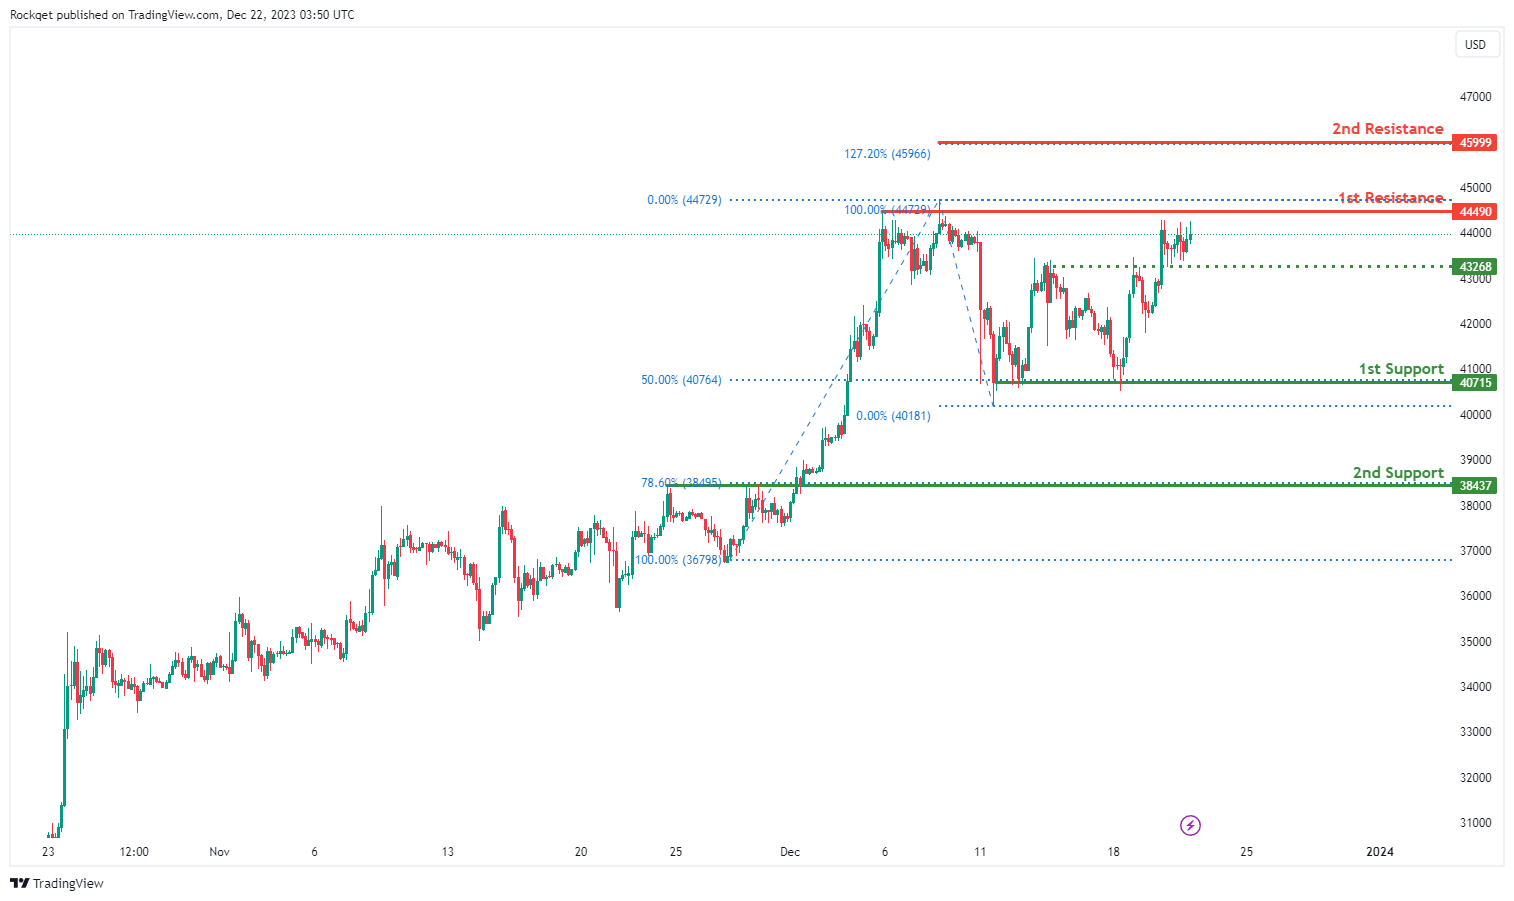
BTC/USD:
The BTC/USD chart currently exhibits a bullish overall momentum, indicating a potential scenario for a bullish continuation towards the 1st resistance.
The 1st support at 40715 holds significance as it represents a swing low support and coincides with the 50% Fibonacci Retracement, emphasizing its role as a critical support level.
Additionally, the 2nd support at 38437 is identified as an overlap support and is associated with the 78.60% Fibonacci Retracement, providing another layer of substantial support for the ongoing bullish trend.
On the resistance side, the 1st resistance at 44490 is linked to a swing high resistance and aligns with the 100% Fibonacci Retracement, suggesting a potential area where selling interest may intensify.
Furthermore, the 2nd resistance at 45999 is associated with the 127.20% Fibonacci Extension, indicating a potential barrier for further upward price movement.
An intermediate support level at 43268 is also identified, reinforcing the bullish momentum in the BTCUSD chart.
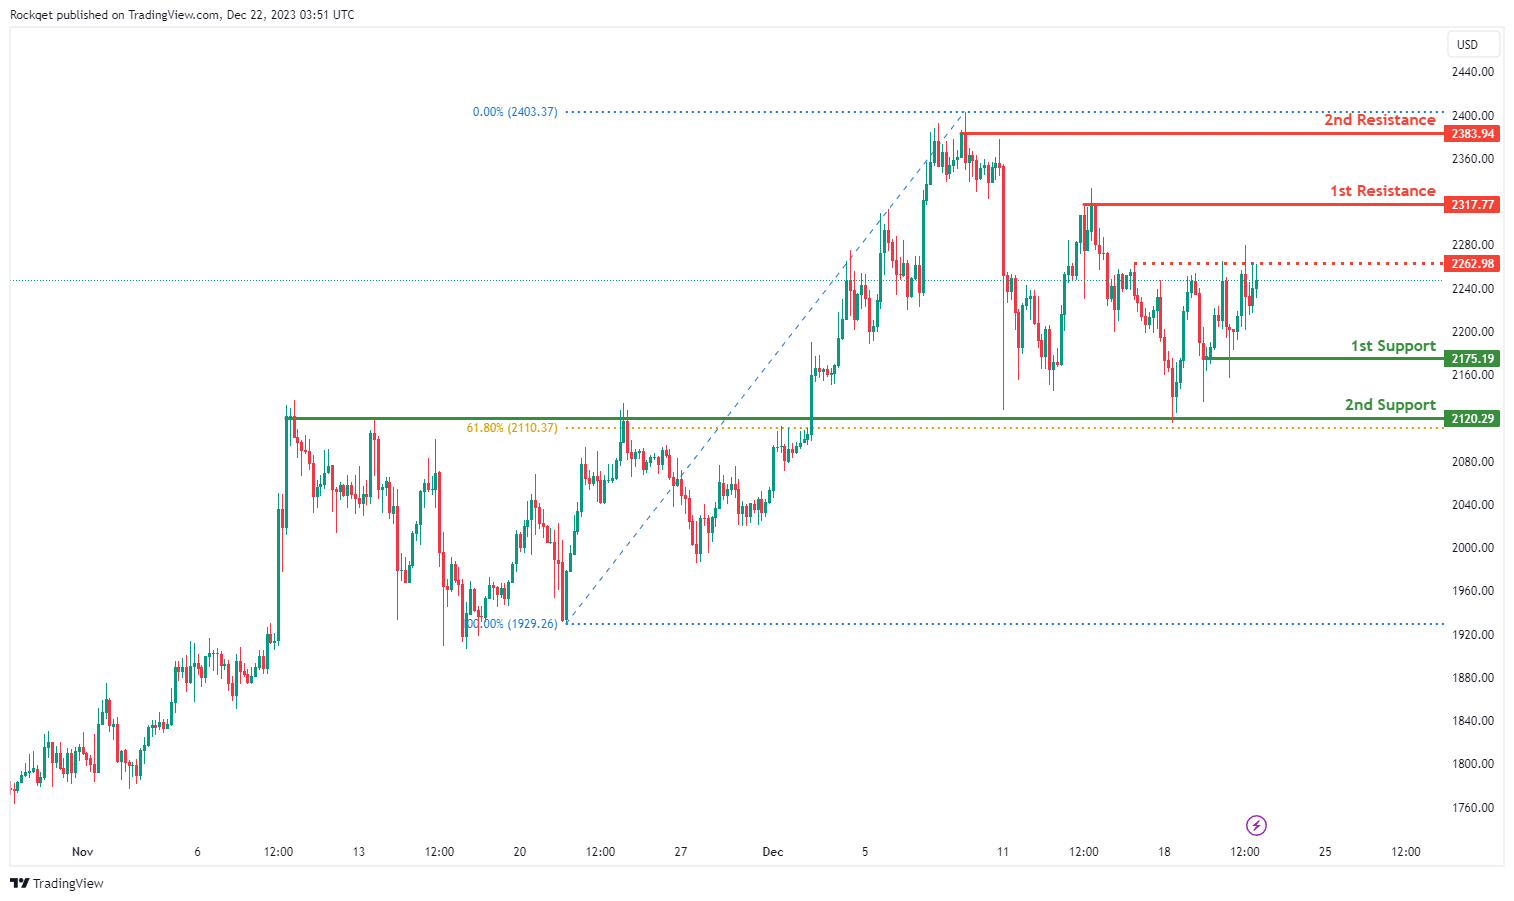
ETH/USD:
The ETH/USD chart currently exhibits a bullish overall momentum, suggesting a potential scenario for a bullish continuation towards the 1st resistance.
The 1st support at 2175.19 is identified as a pullback support indicating a historical area where buying interest has been present.
Additionally, the 2nd support at 2120.29 is considered a swing low support and aligns with the 61.8% Fibonacci Retracement, adding another layer of potential support for the ongoing bullish trend.
On the resistance side, the 1st resistance at 2317.11 is associated with a swing high resistance, highlighting a potential barrier where selling interest could intensify.
Furthermore, the 2nd resistance at 2383.94 aligns with another swing high resistance, adding an extra layer of potential resistance for the price.
An intermediate resistance level at 2262.98 is also identified, associated with the pullback resistance. This level may act as a significant hurdle for the price to overcome in its bullish continuation.
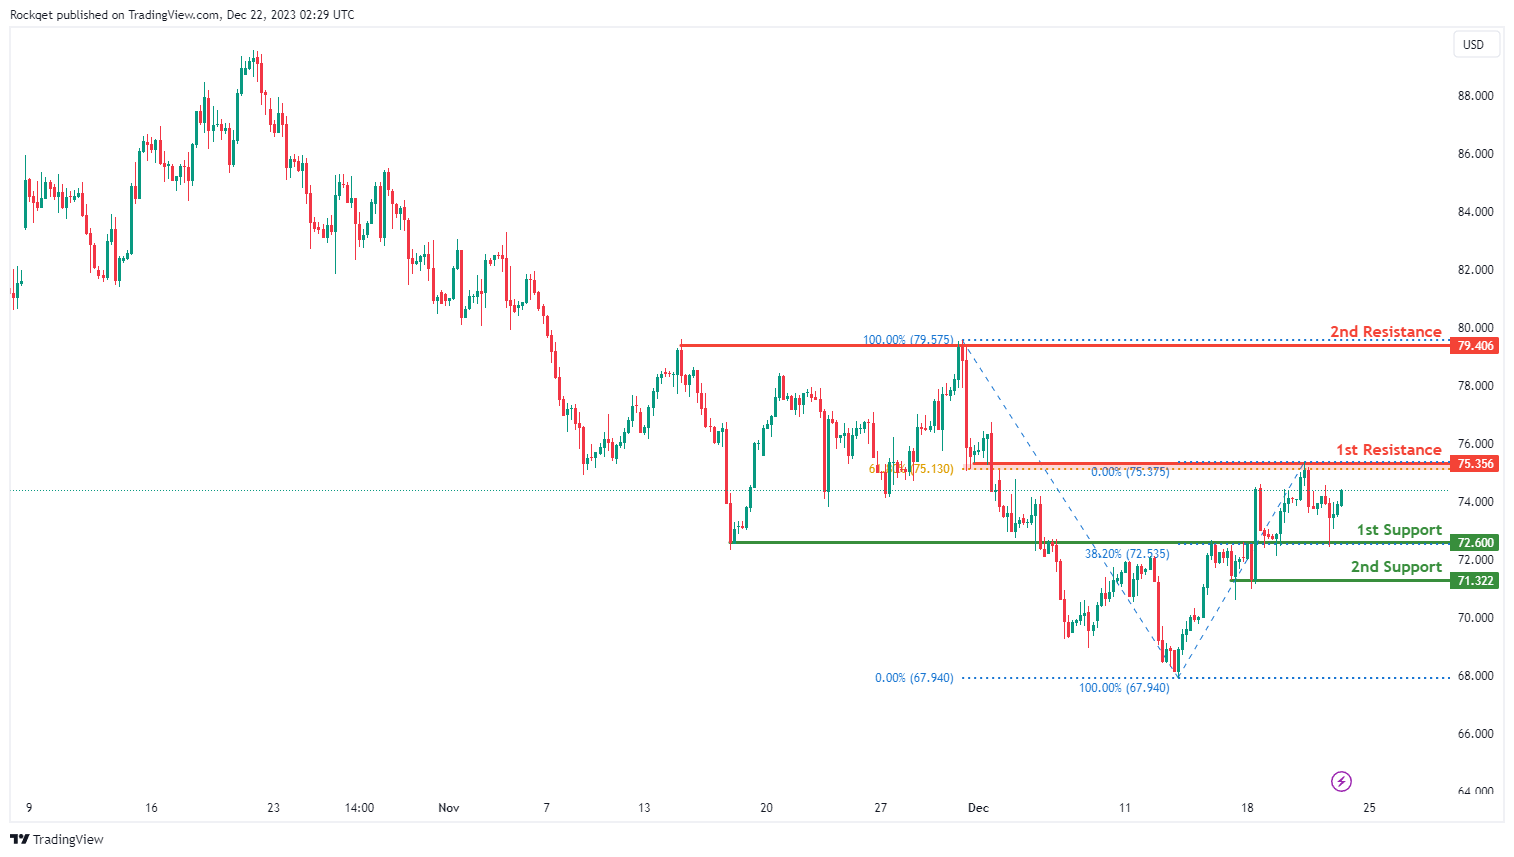
WTI/USD:
The WTI chart currently exhibits an overall bullish momentum, suggesting a prevailing uptrend. In this context, there is a potential scenario for price to make a bullish continuation towards the 1st resistance.
The 1st resistance level at 75.35 is identified as an overlap resistance that aligns close to the 61.80% Fibonacci retracement level. Higher up, the 2nd resistance level at 79.40 is noted as a multi-swing-high resistance, further indicating its potential significance as a barrier for further upward movement.
To the downside, the 1st support level at 72.60 is identified as an overlap support that aligns with the 38.20% Fibonacci retracement level. Further below, the 2nd support level at 71.32 is marked as a pullback support, reinforcing its importance as a key support level.
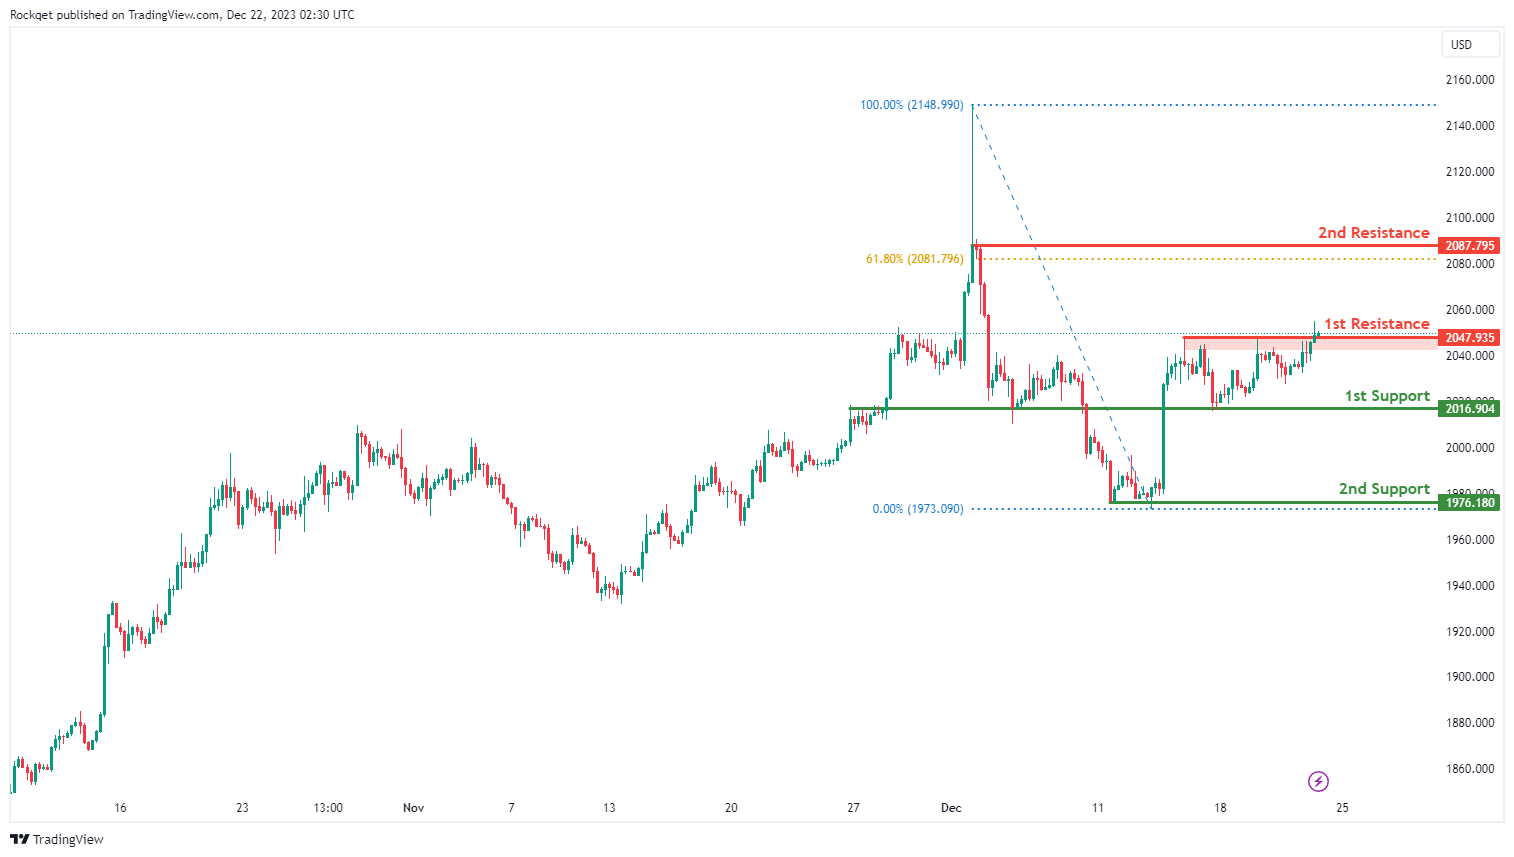
XAU/USD (GOLD):
The XAU/USD chart currently demonstrates a bullish momentum, indicating a potential for price to break above the 1st resistance and make a bullish continuation towards the 2nd resistance.
The 1st resistance level at 2,047.93 is identified as a pullback resistance. Higher up, the 2nd resistance level at 2,087.79 is also marked as a pullback resistance that aligns close to the 61.80% Fibonacci retracement level, further indicating its potential significance as a barrier for further upward movement.
To the downside, the 1st support level at 2,016.90 is identified as an overlap support. Further below, the 2nd support level at 1,976.18 is noted as a pullback support, reinforcing its importance as a key support level.
Japan’s CPI core slows to 2.5% yoy, but services inflation hit three-decade high
Japan's core CPI, which excludes fresh food, decreased from 2.9% yoy to 2.5% yoy in November, marking the lowest level since July 2022. Despite this deceleration, inflation remains above BoJ's target of 2% for the twentieth consecutive month, indicating persistent inflationary pressures.
All-items CPI also experienced a slowdown, dropping from 3.3% yoy to 2.8% yoy. Additionally, core-core CPI, which excludes both fresh food and energy, showed a slight decrease from 4.0% yoy to 3.8% yoy.
Notably, goods inflation saw a significant reduction, declining from 4.4% yoy to 3.3% yoy. In contrast, service inflation showed an acceleration, rising from 2.1% yoy to 2.3% yoy. This increase in service inflation is the sharpest in three decades, dating back to October 1993, if the effects of past consumption tax hikes are excluded.
Energy prices, a key factor in inflation calculations, dropped by -10.1% yoy. Japanese government's subsidies to reduce fuel costs played a role in tempering inflation rates. Without these subsidies, core CPI would have seen an increase of around 3%, according to the ministry.
GBP: Retail Sales Likely to Calm GBP
The Bank of England (BoE) is facing criticism for being slow to respond to the marked decline in UK price growth. The latest official data revealed a significant drop in consumer price growth to 3.9% in November, down from 6.7% in September. This unexpected decrease has prompted market reactions, with investors betting that the BoE will begin easing policy sooner than indicated in its official communications. Despite lower readings for core inflation and services price growth, the BoE's Monetary Policy Committee has insisted on readiness to raise rates above 5.25%. Analysts warn that the BoE might be waiting too long to pivot on monetary policy. The market is already pricing in a quarter-point cut by May, anticipating a total 1.38 percentage points cut in 2024. The BoE is cautious about relaxing monetary policy too early, considering potential risks like disruptions in shipping due to geopolitical events.
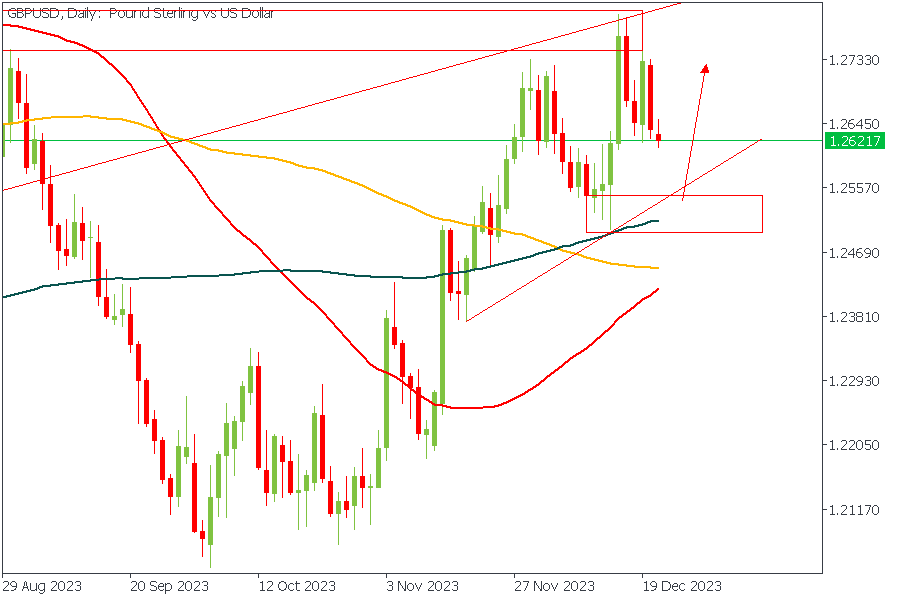
GBPUSD - D1 Timeframe
GBPUSD at the moment, as deduced from the chart, is approaching a drop-base-rally demand zone. It is worth noting that this demand zone enjoys complimentary support from other confluence factors including; trendline support, the 200-day moving average support, 88% Fibonacci retracement level, and the bullish market structure. My expectation here is bullish.
Analyst’s Expectations:
- Direction: Bullish
- Target: 1.27217
- Invalidation: 1.24943
EURGBP - D1 Timeframe
EURGBP continues its bullish rally for the third week in a row, which begs the question; “when will the bullish momentum end?” As seen in the chart, I have highlighted the likely target of the bullish momentum, which is a supply zone that overlaps the intersection of two resistance trendlines, as well as the formation of a possible head-and-shoulder pattern. This gives me confidence of a bearish reaction from the supply zone once price reaches it.
Analyst’s Expectations:
- Direction: Bearish
- Target: 0.89529
- Invalidation: 0.87678
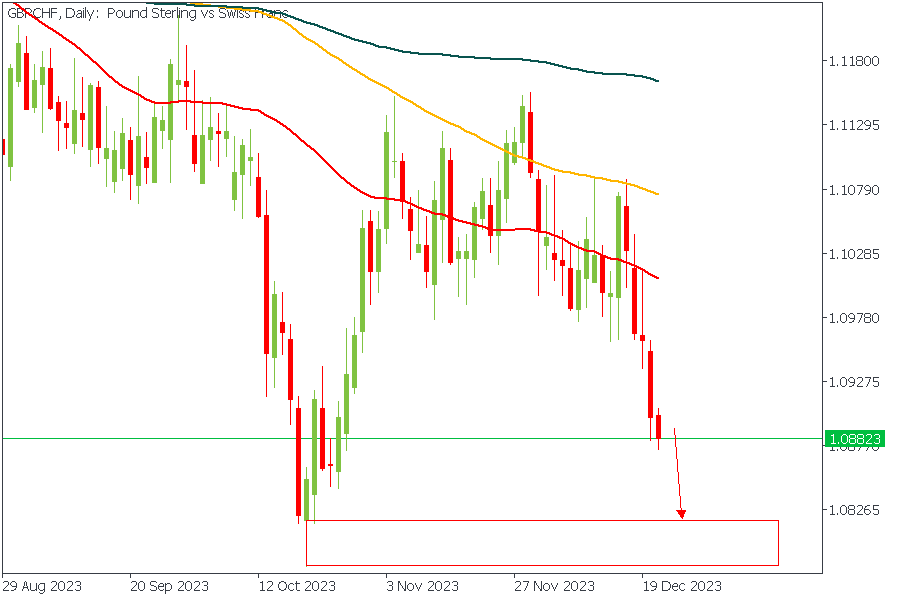
GBPCHF - D1 Timeframe
Carrying on its bearish momentum which kicked off as a result of a rejection, and head-and-shoulder pattern from the 100-day moving average resistance, I believe GBPCHF is yet to reach its intended destination. In my opinion, I expect GBPCHF to create a new lower low, however, this is simply my thought, the price action will determine in the end whether I was right or wrong.
Analyst’s Expectations:
- Direction: Bearish
- Target: 1.06382
- Invalidation: 1.07824
CONCLUSION
The trading of CFDs comes at a risk. Thus, to succeed, you have to manage risks properly. To avoid costly mistakes while you look to trade these opportunities, be sure to do your due diligence and manage your risk appropriately.
USD/JPY Remains In Downtrend, US GDP Disappoints At 4.9%
Key Highlights
- USD/JPY failed to clear the 145.00 resistance zone and declined.
- A major bearish trend line is forming with resistance at 144.00 on the 4-hour chart.
- EUR/USD and GBP/USD remained in a positive zone and eye more gains.
- The US GDP grew 4.9% in Q3 2023, less than the market forecast of 5.2%.
USD/JPY Technical Analysis
The US Dollar attempted a fresh upside break above the 145.00 resistance against the Japanese Yen. However, USD/JPY failed to gain momentum and started a fresh decline.
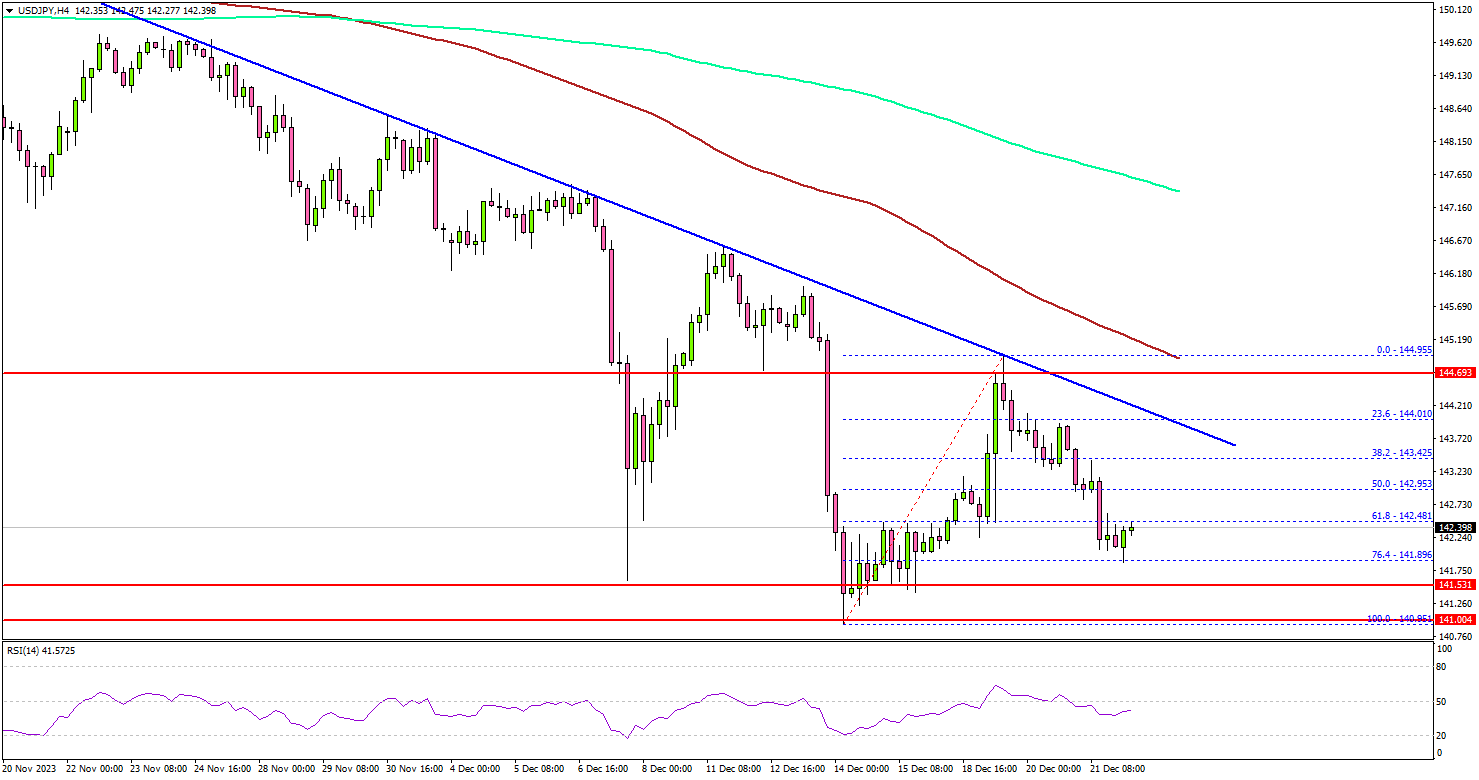
Looking at the 4-hour chart, the pair settled below the 144.00 level, the 100 simple moving average (red, 4 hours), and the 200 simple moving average (green, 4 hours). There was a clear move below the 143.20 support zone.
The bears pushed the pair below the 50% Fib retracement level of the upward move from the 140.95 swing low to the 144.95 high. USD/JPY even showed some bearish reaction after the US GDP came in at 4.9% in Q3 2023, down from 5.2%.
The next major support is 141.50, below which the pair might decline and test 141.00. Any more losses might send the pair toward the 140.00 handle.
On the upside, immediate resistance is near the 143.20 level. The next key resistance is near the 144.00 level. There is also a major bearish trend line forming with resistance at 144.00 on the same chart. A close above the 144.00 zone could open the doors for more upsides. The next stop for the bulls might be 145.00.
Looking at EUR/USD, the pair remained in a positive zone and the bulls seem to be aiming for a move toward the 1.1120 level.
Economic Releases
- US New Home Sales for Nov 2023 (MoM) – Forecast +0.2% versus -5.6% previous.
- US Durable Goods Orders for Nov 2023 – Forecast +2.2% versus -5.4% previous.
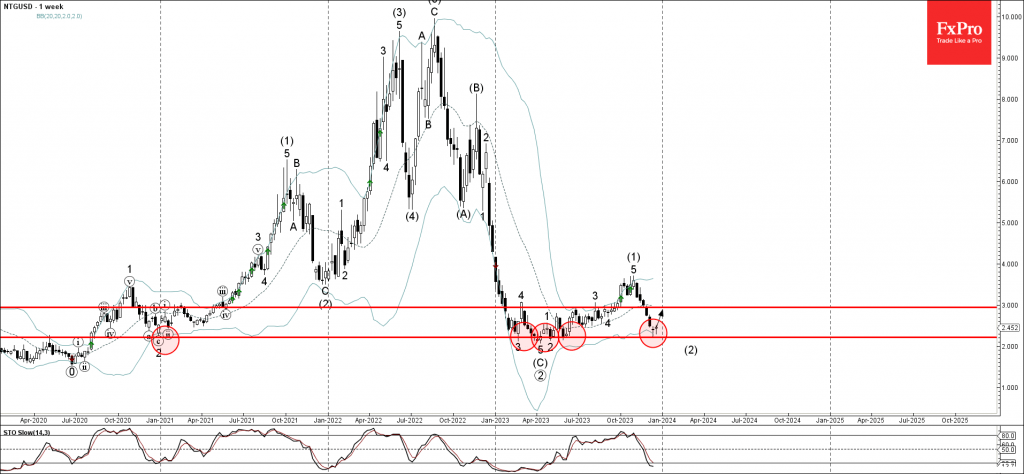
Natural Gas Wave Analysis
- Natural gas reversed from long-term support level 2.215
- Likely to rise to resistance level 3.0000
Natural gas recently reversed up from the major long-term support level 2.215 (which has been reversing the price from the start of 2021) intersecting lower weekly Bollinger Band.
The upward reversal from the support level 2.215 stopped the previous intermediate ABC correction (2).
Given the strength of the support level 2.215 and the still oversold weekly Stochastic, Natural gas can be expected to rise further to the next resistance level 3.0000.
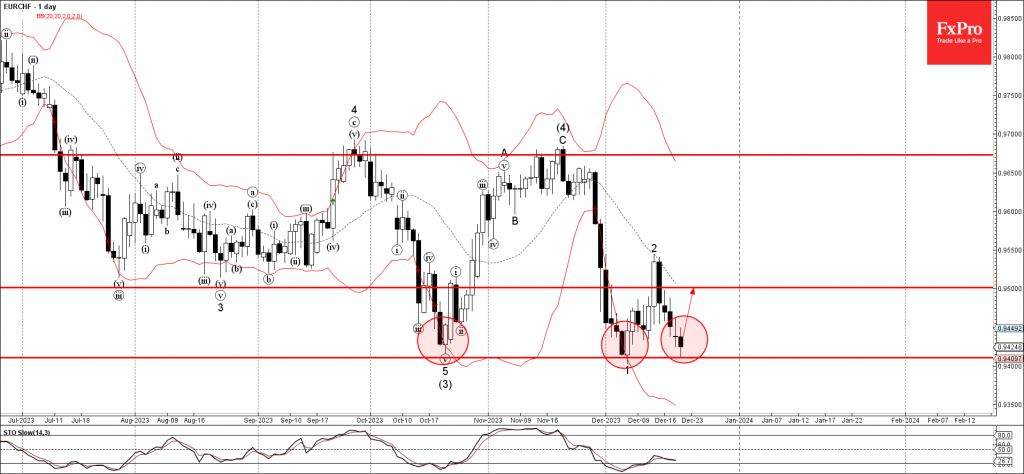
EURCHF Wave Analysis
- EURCHF reversed from key support level 0.9410
- Likely to rise to resistance level 0.9500
EURCHF currency pair recently reversed up from the key support level 0.9410 (which has been reversing the price from the middle of October).
The support level 0.9410 was strengthened by the intersecting lower daily Bollinger Band.
Given the oversold daily Stochastic, EURCHF can be expected to rise further to the next resistance level 0.9500.
Canada: Retail Trade Enters Holiday Season on a High Note.
Retail sales rose by 0.7% month-on-month (m/m) in October, coming in slightly lower than Statistics Canada's advance estimate of the +0.8% m/m reading. September's print was revised slightly lower to +0.6% m/m from +0.7% m/m, reported in the advance estimate.
Adjusting for inflation, the volume of retail sales reported a solid gain of 1.4% in October – the highest reading since December of last year.
The biggest driver of today's gain was sales at motor vehicle and parts dealers, which continued to recover from declines reported in the last two months of the summer. This category was up by 1.1% m/m in nominal and 0.5% m/m in real terms.
Offsetting some of these gains were weaker sales at gasoline stations and fuel vendors, which declined by 3.1% m/m. The lower reading was in part due to softer prices at the pump as demand appears strong: in volume terms, receipts were also up 2.2% m/m in October.
Excluding sales at car dealerships and gas stations, core retail sales were up 1.2% in nominal and 1.7% in real terms in October. Gains were broad based, with sales at general merchandise stores (+2.0% m/m) doing most of the heavy lifting. The only category that spilled red ink this month was building material & garden equipment dealers, which registered a 0.2% m/m loss.
E-commerce sales turned positive this month, gaining 1.8% m/m and breaking its two-month losing streak.
Key Implications
Canadian consumers have been in the festive spirit this holiday season, having broadened their spending across several categories. Looking ahead, auto sales are tracking strong and our own card spending estimates point to a higher reading in November. Meanwhile, Statistics Canada expects sales to come in flat next month based on responses from roughly half of retailers surveyed.
With consumers humming Jingle Bells as they strolled through the malls this holiday season, we expect personal consumption expenditure to grow by a solid 1.5% annualized in Q4. While improved spending patterns during the holiday season has hit a high note, it’s uncertain if this harmonious rhythm will play on in the same key into the new year as spending is forecast to decelerate in the first half of 2024.
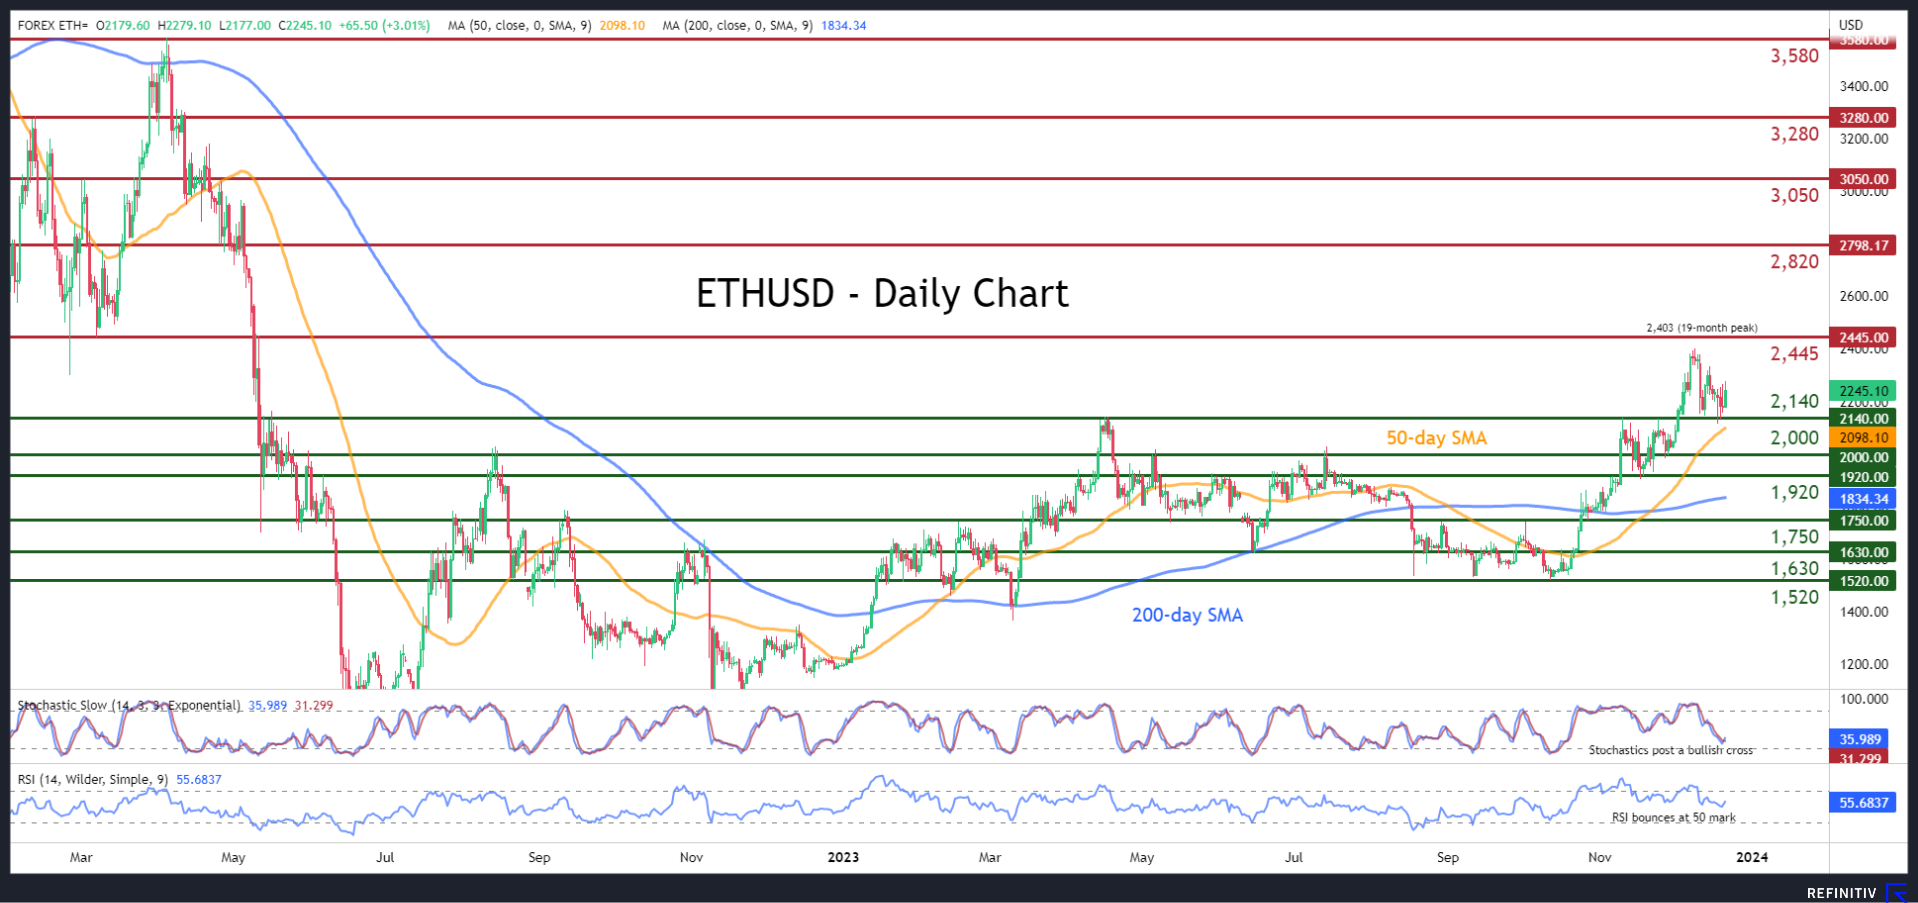
ETHUSD Attempts to Erase Recent Pullback
- ETHUSD forms structure of lower highs and lower lows
- But the latest rebound advances above previous high
- Momentum indicators suggest strengthening positive bias
ETHUSD (Ethereum) had experienced a strong rally since late October, which propelled the price to a fresh 19-month peak of 2,403 on December 9. Although the latter was followed by a pullback, the price seems to be attempting a recovery in the past couple of sessions as the short-term oscillators have turned positive.
Should the rebound extend and the price erases the recent correction, initial resistance could be met at the March 2022 bottom of 2,445. If that barricade fails, there is no prominent resistance until 2,820, which has acted both as support and resistance during the first half of 2023. Conquering that region, the bulls might then attack the March 2022 hurdle of 3,050.
On the flipside, bearish actions could send the price to challenge the recent support of 2,140, which also held strong both in April and November. Sliding beneath that floor, the leading altcoin could descend towards the 2,000 psychological mark. A break below the latter may pave the way for the November support of 1,920.
Overall, ETHUSD has just managed to break its structure of lower highs and lower lows as the price jumped above its most recent peak in today’s session. Is this enough to trigger a recovery?
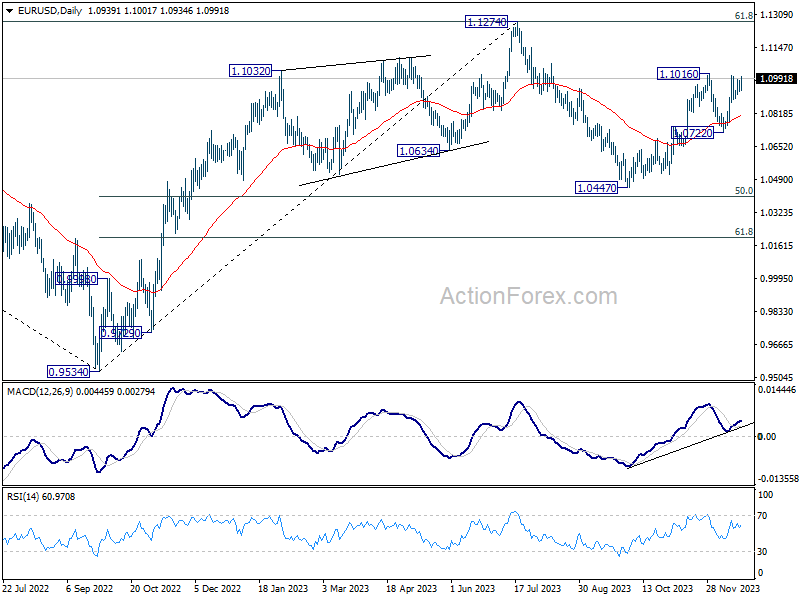
EUR/USD Mid-Day Outlook
Daily Pivots: (S1) 1.0920; (P) 1.0953; (R1) 1.0975; More...
EUR/USD rebounds notably today but stays below 1.1008/1016 resistance zone. Intraday bias remains neutral first. Another retreat cannot be ruled out. But further rally is expected as long as 1.0722 support holds. On the upside, break of 1.1016 will resume the whole rise from 1.0447 to retest 1.1274 high.
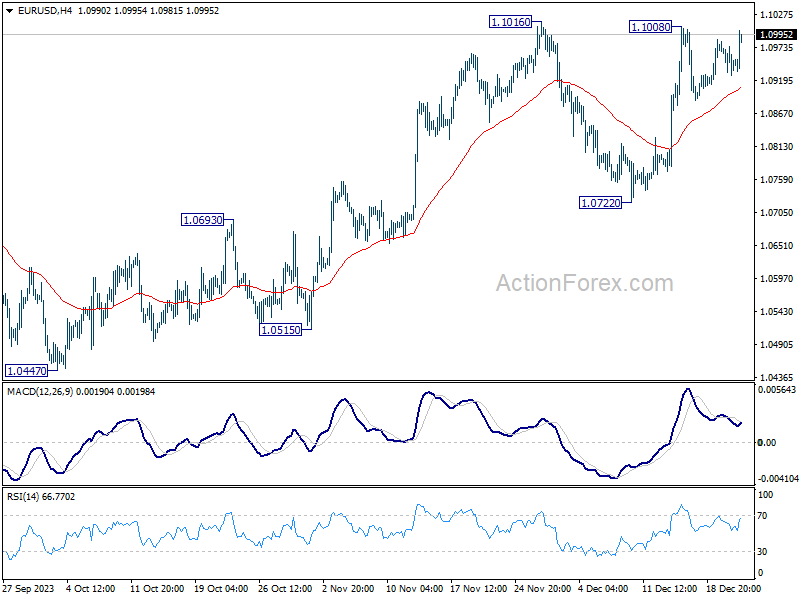
In the bigger picture, price actions from 1.1274 are viewed as a corrective pattern to rise from 0.9534 (2022 low). Rise from 1.0447 is seen as the second leg. While further rally could cannot be ruled out, upside should be limited by 1.1274 to bring the third leg of the pattern. Meanwhile, sustained break of 1.0722 support will argue that the third leg has already started for 1.0447 and below.