Sample Category Title
GBP/USD Mid-Day Outlook
Daily Pivots: (S1) 1.2596; (P) 1.2667; (R1) 1.2710; More...
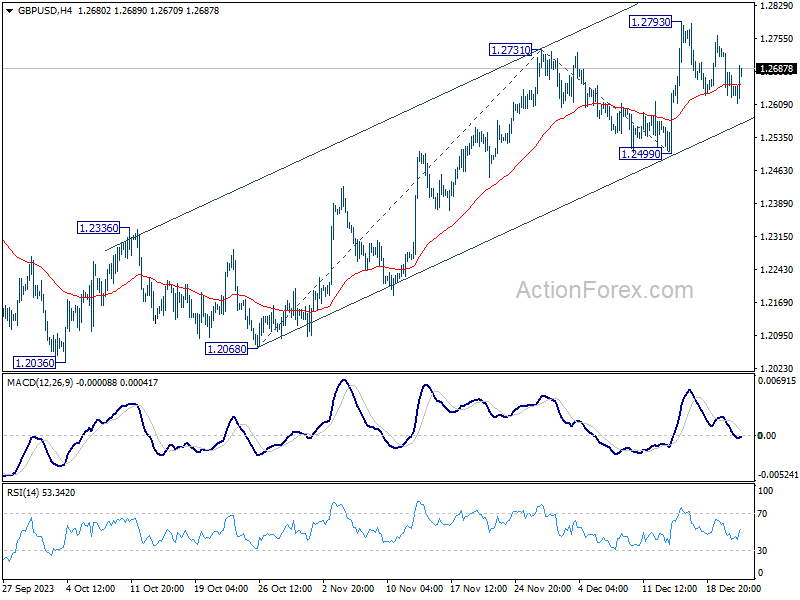
GBP/USD recovers today but stays in consolidation from 1.2793. Intraday bias remains neutral for the moment. While sideway trading could extend, further rally is still expected as long as 1.2499 support holds. . On the upside, firm break of 1.2793 will resume the rally from 1.2036. Next target is 61.8% projection of 1.2068 to 1.2731 from 1.2499 at 1.2909.
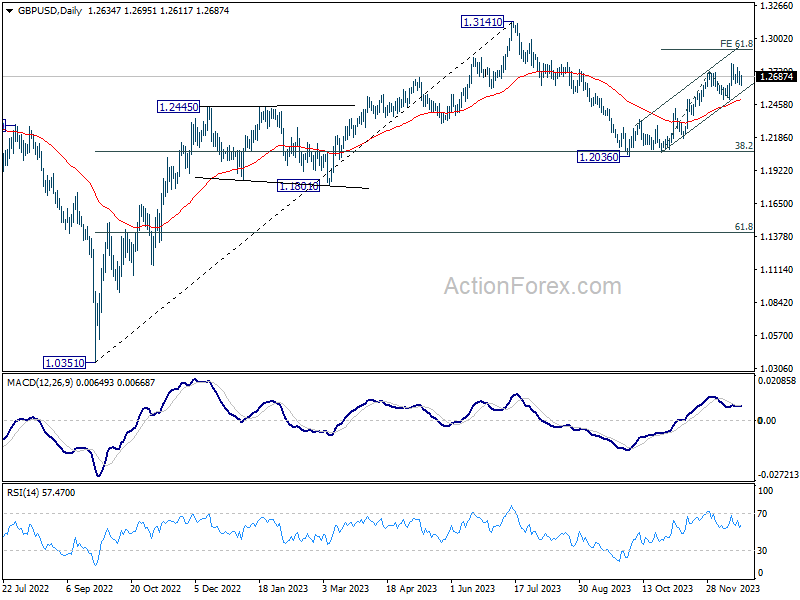
In the bigger picture, price actions from 1.3141 medium term top are seen as a corrective pattern to rise from 1.0351 (2022 low). Rise from 1.2036 is seen as the second leg that's in progress. Upside should be limited by 1.3141 to bring the third leg of the pattern. Meanwhile, break of 1.2499 support will argue that the third leg has already started for 38.2% retracement of 1.0351 (2022 low) to 1.3141 at 1.2075 again.
USD/CHF Mid-Day Outlook
Daily Pivots: (S1) 0.8599; (P) 0.8625; (R1) 0.8654; More....
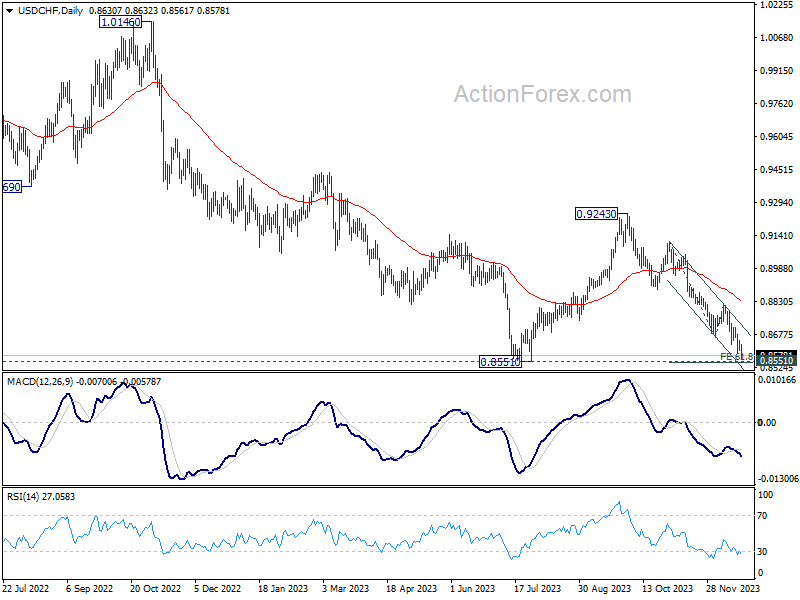
Intraday bias in USD/CHF stays on the downside for 0.8551 support. Strong support could be seen there to bring rebound. Break of 0.8650 minor resistance will indicate short term bottoming, and turn bias back to the upside for 0.8819 resistance. However, sustained break of 0.8551 could trigger downside acceleration to 100% projection of 0.9111 to 0.8665 from 0.8819 at 0.8373.
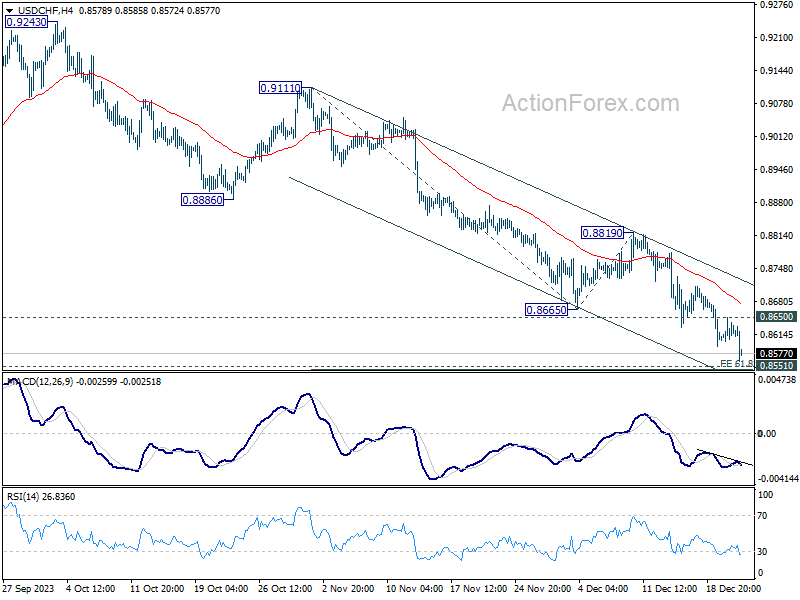
In the bigger picture, price actions from 0.8551 are currently seen as a corrective pattern to the decline from 1.0146 (2022 high). Fall from 0.9243 is seen as the second leg for now. Strong support should be seen 0.8551 to bring rebound. Meanwhile, break of 0.8819 resistance will argue that the third leg has started already, and target 0.9243. However, firm break of 0.8551 will confirm resumption of larger down trend from 1.0146 instead.
USD/JPY Mid-Day Outlook
Daily Pivots: (S1) 143.18; (P) 143.64; (R1) 144.02; More...
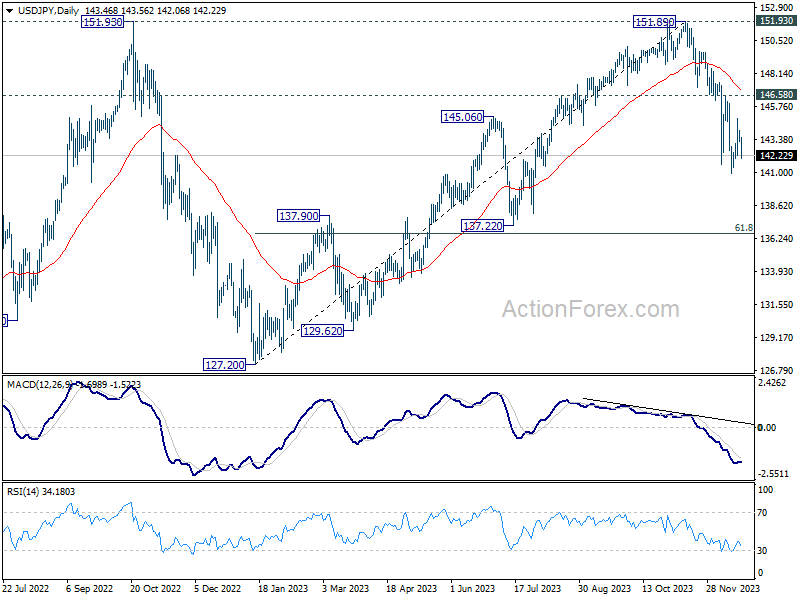
USD/JPY's fall from 144.94 extends lower today but it's staying above 140.94 support so far. Intraday bias remains neutral and more range trading could still be seen. But outlook will stay bearish as long as 146.58 resistance holds. Firm break of 140.94 will resume the whole fall from 151.89. Next target will be next fibonacci level at 136.63.
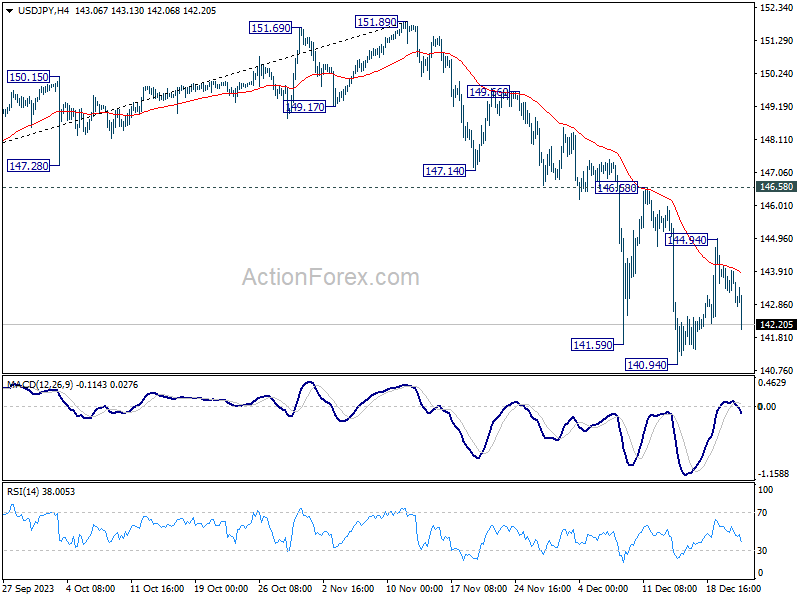
In the bigger picture, fall from 151.89 is seen as the third leg of the corrective pattern from 151.93 (2022 high). Deeper decline would be seen to 61.8% retracement of 127.20 to 151.89 at 136.63, sustained break there will pave the way to 127.20 support (2022 low). This will now remain the favored as long as 146.58 resistance holds.
Dollar Down after Lackluster Economic Data, Yen Extending Rebound
As US session gets underway, Dollar is declining broadly, influenced by a series of lackluster economic reports. US GDP growth for Q3 was revised downward to annualized rate of 4.9% in the final estimate. Additionally, Philadelphia Fed business outlook survey for December showed a drop from -5.9 to -10.5, signaling deeper contraction in regional manufacturing activity. However, the labor market showed some resilience, with jobless claims maintaining relatively stable level at 205,000, a positive sign amidst other economic headwinds.
Despite the negative economic indicators, US stock futures are pointing towards a higher opening, suggesting a potential rebound in the equity markets. Nevertheless, with the year-end holiday period approaching, there is uncertainty about whether this sell-off in Dollar and the uplift in stocks can be sustained over a longer period.
In other parts of the currency market, Japanese Yen is emerging as the strongest performer for the day, followed by Australian Dollar and Swiss Franc. Canadian Dollar and Sterling are positioned as the second and third weakest currencies, respectively, trailing Dollar. Euro is showing a mixed performance, positioned in the middle of currency chart.
In Europe, at the time of writing, FTSE is down -0.38%. DAX is down -0.31%. CAC is down -0.36%. Germany 10-year yield is down -0.024 at 1.949. UK 10-year yield is down -0.004 at 3.521. Earlier in Asia, Nikkei fell -1.59%. Hong Kong HSI rose 0.04%. China Shanghai SSE rose 0.57%. Singapore Strait Times rose 0.14%. Japan 10-year JGB yield rose 0.0289 to 0.592.
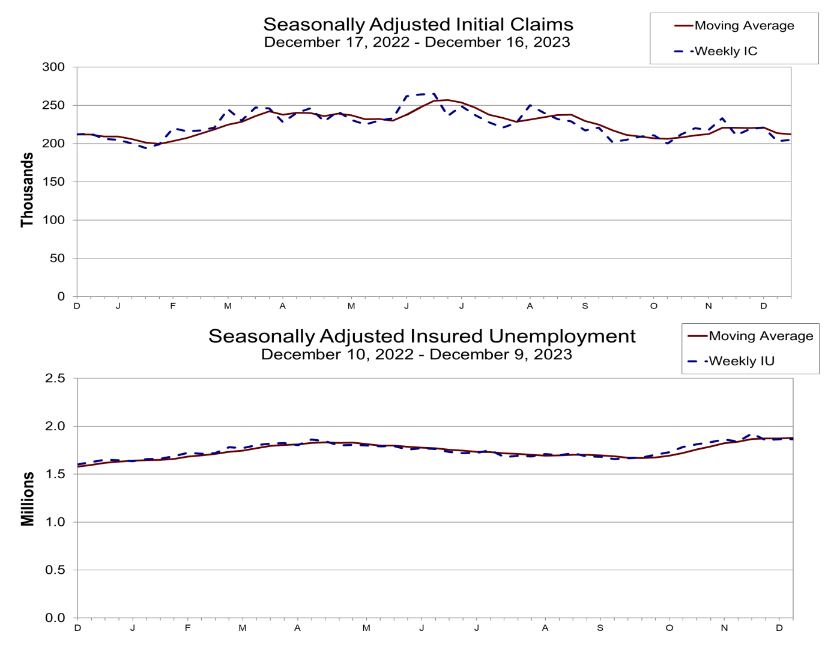
US initial jobless claims rises to 205k, below exp 220k
US initial jobless claims rises 2k to 205k in the week ending December 16, below expectation of 220k. Four-week moving average of initial claims fell -1.5k to 212k.
Continuing claims fell -1k to 1865k in the week ending December 9. Four-week moving average of continuing claims rose 6k to 1878k, highest since December 11, 2021.
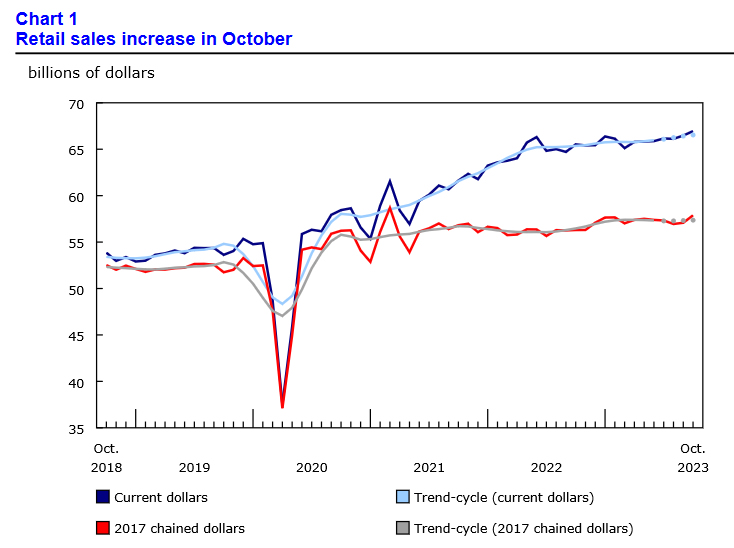
Canada's retail sales rises 0.7% mom in Oct, led by motor vehicle and parts
Canada's retail sales rose 0.7% mom to CAD 66.9B in October, below expectation of 0.8% mom. Core retail sales—which exclude gasoline stations and fuel rose 1.2% mom.
Sales were up in seven of nine subsectors and were led by increases at motor vehicle and parts dealers (+1.1%).
Advance estimates suggest that sales were relatively unchanged in November.
ECB's de Guindos: Premature for rate cut discussions, emphasizes Europe's growth challenge
In an interview with 20 Minutos, ECB Vice President Luis de Guindos emphasized that it is "too early" to discuss rate cuts, despite recent favorable data. He stressed that the data available are still insufficient for ECB to alter its current monetary policy stance for now.
De Guindos highlighted ECB's data-dependent approach: "We are data-dependent. The data have been favorable but still not enough for us to change our monetary policy."
He also expressed confidence in the current interest rate levels, stating, "If sustained for a sufficiently long period of time, current interest rates will help bring inflation down to 2%."
Addressing the prospect of a recession, de Guindos noted that ECB does not anticipate a technical recession, defined as two consecutive quarters of negative growth. However, he acknowledged a broader structural growth issue within Europe's economy. ECB's projections, along with those of European Commission, foresee only modest growth of around 1% until 2026.
De Guindos identified low productivity and the energy crisis as key challenges hindering Europe's economic competitiveness, particularly given Europe's reliance on energy imports. He argued for the necessity of structural reforms to address these issues.
While ECB's focus remains on reducing inflation, de Guindos emphasized that achieving growth requires a broader set of solutions: "Structural reforms are therefore necessary. The aim of monetary policy is to reduce inflation, but to achieve growth, other factors must be brought into play."
USD/JPY Mid-Day Outlook
Daily Pivots: (S1) 143.18; (P) 143.64; (R1) 144.02; More...
USD/JPY's fall from 144.94 extends lower today but it's staying above 140.94 support so far. Intraday bias remains neutral and more range trading could still be seen. But outlook will stay bearish as long as 146.58 resistance holds. Firm break of 140.94 will resume the whole fall from 151.89. Next target will be next fibonacci level at 136.63.
In the bigger picture, fall from 151.89 is seen as the third leg of the corrective pattern from 151.93 (2022 high). Deeper decline would be seen to 61.8% retracement of 127.20 to 151.89 at 136.63, sustained break there will pave the way to 127.20 support (2022 low). This will now remain the favored as long as 146.58 resistance holds.
Economic Indicators Update
| GMT | Ccy | Events | Actual | Forecast | Previous | Revised |
|---|---|---|---|---|---|---|
| 07:00 | GBP | Public Sector Net Borrowing (GBP) Nov | 13.4B | 13.2B | 14.0B | |
| 13:30 | CAD | Retail Sales M/M Oct | 0.70% | 0.80% | 0.60% | |
| 13:30 | CAD | Retail Sales ex Autos M/M Oct | 0.60% | 0.50% | 0.20% | |
| 13:30 | USD | Initial Jobless Claims (Dec 15) | 205K | 220K | 202K | 203K |
| 13:30 | USD | GDP Annualized Q3 | 4.90% | 5.20% | 5.20% | |
| 13:30 | USD | GDP Price Index Q3 | 3.60% | 3.60% | 3.60% | |
| 13:30 | USD | Philadelphia Fed Manufacturing Survey Dec | -10.5 | -3 | -5.9 | |
| 15:30 | USD | Natural Gas Storage | -82B | -55B |
US initial jobless claims rises to 205k, below exp 220k
US initial jobless claims rises 2k to 205k in the week ending December 16, below expectation of 220k. Four-week moving average of initial claims fell -1.5k to 212k.
Continuing claims fell -1k to 1865k in the week ending December 9. Four-week moving average of continuing claims rose 6k to 1878k, highest since December 11, 2021.
Canada’s retail sales rises 0.7% mom in Oct, led by motor vehicle and parts
Canada's retail sales rose 0.7% mom to CAD 66.9B in October, below expectation of 0.8% mom. Core retail sales—which exclude gasoline stations and fuel rose 1.2% mom.
Sales were up in seven of nine subsectors and were led by increases at motor vehicle and parts dealers (+1.1%).
Advance estimates suggest that sales were relatively unchanged in November.
BTC/USD: News Reports Encourage Bulls to Attack the $44k Level
Optimism associated with the SEC regulator's approval of applications to launch BTC-ETF is the main driver of Bitcoin price growth.
Coindesk reports that representatives from BlackRock, Nasdaq and the Securities and Exchange Commission (SEC) met for the second time in a month to discuss rule changes required for the listing of an exchange-traded BTC-ETF.
And companies like Bitwise and Hashdex have already launched advertising campaigns to attract attention to the BTC-ETF — apparently demonstrating confidence that applications will be approved.
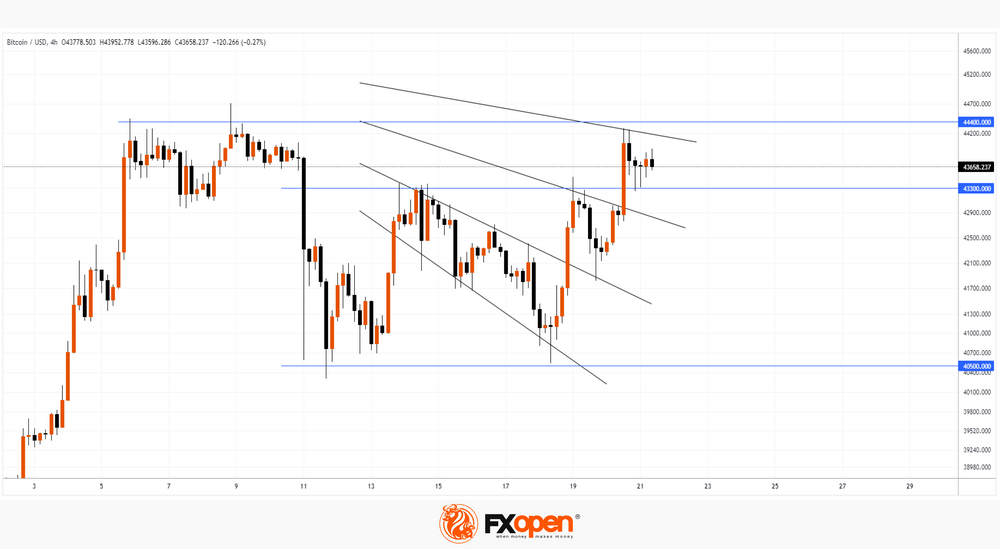
The graph shows that:
→ the price of BTC/USD has recovered after a strong fall on December 11 - this is a sign of the strength of demand in the market. The level of 40,500 served as a reliable support for the recovery, which was tested on November 18th.
→ On December 20, the bulls were able to overcome the level of 43,300, which provided resistance on December 13-14 and 19. This level is now showing signs of support.
→ There is an important obstacle in front of the bulls. It is formed from the $44k level and the upper black line, forming some structure similar to a Gann fan and having a noticeable impact on the price of Bitcoin this month.
The media is increasingly citing January 10 as a possible date by which the SEC's decision, believed to approve the launch of the ETF, will be published. It is possible that as we approach this date, the bulls will be able to overcome the $44k resistance.
This article represents the opinion of the Companies operating under the FXOpen brand only. It is not to be construed as an offer, solicitation, or recommendation with respect to products and services provided by the Companies operating under the FXOpen brand, nor is it to be considered financial advice.
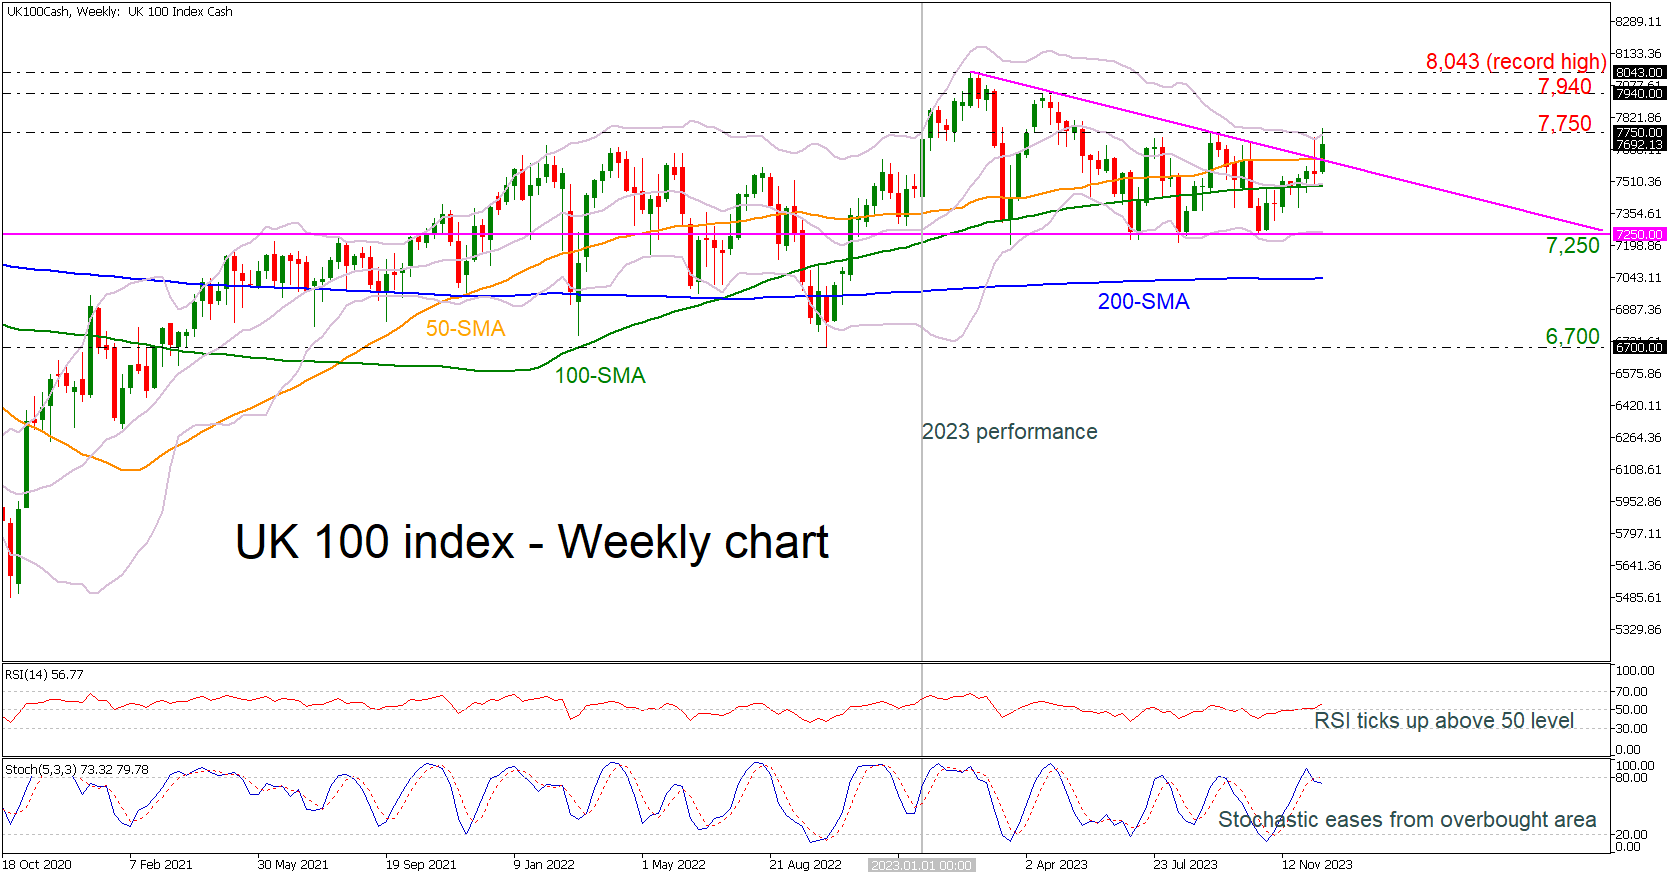
UK 100 Index Sticks in Descending Triangle in 2023
- UK 100 meets upper Bollinger band
- Price encounters upside pressure above triangle formation
The UK 100 index a few weeks after the beginning of 2023 started a descending triangle formation with the top at 8,043 and a strong support level of 7,250. Currently, the price is standing above the falling trend line, after testing the upper Bollinger band and the 7,750 resistance.
According to the technical oscillators, the RSI is pointing slightly upwards in the positive territory; however, the stochastic posted a bearish crossover within its %K and %D lines in the overbought area, suggesting an overstretched market and a potential negative movement may be on cards during the start of 2024.
If the bullish pressures persist, the price could revisit its recent resistance of 7,750. Breaking above the tight range, the index might face the April peak of 7,940. A jump above that region could pave the way for the all-time high of 8,043.
Alternatively, should the bears attempt to push the price lower, initial declines could cease at the recent support of the mid-level of the Bollinger band and the 100-week simple moving average (SMA) at 7,490. Diving below that floor, the price may descend towards the significant 7,250 barricade, which coincides with the lower boundary of the triangle. Even lower, the 200-week SMA at 7,043 could provide downside protection.
In brief, the UK 100 index has been stuck within a range during 2023 but an upside movement soon could open the way for a bullish tendency in 2024.
USD/JPY Eyes Inflation, BoJ Minutes
- Japan’s core inflation expected to slow to 2.5%
- US GDP expected to confirm estimate of 5.2%
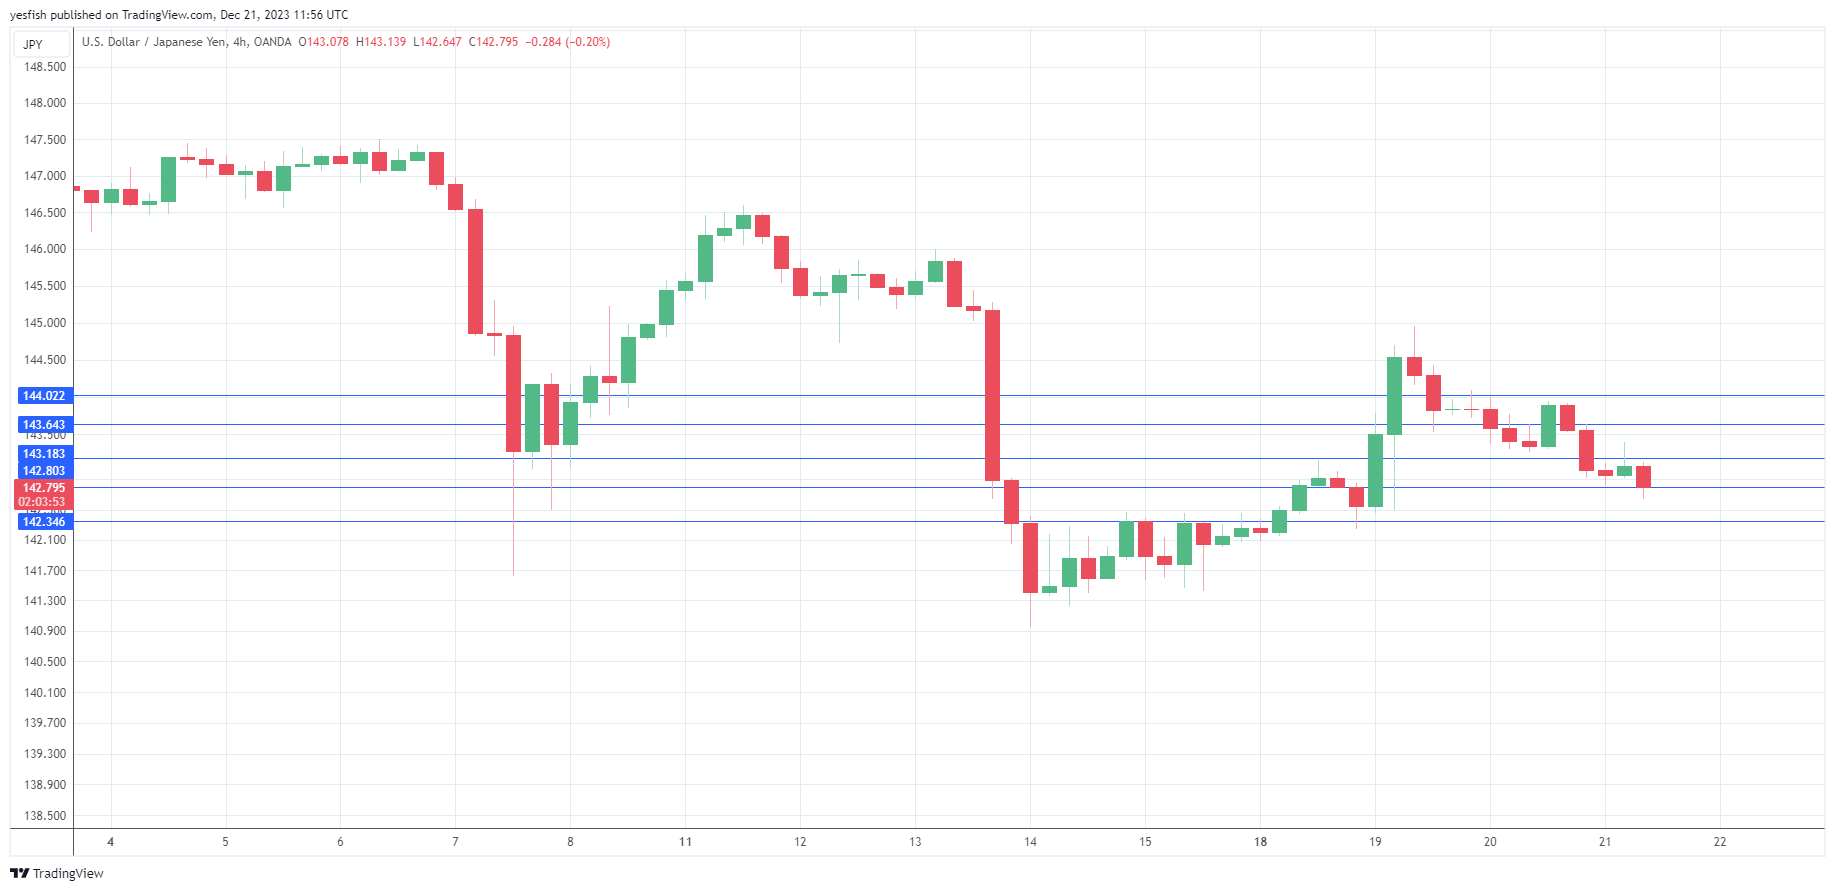
The Japanese yen is in positive territory on Thursday. In the European session, USD/JPY is trading at 142.85, down 0.61%. Later today, the US releases third-estimate GDP for the third quarter, which is expected to confirm that the economy grew at an impressive rate of 5.2% q/q.
Japanese core inflation expected to ease to 2.5%
Japan’s Core CPI, which excludes fresh food but includes energy, is considered the preferred inflation gauge for the Bank of Japan. The November report, which will be released on Friday, is expected to fall to 2.5% y/y, compared to 2.9% in October.
Core CPI has exceeded the BoJ’s 2% target for 19 straight months, putting pressure on the central bank to tighten policy. The BoJ has insisted that high inflation is a result of cost-push pressures and that higher wage growth is needed to ensure that inflation is sustainable. Still, a shift in policy from the BoJ is likely a question of when rather than if, with senior BoJ officials hinting that the central bank is considering tightening its ultra-loose policy.
Japan’s government expects inflation to remain well above the target and has revised upwards its inflation forecast to 2.5% for the fiscal year starting in April. The previous forecast stood at 1.9%. The government said that the upward revision was due to a weaker yen, higher oil prices and the expected reduction in subsidies for utility costs.
The Bank of Japan will release on Friday the minutes from the meeting on October 31. At the meeting, the BoJ maintained policy but removed the 1% upper ceiling on its yield control curve (YCC) program, saying 1% would remain a reference level. This tweak was enough to shake up the currency markets, as the yen plunged 1.78% against the US dollar on October 31, its sharpest daily gain since February. Investors will be looking through the minutes for further details about the decision to tweak YCC and any hints about future rate policy.
USD/JPY Technical
- USD/JPY has pushed below support at 143.18 and is testing support at 142.80. Below, there is support at 142.34
- There is resistance at 143.64 and 144.02
EURUSD Rangebound After Forming a Double Top
- EURUSD gets rejected a tad below its recent 4-month peak
- A failure to claim that level could validate a double top structure
- Momentum indicators lose steam but remain positive
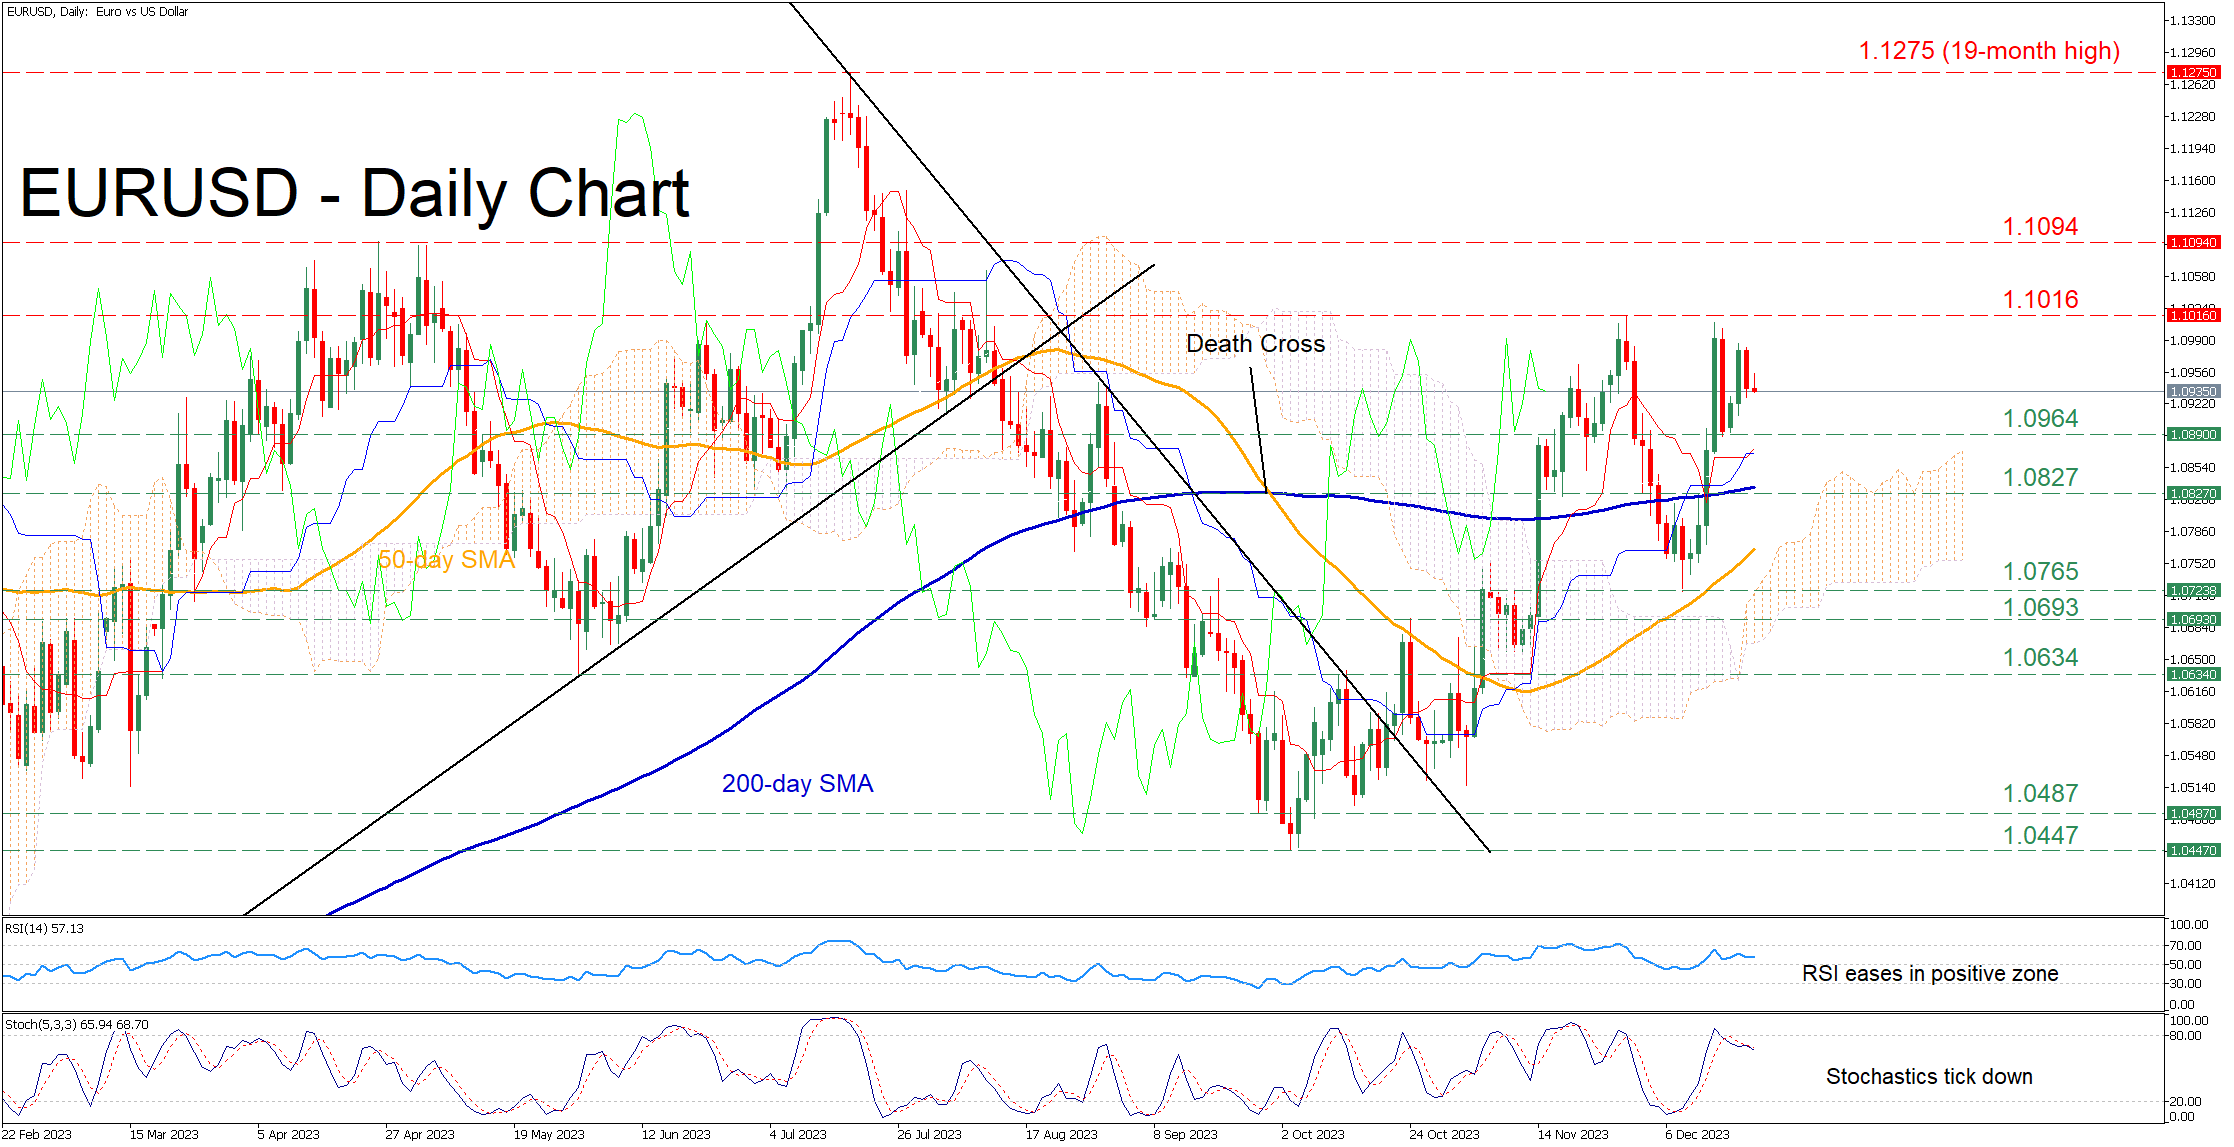
EURUSD experienced a solid correction from its recent four-month high of 1.1016, but the pair managed to erase most of it, following a decisive break above the 200-day simple moving average (SMA). However, the rebound faltered just shy of the latest peak, underscoring the case of a double top structure.
Considering that both the RSI and stochastics are showing signs of fading positive momentum, the price could reverse lower towards the recent support of 1.0964. Sliding below that zone, the pair may challenge the November support of 1.0827, which lies very close to the 200-day SMA. Further retreats could then stall at the December low of 1.0765.
On the flipside, should the pair advance higher, the first crucial target could be the four-month peak of 1.1016. Conquering this barricade, the bulls might attack the April-May resistance of 1.1094. A violation of that region could open the door for the 2023 high of 1.1275, which is also the highest level in 19 months.
In brief, EURUSD’s initial failure to post a fresh higher high after touching its previous four-month peak is increasing the odds of a double top pattern. Should that scenario materialize, it could be the beginning of a steep pullback.